1. Introduction
A common natural disaster that specifically affects steep areas and damages both the environment and human life is the landslide [
1,
2,
3]. In addition to being a significant factor in landscape change, landslides are a cascading geohazard that can considerably impact people’s lives and habitations everywhere [
4]. Landslide is the term that defines the downfall of soil or rock [
5]. Landslides’ socioeconomic effects have recently worsened due to unplanned development projects, climate change, and worldwide economic growth [
6,
7,
8]. A global report says that more than 3876 landslides happened from 1995 to 2014, by which nearly 163,658 human losses and 11,689 injuries were recorded [
9]. Another record says about 55,000 lives were lost worldwide due to landslides between the years from 2004 to 2016 [
10]. Due to their devastating nature and socioeconomic effects, risks related to landslides and associated phenomena have been well investigated. Susceptibility maps are the key component of hazardous damage assessment and mitigation plans in regions at high risk of landslides [
8,
11,
12]. At the regional or watershed scale, these methods are often used in landslide assessments and mitigation. It is beneficial to identify and designate landslide-prone places using geographic information system (GIS) technologies for the purpose of constructing a geographic database of landslide inventory. The landslide conditioning factor (LCF), or geographic attributes of landslide areas that may influence potential slope stability, can be assembled into a database using GIS data sources (e.g., slope, aspect, soil texture, drainage density, rainfall, lithological type and geomorphology, etc.). In an effort to predict the risk of landslides in the future, the LCF data may be used to anticipate the behaviors of additional slopes in the study location.
Decision-makers and local authorities utilize landslide susceptibility mapping (LSM) to segment the topographical region into zones with varying degrees of susceptibility. The management and reduction of risks related to present and potential future landslides depend on this procedure, often known as “landslide risk zoning”. Using a GIS application can improve spatial data handling and provide you with more processing power [
13]. Consequently, numerous quantitative methodologies and applications have been developed for LSM. Statistical models, heuristic-based models, physically based models, and, nowadays, machine learning (ML) modeling are the four main types of LSM approaches [
14,
15,
16,
17]. It has been established that each of these distinct approaches has advantages and restrictions of its own. Statistical models are suited to large areas with geotechnical parameters, but physically based models are ideal for small-scale areas with proper data availability for mapping and analysis. These models, widely used to forecast imminent slope failure, rely on a complete understanding of the landslide system obtained from surrounding surface and subsurface inspections and tracking systems. [
18]. Physically based models, on the other hand, need a lot of precise data to produce accurate results for extensive study (i.e., basin-scale up to county level), which comes at a high expense both financially and computationally. Therefore, broad area risk zonation exercises cannot yet be conducted using physical-based models; as a result, during the past 40 years, the subject of LSM has been dominated by statistical and knowledge-based models, both of which are influenced by a lack of data on the terrain and environmental variables [
6]. In opinion-driven models (e.g., the analytical hierarchy process (AHP)), the landslide conditioning elements are ranked and/or weighted depending on expert judgment and expertise after the model has been constructed with limited information. Since it might be challenging to evaluate or quantify a result objectively, this approach may be problematic. A variety of quantitative models have been devised and successfully utilized for modeling landslides in order to better understand landslide patterns and triggering processes. The developments in GIS over the past ten years have benefitted statistical models the most [
11]. The advancement in our understanding of landslide susceptibility since the inception of statistical predictive modeling has been startlingly quick. Throughout the preceding two decades, a range of landslide susceptibility models from various statistical approaches was utilized in the ML context to create exact risk zonation maps. Many authors have used these methods for landslide mappings, such as in the identification of forested landslides with DTM derivatives using data segmentation and support vector machine (SVM) [
19]; in the automatic detection of landslides with convolutional neural networks (CNN) and the identification of texture changes after and before a landslide using optical images [
20]; and in the evaluation of the performance of SVM, random forest (RF), ANN, and CNN [
16,
21,
22]. The benefit of ANN is its capacity to identify patterns with high variability through the use of hidden layers. Additionally, ANN’s excellent prediction rate and generalizability allow it to surpass established techniques such as SVM [
23].
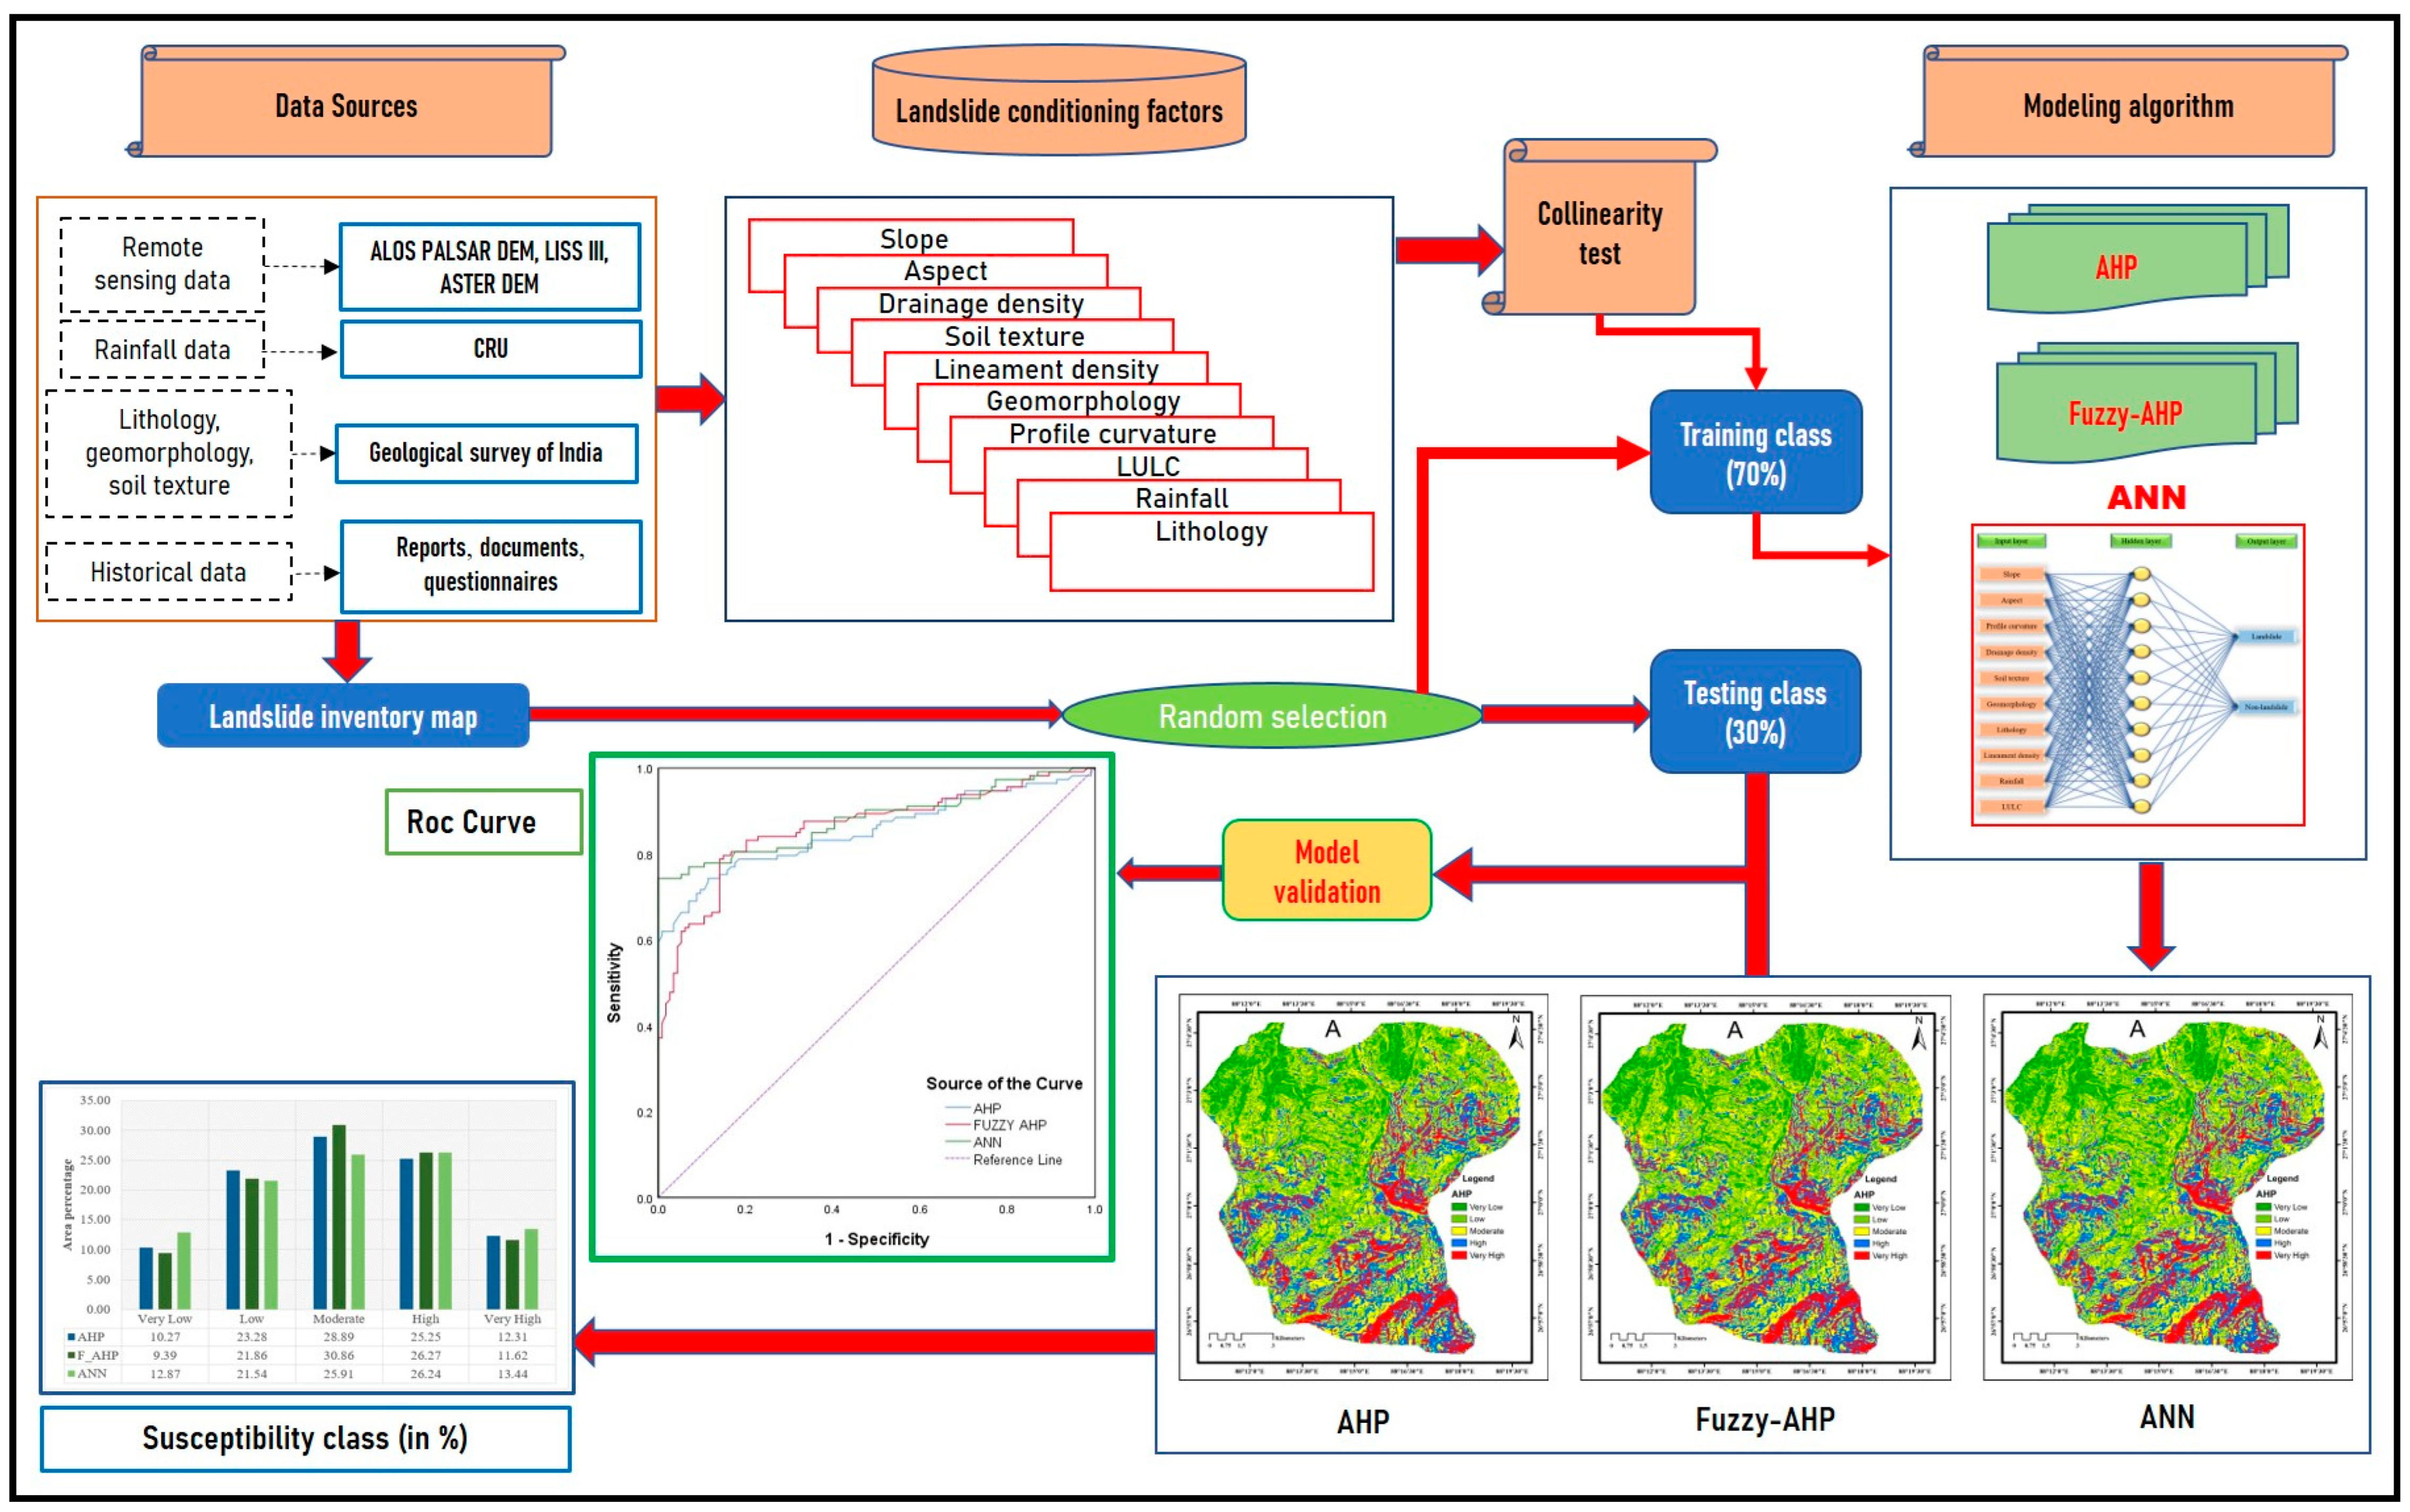
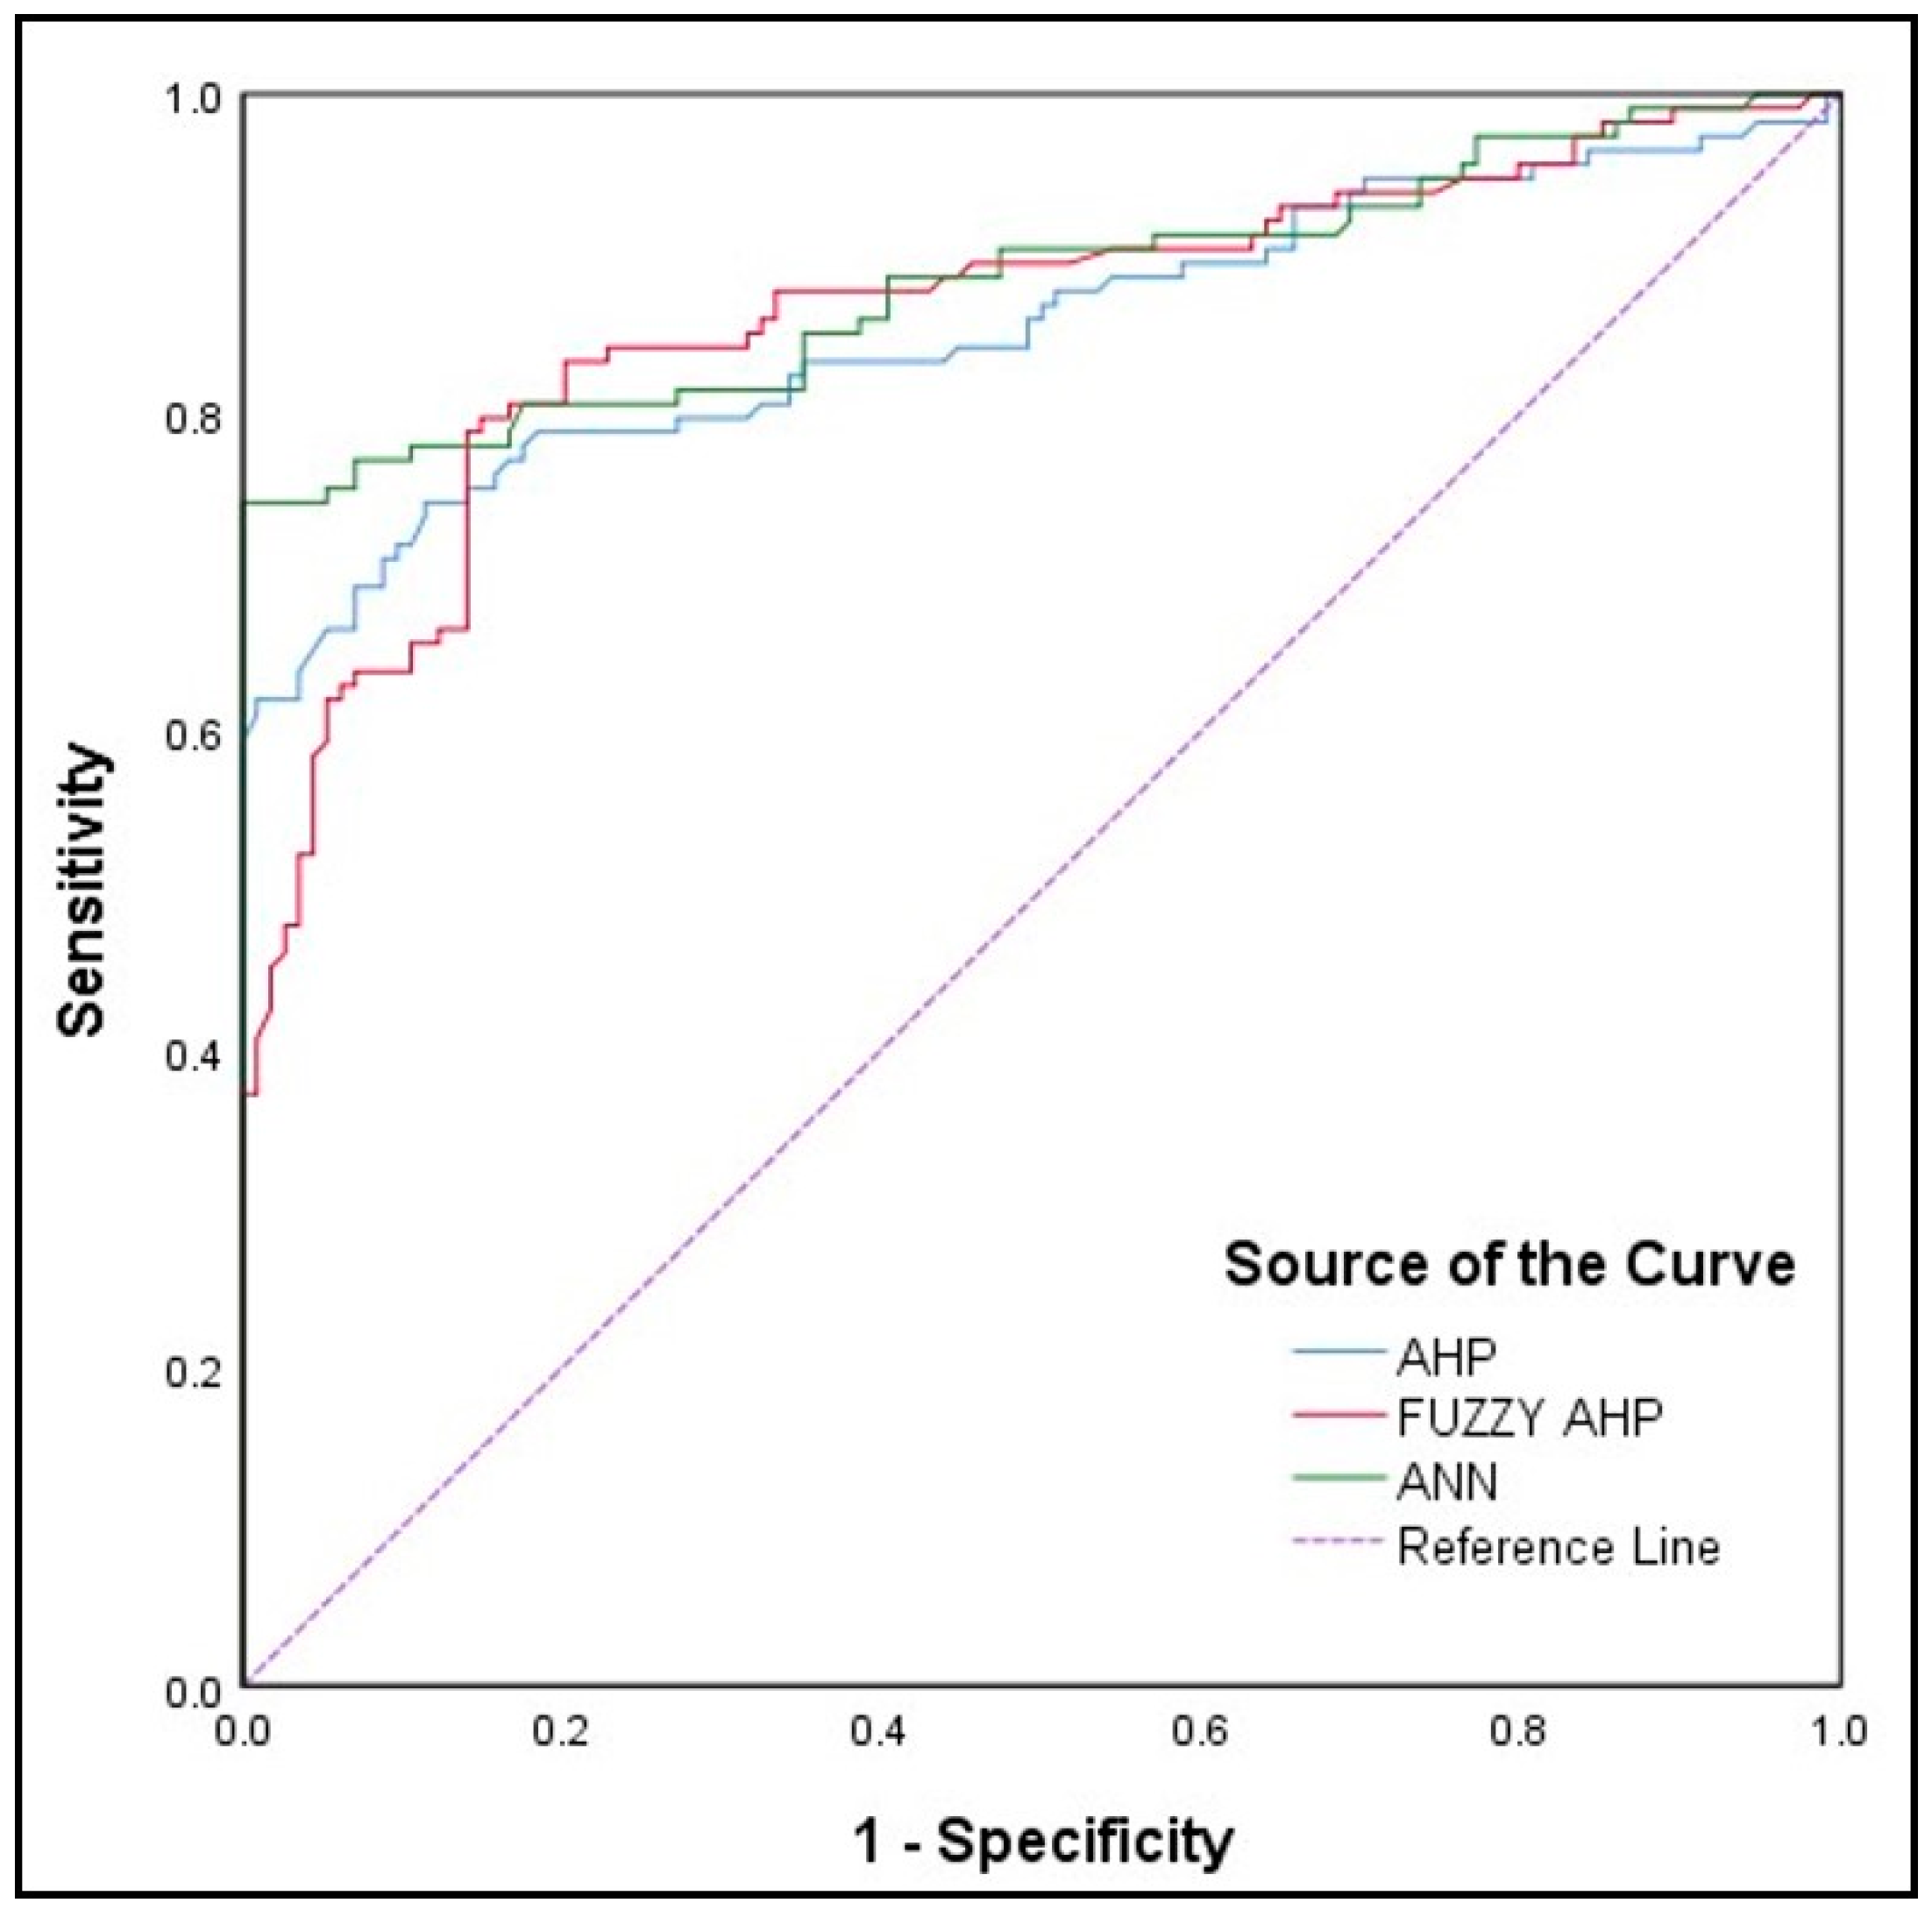
The project aims to create an ANN model for LSM and continually evaluate how well it performs against more traditional methods, such as AHP and fuzzy-AHP, to categorize subjects into various susceptibility groups. To assess the models, the receiver operating characteristic (ROC) is used. We think that local government decision-makers and site planners may use the results of our analysis to lower the danger of landslides in the region.
4. Discussion
Because they are more susceptible to natural hazards, planning and development in hilly and mountainous locations must be undertaken with the utmost care. The risk of landslides is one of these. Landslides are likely to happen under the same circumstances as they did in the recent past [
69]. In these places, landslide susceptibility assessments are essential because they give planners and decision-makers a first line of defense [
70]. Making an accurate LSM that can be used to pinpoint regions at risk for landslides is quite challenging [
71]. As a result, several strategies are being created on a regular basis all around the world to address these accuracy and dependability issues [
72]. New methods have been developed as a result of the unrelenting study of LSMs. In order to create an accurate model of landslide susceptibility, our work uses MCDA, fuzzy-based MCDA, and ML-based algorithms.
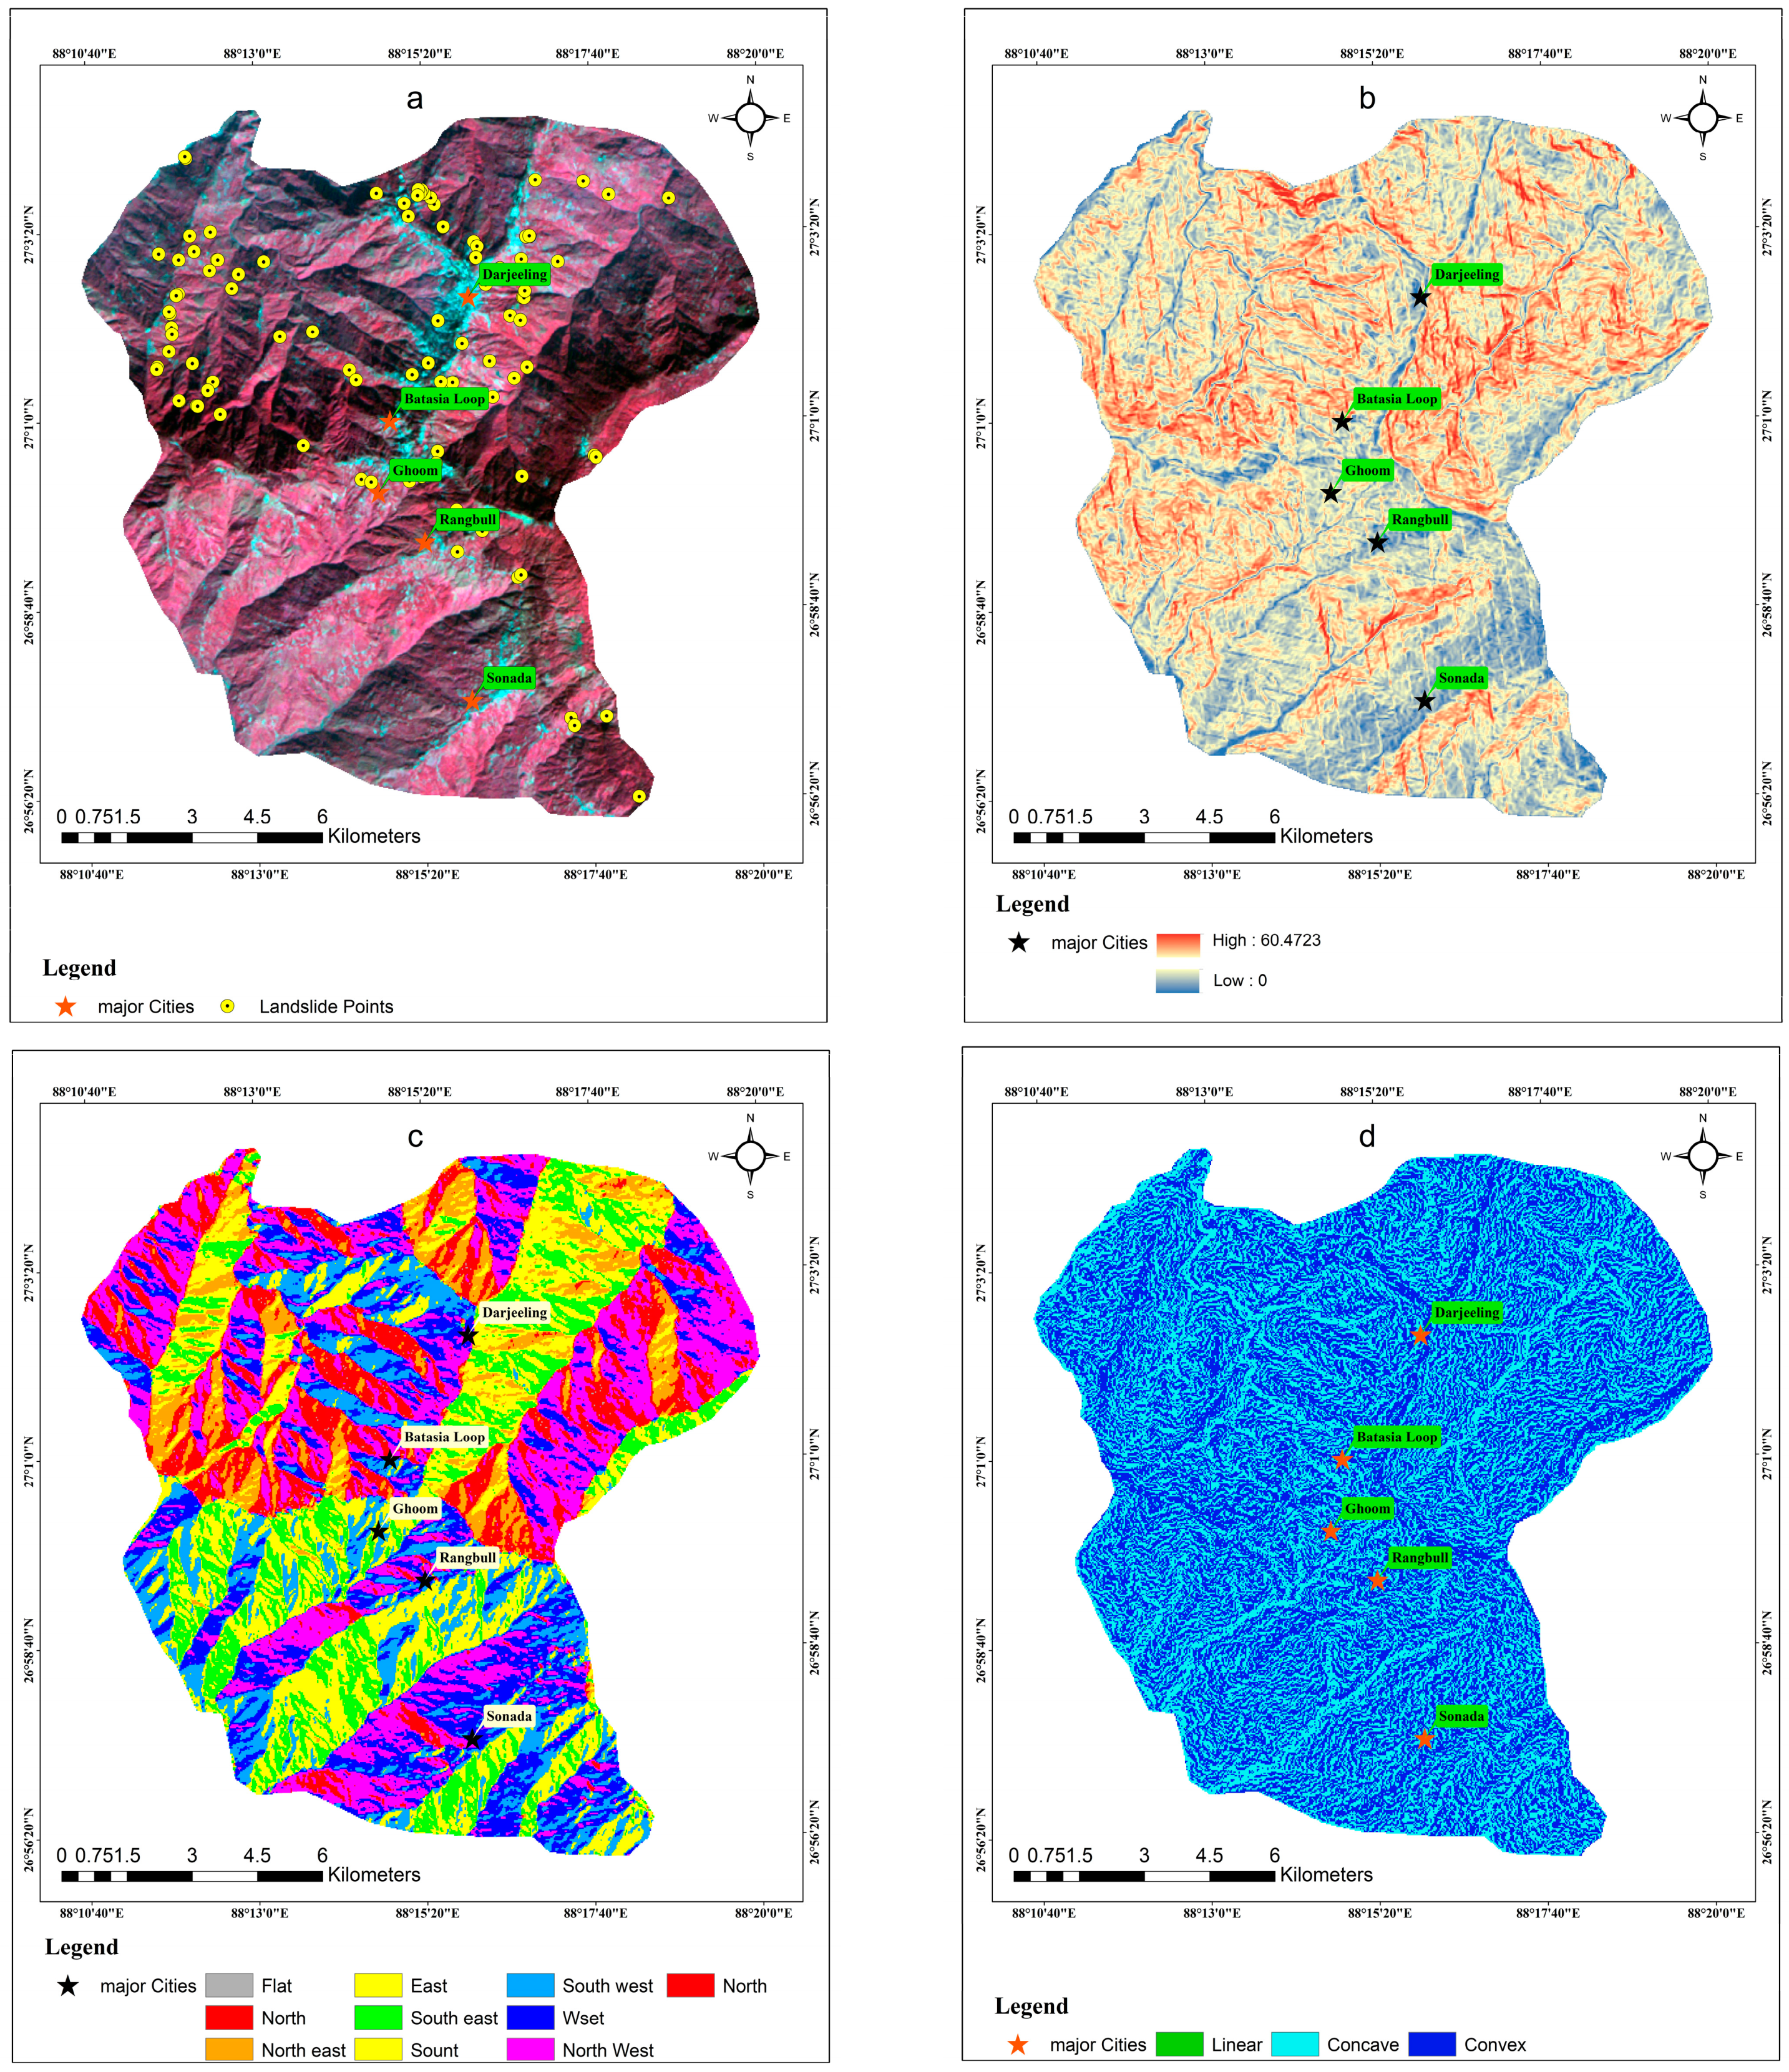
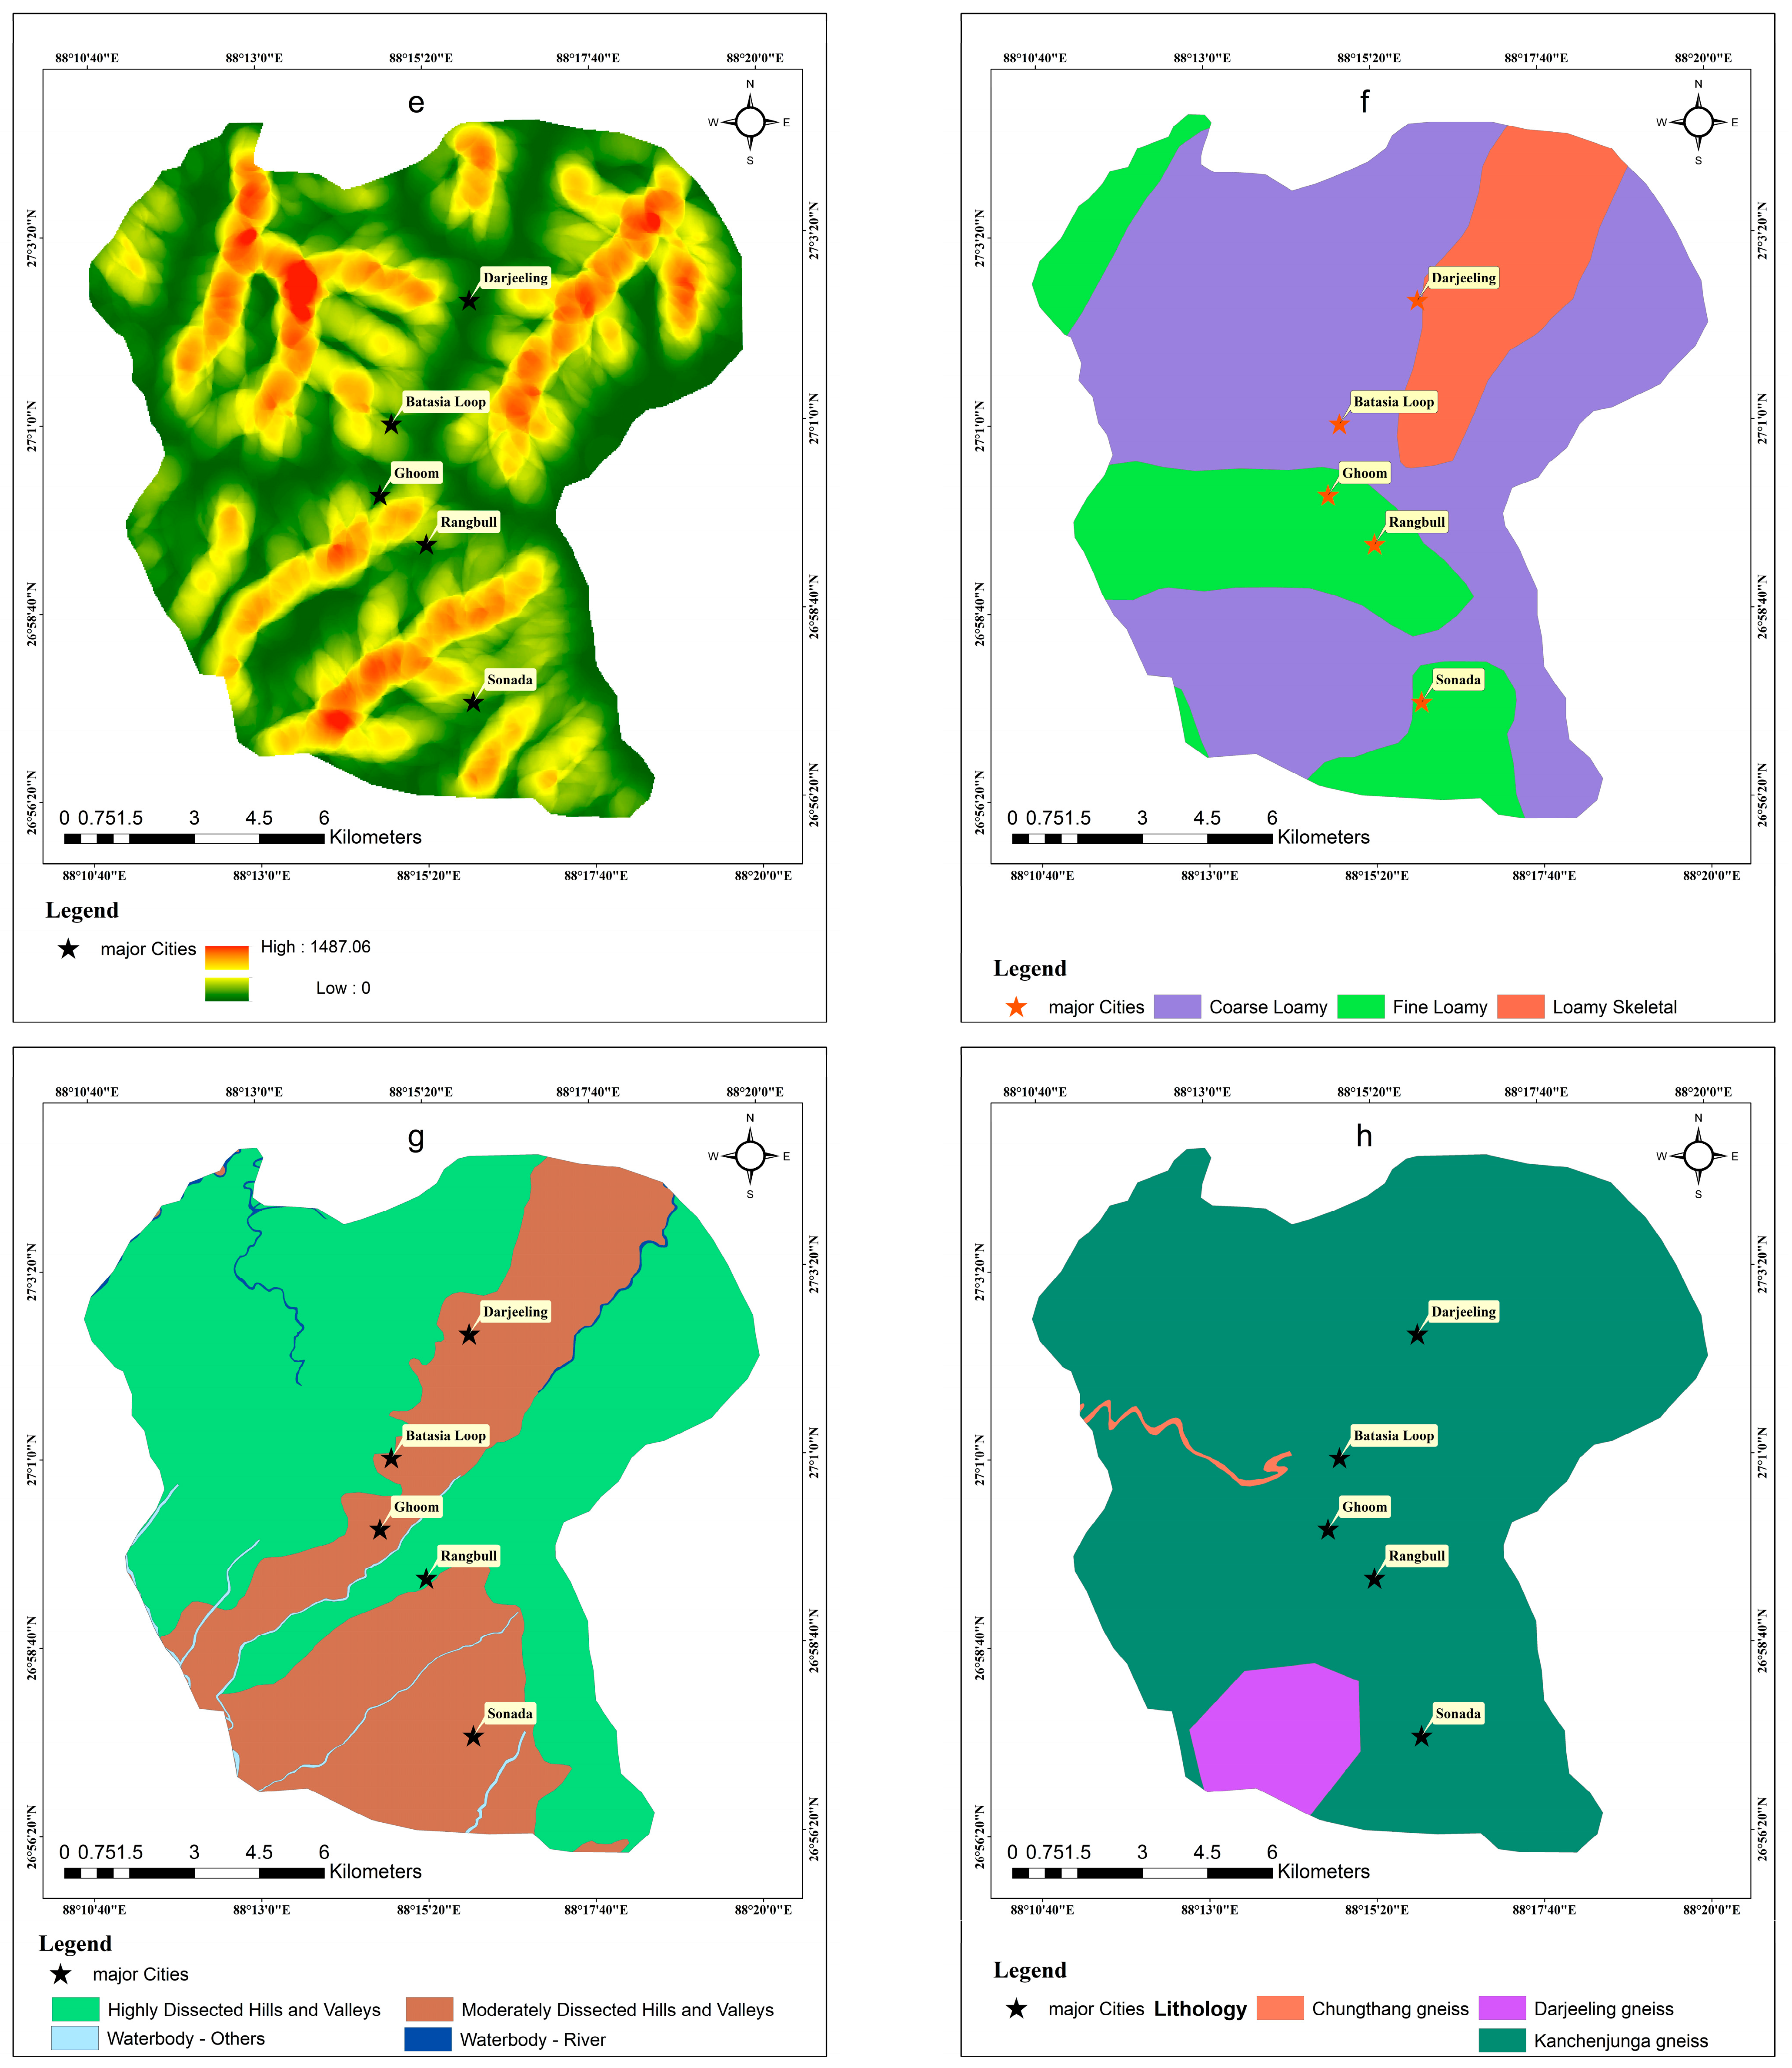
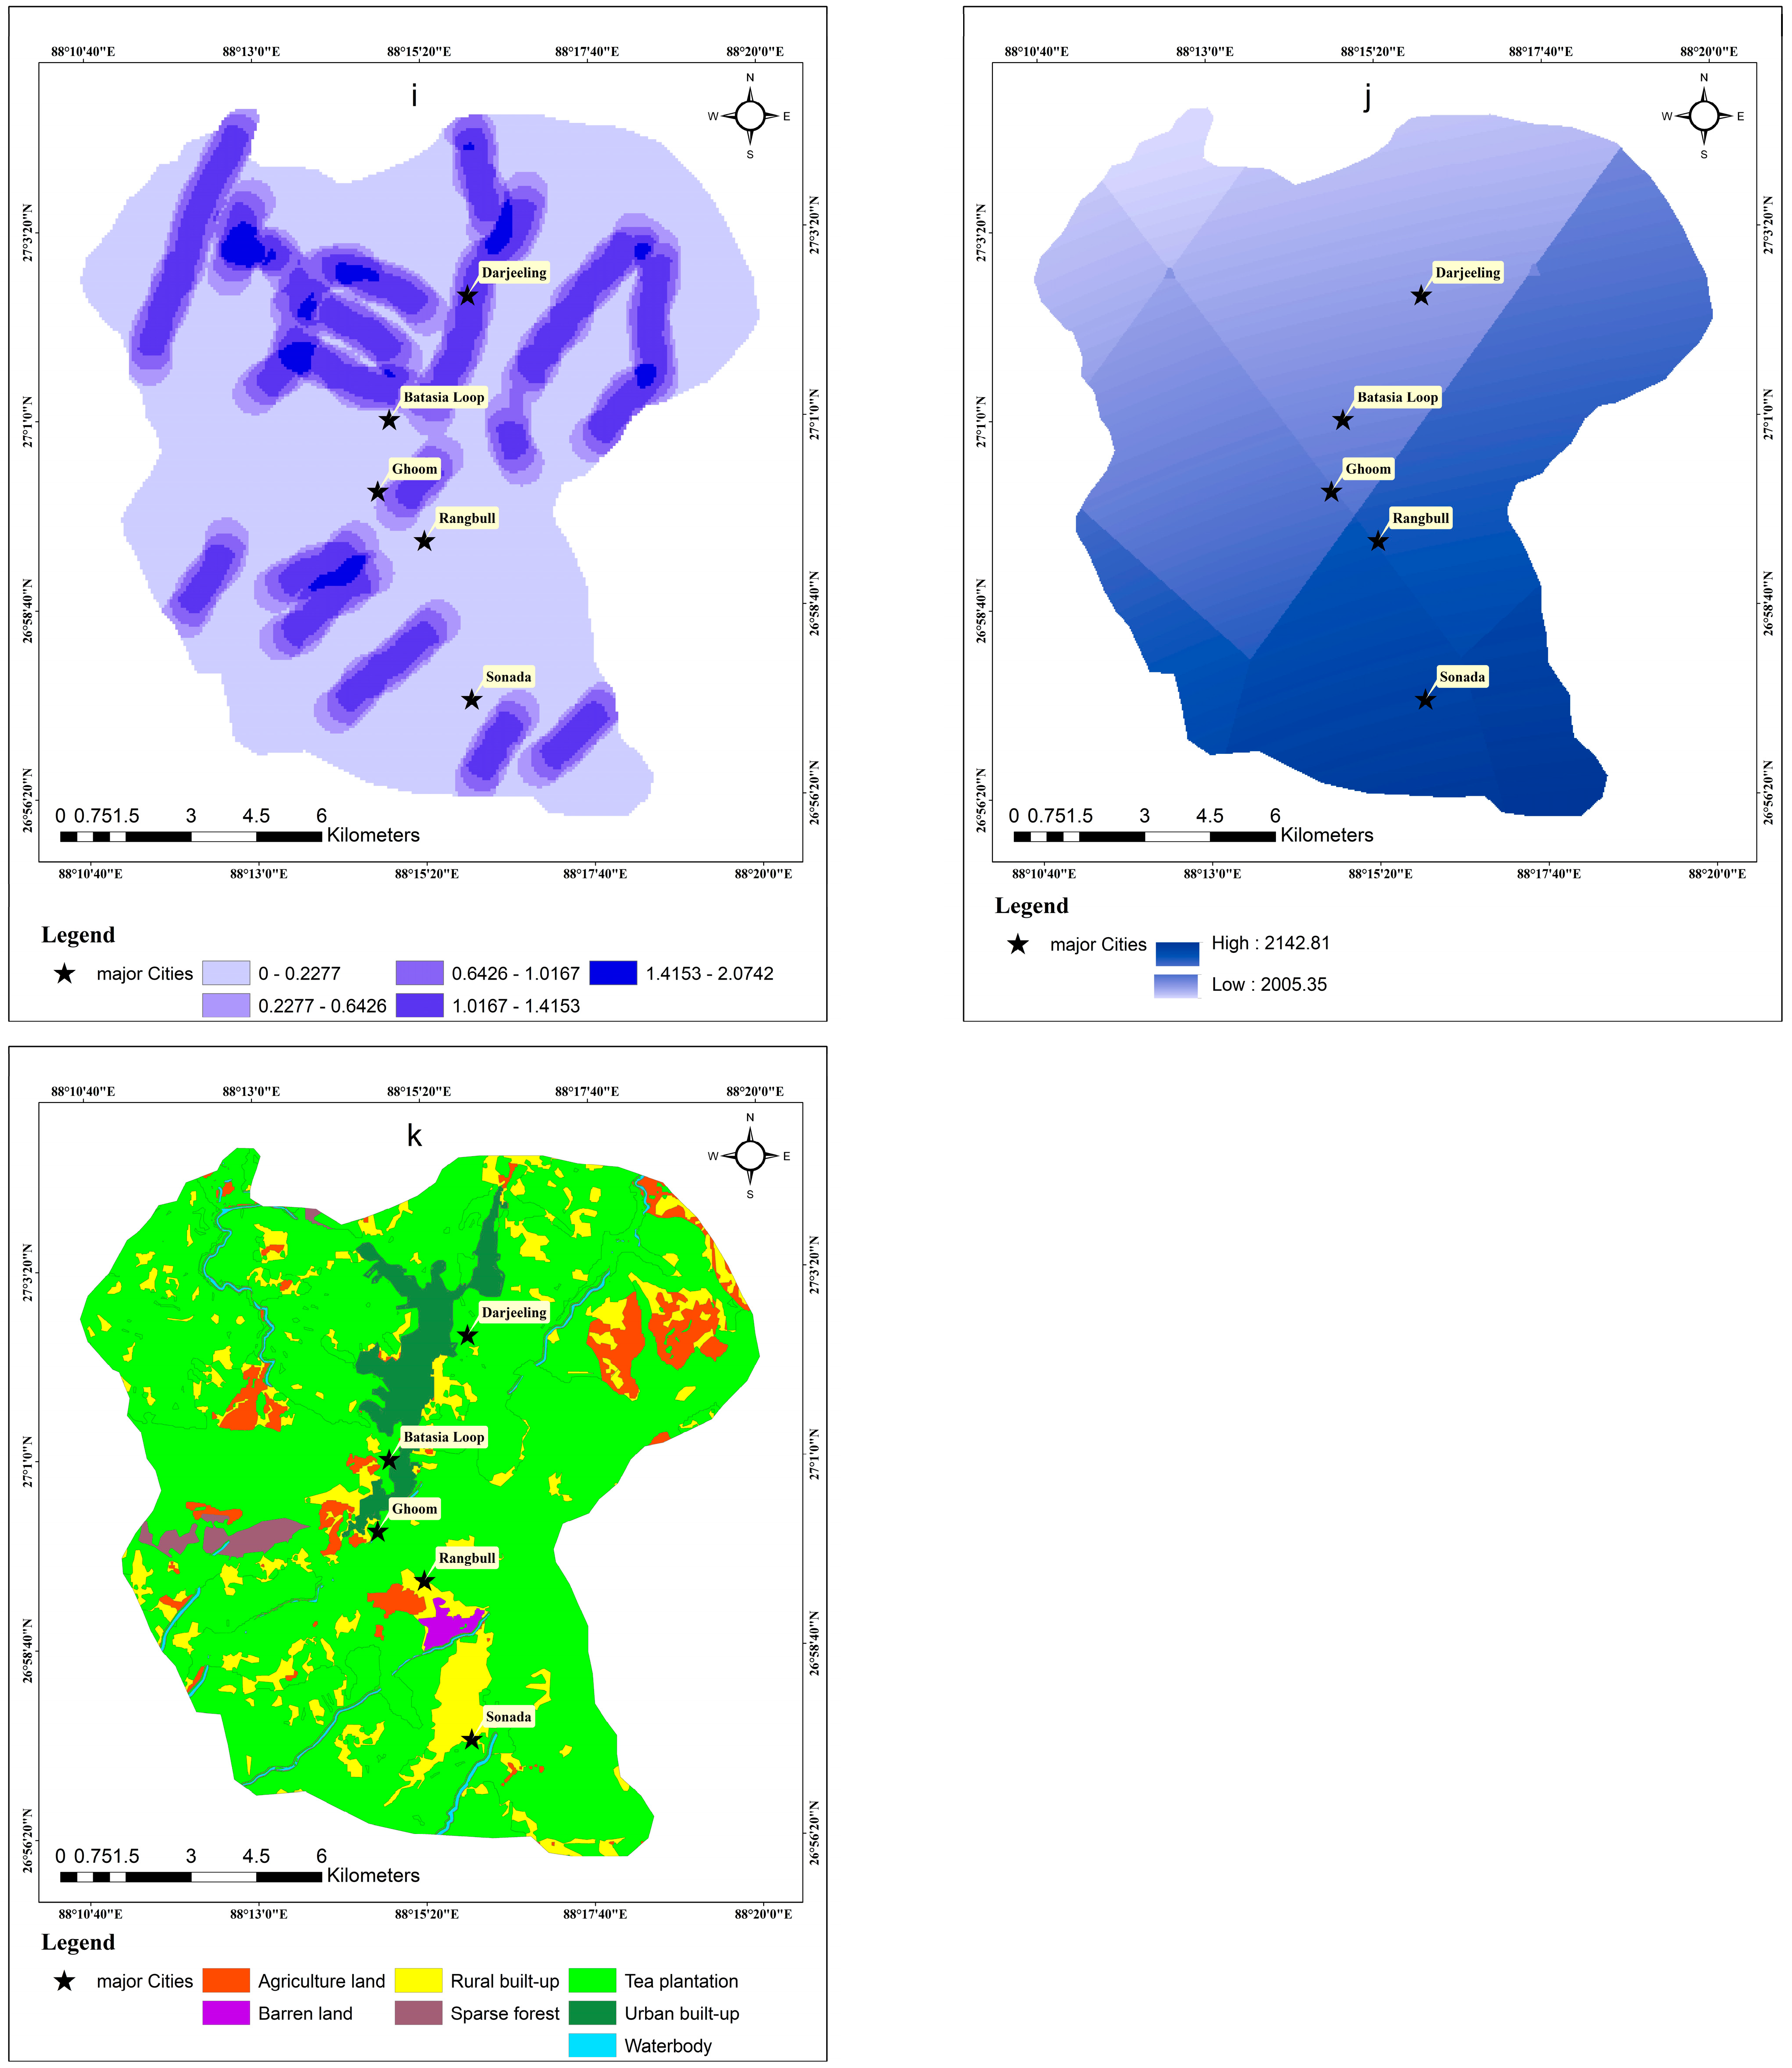
Several LCF interact with triggering variables and contribute to the beginning of landslides. In order to create a precise landslide susceptibility model, it is imperative to choose suitable LCFs. As a consequence, models with high predictive ability and minimal noise are created. There are several LCFs, and they differ according to the local peculiarities. These geological, climatic, and geomorphological elements that control landslides are connected to these landslide indicators. The convex slope dominates the area’s margin, the straight slope dominates the middle portion, and the concave slope dominates the lower portion. Based on the diversity of indicators and the features of the area, there are no guidelines for choosing LCFs [
73]. To choose the most suitable and stressful variables, much work has been put in. One of these initiatives is the multicollinearity test, which looks for connections between LCFs that could influence the correctness of the model as a whole. In the current study, ten LCFs were selected as independent criteria to evaluate the Hali catchment’s vulnerability to landslides. The multicollinearity of the LCFs was evaluated using the VIF. Our results demonstrate that the variables we selected do not exhibit multicollinearity. Therefore, all variables were incorporated into the models.
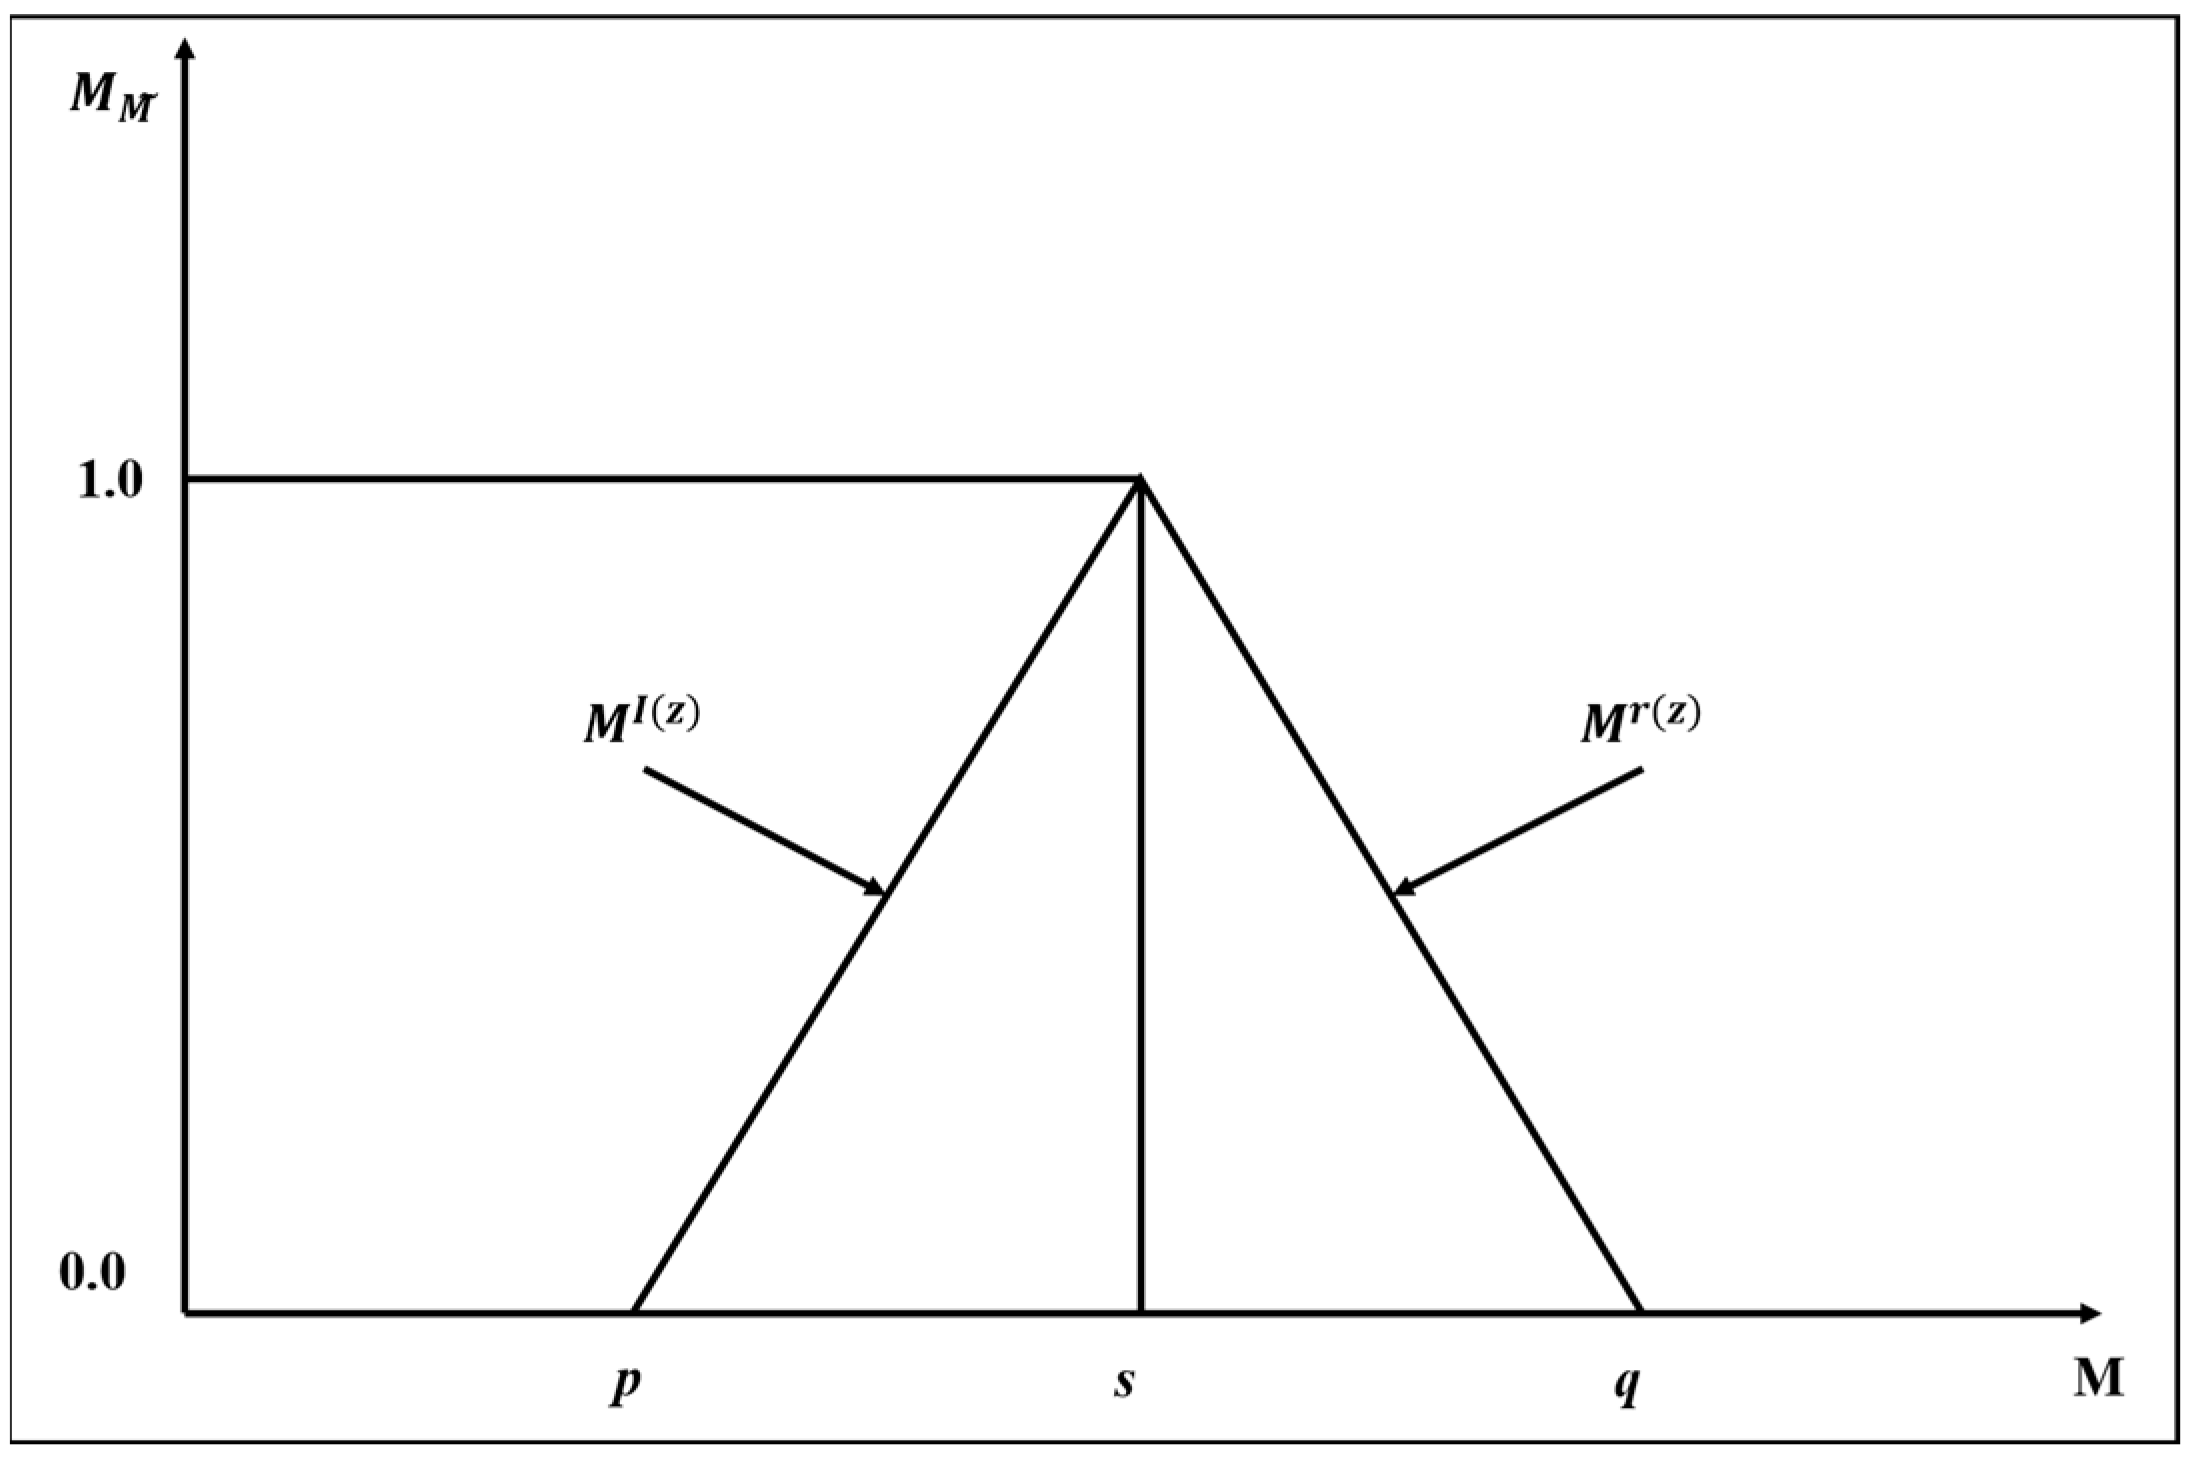
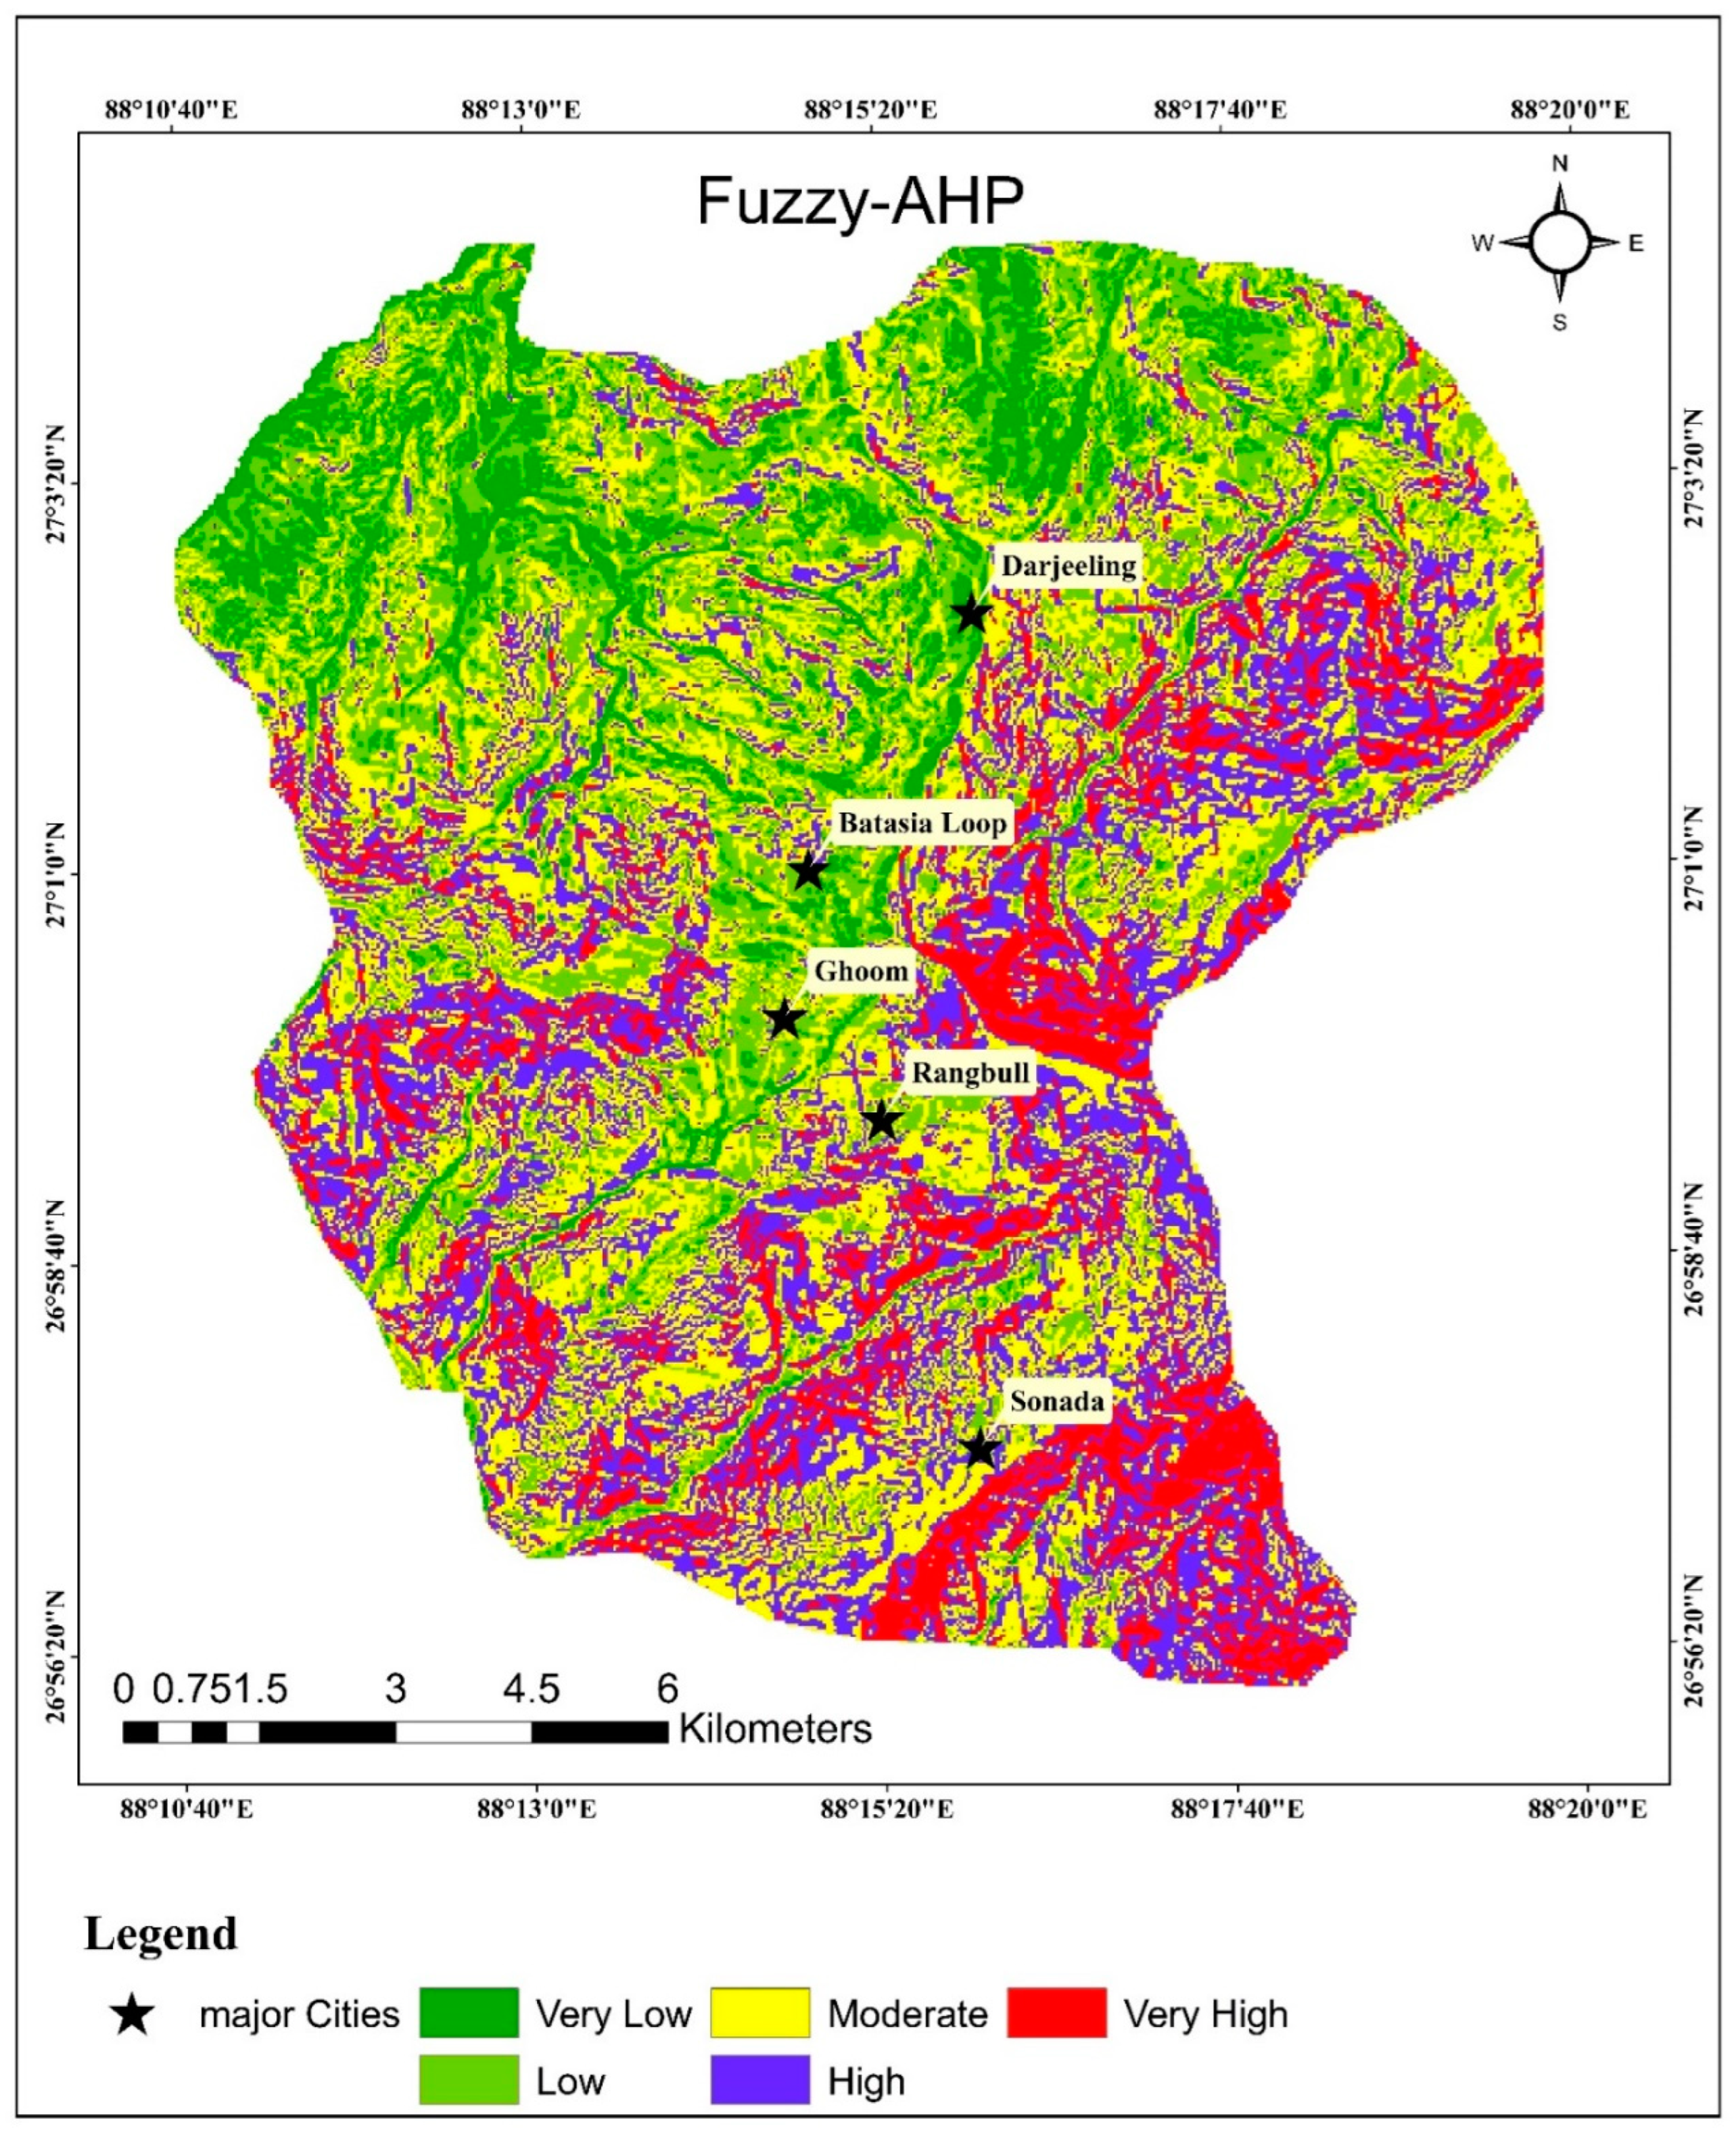
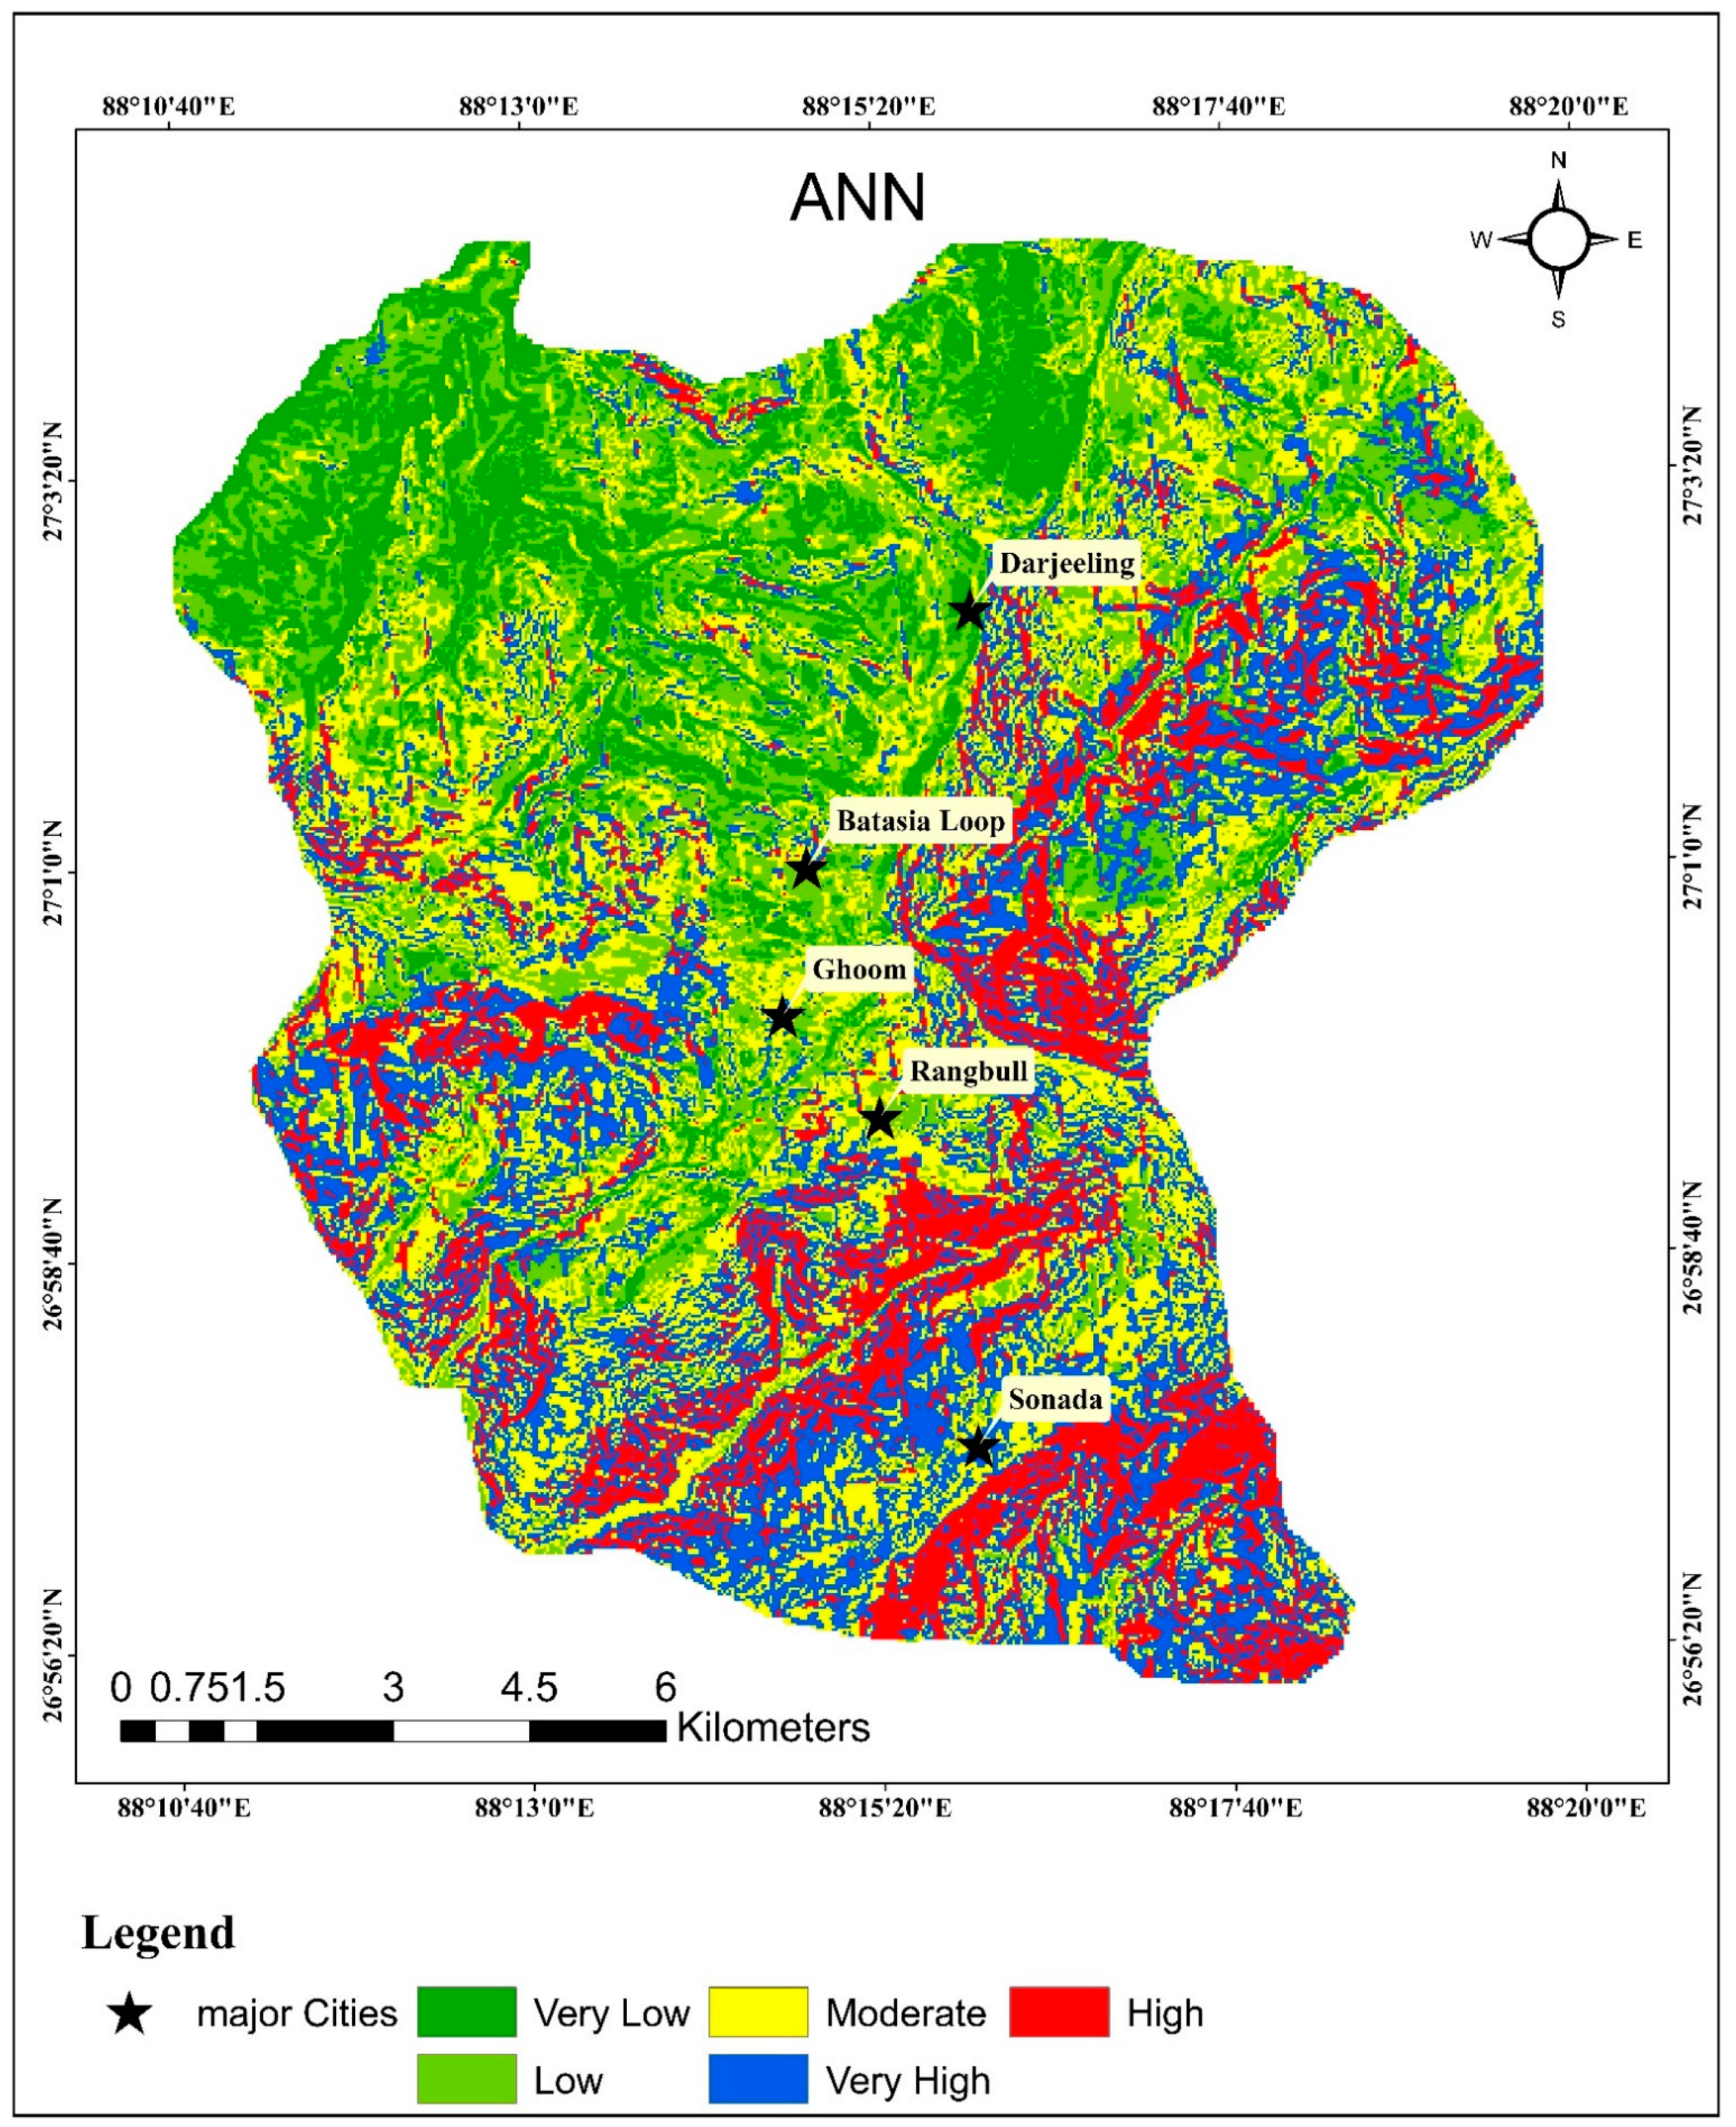
One of the trustworthy methods for mapping landslide susceptibility zones is the fuzzy-based AHP and ML-based approach (ANN), according to the study’s findings, which summarizes the weighted overlay analysis method utilizing MCDA (the AHP and eigenvector approaches). Ten (10) thematic layers, including slope, aspect, rainfall, lineament density, drainage density, lithology, geomorphology, soil texture, land use, and land cover, were utilized to categorize the research region into distinct landslide vulnerability zones. The landslide susceptibility map shown in
Figure 6,
Figure 7, and
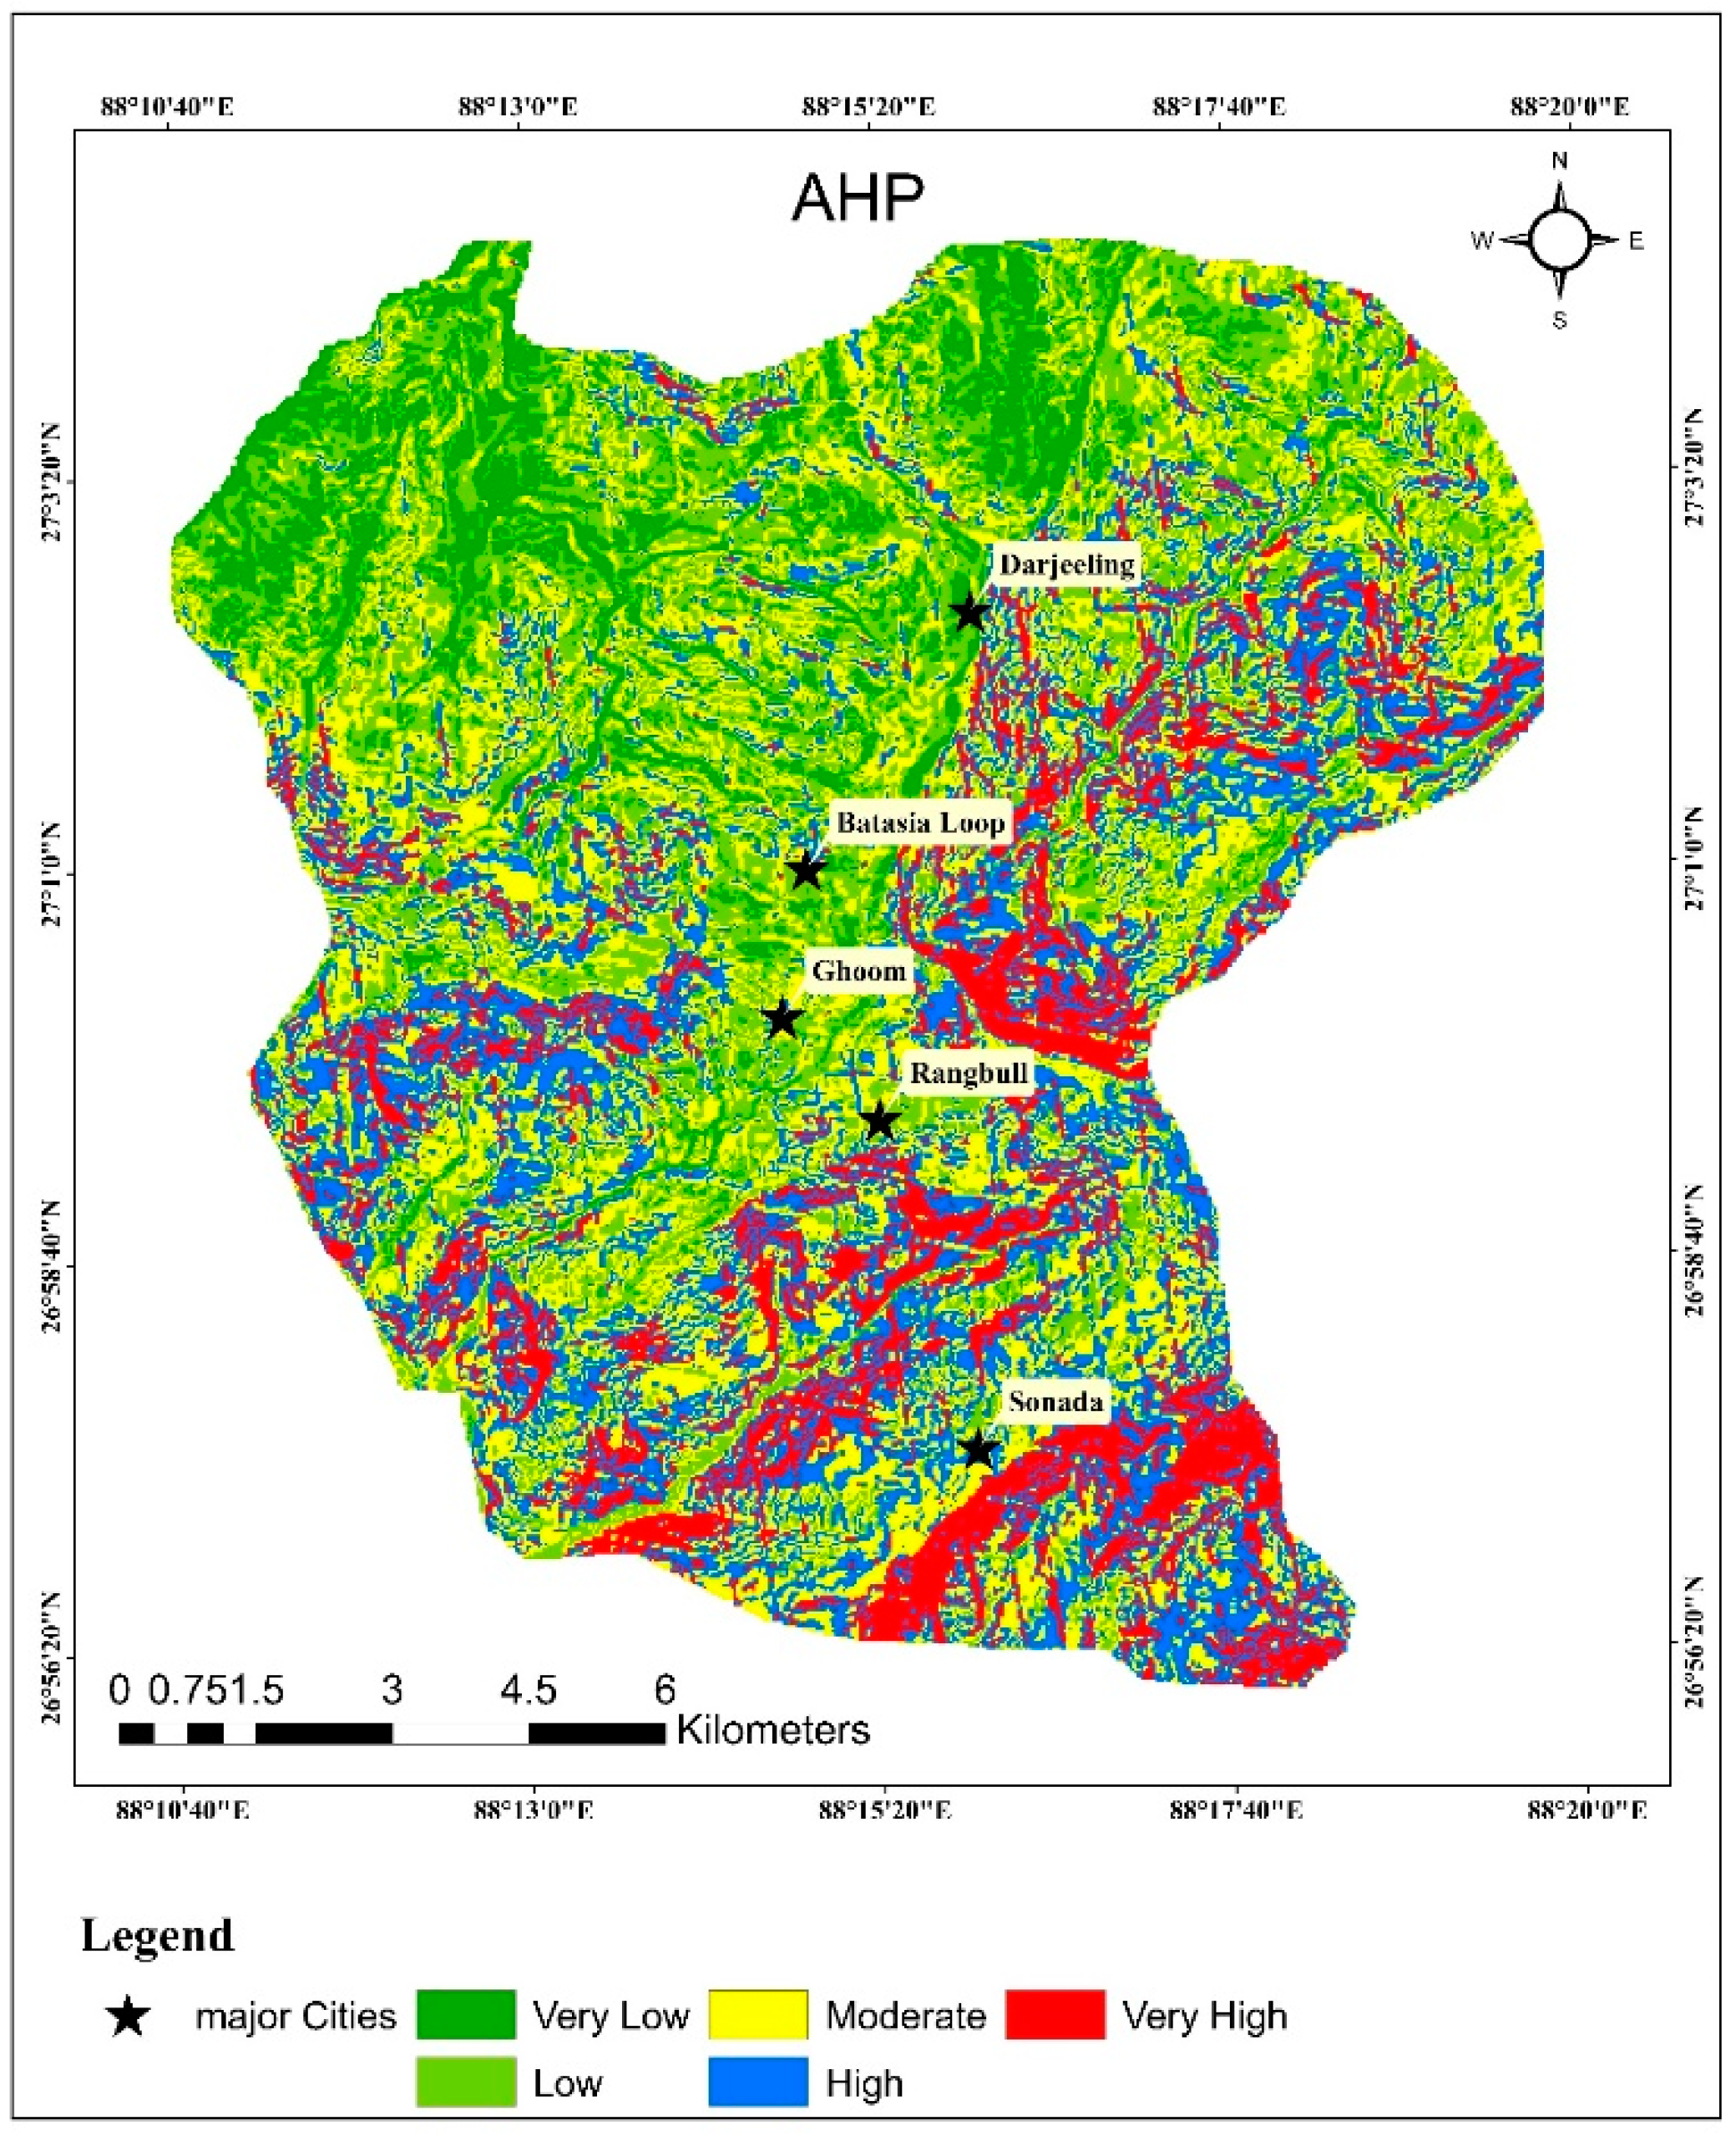
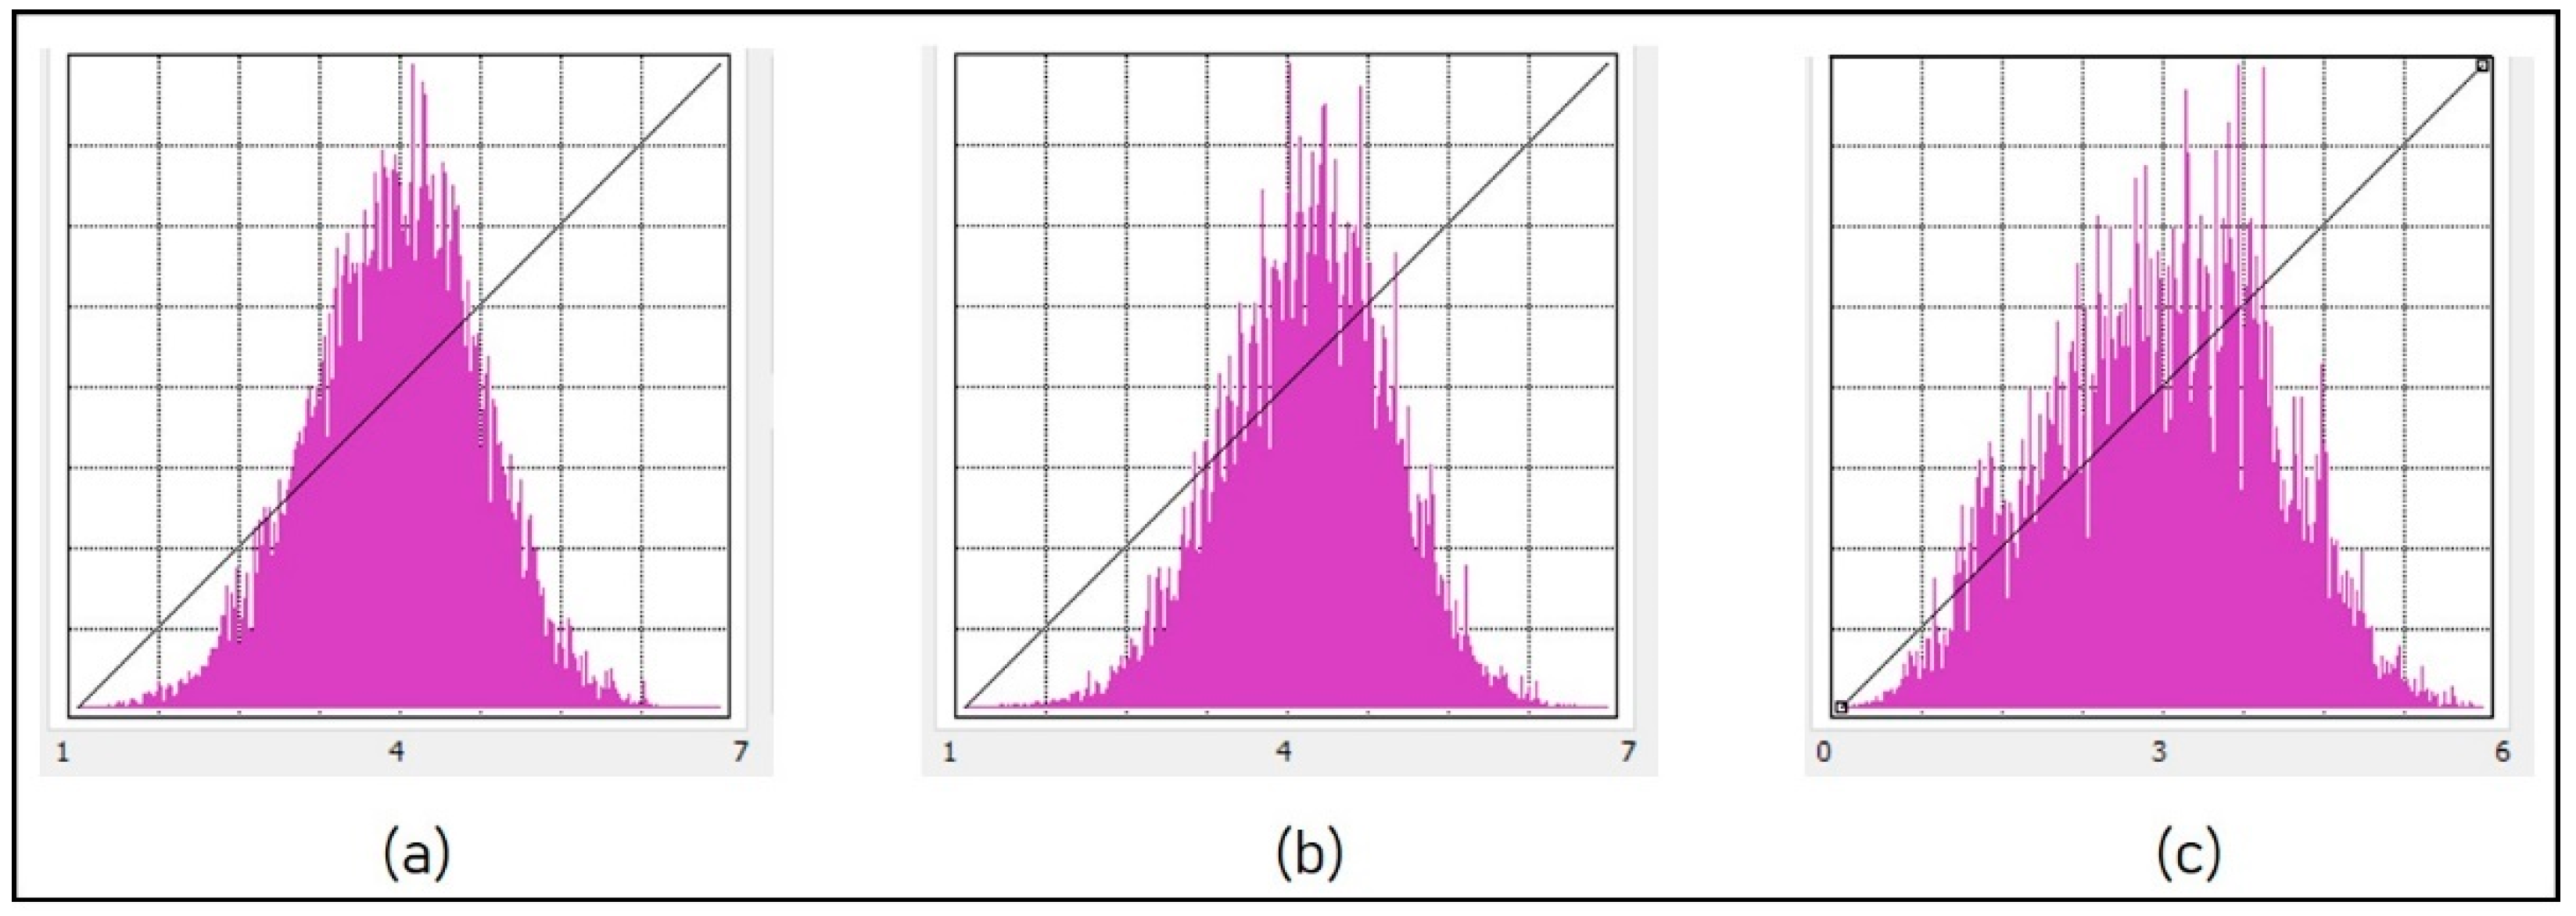
Figure 9 was produced statistically and was interpreted using the landslide susceptibility index (LSI) value. The minimum and highest LSI values for AHP were 1.63 and 7.13, respectively, with a mean value of LSI 4.35 and a standard deviation (Sd) of 0.70. (
Figure 11a). The minimum and maximum values for fuzzy-AHP were 1.95 and 7.63, respectively, with a mean value of 4.99 and a Sd of 0.72. (
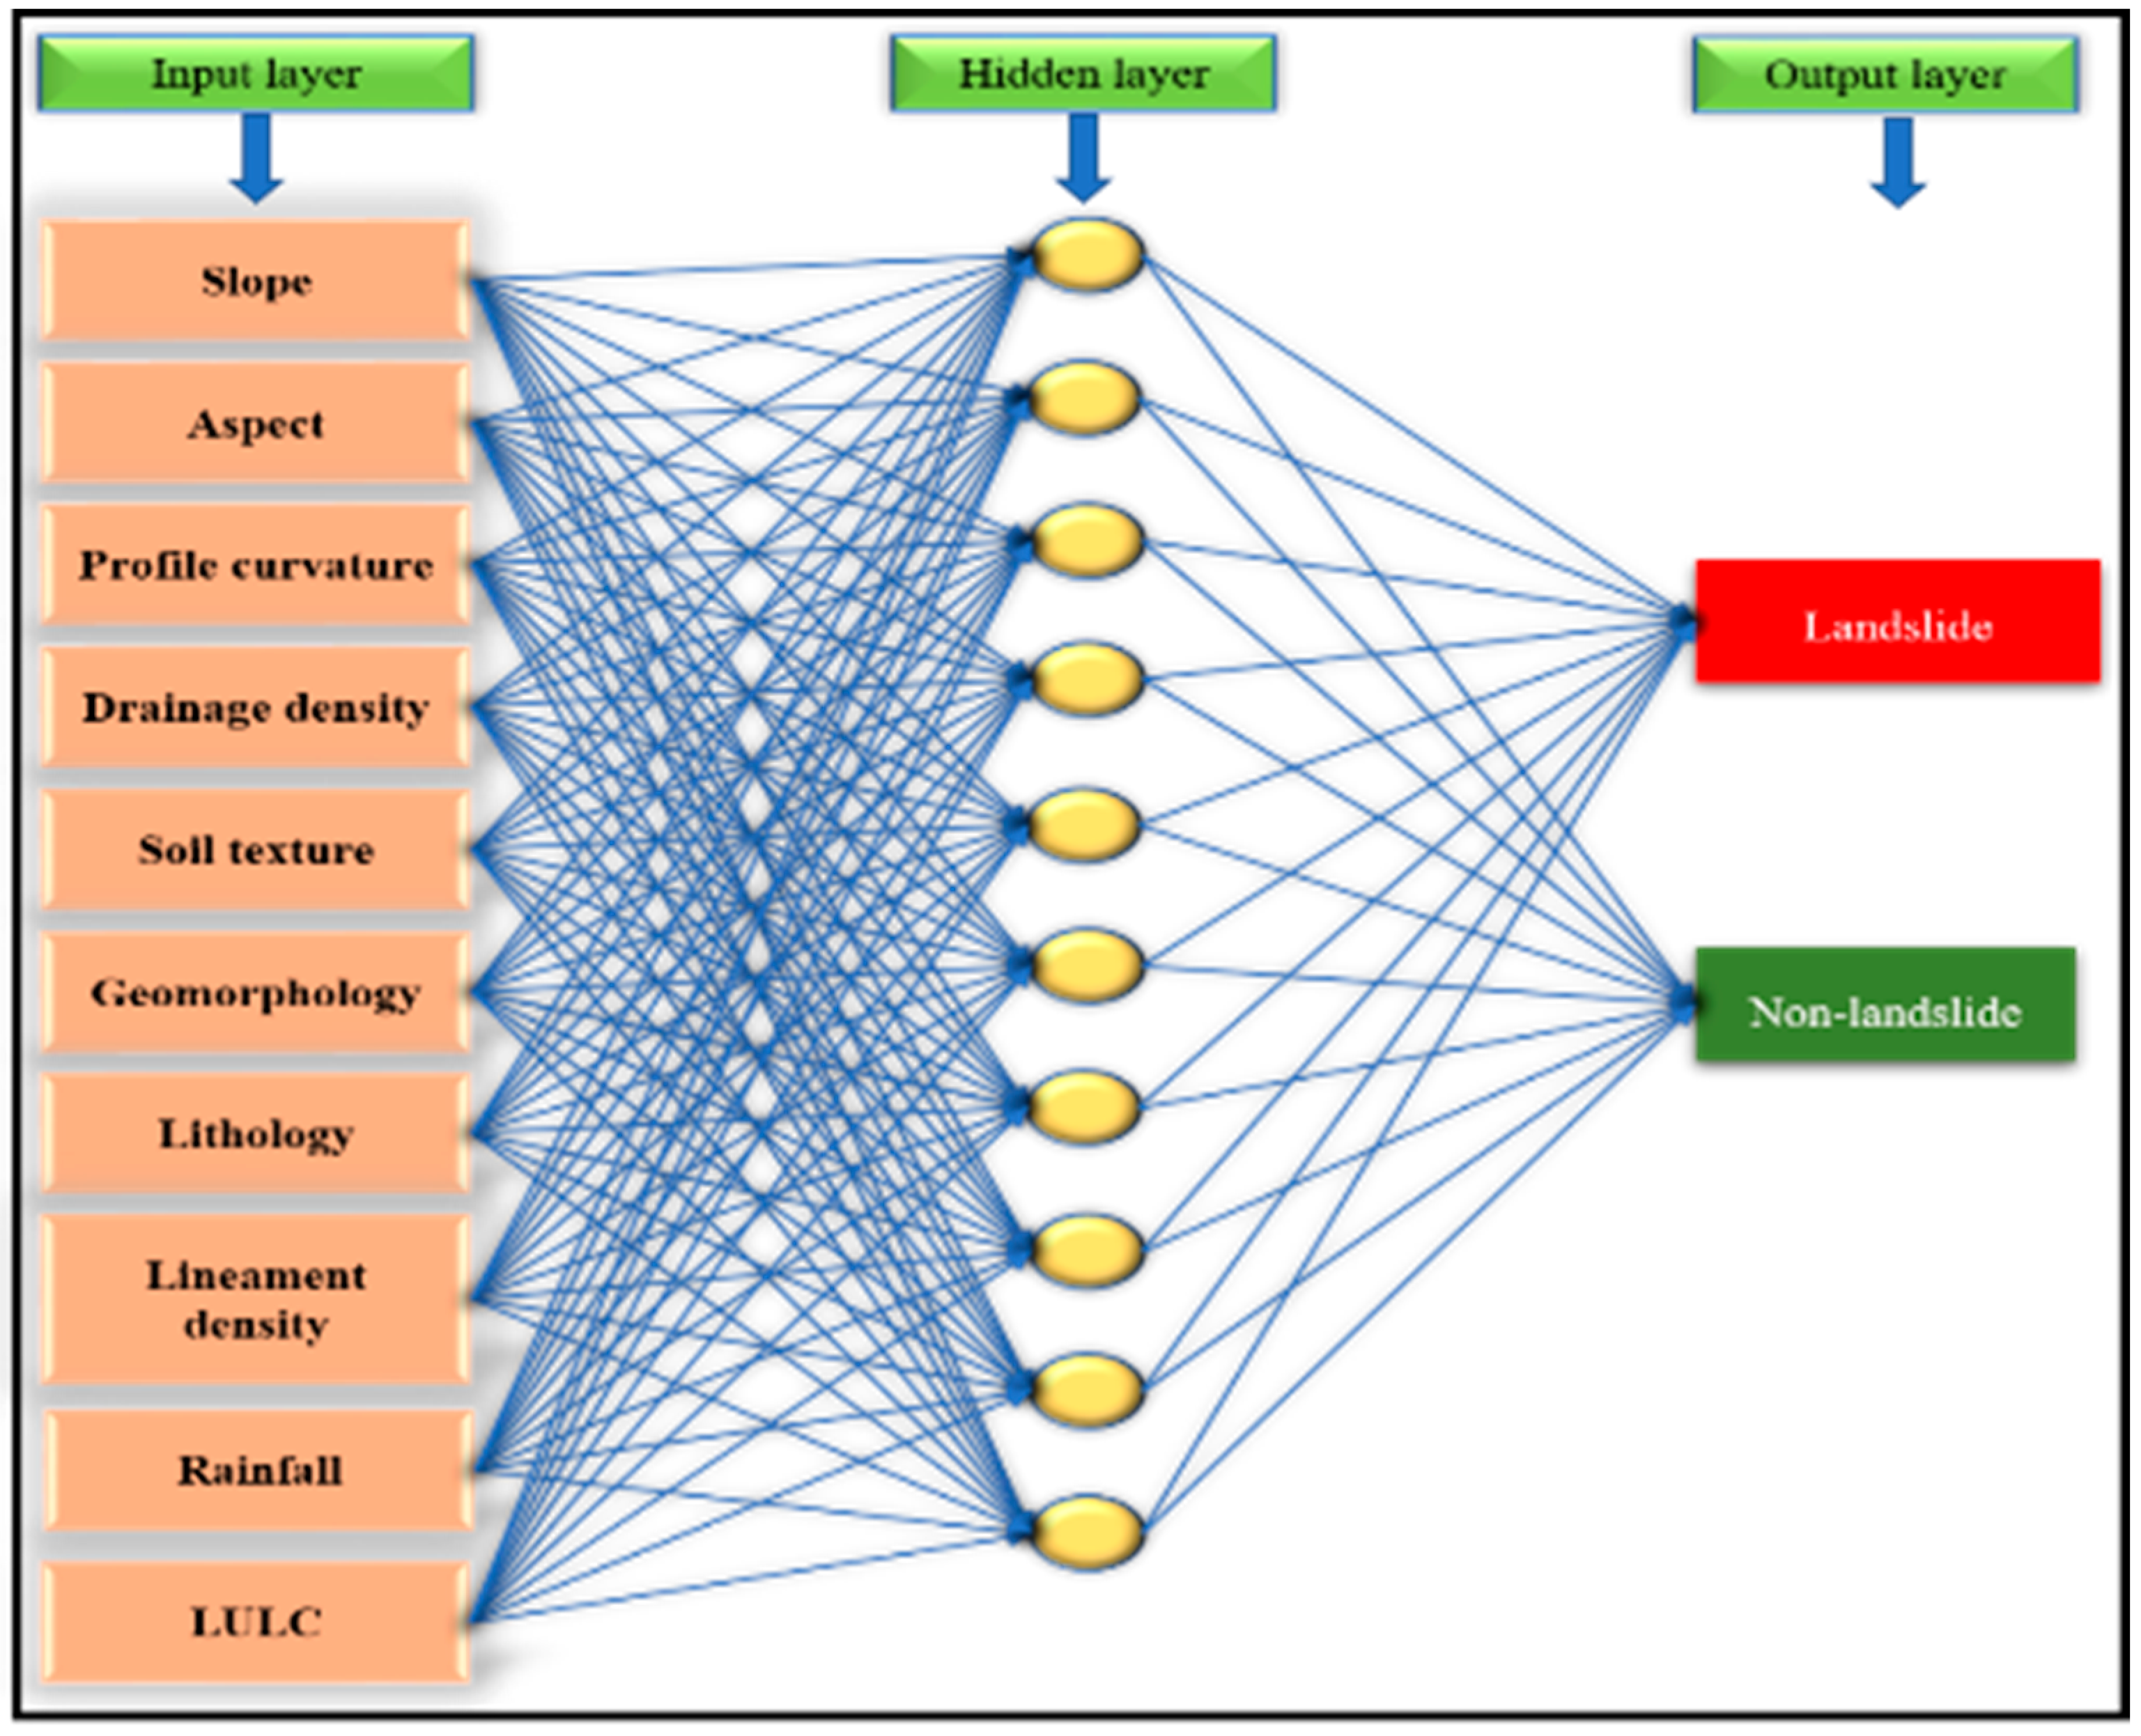
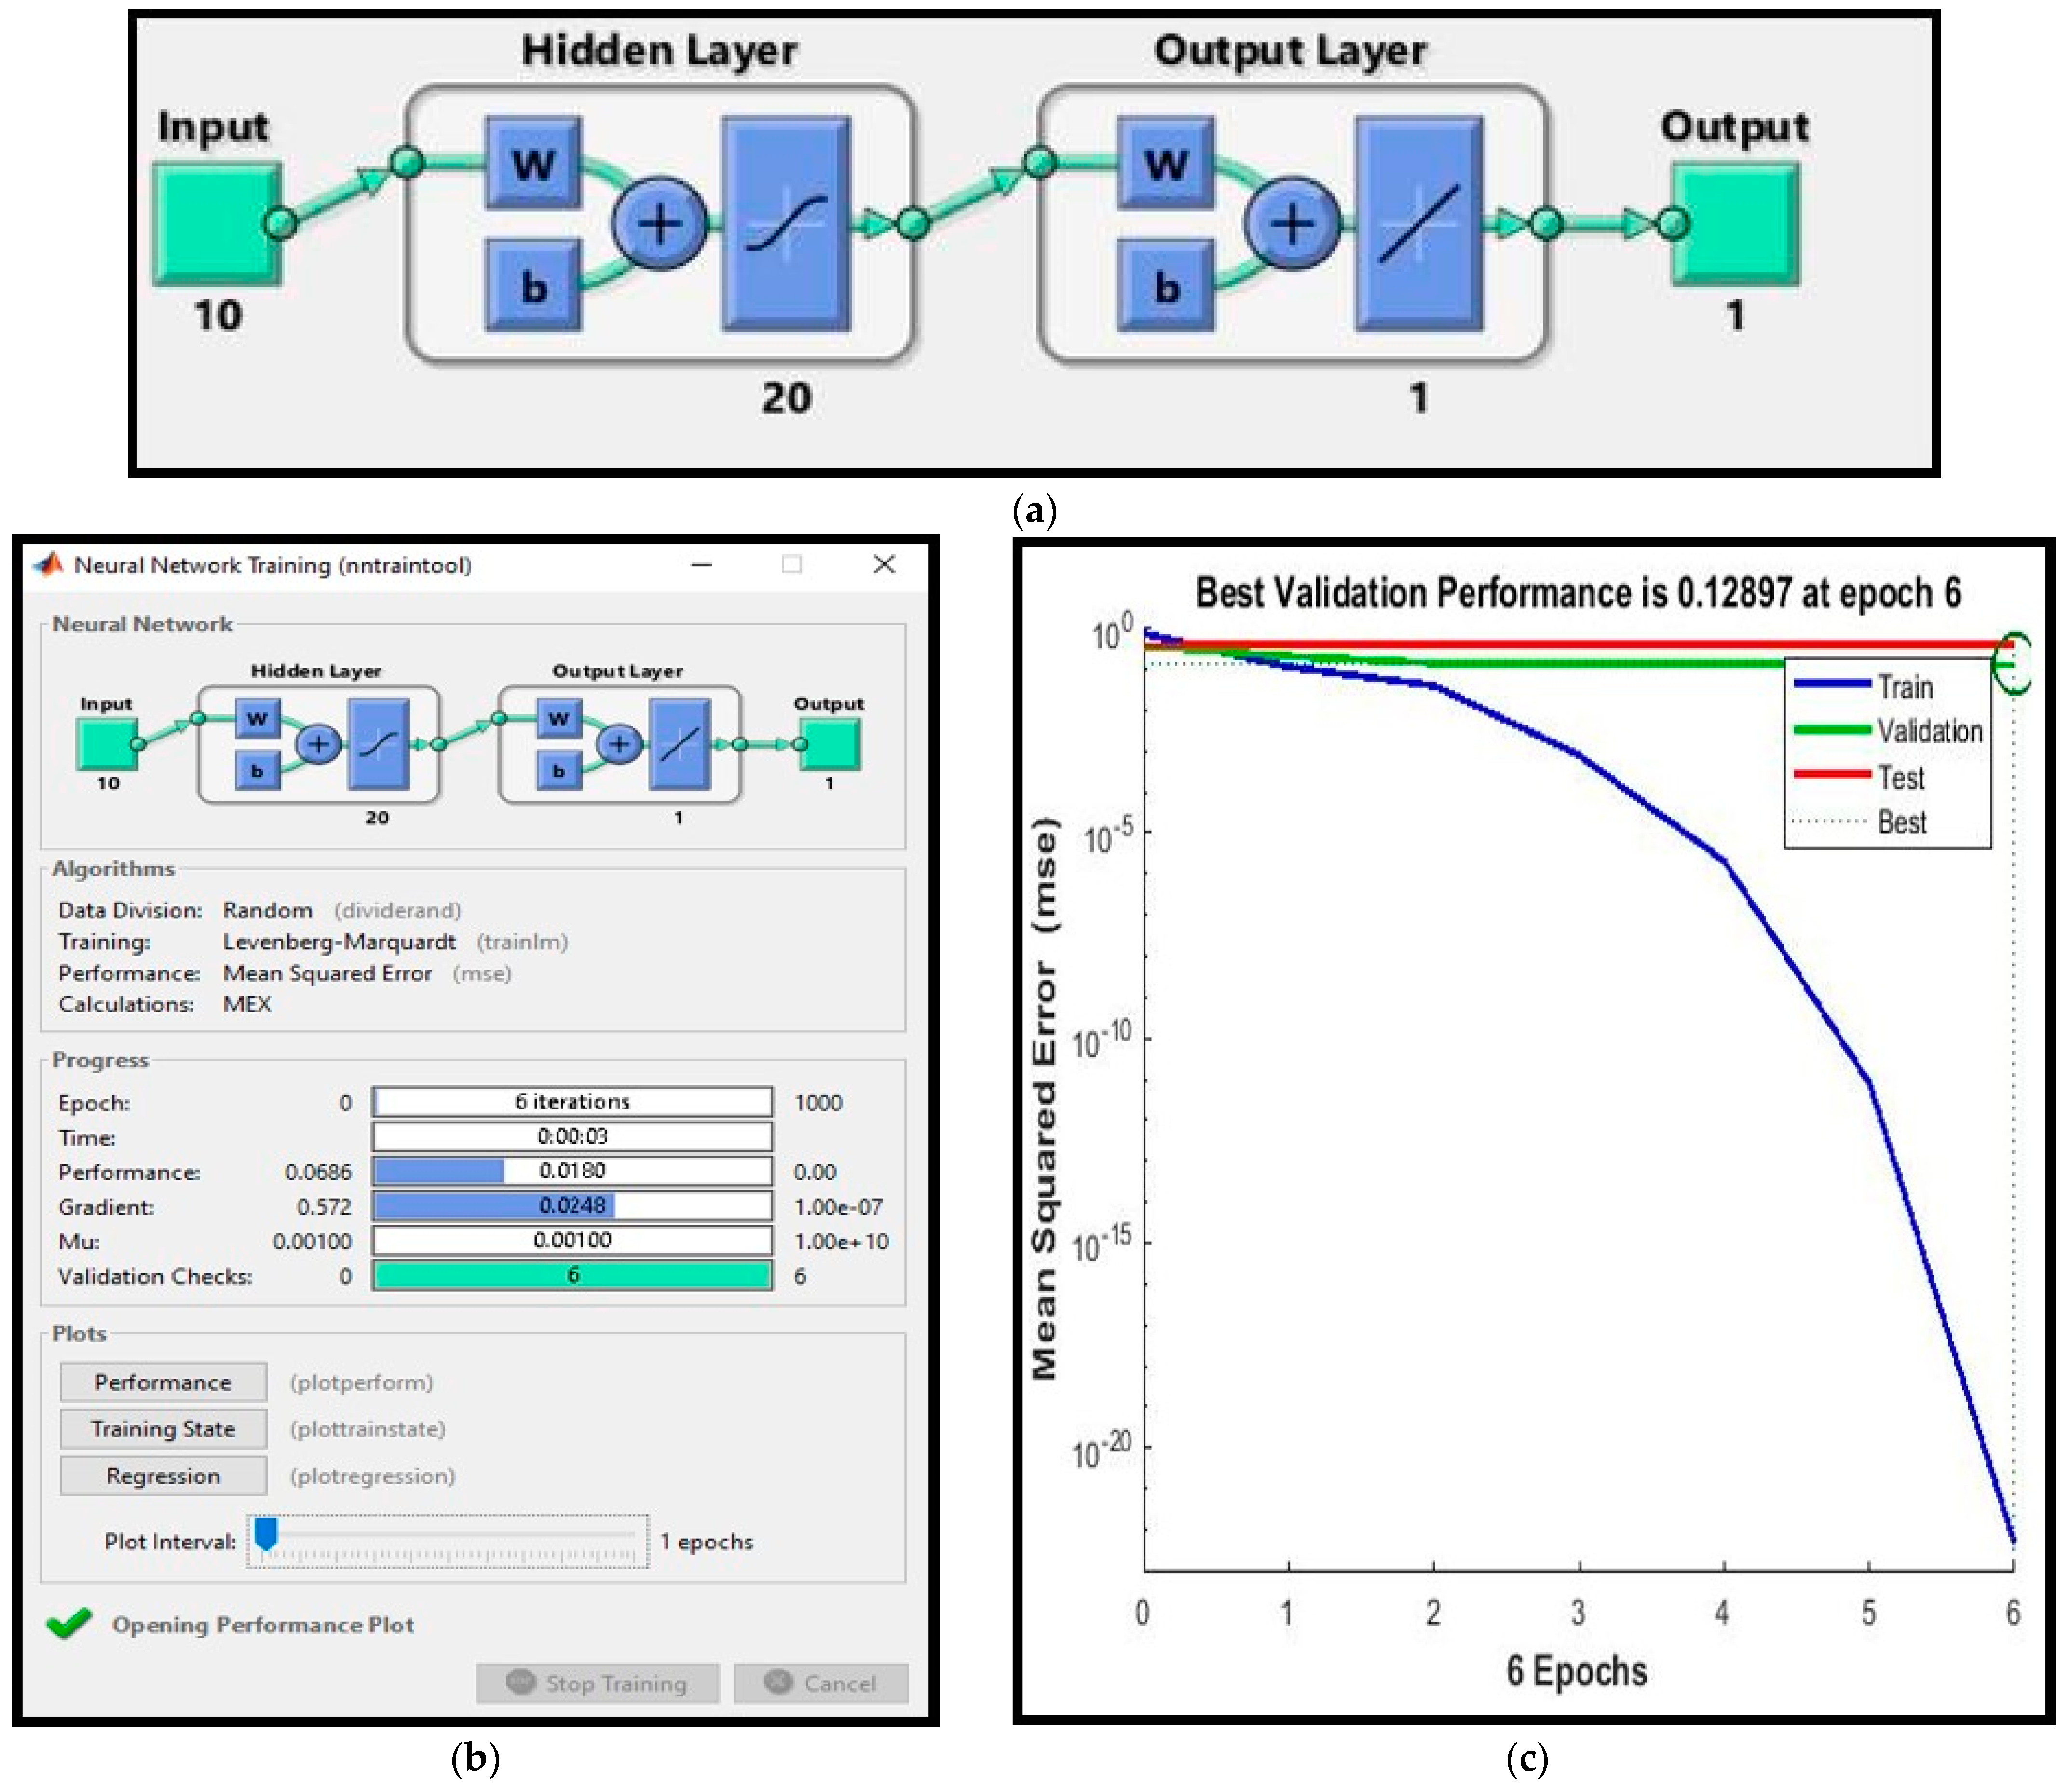
Figure 11b). The LSI values for ANN were 3.14, 1.02, 0.17, and 6.13, respectively, for the mean, standard deviation, minimum, and maximum (
Figure 11c). The landslide susceptibility index was divided into several zones according to the histogram profile. The frequency of distributed data is indicated by the histogram profile, which shows statistical information about the LSI pixel (cell) value. The natural break classification system was used for zonation mapping because the histogram demonstrated that the spread values were irregularly distributed [
74]. The outcome was the identification and mapping of five classes of landslide susceptibility zones: very low susceptibility, low susceptibility, moderate susceptibility, high susceptibility, and very high susceptibility (
Figure 6,
Figure 7, and
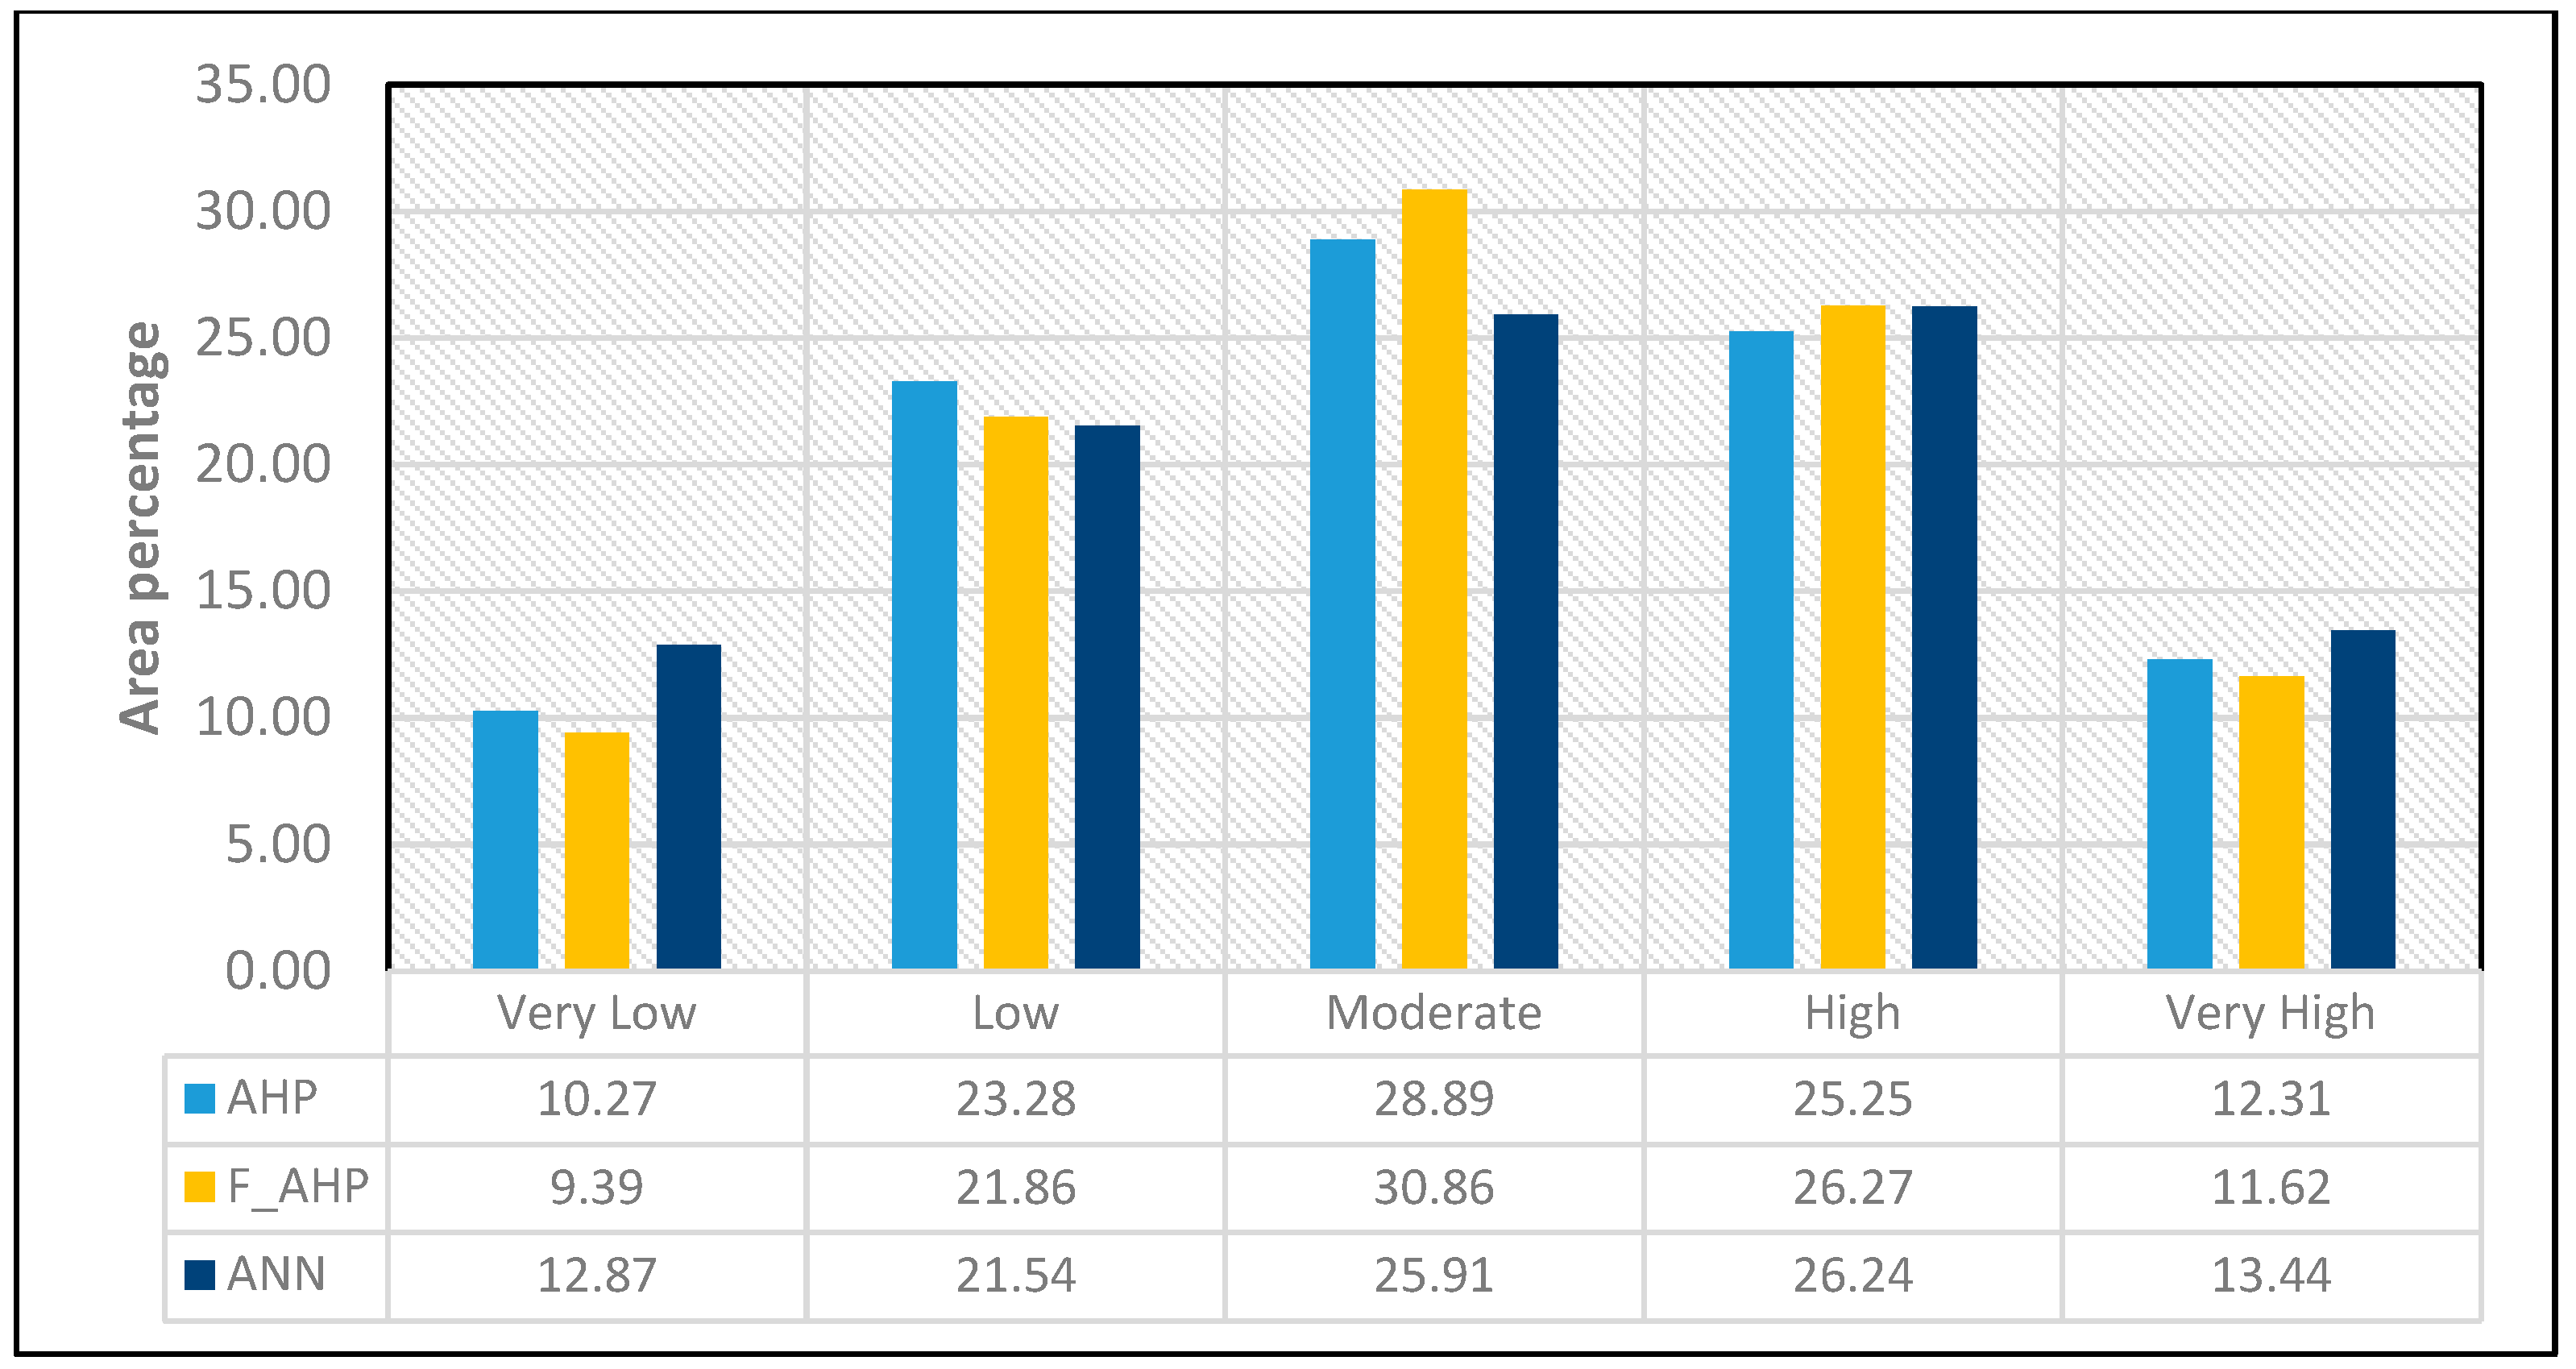
Figure 9). For AHP, fuzzy-AHP, and ANN, the analysis area % of the extremely high susceptibility zone is 12.31, 11.62, and 13.44, respectively (
Figure 12). Fuzzy-AHP and ANN fall into the moderate to extremely high zone, respectively, according to the susceptibility area percentage of AHP, with 66.46 percent, 68.74 percent, and 65.60 percent of the region falling under this category. Therefore, we may presume that the research region as a whole is in the moderate zone.
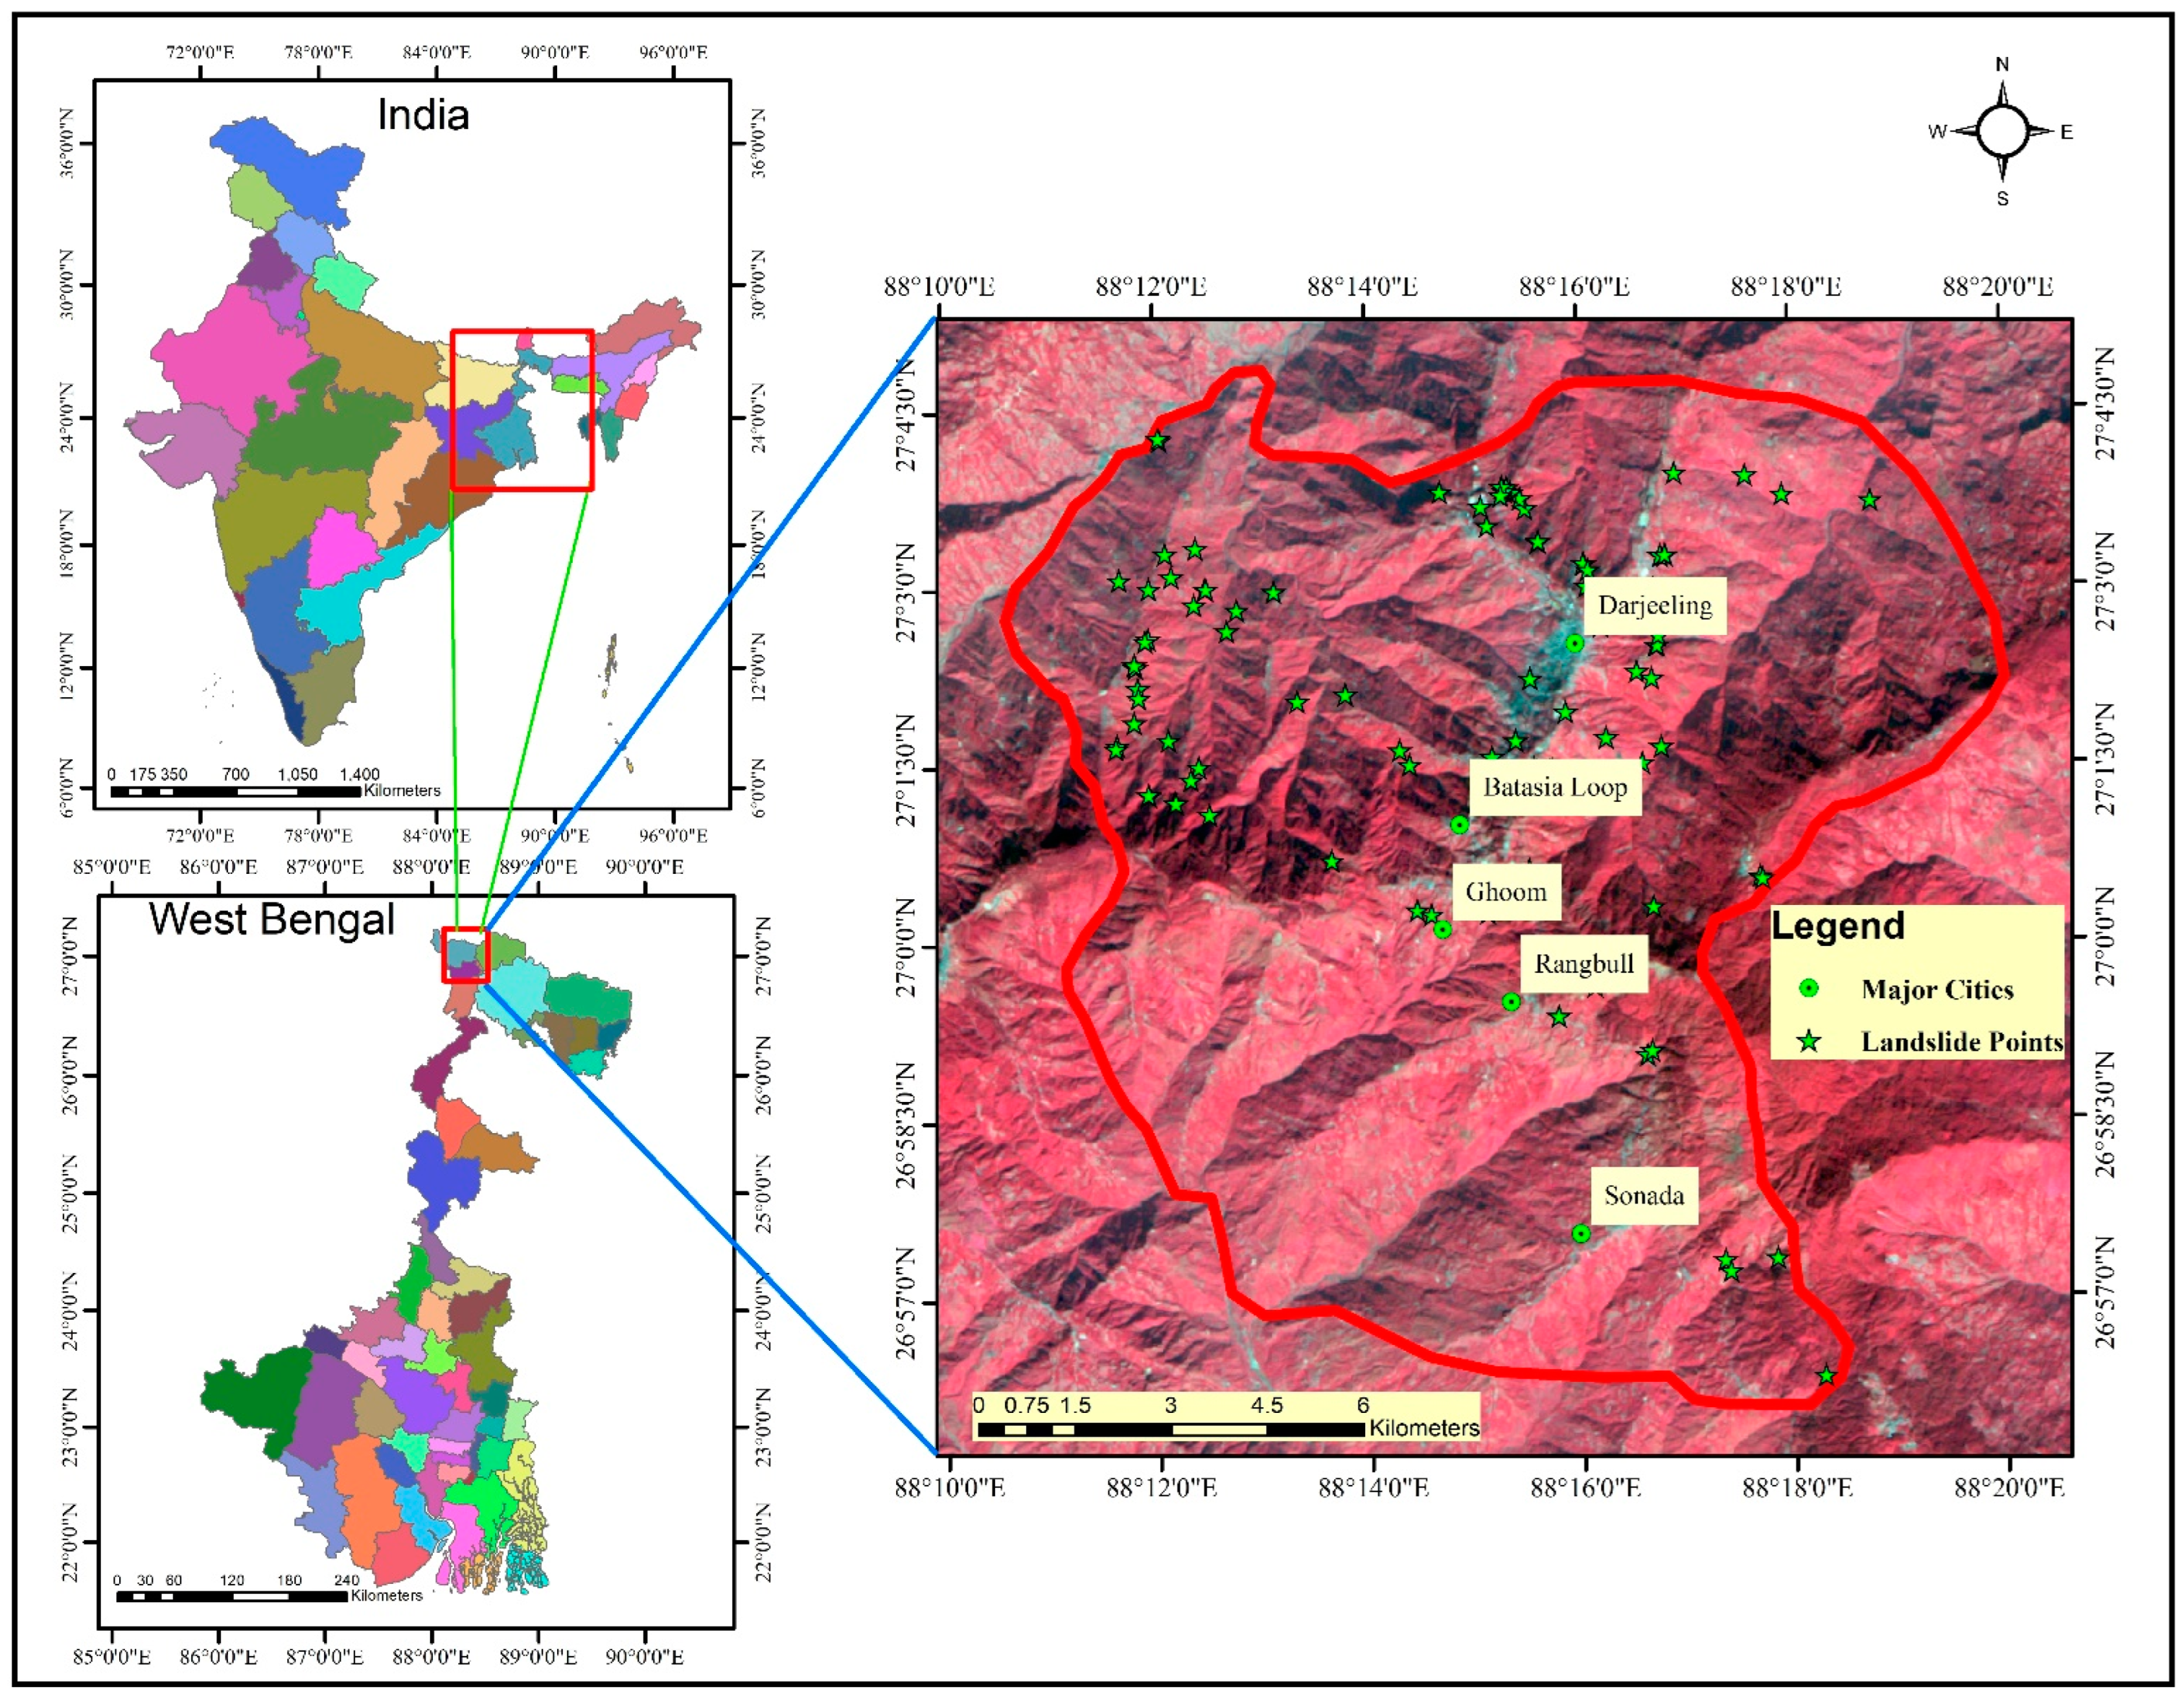
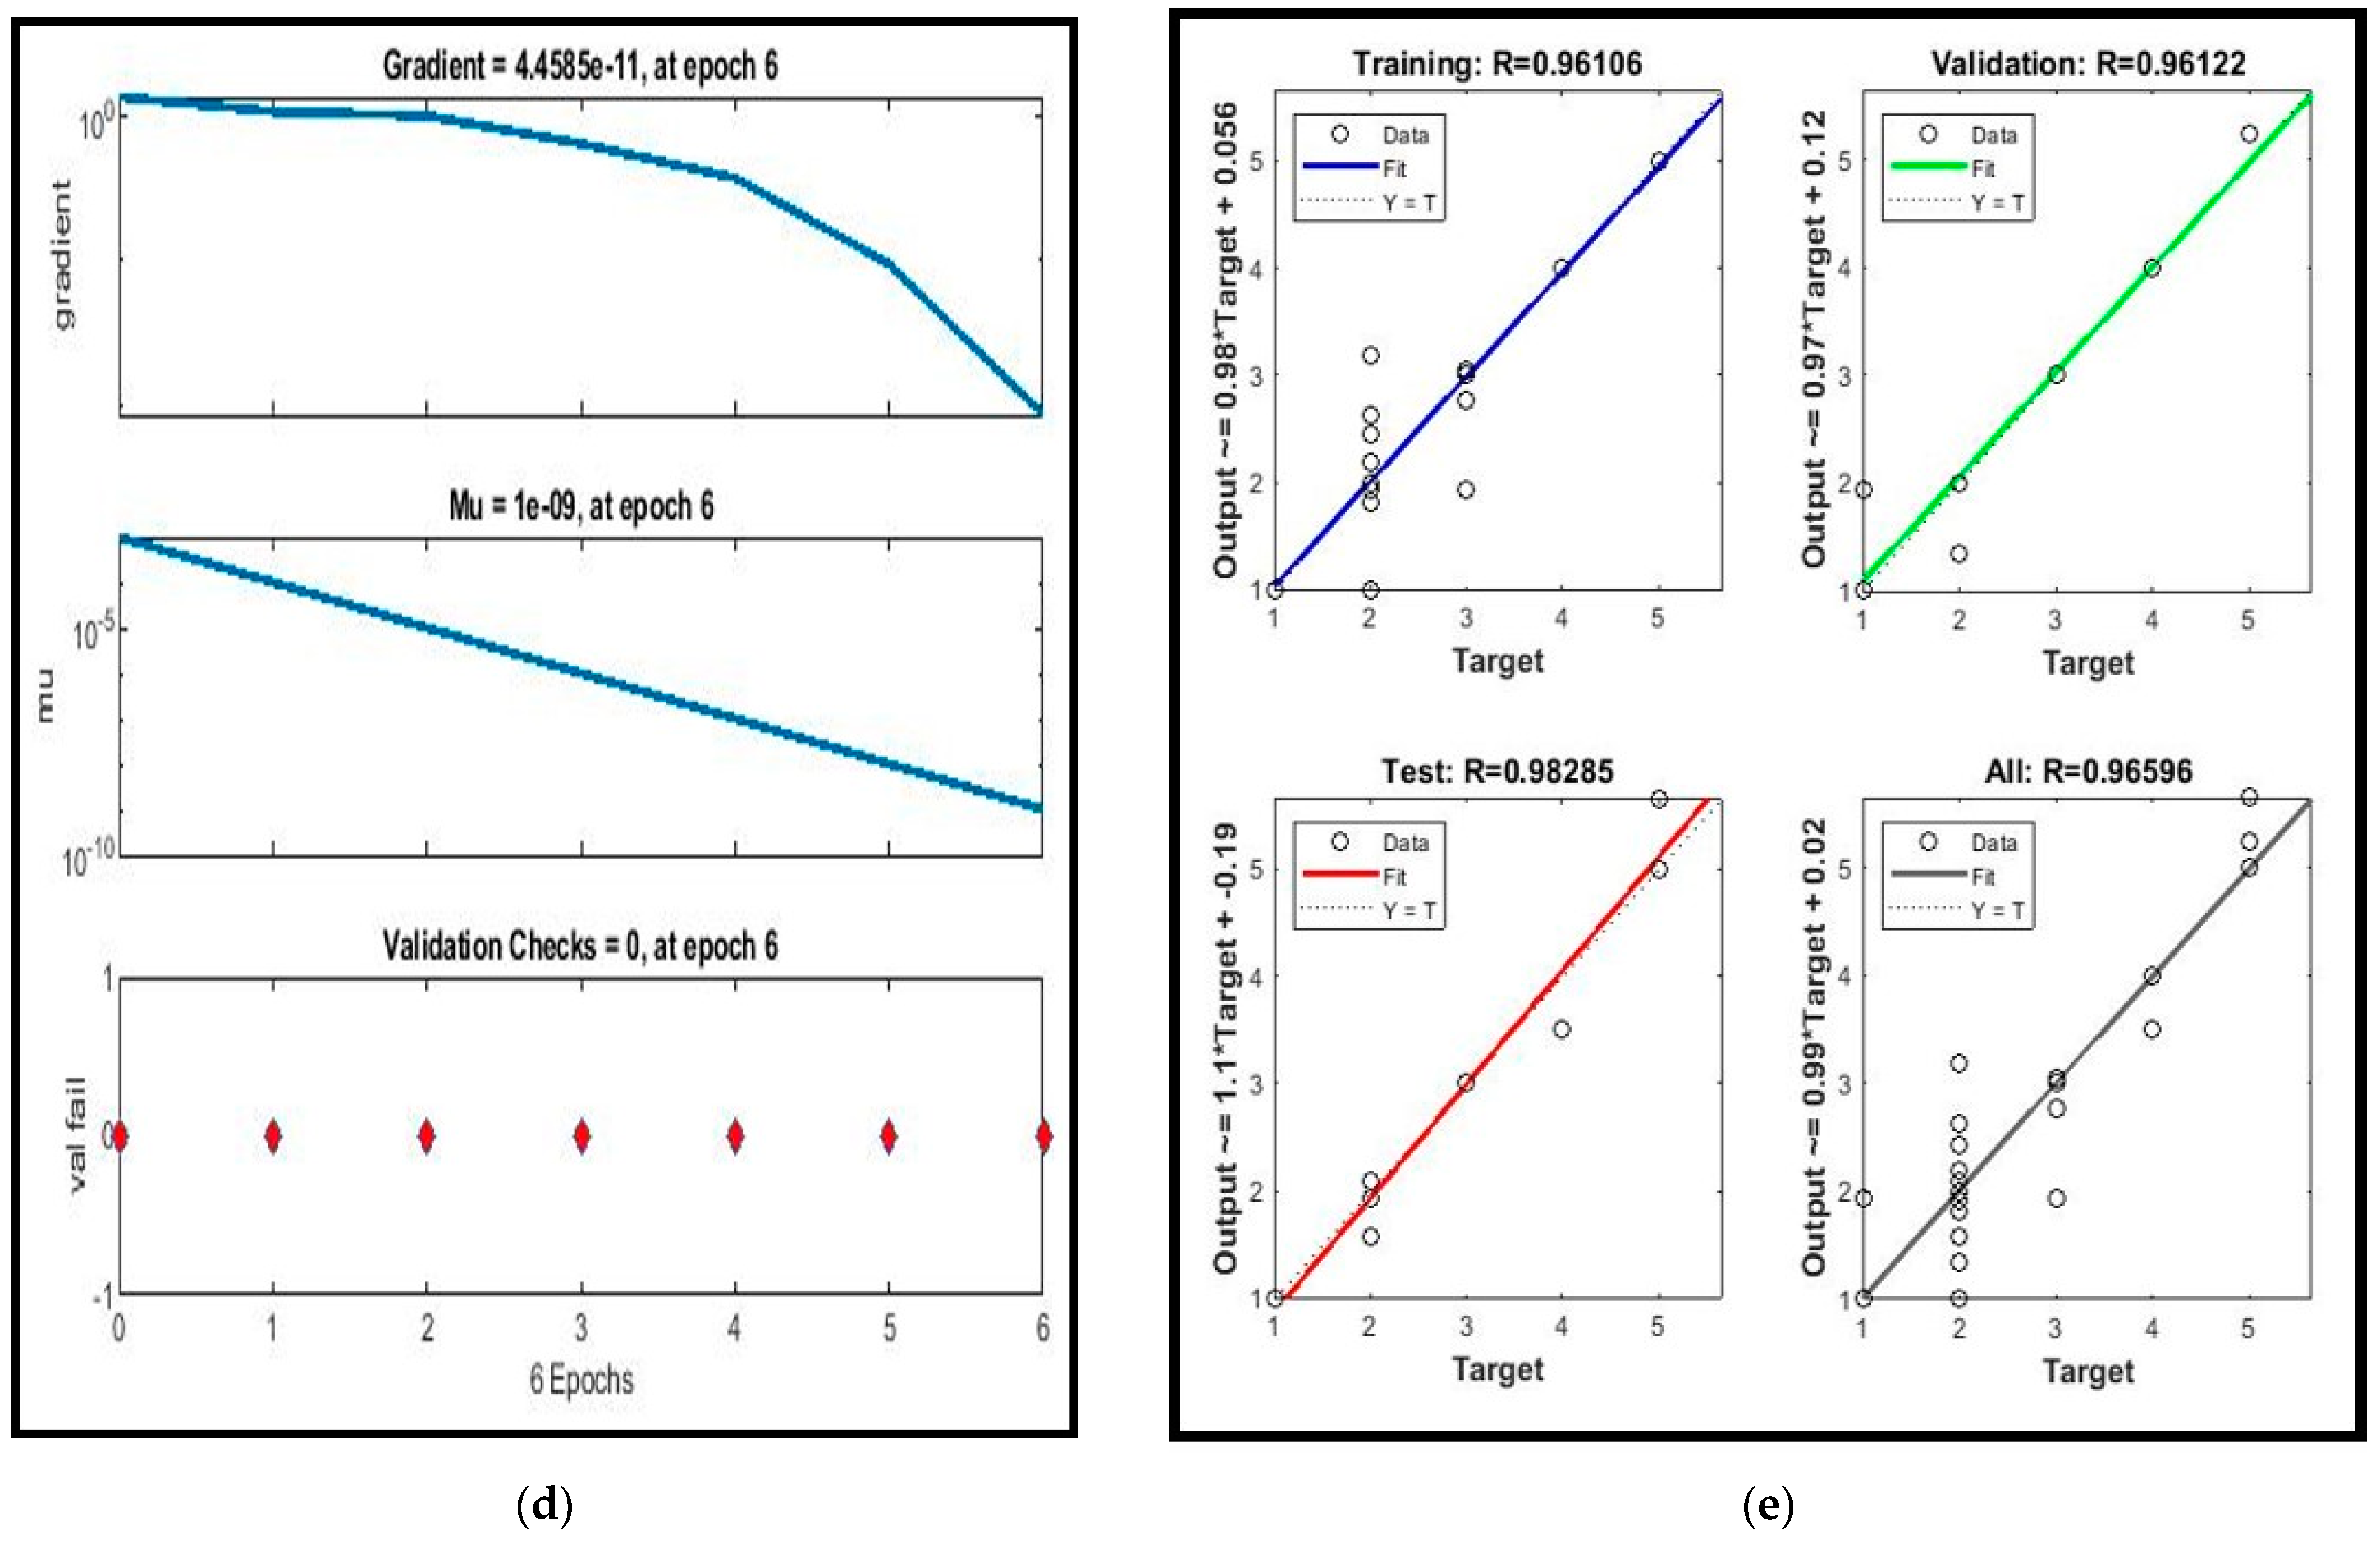
Additionally, three susceptibility maps based on the known landslide dataset were utilized to assess the dependability of the results using the area under the curve (AUC) of the receiver operating characteristics (ROC). A map of landslide inventory was produced from published data of the Geological Survey of India. Here, 114 landslides were recorded; 79 (70 percent) were utilized as training data and 35 (30 percent) as testing data. The maps created by the ANN model appear to be more accurate than the maps created by the Fuzzy-AHP and AHP models, as shown by the AUC values of 88.1 percent, 86.1 percent, and 85.4 percent for ANN, fuzzy-AHP, and AHP, respectively. Time is a significant component in hazard studies; therefore, this discovery is helpful in an emergency. One may understand the conclusion that the models’ accuracy is equivalent. Because they can provide perfect and stable landslide susceptibility maps for risk mitigation and management planning, we advocate employing ANN, fuzzy-AHP, and AHP models in landslide investigations. A regional landslide susceptibility map may be created using the ANN model, which is also adequate and shows promise.
5. Conclusions
Landslides are one of the deadliest natural dangers in hilly terrain. The highly deformed mountainous terrain is under danger from landslides as a result of both humanmade activity and natural events (such as climate change and earthquakes) (human intervention). The northern Himalayan areas of West Bengal are becoming an unending nightmare for residents due to these dangers. To preserve lives and property, an interim and enduring solution to reducing the danger of landslides in this area is needed. We must locate and map the most susceptible places in order to assist future infrastructure and urban development plans. LSM might therefore be a crucial approach for evaluating risk management in challenging terrain. The use of MCDA models for landslide susceptibility assessments has yielded incredibly efficient and precise results for many years. In recent years, sophisticated methods known as machine learning (ML) methods have been created. This work’s main objective is to assess the effectiveness of MCDA models AHP, fuzzy-AHP, and ML methodology (ANN-) and identify the most precise and useful method for identifying landslide-prone locations in the research area. Our results (based on LSM and AUC) demonstrate the effectiveness of both conventional machine learning and deep learning techniques. The main MCDA algorithms SVM (fuzzy-AHP = 86.1 percent and AHP = 85.4 percent) were found to be inferior to the machine learning algorithm-based ANN (AUC = 88.1 percent), which performed better in terms of accuracy and predictive power. Additionally, it was shown that ANN findings were more discriminative. Overall, the landslide-prone regions and the optimal planning and development zones in the mountainous region of Darjeeling and Kurseong district, West Bengal, India, were well identified by this study. Finally, the land use planners, decision-makers, and other governmental and non-governmental organizations may use all of the LSMs created in this study as effective tools to maximize infrastructure development, resource management, and human activity in the study region.


