Article

Temporal and Spatial Changes of Habitat Quality and Their Potential Driving Factors in Southwest China

1
State Key Laboratory of Urban and Regional Ecology, Research Center for Eco-Environmental Sciences, Chinese Academy of Sciences, Beijing 100085, China
2
Linze Inland River Basin Research Station, Key Laboratory of Inland River Basin Ecohydrology, Northwest Institute of Eco-Environment and Resources, Lanzhou 730000, China
3
College of Resources and Environment, University of Chinese Academy of Sciences, Beijing 100049, China
*
Author to whom correspondence should be addressed.
Land 2023, 12(2), 346; https://doi.org/10.3390/land12020346
Submission received: 7 November 2022 / Revised: 6 January 2023 / Accepted: 23 January 2023 / Published: 27 January 2023

Abstract

:
Climate change and human activities have considerably changed the spatial patterns and functional elements of regional habitats. Understanding spatiotemporal changes in habitat quality (HQ) and their potential driving factors is essential for maintaining ecosystem health and protecting biodiversity. To explore the effect of physical and human factors on HQ changes in Southwest China, we firstly analyzed the land-use change intensity (LCI). We then evaluated spatiotemporal changes in HQ based on the InVEST model and explored the spatial heterogeneity of the main driving factors of HQ changes based on a geographical detector and a geographical weighted regression model. The results showed that LCI had obvious spatiotemporal differences, and LCI from low-quality habitat to high-quality habitat (LCI1) was significantly higher than that from high-quality habitat to low-quality habitat (LCI2). The HQ improved steadily in Southwest China in 1990–2015, showing a trend of low–high–low from southeast to northwest. Moreover, there were twelve factors, including aboveground biomass, ecological land area ratio, population density, slope, etc., which had a significant impact on the spatial differences in HQ, and the effects of different factors on HQ had observable spatial heterogeneity. The effect of LCI2 on the spatial difference of HQ was greater than that of LCI1. These results suggested that the current ecosystem protection and management policy had a positive effect on improving HQ. Our study provides an important decision-making reference for sustainable land development and utilization and regional ecological protection and restoration.

1. Introduction

Habitat quality (HQ) refers to the ability of the natural environment to provide appropriate conditions for the sustainable survival and development of individuals and populations [1], and it is essential for ensuring regional ecological security and improving human well-being [2]. However, climate change and unreasonable human activities, including rapid urban expansion, tourism activities, intensive agricultural production, overgrazing and mining activities, have caused changes in the land-use structure, habitat fragmentation, and habitat degradation, or even loss [3,4,5,6]. These further reduce biodiversity, affect ecosystem services provision, and threaten regional ecological security [7]. Therefore, analyzing spatiotemporal changes in the land-use structure and HQ, and exploring potential influencing factors of change in HQ, is significant for improving ecosystem services and maintaining regional sustainable development [8].
Previous studies have mainly focused on the assessment of wildlife habitats based on field surveys [9,10]. However, field surveys of biodiversity are time-consuming and laborious, and it is difficult to achieve long-term dynamic monitoring [11]. With the rapid development of 3S (GPS, GIS, RS) technology, the niche [12], suitability evaluation [13], HQ index [14], and InVEST model [15] have been proposed and applied. These have laid a suitable foundation for evaluating HQ. In particular, the HQ module of the InVEST model can evaluate which ecosystem type provides the best natural conditions for survival and assess the effect of various threat factors and land-use changes on terrestrial habitat [15]. It can map the spatiotemporal changes of HQ and predict HQ in different scenarios [2,11,16]. This model has been widely used in the assessment and prediction of HQ at multiple scales, including different countries, regions, and watersheds [4,5,17,18]. However, most present studies focus on assessing changes in HQ, but few analyze the spatial heterogeneity of its potential driving factors.
As a measure of ecosystem health and biodiversity, HQ is affected by internal and external influencing factors [19], and they play different roles in different regions [8]. Different topographies, hydrological conditions, and soil environments affect the spatial distribution and growth status of vegetation, resulting in differences in ecosystem service and HQ [16,20]. Urban expansion, agricultural production, unreasonable mining, and overgraze activities can cause habitat degradation and fragmentation and reduce biodiversity [6,21,22,23]. In addition, changes in land-use structure will change the landscape components of regional ecosystems, thereby affecting the material exchange and energy flow among different ecosystems and changing HQ [24,25]. However, current studies focus on the relationship between HQ and land-use change or a single driving factor [11,18,26]. There are few systematic studies on the potential influencing factors of HQ that explore the spatial heterogeneity of various factors [4,5,27]. Then, a geographic detector model proposed by Wang et al. [28] in 2010 and a geographically weighted regression model became new and effective analysis methods for exploring spatial heterogeneity and uncovering its driving factors, which have been applied to research on the influencing factors of HQ [8,29].
As a global biodiversity hotspot, Southwest China has abundant natural resources and an essential ecosystem service and plays a critical role in maintaining the ecological security and sustainable socio-economic development of China, and even Southeast Asia [30]. However, continuous climate warming and intense human activities have caused significant changes in landscape patterns and ecosystem degradation in Southwest China, severely affecting regional sustainable development [30,31,32]. Therefore, taking Southwest China as a study area, we analyzed the regional land-use structure and change intensity. We then evaluated the spatiotemporal changes in HQ based on the InVEST model and used a geographic detector and a geographically weighted regression model to explore the driving factors and their spatial relationship with HQ. Finally, relevant countermeasures and suggestions for ecological protection and environmental management were proposed. Our study aimed to understand the spatial characteristics of regional land-use change, explore the key driving factors and spatial heterogeneity of HQ changes, and provide an important decision-making reference for sustainable land development and utilization and regional ecological protection and restoration.

2. Materials and Methods

2.1. Study Area

Under the concept of physical regionalization, Southwest China mainly includes the Sichuan Basin, the Yunnan-Guizhou Plateau, the Southeast Qinghai-Tibet Plateau, and the Guangxi Hills [33]. Therefore, the study area includes Sichuan Province, Chongqing Municipality, Yunnan Province, Guizhou Province, Guangxi Zhuang Autonomous Region, as well as Lasa City, Nagqu City, Lhoka City, Nyingchi City, Qamdo City in the Tibet Autonomous Region, and Yushu Tibetan Autonomous Prefecture in Qinghai Province (including Tanggula Township, the enclave of Golmud City) (Figure 1). Southwest China is located at 85°30–112°30 E and 20°54–36°29 N, covering 2,293,900 km2 and accounting for 23.89% of China’s land area. It contains six major river basins such as the Yangtze River, the Lancang River, the Nujiang River, the Yarlung Zangbo River, and so on, and has complex topography and significant elevation difference, with an average elevation of 2869 m. It is located in tropical and subtropical humid regions, where favorable climate conditions and abundant natural resources provide conditions for the evolution and development of plants and animals, which have become an important global biodiversity hotspot. Southwest China is also an ethnic minority area, and economic development is relatively backward.

2.2. Data Source

The data sources in this study included four types. Administrative boundary and DEM (30 × 30 m) were obtained from the Institute of Remote Sensing and Digital Earth, Chinese Academy of Sciences (http://www.radi.cas.cn). The spatial raster data, including land use and land cover (30 × 30 m), fractional vegetation cover, soil organic matter, and biomass were derived from the Resource and Environment Science and Data Center (http://www.resdc.cn). Meteorological data were downloaded from the China Meteorological Data Service Centre Center (http://data.cma.cn). Socio-economic data (gross domestic product, population) were obtained from the statistical yearbooks. The raster data had a unified spatial resolution of 250 × 250 m.

2.3. Methods

This study aimed to evaluate spatiotemporal changes in land-use structure and HQ and explain the relationship between HQ and potential driving factors. Figure 2 summarizes the complete research framework, including data preparation, calculating land-use change intensity (LCI), assessing HQ, and analyzing driving factors.

2.3.1. Calculating Land-Use Change Intensity (LCI)

LCI refers to the annual percentage of change in the landscape for each time interval and can be used to compare and analyze the status of regional land-use changes during different periods [34]. It was calculated according to Equation (1). We then further calculated the change intensity from low-quality habitats (farmland, artificial surface, and unused land) to high-quality habitats (forest, grassland, and waterbody) and from high-quality habitats to low-quality habitats, denoted as LCI1 and LCI2, respectively.
L C I = j = 1 J j = 1 J C t i j C t j j j = 1 J i = 1 J C t i j Y T Y t × 100 %
where  L C I  represents the land-use change intensity.  Y t  refers to the initial time, and  Y T  refers to the final time.  i  and  j  refer to a land-use type at  Y t  and  Y T , respectively.  J  is the number of types.  C t i j  is the changed area from type  i  at time  Y t  to type  j  at time  Y T C t j j  is the unchanged area of type  j  from  Y t  to  Y T .

2.3.2. Habitat Quality Model

This study used the InVEST model to evaluate HQ in Southwest China. We firstly selected main habitat types and habitat threat factors considering the actual situation in this study area. Then, referring to the related literature [5,16,19], we determined the required parameters of the InVEST model, such as maximum threat distance and weight, attenuation type of each threat, and the suitability and sensitivity of each habitat type (Tables S1 and S2). The HQ evaluation model is as in Equations (2)–(5). We divided HQ into five levels using the natural breakpoint method: low (0–0.3), lower (0.3–0.6), medium (0.6–0.8), higher (0.8–0.95), and high (0.95–1).
D x j = r = 1 R y = 1 Y r w r r = 1 R w r r y i r x y β x S j r
i r x y = 1 d x y d r m a x   if   linear
i r x y = exp 2.99 d r m a x d x y   if   exponential
Q x j = H j 1 D x j z D x j z + k z
where  D x j  represents the habitat degradation of raster  x  in the type  j R  represents the number of threat factors;  r  represents the threat factor grid cells.  y  denotes the total grid on the threat  r , and  Y r  represent the set of grid cells.  w r  represents the weight of threat  r β x  is the accessibility level of the grid  x S j r  represents the sensitivity of habitat type  j  to threat  r i r x y  represents the distance attenuation function.  d x y  represents the straight-line distance between grid  x  and  y d r m a x  is the maximum threat distance of  r Q x j  and  H j  represent the HQ and habitat suitability of the raster  x  in the habitat type  j z  and  k  are constant.

2.3.3. Geographical Detector

The geographical detector is a new statistical analysis technique for exploring spatially stratified heterogeneity and uncovering the driving factors behind it, and it included the four modules of factor, interaction, risk, and ecological detection [28]. Therefore, our study used the geographical detector to analyze the explanatory factors of spatial differences in HQ and the interactions between these factors. Referring to the relevant literature [6,35,36,37,38] and considering the regional natural conditions, social development level, and data validity, we selected 20 variables related to physical geography, ecological hydrology, socio-economic, and landscape patterns to form a geographic detector factor set (Figure S1). According to the natural breakpoint method in the ArcGIS, each factor was divided into six classes. We then used factor detection and interaction detection to detect the driving factors of the spatial stratified heterogeneity of HQ. Factor detection can determine the explanatory power that affects the spatially stratified heterogeneity of HQ [28]. The formula is as in Equation (6).
q = 1 h = 1 L N h σ h 2 N σ 2
where  q  represents the explanatory power of each factor influencing HQ and ranged from 0 to 1.  h  = 1, …, and L are the stratification of HQ or influencing factor.  N h  and  σ h 2  represent the number of units and variances of HQ in  h , respectively. While  N  and  σ h  represent the number of units and variances of HQ in the entire region, respectively.
Interaction detection helps to identify the combined effects of different influencing factors and assess whether two factors enhance or weaken the combined effect on HQ when they work together or whether the effect of different factors on the HQ is mutually independent [28]. The judgment basis is shown in Table 1.

2.3.4. Geographically Weighted Regression Model

The GWR model is a spatial statistical technique used to explore the spatial relationships among different variables by directly modeling and estimating the local regression coefficient [39]. Hence, this study applied the GWR model to analyze the spatial heterogeneity of various factors affecting HQ. The calculation method is as in Equation (7) [27,40].
y i = β 0 μ i , ν i + k = 1 m β k μ i , ν i x i k + ε i
where  y i  refers to HQ.  i  represents the code of sampling points.  μ i  represents the longitude coordinate of sampling point, and  ν i  represents the latitude coordinate.  β 0  is the intercept of the sample  i x i k  is the influencing factor.  k  refers to the number of influencing factors.  ε i  is the random error.  β k  represents the local regression coefficient of influencing factors. The regression coefficient shows the contribution of each influencing factor to HQ [40].

3. Results

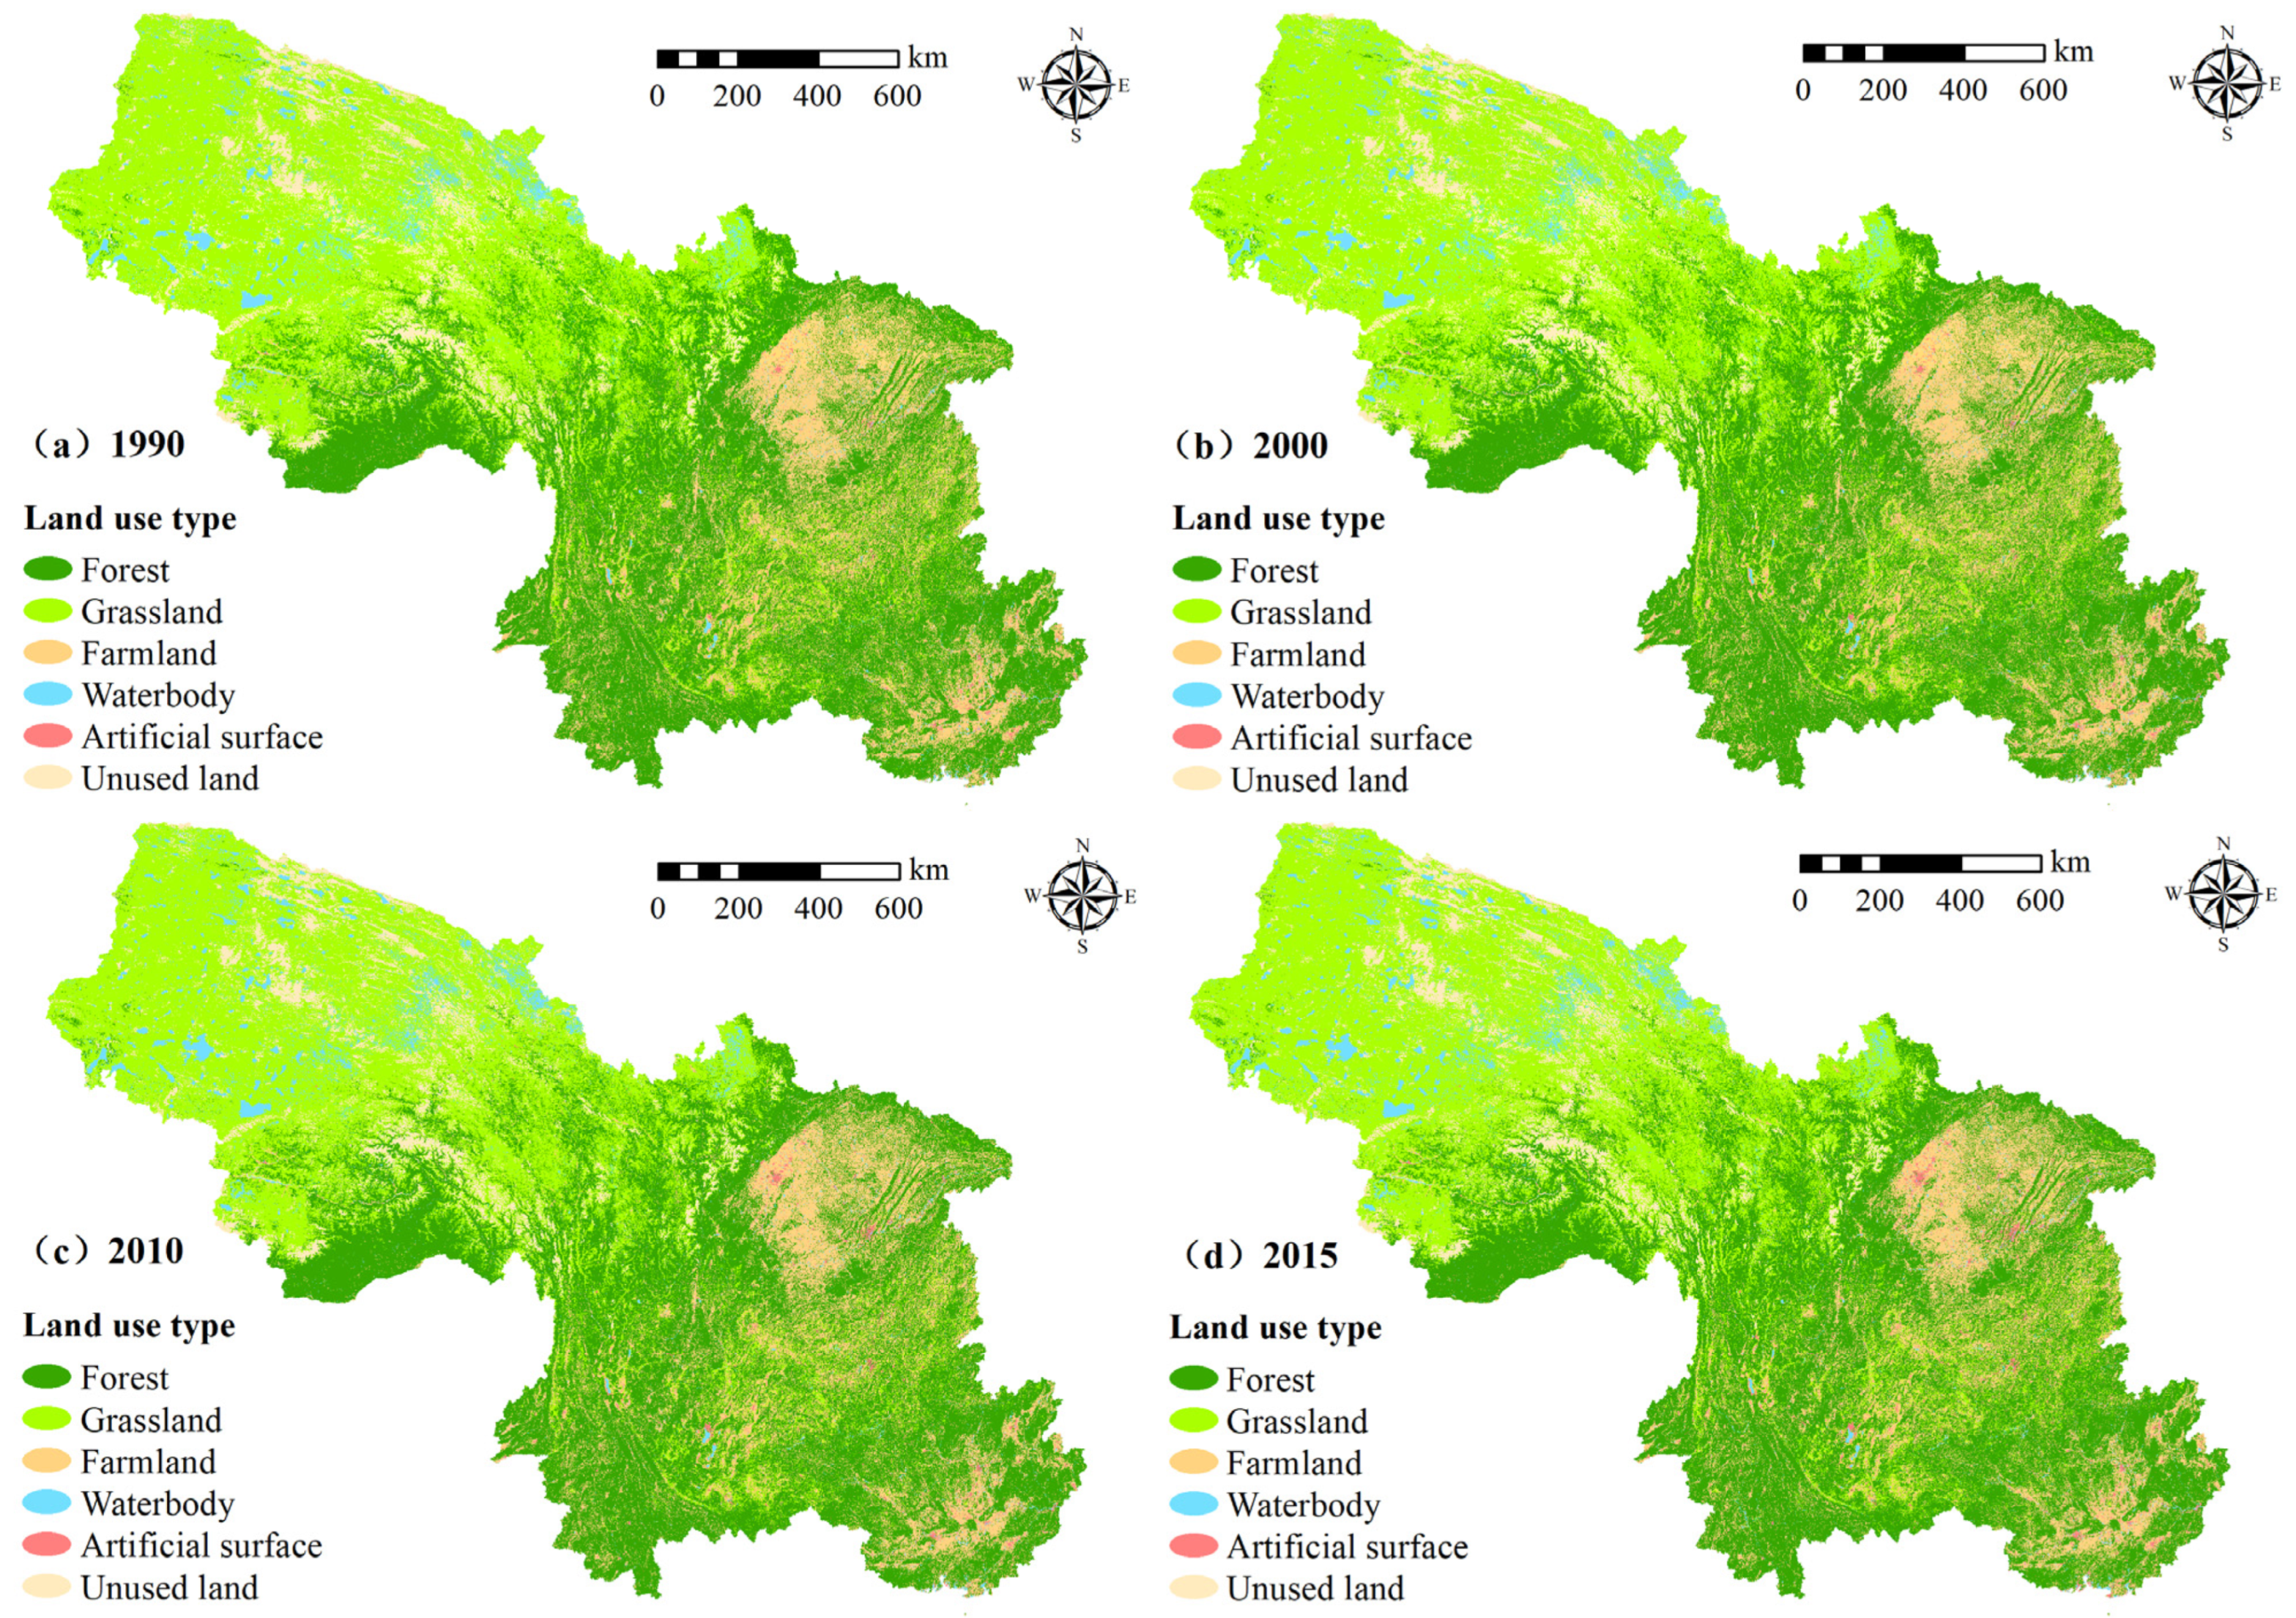
3.1. Land-Use Change Intensity

Forests were the dominant land-use type in Southwest China, followed by grassland and farmland, and they accounted for 41.21–41.68%, 34.89–35.02%, and 13.08–14.02%, respectively (Table 2). As shown in Figure 3, forests were mainly concentrated in Southeast Tibet, West Sichuan, West Yunnan, and Northwestern Guangxi. Grassland was mainly clustered on the Qinghai-Tibet Plateau and West Sichuan, farmland and artificial surfaces were mainly distributed in the Sichuan Basin and Southwest Guangxi, and grassland was mainly distributed on the Qinghai-Tibet Plateau. During the study period, the areas of forests, waterbodies, and artificial surfaces in Southwest China increased by 1.02%, 9.09%, and 72.99%, respectively. Grassland, farmland, and unused land areas decreased by 0.36%, 6.69%, and 1.16%, respectively (Table 2). The ecological environment was gradually improved but rapid urban expansion became an increasing threat.
The area of land-use changes was 17.00 × 10⁴ km2 in Southwest China from 1990 to 2015, and the land-use change intensity was 0.30% (Figure 4a). LCI showed varying characteristics during different phases of the study period. The LCI was 1.24% in 2010–2015, and it was significantly higher than that in 1990–2000 and 2000–2010, with change intensities of 0.05% and 0.10%, respectively. As shown in Figure 4b,c, the LCI showed a low–high–low trend from the northwest to the southeast in 1990–2015. Optimized hotspot analysis showed that low-value clusters of LCI concentrated on the Qinghai-Tibet Plateau and West Sichuan, while high-value clusters concentrated at the junction of Guizhou, Chongqing, Sichuan, Yunnan, and Guangxi (Figure 4c). Moreover, the mean of LCI1 was 1.03%, and it was significantly higher than the mean of LCI2, which was 0.53% (p < 0.01). High-value clusters of LCI1 concentrated in Yunnan and Northwest Guizhou, while low-value clusters concentrated in West Sichuan. High-value clusters of LCI2 concentrated in Sichuan Basin, while low-value clusters concentrated in West Sichuan and Central Yunnan (Figure 4d–g).

3.2. Temporal and Spatial Changes of HQ

The HQ showed a low–high–low trend from southeast to northwest in Southwest China (Figure 5). The high-value areas of HQ concentrated in Guangxi, West Yunnan, Southeast Tibet and West Sichuan, while low-value areas concentrated in the Qinghai-Tibet Plateau, Sichuan Basin, and Yunnan-Guizhou Plateau. The statistical results showed that the mean of HQ in 1990, 2000, 2010, and 2015 were 0.7209, 0.7218, 0.7237, and 0.7227, respectively, with a steady improvement trend. The proportion of area above the higher level of HQ increased from 44.26% to 44.63% during the study period, while the proportion of area below the lower level of HQ decreased from 32.44% to 30.82% (Table S3).
We observed HQ changes with obvious spatial and temporal differences in Southwest China. From 1990 to 2000, the proportion of areas with improved HQ was 25.54%, mainly clustered in the Qinghai-Tibet Plateau, Southeast Sichuan, and Northwest Guangxi (Figure 6a). The proportion of areas with improved HQ was 18.01% in 2000–2010, mainly concentrated in Yunnan-Guizhou Plateau and Western Chongqing (Figure 6b). The areas with improved HQ were relatively scattered in 2000–2010, and the areas with degraded HQ increased significantly (Figure 6c). Statistics results showed that the areas with improved, unchanged, and degraded HQ from 1990 to 2015 accounted for 40.83%, 33.66%, and 25.51% of the total area, respectively. The HQ degradation area was still large, especially in areas with intense human disturbance in the Sichuan Basin, Southeast Yunnan, and Northwest Guangxi and Qinghai-Tibet Plateau (Figure 6d).

3.3. Influencing Factors of HQ

3.3.1. Factor Detection Results

As shown in Table 3, elevation, slope, soil organic matter, ecological land area ratio, fractional vegetation coverage, aboveground biomass, precipitation, contagion, aggregation index, and LCI1 were positively correlated with HQ (p < 0.05). Soil pH, patch density, LCI2, and all socio-economic factors were significantly negatively correlated (p < 0.01). Factor detection results showed that the effects of different factors on HQ were significantly different, and the q statistical value varied between 0.05 and 0.69 (Table 4). The aboveground biomass had the greatest effect contribution to HQ, followed by ecological land area ratio, population density, slope, road density, gross domestic product per unit area, tourists per unit area, LCI2, urbanization rate, contagion, aggregation index, and patch density. The above 12 factors are statistically significant, while the contributions of other factors were not significant.

3.3.2. Interaction Detection Results

The interaction detector analysis showed that the q-statistic value of each pair of factors was larger than the q values of an individual factor, and they varied from 0.32 to 0.93 (Table 5). The results indicated that the combined effect of pairs of factors on HQ was enhanced. Furthermore, the combined effect of most factors showed bivariate enhancement, and only a few factors indicated nonlinear enhancement. Specifically, the combined effect of aboveground biomass and LCI2 showed the maximum value (0.93, bivariate enhanced), followed by the interaction effect of aboveground biomass and ecological land area ratio (0.92, bivariate enhanced), aboveground biomass and population density (0.91, bivariate enhanced), aboveground biomass and patch density (0.91, nonlinear enhancement). Moreover, net primary productivity showed significant nonlinear enhancement with all factors, but it was not a significant contribution factor. It can be seen that the combined interaction of different factors significantly enhanced the impact of an individual factor on HQ.

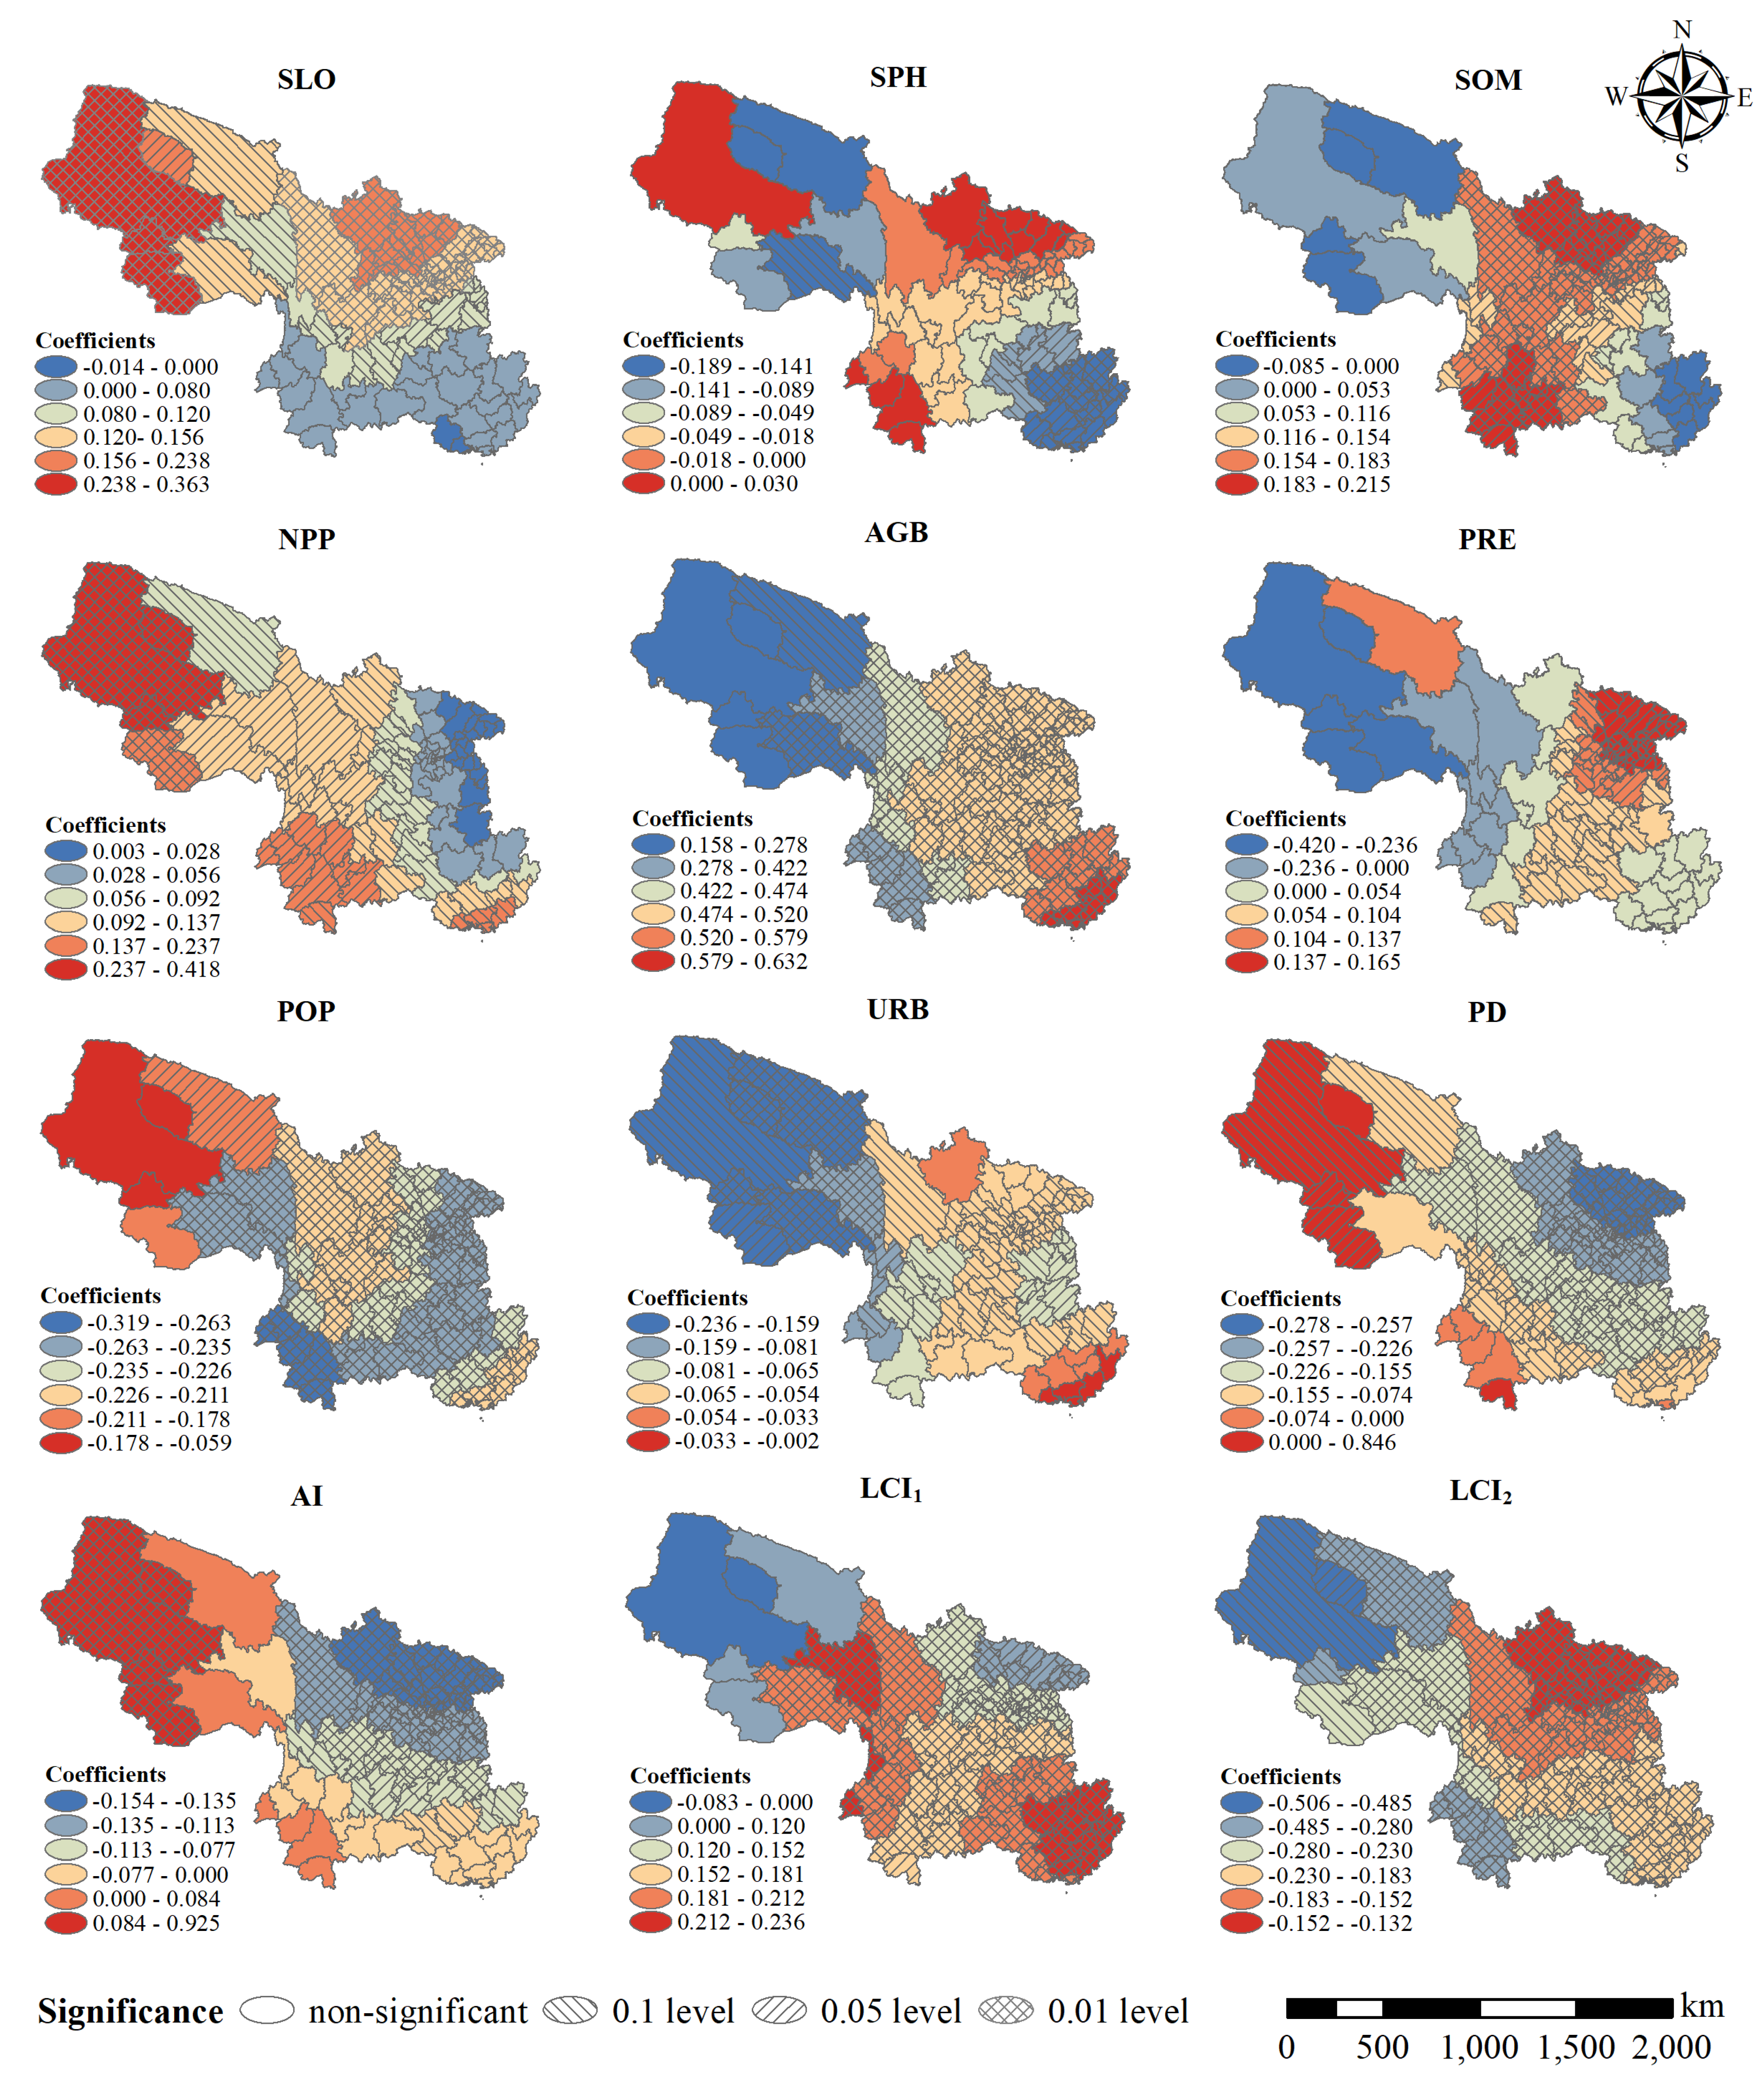
3.3.3. Spatial Heterogeneity of Influencing Factors

According to the results of the Ordinary Least Squares (OLS) model, we excluded the influencing factors of global multicollinearity (VIF > 7.5), and there were 12 factors having a significant influence on spatial difference of HQ (Table S4). As shown in Figure 7, slope showed an obviously positive effect on HQ in Sichuan, Chongqing, and Qinghai-Tibet Plateau, while soil pH had a significant negative effect in Guangxi and Southeast Guizhou. Both soil organic matter and precipitation showed significant positive effects on HQ in Sichuan Basin and Yunnan-Guizhou Plateau. Although both net primary productivity and aboveground biomass showed significant positive effects, their influence changes have different trends. The effect of net primary productivity on HQ gradually increased from northeast to southwest, while aboveground biomass was opposite.
Patch density and aggregation index both showed significant negative effects in the southeast of the study area, but they showed significant positive effects on Northwest Qinghai-Tibet Plateau. Population density, urbanization rate, and LCI2 all showed significant negative effects, but their impacts had obvious spatial differences. Among them, population density had the greatest impact in Sichuan Basin and Yunnan-Guizhou Plateau, and the effects of urbanization rate and LCI2 on HQ gradually increased from northeast to southwest. LCI1 showed an obviously positive effect on HQ, and it had the greatest impact on HQ in Guangxi and Hengduan Mountain. The effects of different influencing factors on HQ had observable spatial heterogeneity, and the combined effects of them generated observable regional differences in HQ in Southwest China.

4. Discussion

4.1. Characteristics of Land-Use Change in the Southwest China

The mild and humid climate and abundant water resources in Southwest China are very conducive to the growth of vegetation resources [38]. The existing forest and grassland covered an area of 175.54 km2 and accounted for 76.52%, providing a suitable habitat for the survival and reproduction of animals and plants [22]. In addition, a landscape pattern of farmland, forest, and grassland gradually transitioned from southeast to northwest in Southwest China. However, the interference of various human activities has caused significant changes in the landscape pattern from 1990 to 2015 [30,41]. As shown in our results, LCI in Southwest China had obvious temporal and spatial differences, and LCI1 was significantly higher than LCI2. Since the 21st century, China has vigorously implemented ecological protection projects and policy measures, including natural forest protection, returning farmland to forests and grasslands, and closing hills for afforestation [41]. These significantly increased forest and grassland area, improved vegetation coverage, and enhanced ecosystem service [20,42,43,44], especially in the Yunnan-Guizhou Plateau and West Yunnan, which also resulted in high LCI1 (Figure S2). Meanwhile, rapid urbanization and high-intensity agricultural production in the Sichuan Basin have led to the conversion of large amounts of forests and grasslands into artificial surfaces and farmland, showing a trend of radial expansion from the inside to the outside, so LCI2 was high in the above areas. Forests and grasslands were dominant ecosystems in the Qinghai-Tibet Plateau and West Sichuan, where human interference was relatively little, so LCI was relatively small overall. Moreover, the increased wetland areas were mainly concentrated in the Qinghai-Tibet Plateau and the lower reaches of the Lancang River, which ensured adequate water demand for the regional plant and animal resources.

4.2. Impacts of Different Driving Factors on HQ

HQ is closely related to the spatial pattern of ecosystem components and is further affected by various natural factors including the terrain, soil quality, precipitation, temperature, vegetation coverage, and human-induced change in land use and land cover [19,45], which have positive or negative influences on HQ [38]. Southwest China has a large area, complex terrain, and diverse climate conditions, which result in obvious regional differences of different natural and anthropogenic factors [30]. Therefore, the impact of different driving factors on HQ has obvious spatial heterogeneity.
Among natural factors, altitude gradient and slope can affect landscape patterns and ecological processes [35,36]. Our results showed that HQ was positively correlated with slope in Southwest Sichuan, West Yunnan and Southeast Tibet. High altitudes and steep slopes provide favorable space for the growth of natural vegetation including forests and grasslands, where vegetation cover and habitat quality were higher [22,46]. In addition, soil quality is also a determinant of terrestrial ecosystem quality [16,47]. Our results showed that soil pH and soil organic matter had negative and positive correlations with HQ, respectively. The decrease of soil organic matter may result in reduced soil fertility and soil quality degradation and further result in HQ degradation [16]. Although precipitation and temperature show little explanatory power for the regional difference of HQ, they are still indispensable factors for the spatial difference of HQ. For example, precipitation and temperature have a significant influence on species composition, ecological functions and processes [36,48], and the further change types and growth status of surface vegetation [35]. The increase in precipitation greatly promotes an increase in habitat suitability and vegetation growth [38,48], but excessive precipitation can easily induce disasters such as landslides and mudslides, intensify soil erosion, and negatively affect HQ.
Human activities including rapid urban expansion, agricultural production, overgrazing, mineral exploitation, and water conservancy projects are important drivers of temporal and spatial changes in HQ [22,35,38,49]. Alpine grassland and alpine desert were dominant ecosystems in Central and North Tibet and South Qinghai, where overgrazing activities directly affected the plant species on grassland and damaged the vegetation growth state [50]. The study showed that grazing was the major external influencing factor that caused HQ degradation in the above areas, but moderate grazing activities can improve HQ [51]. Moreover, fenced grazing and pastureland rehabilitation have gradually reduced grazing intensity and largely improved regional HQ [52]. Rapid and disorderly urban expansion and intensive agricultural production occupied large amounts of ecological land and changed ecosystem components and landscape patterns [37,38], which further lead to fragmentation, the loss of potential habitats, and decreased landscape connectivity [6,20]. As our results showed that the LCI2 had a negative impact on HQ, they were consistent with the research conducted by Yohannes et al. [16] and Zhang et al. [53]. In addition, a large number of water conservancy projects and cascade dam construction in the Lancang River and Jinsha River Basin will affect river connectivity, cause changes in physical and chemical properties including water volume, flow velocity, water temperature, and water quality, and pose significant threats to aquatic habitats [32,49]. On the contrary, various ecological protection projects and management measures such as natural forest conservation, returning farmland to forests, and closing hills for afforestation have promoted the conversion of low-quality habitats to high-quality habitats, which has an important positive effect on improving ecological environment quality and maintaining biodiversity [42,54]. Therefore, the effects of different natural conditions on HQ have obvious spatial heterogeneity, and various human activities and management policies will strengthen or weaken these impacts.

4.3. Ecological Protection and Regional Sustainable Development

Southwest China is an integral part of the Chinese ecological security pattern of Two Barriers and Three Belts, and it is an important global biodiversity hotspot [30]. Understanding the temporal and spatial changes of HQ and their potential influencing factors is essential for managers and decision makers to adopt sustainable management strategies, maintain regional ecosystem health, and protect biodiversity [2,36]. These study results showed that the HQ gradually improved in Southwest China, but there were observable temporal and spatial differences. Especially in the Sichuan Basin, Northwest Guizhou, Southwest Guangxi, and Northwest Qinghai-Tibet Plateau, the HQ was relatively low and showed a deteriorating trend. Protecting the ecological environment and maintaining biodiversity are still essential tasks for related government departments in Southwest China. Therefore, this study proposes the following countermeasures and suggestions to provide a decision-making reference for ecological protection:
Land development and utilization should reasonably control the transition from high-quality habitats to low-quality habitats. Especially on the Qinghai-Tibet Plateau, controlling overgrazing must attract more attention to enhance vegetation conservation and avoid the continuous degradation of alpine grasslands. In addition, the reasonable layout of urban development pattern is significant to avoid disorderly urban expansion and protect ecological land. For farming areas with low HQ, relevant departments should encourage ecological agriculture and reduce the use of pesticides and fertilizers that threaten the survival of animals and plants, to increase the biodiversity of the farmland system.
Promoting ecological protection, restoration, and governance helps to increase the number of high-quality habitats. For forest and grass ecosystems with low vegetation coverage and degraded vegetation, strengthening forest and grass planting to increase the quantity and quality of vegetation is essential for improving the ecosystem service. For the wetland ecosystem, river dredging and vegetation buffer construction are conducive to increasing water system connectivity and improving the aquatic habitat. Urban built-up areas should reasonably increase urban green spaces to improve urban HQ. In mining areas or agricultural planting areas, it is important to implement land leveling, soil improvement, and vegetation restoration to increase surface vegetation coverage and improve HQ.
Optimizing the system of nature reserves is essential. Natural reserves are still an important form of improving HQ and protecting biodiversity, and need to be further improved, integrated, and optimized [2]. Local departments should formulate long-term sustainable protection plans and scientifically delineate the core areas, buffer areas, and planning management areas of nature reserves, and prohibit or strictly control human activities in nature reserves to avoid potential interference to the animals and plants. Moreover, regularly evaluating ecological protection effectiveness is essential to understand the dynamic characteristics of the ecosystem and the number of biological species, which helps to better adjust and optimize the scope of natural reserves and maintain biodiversity.

4.4. Strengths and Limitations of the Study

This study analyzed LCI in Southwest China from the spatial dimension and further quantified the change intensity of different types of habitats transforming into each other. These results help us to understand the spatial characteristics of regional land-use change and formulate sustainable land development and utilization strategies. In addition, this study explored potential driving factors of regional HQ changes and further analyzed the spatial heterogeneity of the impact of the main influencing factors on HQ, which helps us to understand the key drivers of HQ changes in different regions, and they are essential for the precise implementation of ecological protection measures and the optimization of ecological security patterns.
However, this research has some shortcomings. First, the assignment of the threat factor weight, maximum threat distance, and habitat suitability and sensitivity required for the HQ evaluation was subjective, which affected the accuracy of the evaluation results. Second, this study only analyzed the spatial heterogeneity of these factors affecting habitat quality in a single period and at a single spatial scale, without considering the spatiotemporal scaling effect of these factors affecting habitat quality. Moreover, this study focused on the individual and joint action of pairs of factors affecting habitat quality, but it lacks the study of the multiple combination effects of the factors affecting regional habitat quality. Future studies will further analyze the spatiotemporal scaling effect and multiple combination effects of factors affecting habitat quality and understand the characteristics of temporal and spatial changes in influencing factors to better support ecological environment management and biodiversity conservation.

5. Conclusions

Understanding the spatial and temporal changes of regional HQ and driving factors is essential for effective differentiated ecosystem management and biodiversity conservation. Our research results showed noticeable temporal and spatial differences in LCI in Southwest China from 1990 to 2015, and LCI1 was significantly higher than LCI2. The HQ steadily increased and showed a trend of low–high–low from the northwest to the southeast, and the area of degraded HQ increased significantly from 2010 to 2015. There are 12 factors including aboveground biomass, population density, slope, LCI2, and so on, having a significant effect on the spatial distribution pattern of HQ, and the effect of LCI2 on the spatial difference of HQ was greater than that of LCI1. Moreover, the effects of different factors on HQ showed obvious spatial heterogeneity. Therefore, the principal task of ecological environmental protection in Southwest China is to rationally control land development and utilization, implement ecological protection and restoration, and improve the system of nature reserves, and this will help to comprehensively improve the ecosystem service, protect biodiversity, and ensure human well-being.

Supplementary Materials

The following supporting information can be downloaded at: https://www.mdpi.com/article/10.3390/land12020346/s1, Table S1: The threat factors and their maximum threat distance, weight and spatial decay type; Table S2: The sensitivity of different habitat types to threat factors; Table S3. The area and ratio of different levels of habitat quality in Southwest China; Table S4. The parameter statistics results for geographical weighted regression; Figure S1: Spatial distribution of different driving factors affecting habitat quality; Figure S2: Spatial change of land-use types in Southwest China from 1990 to 2015 (Note: Grass—Grassland; Farm—Farmland; Water—Waterbody; .AS —Artificial surface; Unused—Unused land).

Author Contributions

Conceptualization, M.T. and H.D.; methodology, M.T. and T.L.; software, T.L.; validation, T.L., M.T. and H.D.; formal analysis, T.L., and R.B.; investigation, T.L., R.B. and L.L.; data curation, T.L., R.B. and L.L.; writing—original draft preparation, T.L.; writing—review and editing, T.L., R.B., L.L., M.T. and H.D.; visualization, T.L. and L.L.; supervision, M.T. and H.D.; project administration, M.T. and H.D.; funding acquisition, M.T. and H.D. All authors have read and agreed to the published version of the manuscript.

Funding

This research was funded by the Second Tibetan Plateau Scientific Expedition and Research (grant number 2019QZKK04020104) and the National Key Research and Development Program (grant number 2016YFC0502106).

Data Availability Statement

Not applicable.

Conflicts of Interest

The authors declare no conflict of interest.

References

  1. Peng, J.; Xu, X.; Wu, J.; Deng, K.; Hu, T. Spatial differentiation of habitat quality in typical tourist city and their influencing factors mechanisms: A case study of Huangshan City. Resour. Environ. Yangtze Basin 2019, 28, 2397–2409. [Google Scholar]
  2. Huang, M.; Yue, W.; Feng, S.; Zhang, J. Spatial-temporal evolution of habitat quality and analysis of landscape patterns in Dabie Mountain area of west Anhui province based on InVEST model. Acta Ecol. Sin. 2020, 40, 2895–2906. [Google Scholar]
  3. Poniatowski, D.; Stuhldreher, G.; Löffler, F.; Fartmann, T. Patch occupancy of grassland specialists: Habitat quality matters more than habitat connectivity. Biol. Conserv. 2018, 225, 237–244. [Google Scholar]
  4. Sallustio, L.; De Toni, A.; Strollo, A.; Di Febbraro, M.; Gissi, E.; Casella, L.; Geneletti, D.; Munafò, M.; Vizzarri, M.; Marchetti, M. Assessing habitat quality in relation to the spatial distribution of protected areas in Italy. J. Environ. Manage. 2017, 201, 129–137. [Google Scholar] [CrossRef] [PubMed]
  5. Sun, X.; Jiang, Z.; Liu, F.; Zhang, D. Monitoring spatio-temporal dynamics of habitat quality in Nansihu Lake basin, eastern China, from 1980 to 2015. Ecol. Indic. 2019, 102, 716–723. [Google Scholar] [CrossRef]
  6. Wilson, M.C.; Chen, X.-Y.; Corlett, R.T.; Didham, R.K.; Ding, P.; Holt, R.D.; Holyoak, M.; Hu, G.; Hughes, A.C.; Jiang, L.; et al. Habitat fragmentation and biodiversity conservation: Key findings and future challenges. Landsc. Ecol. 2016, 31, 219–227. [Google Scholar] [CrossRef] [Green Version]
  7. Wang, Z.; Li, Y.; Luo, J.; Liu, F.; Wang, Y.; Li, H. Spatio-temporal evolution of habitat quality in the Nenjiang River Basin, Northeast China. Environ. Ecol. 2020, 2, 19–26. [Google Scholar]
  8. Liang, X.; Yuan, L.; Ning, L.; Song, C.; Cheng, C.; Wang, X. Spatial pattern of habitat quality and driving factors in Heilongjiang Province. J. Beijing Norm. Univ. Nat. Sci. 2020, 56, 864–872. [Google Scholar]
  9. Ouyang, Z.; Liu, J.; Xiao, H.; Tan, Y.; Zhang, H. An assessment of giant panda habitat in Wolong Nature Reserve. Acta Ecol. Sin. 2001, 21, 1869–1874. [Google Scholar]
  10. Vellend, M.; Lilley, P.L.; Starzomski, B.M. Using subsets of species in biodiversity surveys. J. Appl. Ecol. 2008, 45, 161–169. [Google Scholar] [CrossRef]
  11. Tang, F.; Fu, M.; Wang, L.; Zhang, P. Land-use change in Changli County, China: Predicting its spatio-temporal evolution in habitat quality. Ecol. Indic. 2020, 117, 106719. [Google Scholar] [CrossRef]
  12. Yang, B.; Zhang, J.; Wang, B.; Gong, X.; Duan, C.; Zhang, Y. The habitat suitability evaluation of Salweenia bouffordiana based on MaxEnt model. Acta Ecol. Sin. 2020, 40, 6077–6085. [Google Scholar]
  13. Vayghan, A.H.; Fazli, H.; Ghorbani, R.; Lee, M.-A.; Saravi, H.N. Temporal habitat suitability modeling of Caspian shad (Alosa spp.) in the southern Caspian Sea. J. Limnol. 2015, 75, 210–223. [Google Scholar] [CrossRef]
  14. Riedler, B.; Lang, S. A spatially explicit patch model of habitat quality, integrating spatio-structural indicators. Ecol. Indic. 2018, 94, 128–141. [Google Scholar] [CrossRef]
  15. Terrado, M.; Sabater, S.; Chaplin-Kramer, B.; Mandle, L.; Ziv, G.; Acuña, V. Model development for the assessment of terrestrial and aquatic habitat quality in conservation planning. Sci. Total. Environ. 2016, 540, 63–70. [Google Scholar] [CrossRef] [PubMed] [Green Version]
  16. Yohannes, H.; Soromessa, T.; Argaw, M.; Dewan, A. Spatio-temporal changes in habitat quality and linkage with landscape characteristics in the Beressa watershed, Blue Nile basin of Ethiopian highlands. J. Environ. Manage. 2021, 281, 111885. [Google Scholar] [CrossRef] [PubMed]
  17. Choudhary, A.; Deval, K.; Joshi, P.K. Study of habitat quality assessment using geospatial techniques in Keoladeo National Park, India. Environ. Sci. Pollut. Res. 2021, 28, 14105–14114. [Google Scholar] [CrossRef]
  18. Zhang, X.; Song, W.; Lang, Y.; Feng, X.; Yuan, Q.; Wang, J. Land use changes in the coastal zone of China’s Hebei Province and the corresponding impacts on habitat quality. Land Use Policy 2020, 99, 104957. [Google Scholar] [CrossRef]
  19. Yan, S.; Wang, X.; Cai, Y.; Li, C.; Yan, R.; Cui, G.; Yang, Z. An integrated investigation of spatiotemporal habitat quality dynamics and driving forces in the Upper Basin of Miyun Reservoir, North China. Sustainability 2018, 10, 4625. [Google Scholar] [CrossRef] [Green Version]
  20. Huang, L.; Shao, Q.; Liu, J.; Lu, Q. Improving ecological conservation and restoration through payment for ecosystem services in Northeastern Tibetan Plateau, China. Ecosyst. Serv. 2018, 31, 181–193. [Google Scholar] [CrossRef]
  21. Krauss, J.; Bommarco, R.; Guardiola, M.; Heikkinen, R.K.; Helm, A.; Kuussaari, M.; Lindborg, R.; Öckinger, E.; Pärtel, M.; Pino, J.; et al. Habitat fragmentation causes immediate and time-delayed biodiversity loss at different trophic levels. Ecol. Lett. 2010, 13, 597–605. [Google Scholar] [CrossRef] [PubMed] [Green Version]
  22. Liu, Y.; Liu, S.; Wang, F.; Sun, Y.; Li, M.; Wang, Q.; Yu, L. Responses of Habitat Quality and Animal Biodiversity to Grazing Activities on the Qinghai-Tibet Plateau. Front. Ecol. Evol. 2021, 9, 349. [Google Scholar] [CrossRef]
  23. Sharma, R.; Nehren, U.; Rahman, S.A.; Meyer, M.; Rimal, B.; Aria Seta, G.; Baral, H. Modeling Land Use and Land Cover Changes and Their Effects on Biodiversity in Central Kalimantan, Indonesia. Land 2018, 7, 57. [Google Scholar] [CrossRef] [Green Version]
  24. Aguilar, R.; Cristóbal-Pérez, E.J.; Balvino-Olvera, F.J.; Aguilar-Aguilar, M.; Aguirre-Acosta, N.; Ashworth, L.; Lobo, J.A.; Martén-Rodríguez, S.; Fuchs, E.J.; Sanchez-Montoya, G.; et al. Habitat fragmentation reduces plant progeny quality: A global synthesis. Ecol. Lett. 2019, 22, 1163–1173. [Google Scholar] [CrossRef] [PubMed] [Green Version]
  25. Li, S.; Liu, J.; Lin, J.; Fan, S. Spatial and temporal evolution of habitat quality in Fujian Province, China based on the land use chance from 1980 to 2018. Chin. J. Appl. Ecol. 2020, 31, 4080–4090. [Google Scholar]
  26. Wang, H.; Tang, L.; Qiu, Q.; Chen, H. Assessing the Impacts of Urban Expansion on Habitat Quality by Combining the Concepts of Land Use, Landscape, and Habitat in Two Urban Agglomerations in China. Sustain. Basel 2020, 12, 4346. [Google Scholar] [CrossRef]
  27. Zhu, C.; Zhang, X.; Zhou, M.; He, S.; Gan, M.; Yang, L.; Wang, K. Impacts of urbanization and landscape pattern on habitat quality using OLS and GWR models in Hangzhou, China. Ecol. Indic. 2020, 117, 106654. [Google Scholar] [CrossRef]
  28. Wang, J.; Zhang, T.; Fu, B. A measure of spatial stra.atified heterogeneity. Ecol. Indic. 2016, 67, 250–256. [Google Scholar] [CrossRef]
  29. Zhu, Z.; Alimujiang, K. Spatial-temporal evolution of habitat quality in Yili Valley based on geographical detector and its influencing factors. Chin. J. Ecol. 2020, 39, 3408–3420. [Google Scholar]
  30. Liu, G. Formation and evolution mechanism of ecological security pattern in Southwest China. Acta Ecol. Sin. 2016, 36, 7088–7091. [Google Scholar]
  31. Ouyang, Z.; Xu, W.; Xiao, Y.; Zheng, H.; Zhang, L. Challenges and strategies for China’s ecological security in the New Era. Think Tank: Theory Pract. 2016, 1, 33–41. [Google Scholar]
  32. Wang, Y.; Lei, X.; Wen, X.; Fang, G.; Tan, Q.; Tian, Y.; Wang, C. Effects of damming and climatic change on the eco-hydrological system: A case study in the Yalong River, southwest China. Ecol. Indic. 2018, 105, 663–674. [Google Scholar] [CrossRef]
  33. Li, X. Regional Historical Geography: Geopolitics, Regional Economy and Culture; Peking University Press: Beijing, China, 2004. [Google Scholar]
  34. Aldwaik, S.Z.; Pontius, R.G., Jr. Intensity analysis to unify measurements of size and stationarity of land changes by interval, category, and transition. Landsc. Urban Plan. 2012, 106, 103–114. [Google Scholar] [CrossRef]
  35. Fang, Z.; Bai, Y.; Jiang, B.; Alatalo, J.M.; Liu, G.; Wang, H. Quantifying variations in ecosystem services in altitude-associated vegetation types in a tropical region of China. Sci. Total. Environ. 2020, 726, 138565. [Google Scholar] [CrossRef]
  36. Schirpke, U.; Tscholl, S.; Tasser, E. Spatio-temporal changes in ecosystem service values: Effects of land-use changes from past to future (1860–2100). J. Environ. Manage. 2020, 272, 111068. [Google Scholar]
  37. Yang, Z.; Bai, Y.; Alatalo, J.M.; Huang, Z.; Yang, F.; Pu, X.; Wang, R.; Yang, W.; Guo, X. Spatio-temporal variation in potential habitats for rare and endangered plants and habitat conservation based on the maximum entropy model. Sci. Total. Environ. 2021, 784, 147080s. [Google Scholar] [CrossRef] [PubMed]
  38. Zhou, L.; Tang, J.; Liu, X.; Dang, M.; Mu, H. Effects of urban expansion on habitat quality in densely populated areas on the Loess Pla-teau: A case study of Lanzhou,Xi’an-Xianyang and Taiyuan, China. Chin. J. Appl. Ecol. 2021, 32, 261–270. [Google Scholar]
  39. Lin, Y.; Hu, X.; Zheng, X.; Hou, X.; Zhang, Z.; Zhou, X.; Qiu, R.; Lin, J. Spatial variations in the relationships between road network and landscape ecological risks in the highest forest coverage region of China. Ecol. Indic. 2019, 96, 392–403. [Google Scholar] [CrossRef]
  40. Li, T.; Zheng, X.; Wu, J.; Zhang, Y.; Fu, X.; Deng, H. Spatial relationship between green view index and normalized differential vegetation index within the Sixth Ring Road of Beijing. Urban For. Urban Green. 2021, 62, 127153. [Google Scholar] [CrossRef]
  41. Ma, H.-Y.; Zhang, L.-L.; Wei, X.-Q.; Shi, T.-T.; Chen, T.-X. Spatial and temporal variations of land use and vegetation cover in Southwest China from 2000 to 2015. Chin. J. Appl. Ecol. 2021, 32, 618–628. [Google Scholar]
  42. Lu, F.; Hu, H.; Sun, W.; Zhu, J.; Liu, G.; Zhou, W.; Zhang, Q.; Shi, P.; Liu, X.; Wu, X.; et al. Effects of national ecological restoration projects on carbon sequestration in China from 2001 to 2010. Proc. Natl. Acad. Sci. USA 2018, 115, 4039–4044. [Google Scholar] [CrossRef] [Green Version]
  43. Qiao, Y.; Jiang, Y.; Zhang, C. Contribution of karst ecological restoration engineering to vegetation greening in southwest China during recent decade. Ecol. Indic. 2021, 121, 107081. [Google Scholar] [CrossRef]
  44. Wang, B.; Gao, P.; Niu, X.; Sun, J. Policy-driven China’s Grain to Green Program: Implications for ecosystem services. Ecosyst. Serv. 2017, 27, 38–47. [Google Scholar] [CrossRef]
  45. Fu, B.; Wang, S.; Su, C.; Forsius, M. Linking ecosystem processes and ecosystem services. Curr. Opin. Environ. Sustain. 2013, 5, 4–10. [Google Scholar] [CrossRef]
  46. Wei, H.; Duan, R.; Xu, Q.; Yang, S.; Fan, Q.; Hou, G.; Du, Y.; Qin, Z.; Gao, J. Fungal spore indicators of vegetation and highland pastoralism in modern topsoil and dung, eastern Tibetan Plateau. Catena 2021, 202, 105231. [Google Scholar] [CrossRef]
  47. Havlicek, E.; Mitchell, E.A.D. Soils Supporting Biodiversity. In Interactions in Soil: Promoting Plant Growth, Biodiversity, Community and Ecosystems, Dighton, J., Krumins, J.A., Eds.; Springer: Berlin/Heidelberg, Germany, 2014. [Google Scholar]
  48. Sun, Y.; Liu, S.; Liu, Y.; Dong, Y.; Li, M.; An, Y.; Shi, F.; Beazley, R. Effects of the interaction among climate, terrain and human activities on biodiversity on the Qinghai-Tibet Plateau. Sci. Total. Environ. 2021, 794, 148497. [Google Scholar] [CrossRef]
  49. Fan, H.; He, D.; Wang, H. Environmental consequences of damming the mainstream Lancang-Mekong River: A review. Earth Sci. Rev. 2015, 146, 77–91. [Google Scholar] [CrossRef]
  50. Li, L.; Tietze, D.T.; Fritz, A.; Lü, Z.; Bürgi, M.; Storch, I. Rewilding cultural landscape potentially puts both avian diversity and endemism at risk: A Tibetan Plateau case study. Biol. Conserv. 2018, 224, 75–86. [Google Scholar] [CrossRef]
  51. Dong, S.; Shang, Z.; Gao, J.; Boone, R.B. Enhancing sustainability of grassland ecosystems through ecological restoration and grazing management in an era of climate change on Qinghai-Tibetan Plateau. Agric. Ecosyst. Environ. 2020, 287, 106684. [Google Scholar] [CrossRef]
  52. Sun, J.; Liu, M.; Fu, B.; Kemp, D.; Zhao, W.; Liu, G.; Han, G.; Wilkes, A.; Lu, X.; Chen, Y.; et al. Reconsidering the efficiency of grazing exclusion using fences on the Tibetan Plateau. Sci. Bull. 2020, 65, 1405–1414. [Google Scholar] [CrossRef] [PubMed]
  53. Zhang, H.; Lang, Y. Quantifying and Analyzing the Responses of Habitat Quality to Land Use Change in Guangdong Province, China over the Past 40 Years. Land 2022, 11, 817. [Google Scholar] [CrossRef]
  54. Xu, H.; Liu, K.; Ning, T.; Huang, G.; Zhang, Q.; Li, Y.; Wang, M.; Fan, Y.; An, W.; Ji, L.; et al. Environmental remediation promotes the restoration of biodiversity in the Shenzhen Bay Estuary, South China. Ecosyst. Health Sustain. 2022, 8, 2026250. [Google Scholar] [CrossRef]
Figure 1. Location of the study area.
Land 12 00346 g001
Figure 2. Overall research process and framework.
Land 12 00346 g002
Figure 3. Spatial distribution of land-use type in Southwest China from 1990 to 2015.
Land 12 00346 g003
Figure 4. Temporal and spatial change of LCI in Southwest China from 1990 to 2015.
Land 12 00346 g004
Figure 5. Spatial distribution of HQ in Southwest China from 1990 to 2015.
Land 12 00346 g005
Figure 6. Spatial distribution of HQ changes in Southwest China.
Land 12 00346 g006
Figure 7. Spatial patterns of regression coefficients between HQ and main influencing factors.
Land 12 00346 g007
Table 1. Types of interaction between two variables.
CriterionType of Interaction
  q x 1 x 2 < Min q x 1 , q x 2 Nonlinear weaken
  Min q x 1 , q x 2 < q x 1 x 2 < Max q x 1 , q x 2 Weaken, univariate
  q x 1 x 2 > Max q x 1 , q x 2 Bivariate enhancement
  q x 1 x 2 = q x 1 + q x 2 Independent
  q x 1 x 2 < q x 1 + q x 2 Nonlinear enhancement
Note:  q x 1  is the  q  values of impact factors  x 1 q x 2  is the  q  values of impact factors  x 2 q x 1 x 2  is the  q  value jointly affected by  x 1  and  x 2 .
Table 2. Area coverage and change of different land-use types from 1990 to 2015.
Land-Use TypeArea (104 km2)Percent (%)Change (%)
199020002010201519902000201020151990–2015
Forest94.5494.7495.6195.5041.2141.3041.6841.631.02
Grassland80.3380.2580.1980.0435.0234.9834.9634.89−0.36
Farmland32.1531.8630.4830.0014.0213.8913.2913.08−6.69
Waterbody7.157.367.627.803.123.213.323.409.09
Artificial surface1.371.511.852.370.600.660.811.0372.99
Unused land13.8513.6813.6413.696.045.965.955.97−1.16
Table 3. Pearson correlation coefficient of HQ and different driving factors.
Physical GeographyEco-HydrologySocio-EconomicLandscape Pattern
FactorsR2FactorsR2FactorsR2FactorsR2
ELE0.23 **FVC0.38 ***GDP−0.39 ***ELA0.83 ***
SLO0.68 ***NPP0.02 *POP−0.47 ***PD−0.39 ***
SPH−0.55 ***AGB0.81 ***URB−0.57 ***CON0.63 ***
SOM0.40 ***PRE0.22 **RD−0.58 ***AI0.43 ***
TEM−0.08 *TOU−0.38 ***LCI10.43 ***
LCI2−0.63 ***
Note: *** indicates that q value is significant at the 0.01 level (two-tailed); ** indicates that q value is significant at the 0.05 level (two-tailed); * indicates that q value is not significant. ELE indicates elevation. SLO indicates slope. SPH indicates soil pH. SOM indicates soil organic matter. FVC indicates fractional vegetation coverage. NPP indicates net primary productivity. ABB indicates aboveground biomass. PRE indicates precipitation. TEM indicates temperature. GDP indicates gross domestic product per unit area. POP indicates population density. URB indicates urbanization rate. ROD indicates road density. TOU indicates tourist per unit area. ELA indicates ecological land area ratio (percentage of forest, grassland, and water bodies in total area). PD indicates patch density. CON indicates contagion. AI indicates aggregation index.
Table 4. The factor detection results of different driving factors on HQ.
Physical GeographyEco-HydrologySocio-EconomicLandscape Pattern
FactorsqFactorsqFactorsqFactorsq
ELE0.26 *FVC0.24 *GDP0.53 ***ELA0.67 ***
SLO0.57 ***NPP0.05 *POP0.63 ***PD0.20 ***
SPH0.27 *AGB0.69 ***URB0.43 ***CON0.42 ***
SOM0.23 *PRE0.16 *RD0.57 ***AI0.21 **
TEM0.25 *TOU0.50 ***LCI10.21 *
LCI20.47 ***
Note: *** indicates that q value is significant at the 0.01 level (two-tailed); ** indicates that q value is significant at the 0.05 level (two-tailed); * indicates that q value is not significant.
Table 5. Interaction detection results of factors influencing habitat quality in Southwest China.
ELESLOSPHSOMFVCNPPAGBPRETEMGDPPOPURBRDTOUELAPDCONAILCI1LCI2
ELE0.26*************************
SLO0.650.57********************
SPH0.620.790.27***********************
SOM0.380.630.550.23*********************
FVC0.620.710.490.540.24*********************
NPP0.510.730.380.510.520.05****************************
AGB0.880.860.780.890.740.900.69***************
PRE0.640.760.410.530.500.490.890.16****************
TEM0.510.740.620.480.620.430.890.580.25*************
GDP0.580.710.750.620.640.640.890.690.670.53**********
POP0.690.760.800.670.750.740.910.800.730.640.63*********
URB0.590.700.700.570.570.580.880.600.570.660.710.43**********
RD0.670.750.770.620.670.670.900.690.650.590.670.670.57*******
TOU0.610.740.680.620.690.650.870.660.640.610.670.610.620.50******
ELA0.790.810.820.730.880.900.920.830.810.820.820.870.850.790.67*****
PD0.580.730.580.590.580.550.910.510.500.650.700.640.660.620.810.20*****
CON0.620.840.700.620.590.710.850.610.650.680.720.610.710.640.810.530.42****
AI0.510.770.490.430.560.580.860.380.470.700.720.620.690.670.730.320.530.21***
LCI10.430.700.490.450.640.440.770.530.570.720.740.650.720.680.750.660.690.530.21**
LCI20.580.760.690.610.710.700.930.630.610.720.760.760.730.710.780.650.680.610.740.47
Note: * indicates that the interactive relationship is bivariate enhanced; ** indicates that the interactive relationship is nonlinear enhancement.
Disclaimer/Publisher’s Note: The statements, opinions and data contained in all publications are solely those of the individual author(s) and contributor(s) and not of MDPI and/or the editor(s). MDPI and/or the editor(s) disclaim responsibility for any injury to people or property resulting from any ideas, methods, instructions or products referred to in the content.

