

Spatiotemporal Dynamics and Driving Forces of Ecological Environment Quality in Coastal Cities: A Remote Sensing and Land Use Perspective in Changle District, Fuzhou


Abstract
:1. Introduction
2. Methods
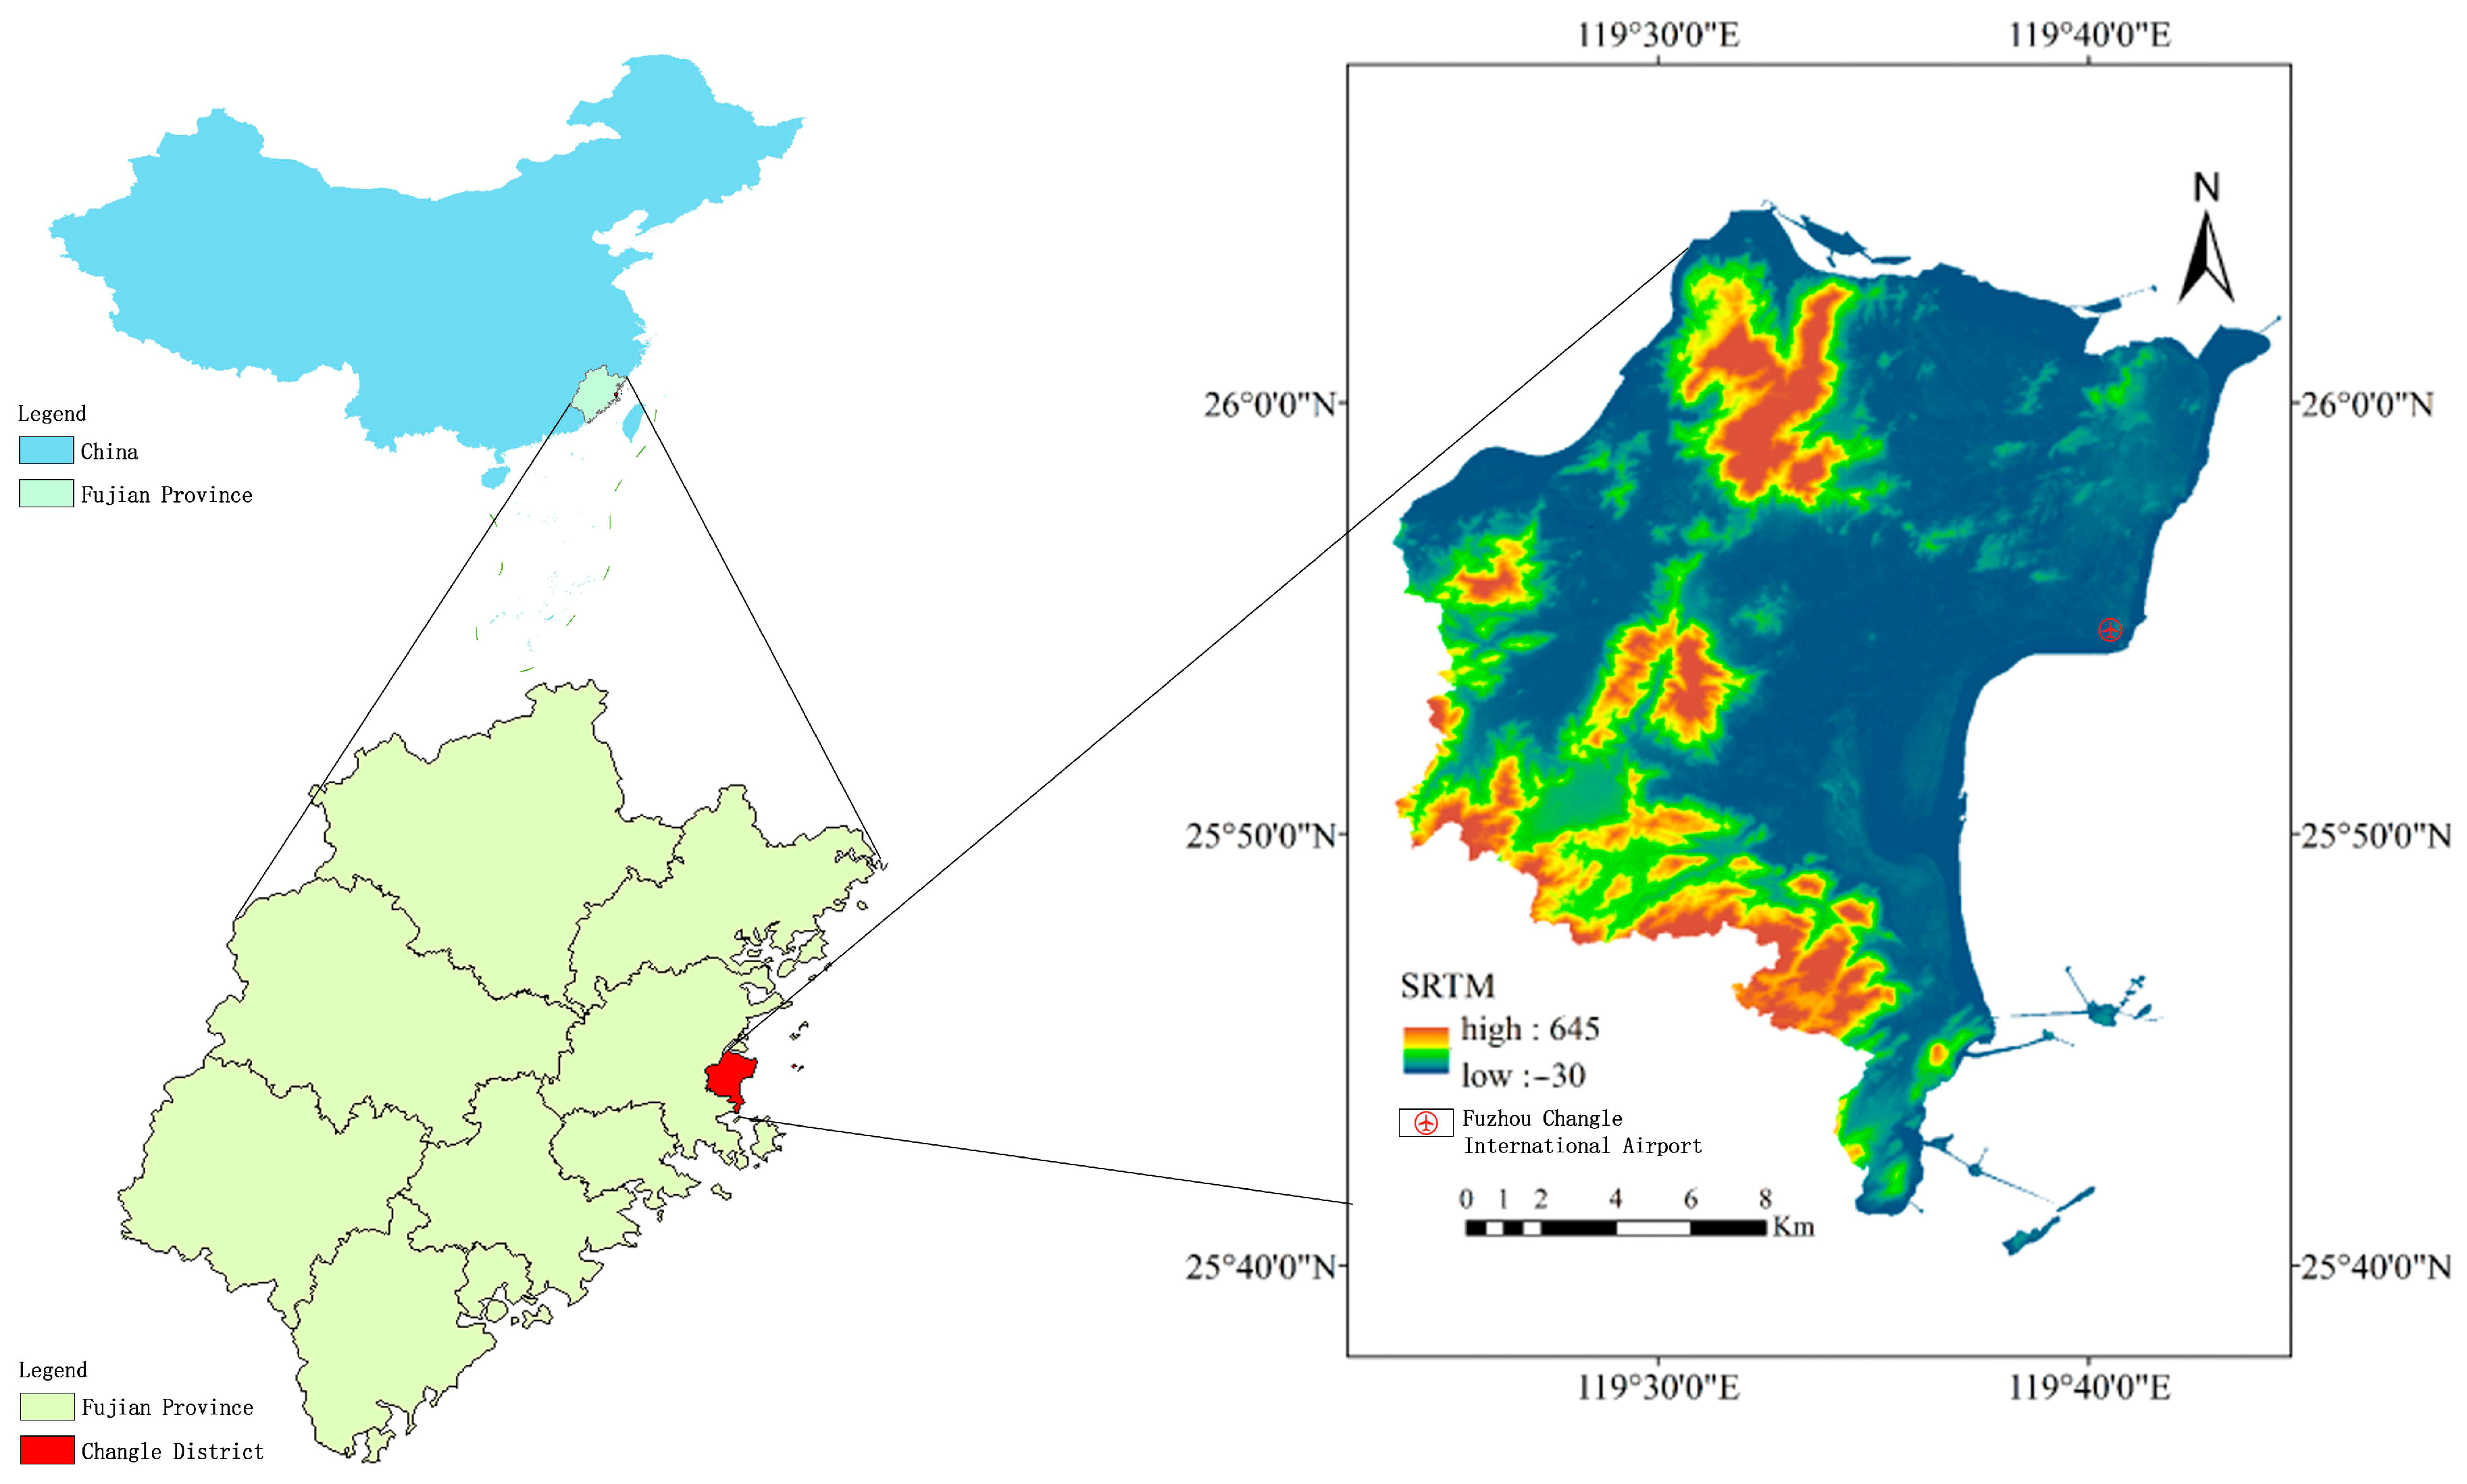
2.1. Study Area
2.2. Data Sources
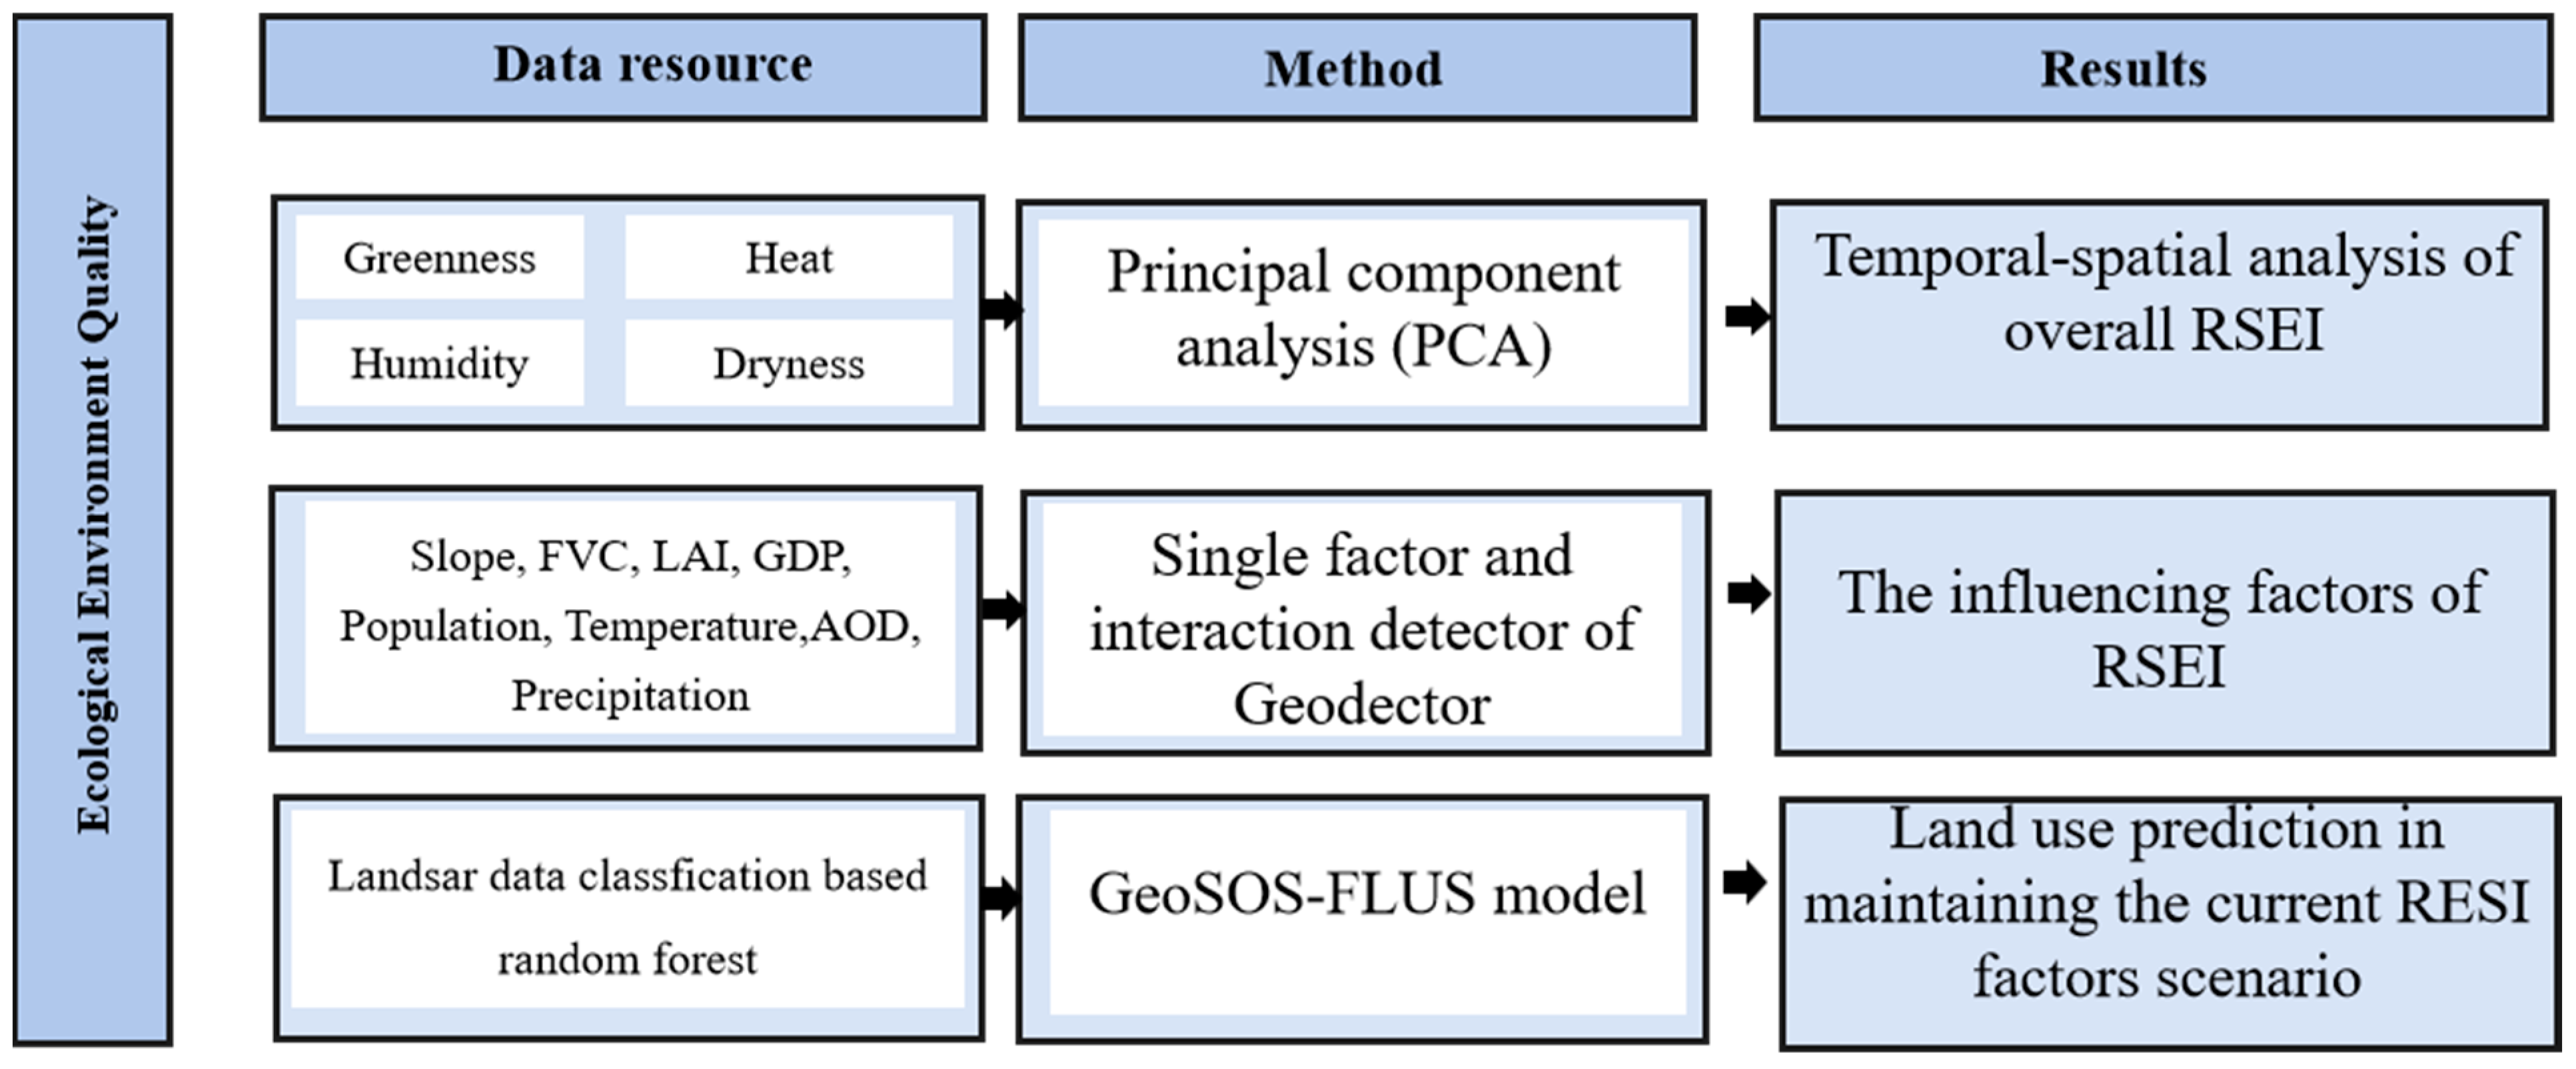
2.3. Technical Route
2.4. Research Methods
2.4.1. Remote Sensing Ecological Index
- (1)
- Greenness Index
- (2)
- Humidity index
- (3)
- Dryness index
- (4)
- Heat indicator
- (5)
- Principal component analysis
2.4.2. Geodetector
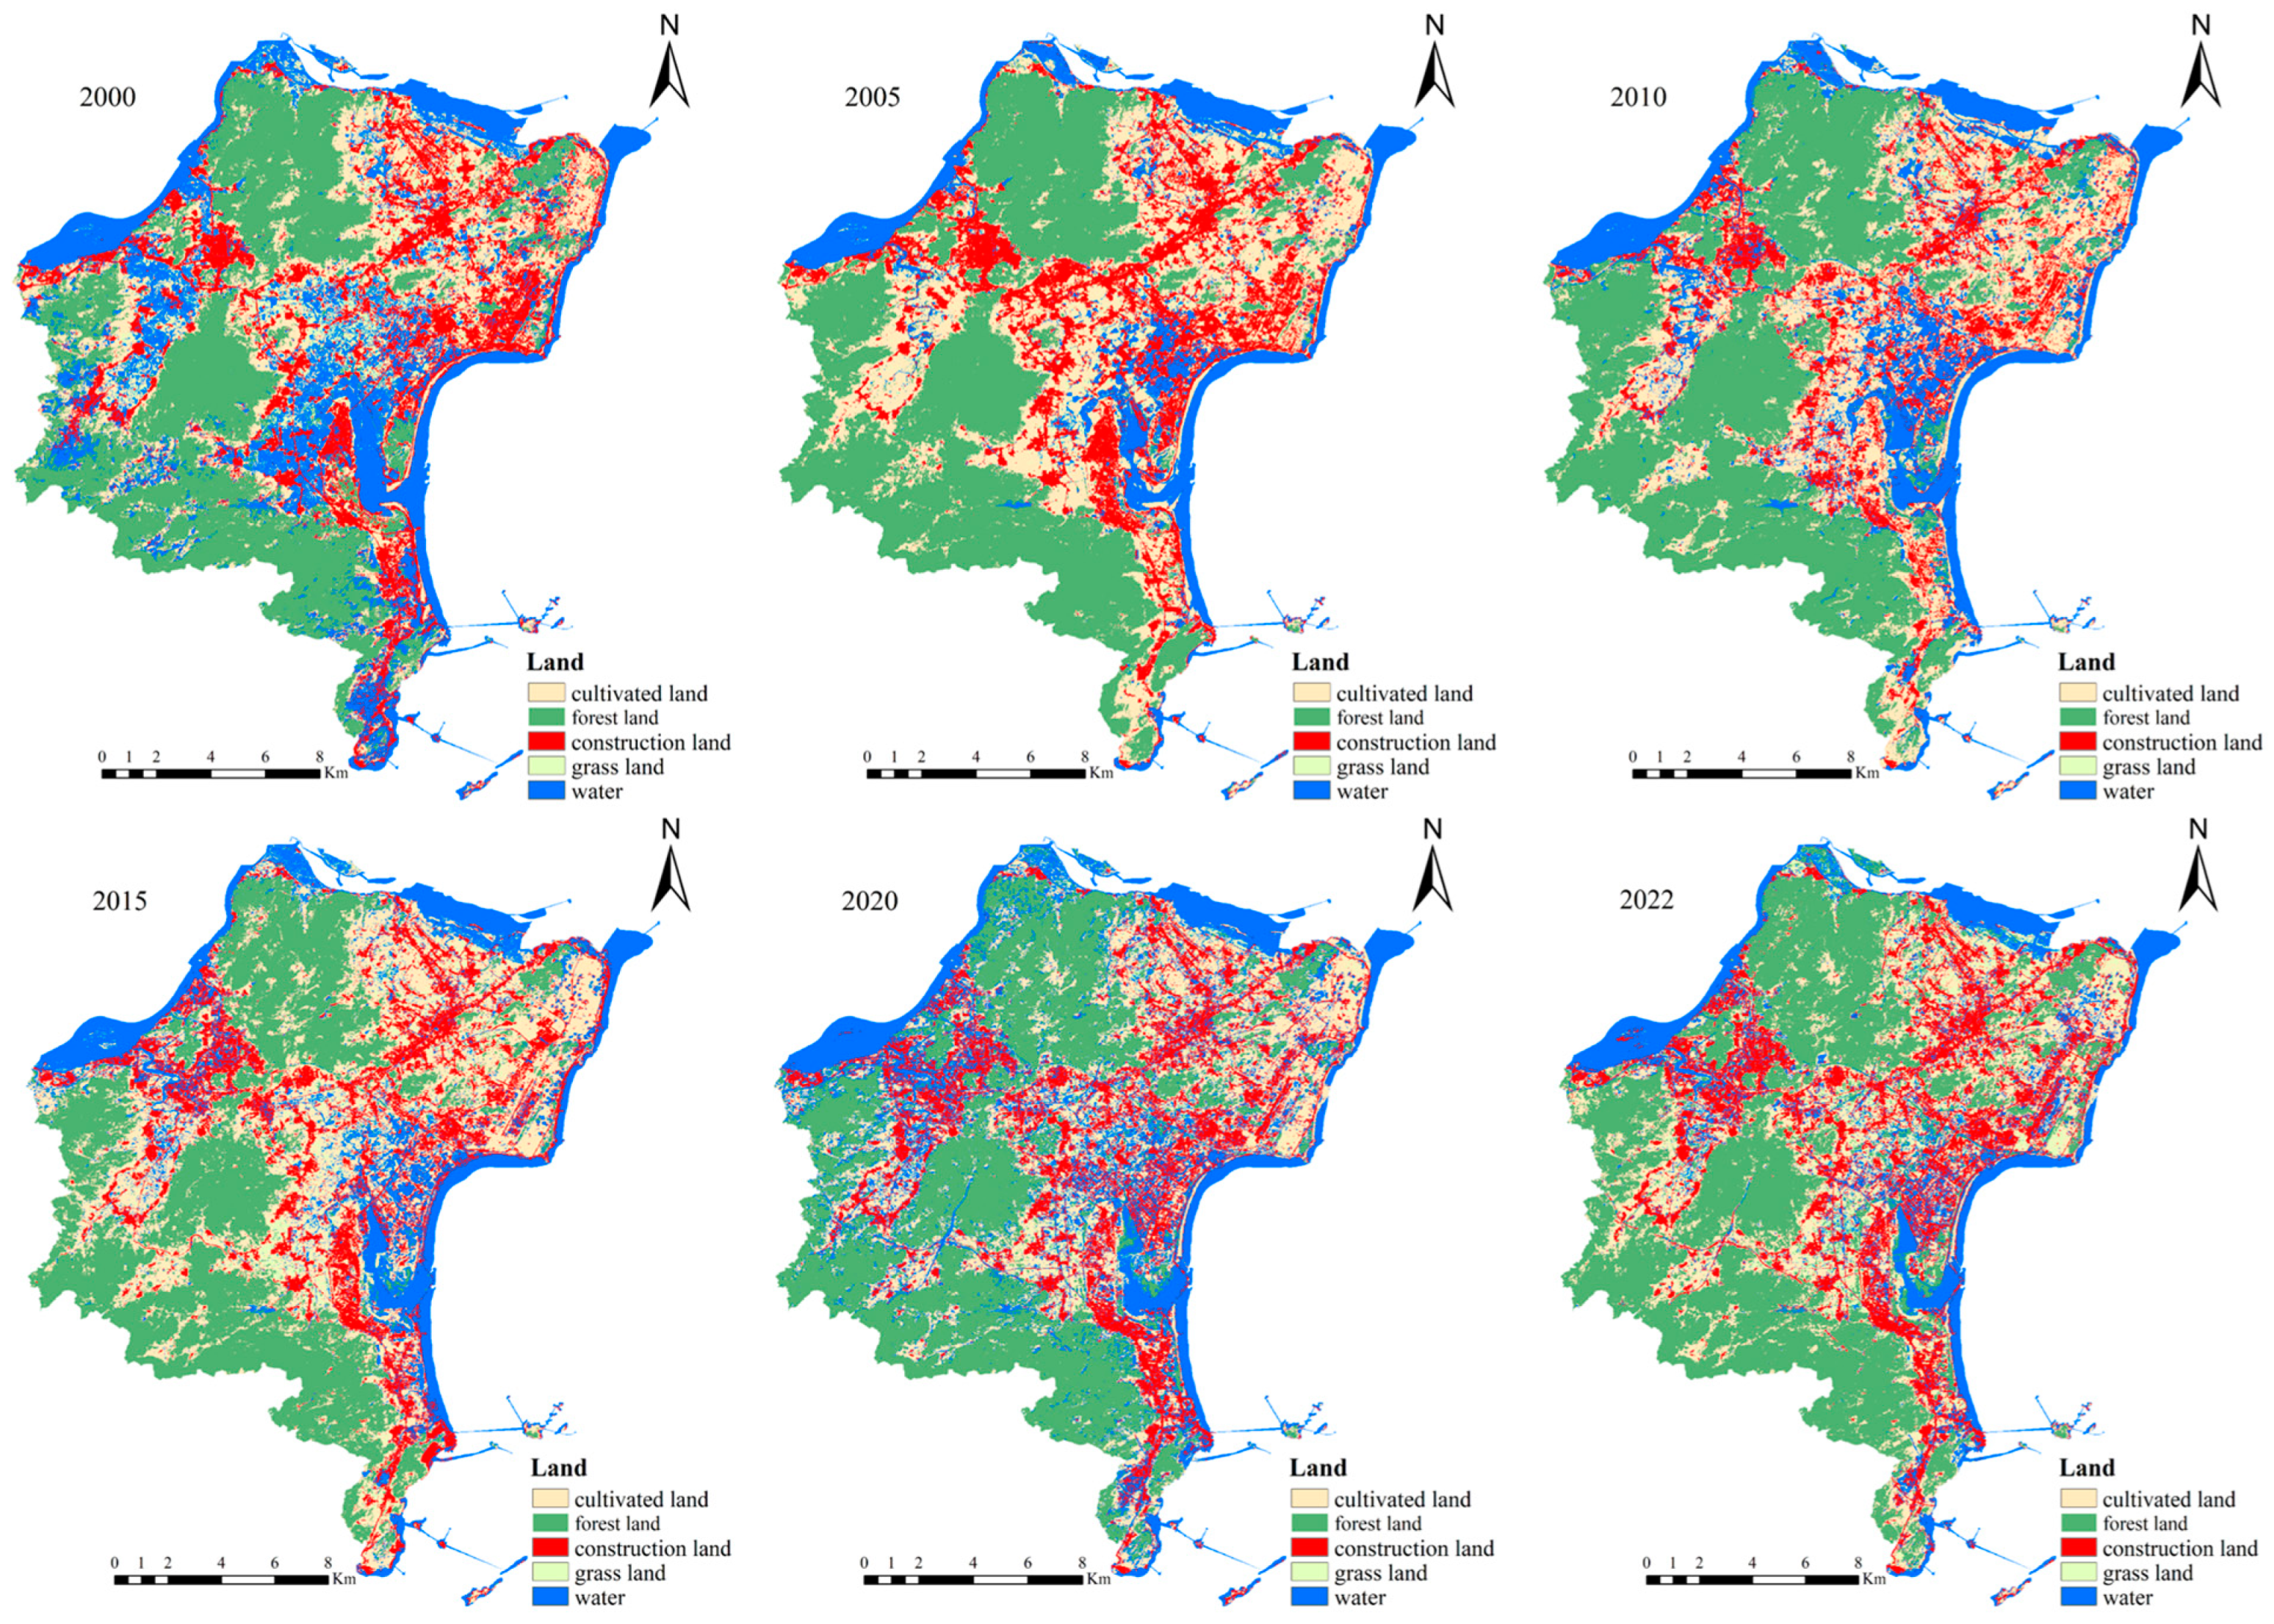
2.4.3. Land Use Classification
2.4.4. GeoSOS-FLUS Model Simulation Prediction
3. Results
3.1. Descriptive Analysis of RSEI Components Based on Principal Component Analysis
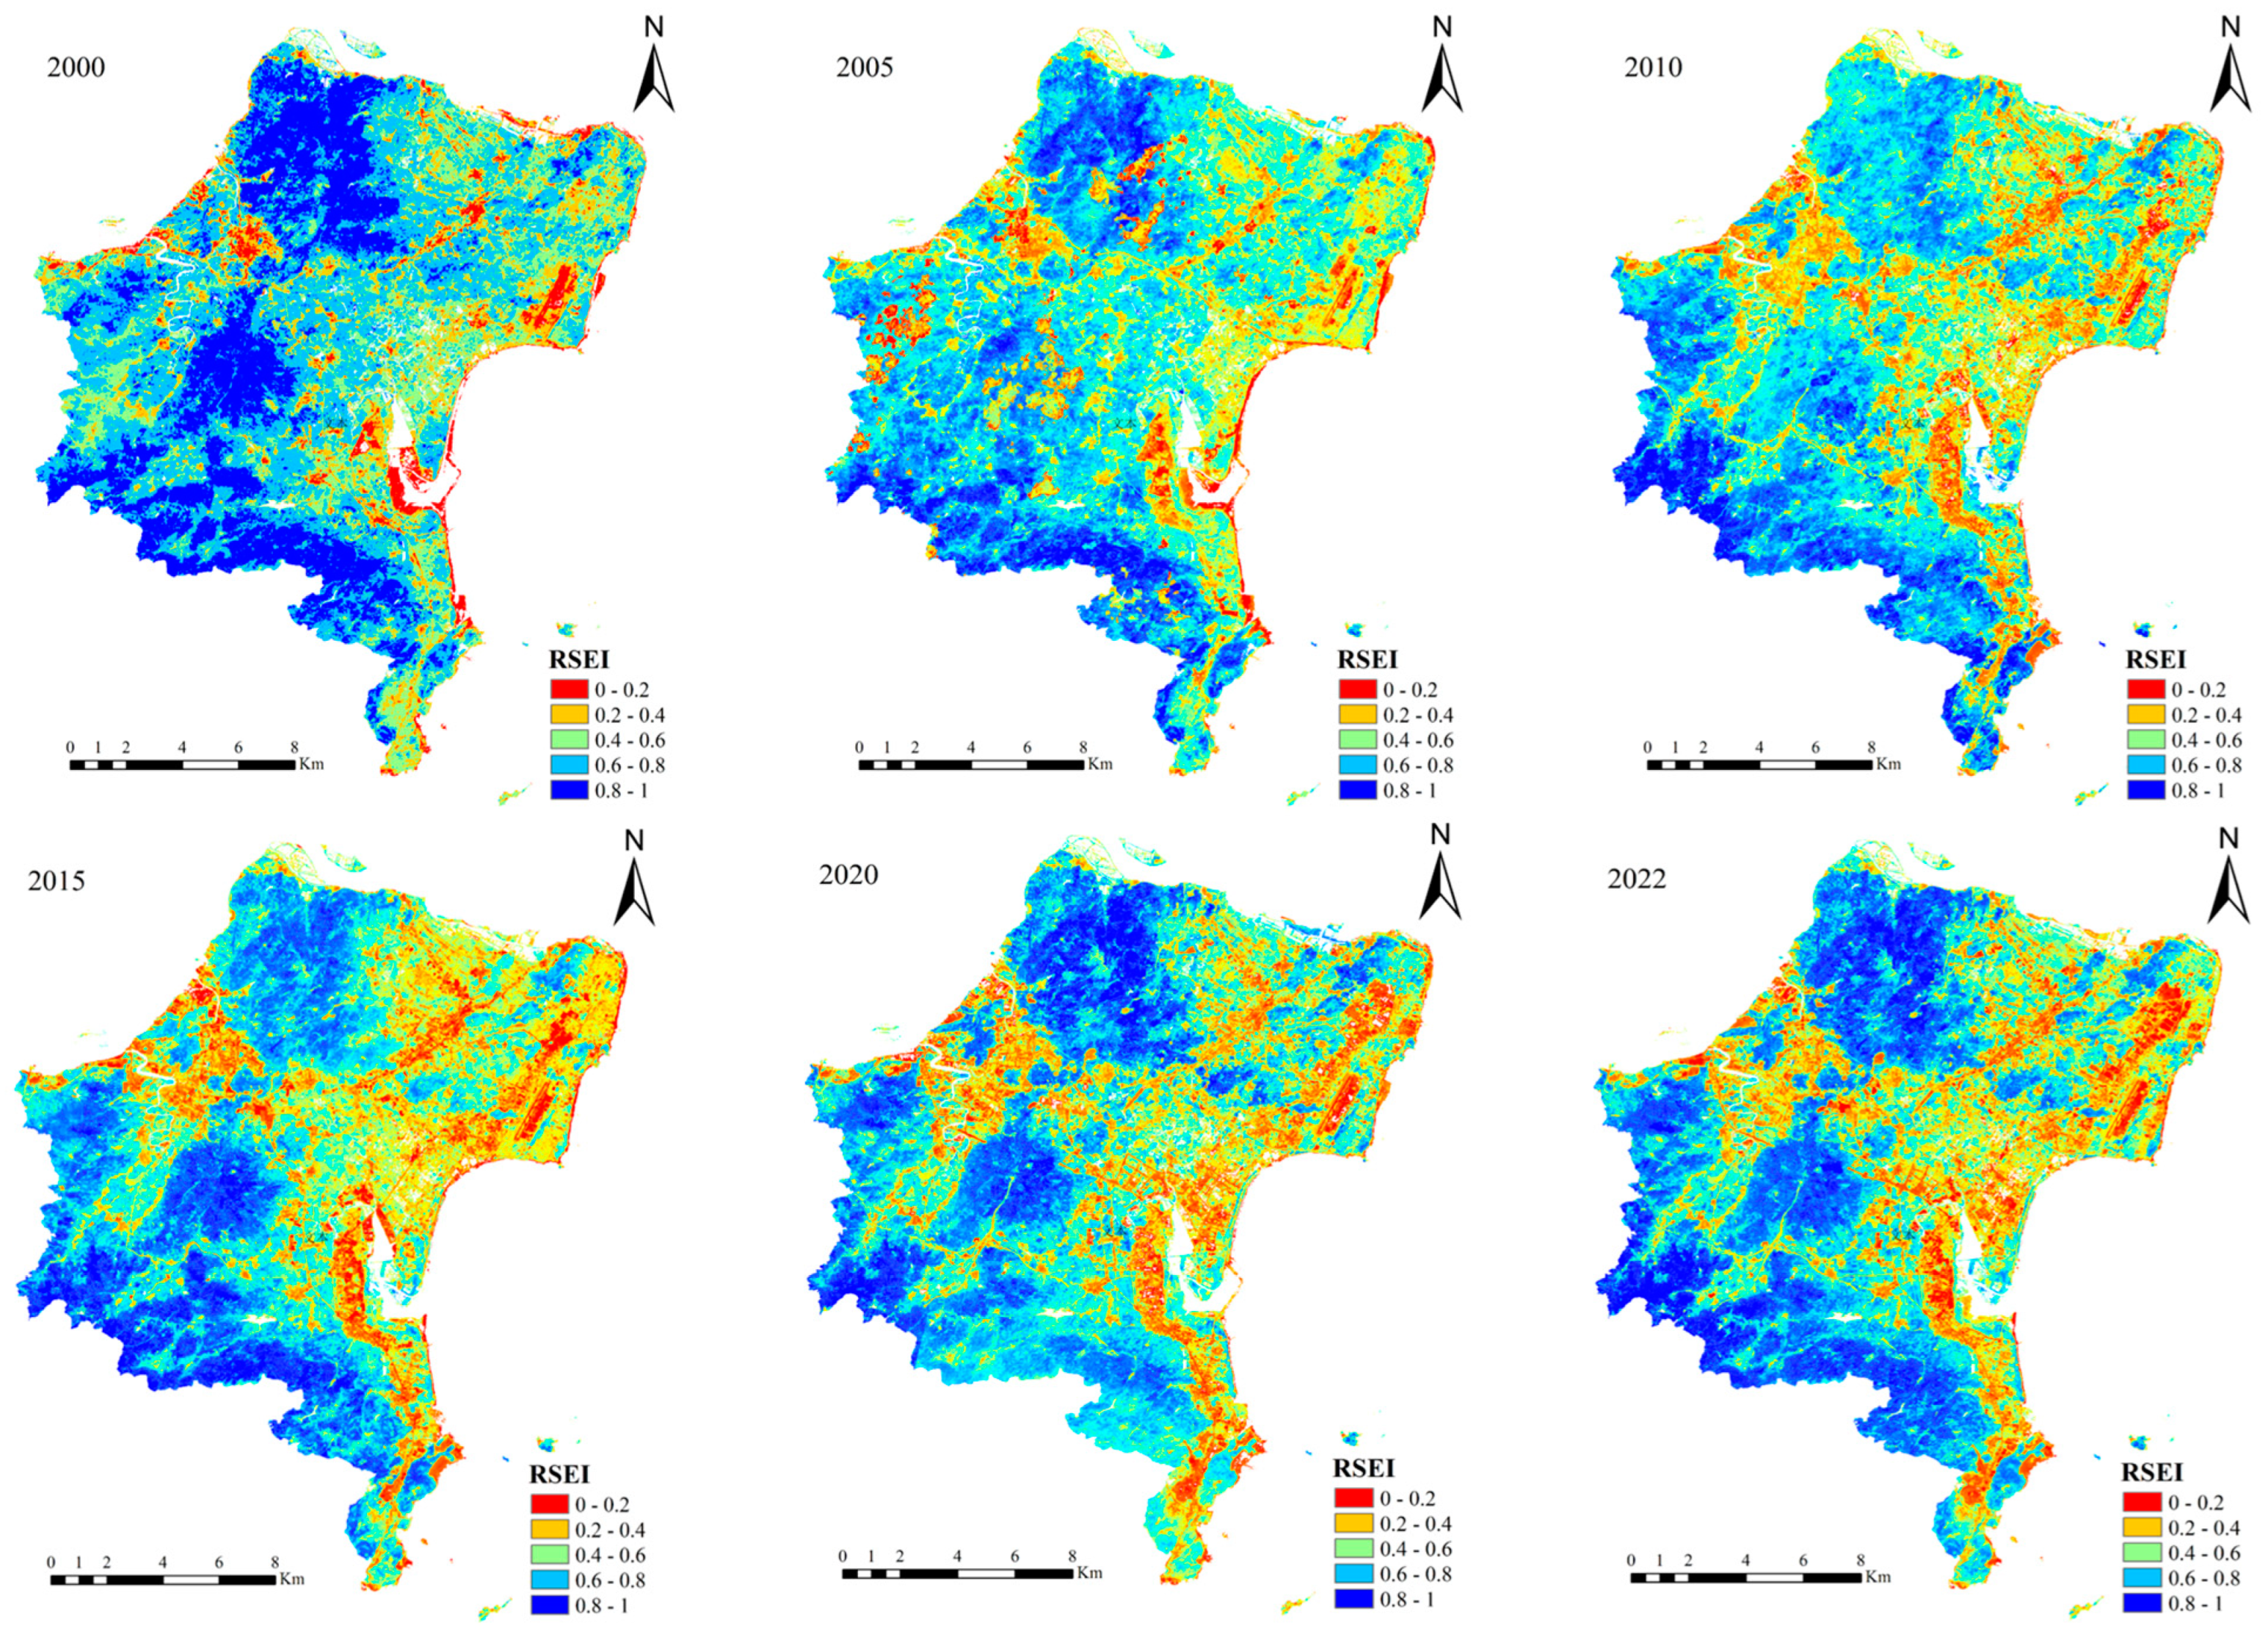
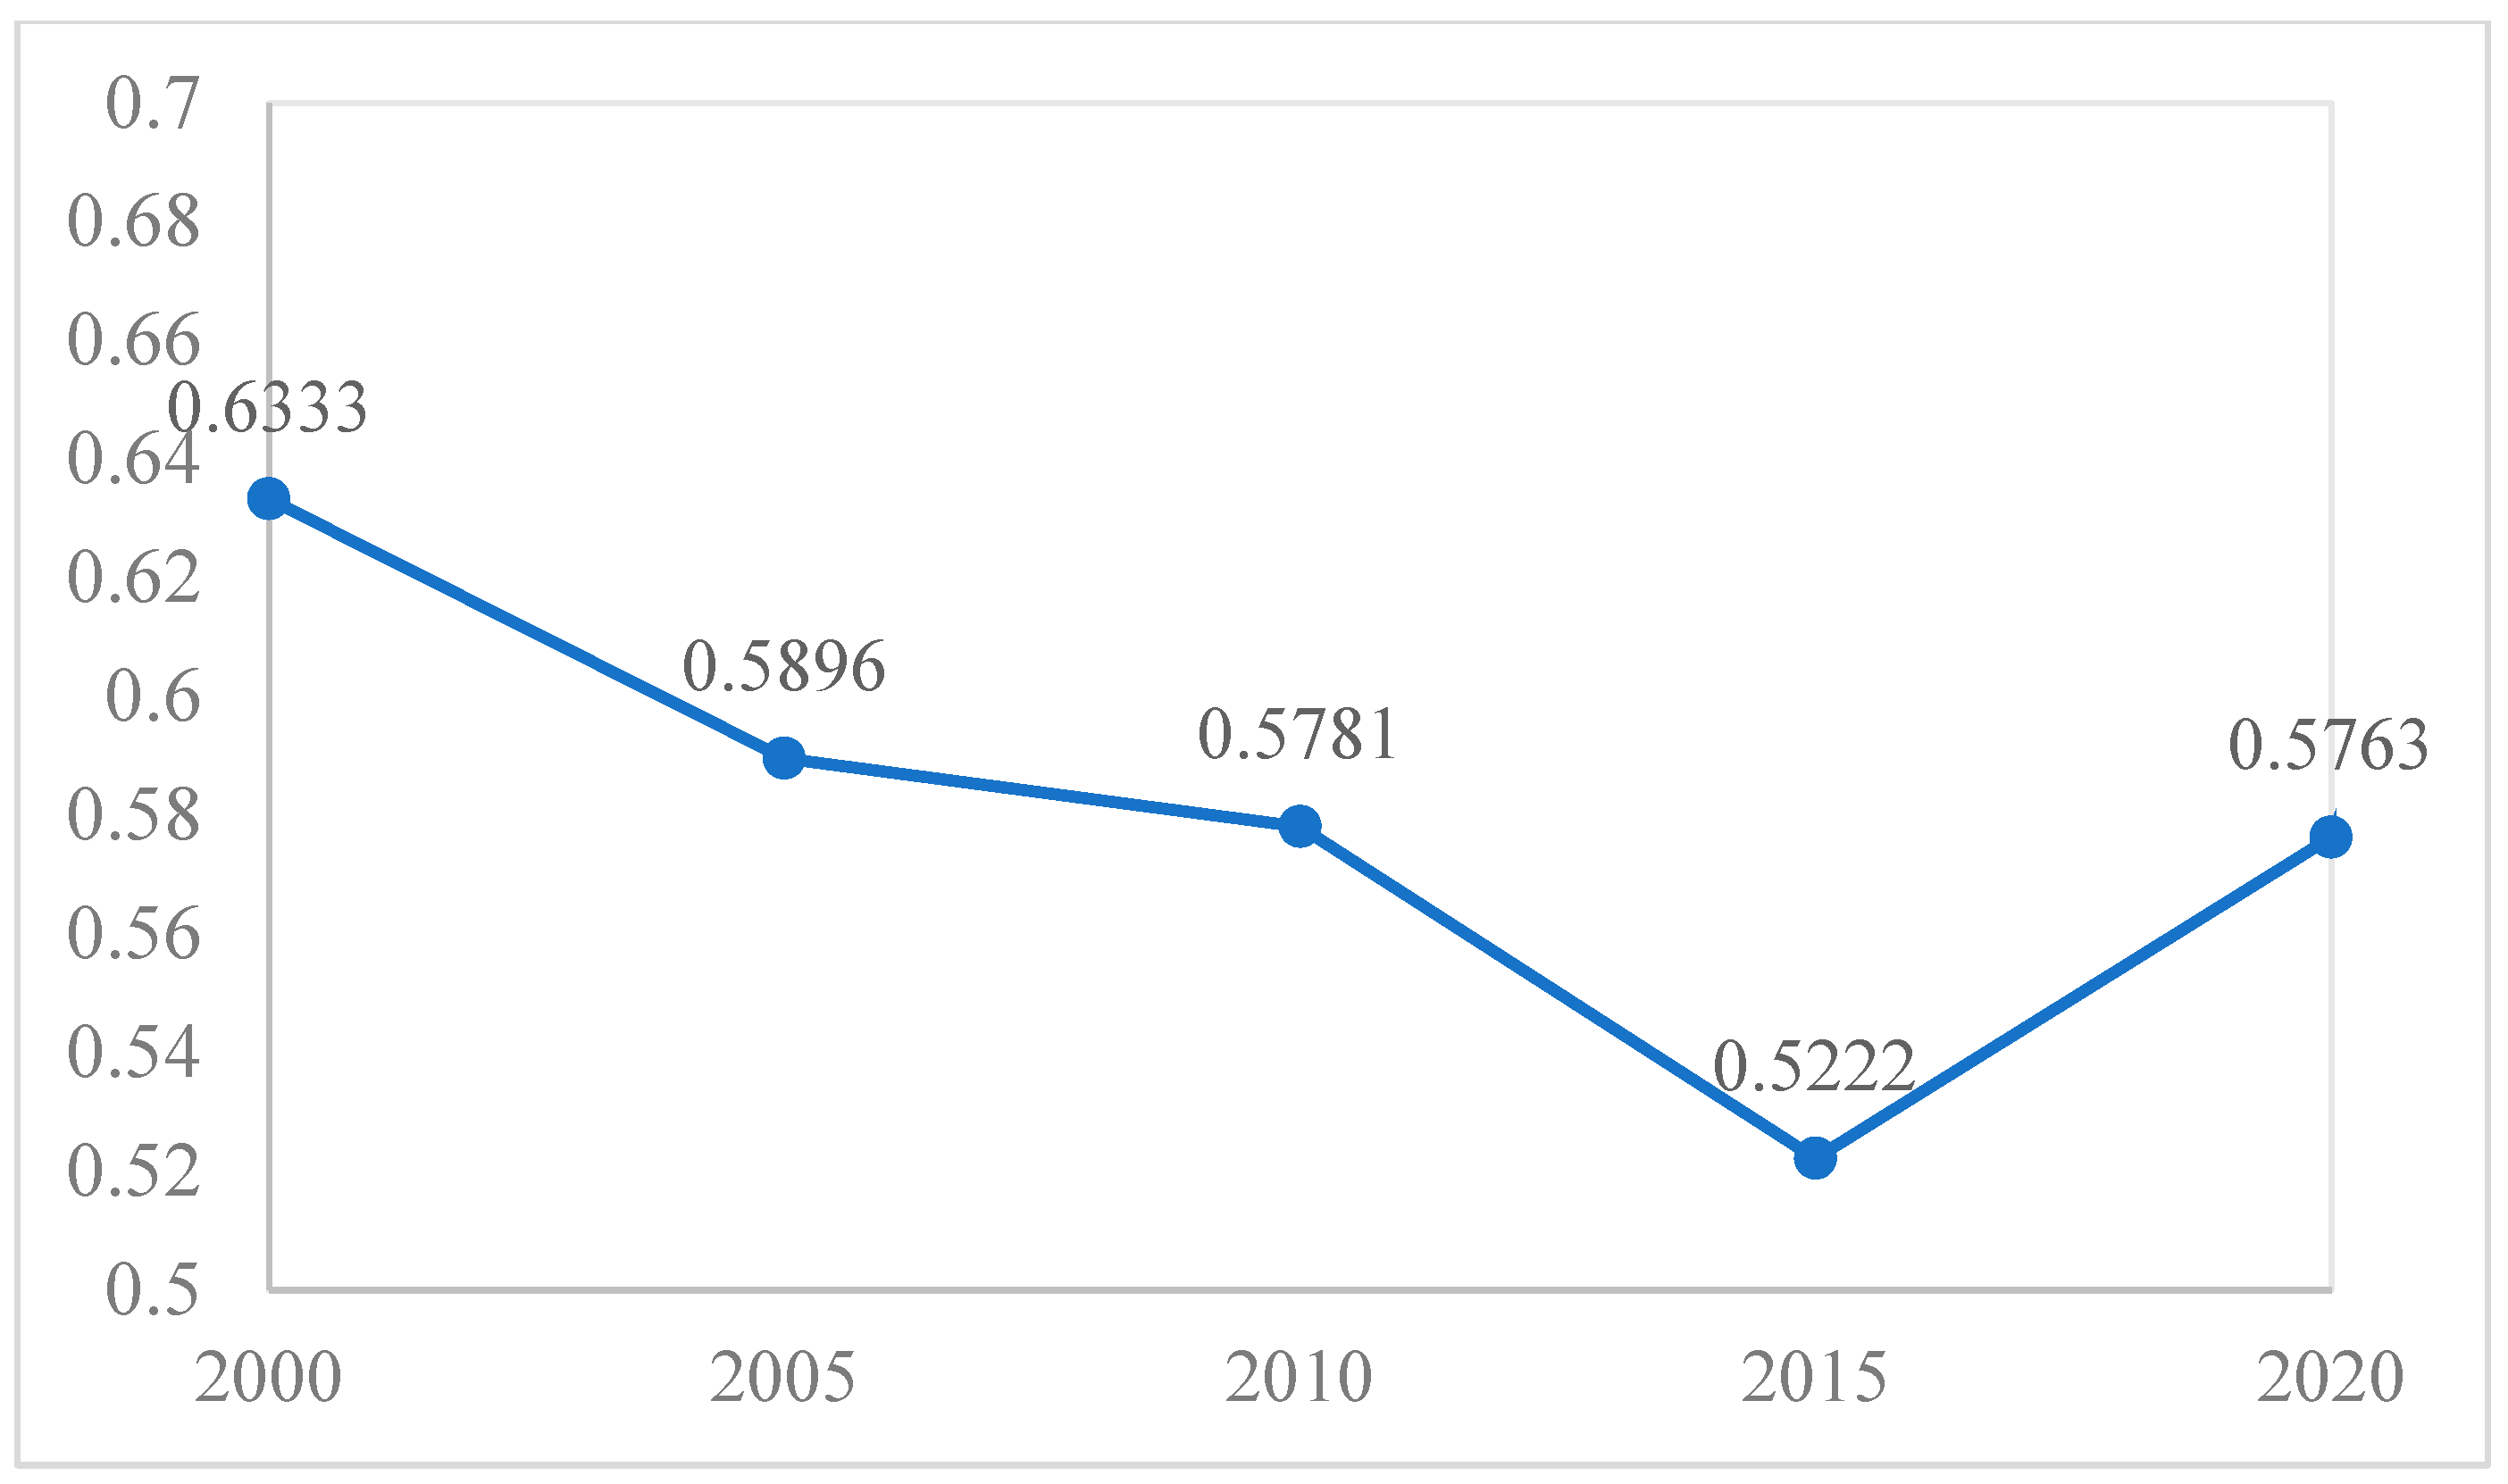
3.2. Temporal–Spatial Analysis of Overall RSEI
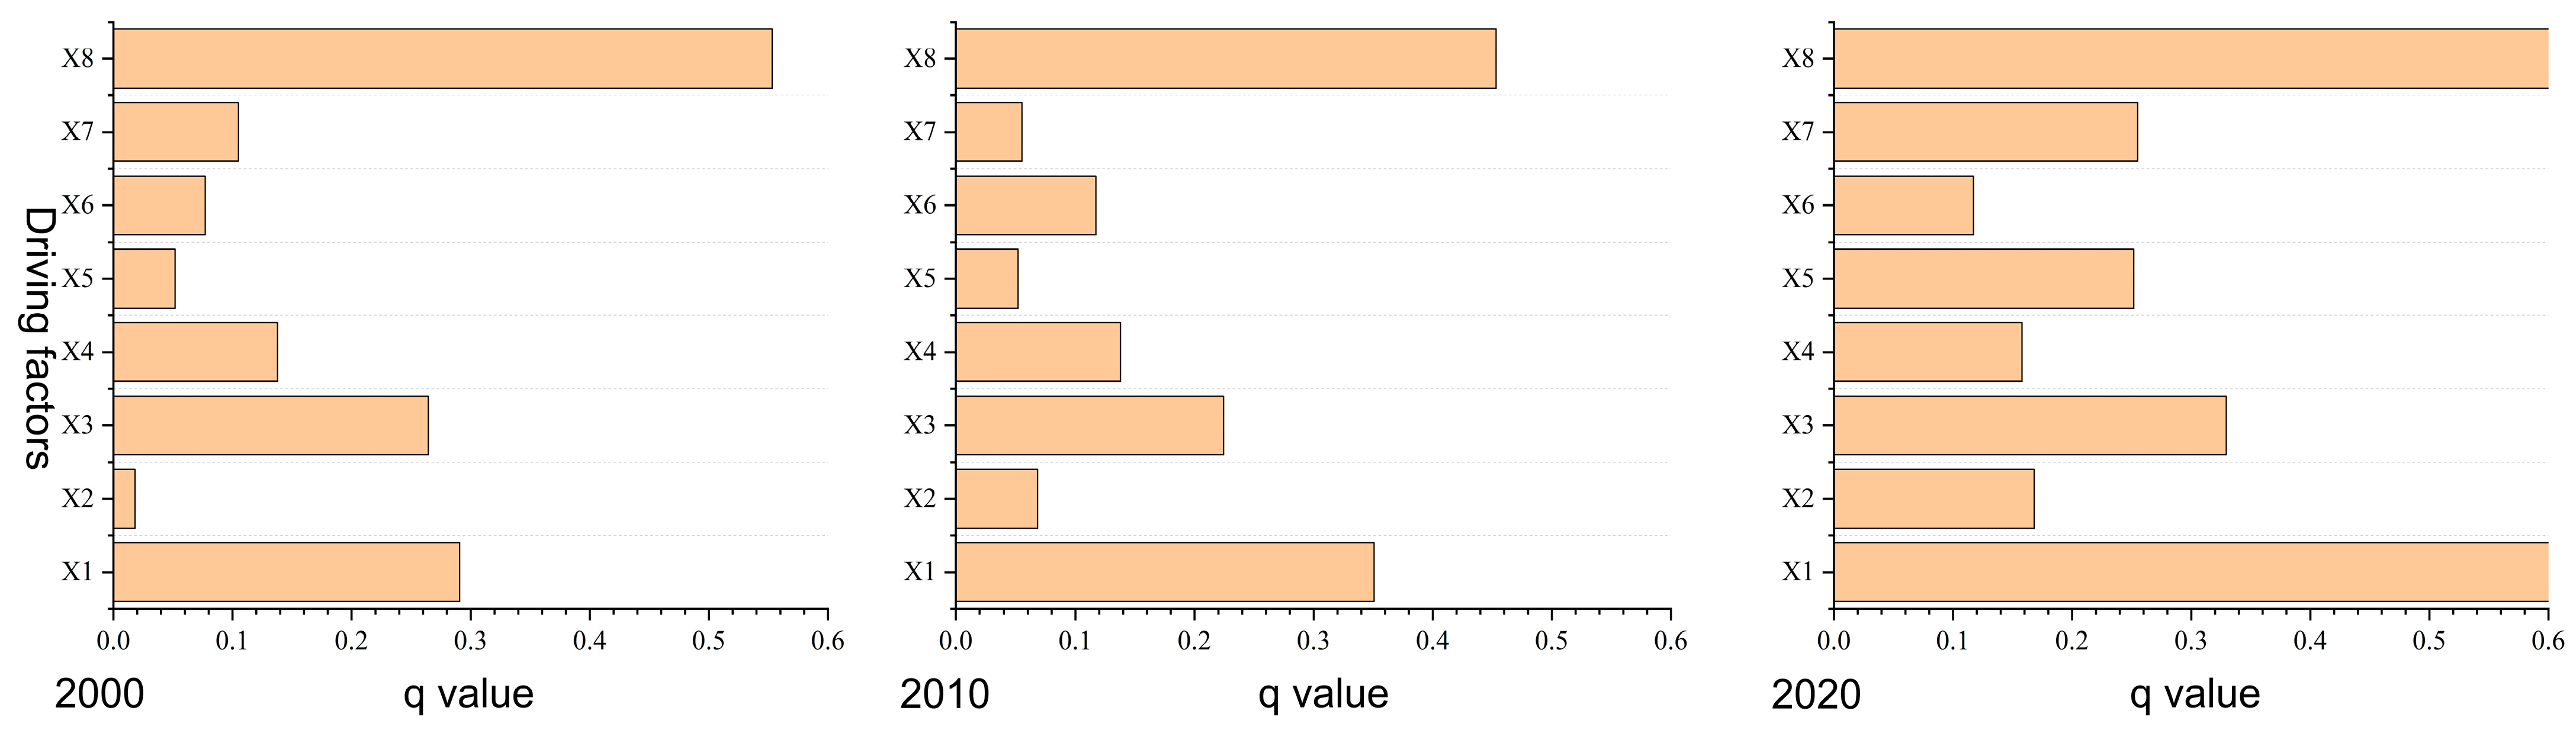
3.3. The Influencing Factors of RSEI Based on Geodetector
3.4. Land Use Prediction in Maintaining the Current RESI Factors Scenario Based on the GeoSOS-FLUS Model
4. Discussion
4.1. The Assessment of Ecological Environment Quality Based on RSEI and Its Driving Factors
4.2. Land Use Simulation Prediction in Maintaining the Current RESI Factors Scenario
4.3. Litmations and Further Directions
5. Conclusions
Author Contributions
Funding
Data Availability Statement
Conflicts of Interest
References
- Shan, W.; Jin, X.; Ren, J.; Wang, Y.; Xu, Z.; Fan, Y.; Gu, Z.; Hong, C.; Lin, J.; Zhou, Y. Ecological environment quality assessment based on remote sensing data for land consolidation. J. Clean. Prod. 2019, 239, 118126. [Google Scholar] [CrossRef]
- United Nations Human Settlements Programme. World Cities Report; UN-Habitat. 2022. Available online: https://unhabitat.org/wcr/ (accessed on 10 August 2024).
- Yang, Y.Y. Evolution of habitat quality and association with land-use changes in mountainous areas: A case study of the Taihang Mountains in He-bei Province, China. Ecol. Indic. 2021, 129, 107967. [Google Scholar] [CrossRef]
- Long, H.L. Land use policy in China: Introduction. Land Use Policy 2014, 40, 1–5. [Google Scholar] [CrossRef]
- Ni, X.J.; Parajuli, P.B.; Ouyang, Y.; Dash, P.; Siegert, C. Assessing land use change impact on stream discharge and stream water quality in an agri-cultural watershed. Catena 2021, 198, 105055. [Google Scholar] [CrossRef]
- Zou, L.; Xia, J.; She, D.X. Analysis of Impacts of Climate Change and Human Activities on Hydrological Drought: A Case Study in the Wei River Basin, China. Water Resour. Manag. 2018, 32, 1421–1438. [Google Scholar] [CrossRef]
- Talukder, B.; Ganguli, N.; Matthew, R.; VanLoon, G.W.; Hipel, K.W.; Orbinski, J. Climate change-triggered land degradation and planetary health: A review. Land Degrad. Dev. 2021, 32, 4509–4522. [Google Scholar] [CrossRef]
- Yin, R.; Kardol, P.; Thakur, M.P.; Gruss, I.; Wu, G.L.; Eisenhauer, N.; Schädler, M. Soil functional biodiversity and biological quality under threat: Intensive land use outweighs climate change. Soil Biol. Biochem. 2020, 147, 107847. [Google Scholar] [CrossRef]
- Polasky, S.; Nelson, E.; Pennington, D.; Johnson, K.A. The Impact of Land-Use Change on Ecosystem Services, Biodiversity and Returns to Land-owners: A Case Study in the State of Minnesota. Environ. Resour. Econ. 2011, 48, 219–242. [Google Scholar] [CrossRef]
- Fu, H.; Liu, J.; Dong, X.; Chen, Z.; He, M. Evaluating the Sustainable Development Goals within Spatial Planning for Decision-Making: A Major Function-Oriented Zone Planning Strategy in China. Land 2024, 13, 390. [Google Scholar] [CrossRef]
- Jing, Y.; Zhang, F.; He, Y.; Kung, H.-T.; Johnson, V.C.; Arikena, M. Assessment of spatial and temporal variation of ecological environment quality in Ebinur Lake Wetland National Nature Reserve, Xinjiang, China. Ecol. Indic. 2020, 110, 105874. [Google Scholar] [CrossRef]
- Chen, M.J.; Bai, Z.K.; Wang, Q.R.; Shi, Z.Y. Habitat Quality Effect and Driving Mechanism of Land Use Transitions: A Case Study of Henan Water Source Area of the Middle Route of the South-to-North Water Transfer Project. Land 2021, 10, 8. [Google Scholar] [CrossRef]
- Gu, L.; Yan, J.B.; Li, Y.R.; Gong, Z.W. Spatial-temporal evolution and correlation analysis between habitat quality and landscape patterns based on land use change in Shaanxi Province, China. Ecol. Evol. 2023, 13, 11. [Google Scholar] [CrossRef]
- Buddendorf, W.B.; Malcolm, I.A.; Geris, J.; Fabris, L.; Millidine, K.J.; Wilkinson, M.E.; Soulsby, C. Spatio-temporal effects of river regulation on habitat quality for Atlantic salmon fry. Ecol. Indic. 2017, 83, 292–302. [Google Scholar] [CrossRef]
- Naseri, N.; Mostafazadeh, R. Spatial relationship of Remote Sensing Ecological Indicator (RSEI) and landscape metrics under urban development intensification. Earth Sci Inf. 2023, 16, 3797–3810. [Google Scholar] [CrossRef]
- Mondal, J.; Basu, T.; Das, A. Application of a novel remote sensing ecological index (RSEI) based on geographically weighted principal component analysis for assessing the land surface ecological quality. Environ. Sci. Pollut. Res. 2024, 31, 32350–32370. [Google Scholar] [CrossRef]
- Hurlimann, A.C.; Moosavi, S.; Browne, G.R. Climate change transformation: A definition and typology to guide decision making in urban environments. Sustain. Cities Soc. 2021, 70, 102890. [Google Scholar] [CrossRef]
- Chen, X.; He, X.; Wang, S. Simulated Validation and Prediction of Land Use under Multiple Scenarios in Daxing District, Beijing, China, Based on GeoSOS-FLUS Model. Sustainability 2022, 14, 11428. [Google Scholar] [CrossRef]
- Ma, R.; Zhou, W.; Ren, J.; Huang, Y.; Wang, H. Multi-scenario simulation and optimization control of ecological security based on GeoSOS-FLUS model in ecological fragile area in northeast Qinghai-Tibet Plateau, China. Ecol. Indic. 2023, 151, 110324. [Google Scholar] [CrossRef]
- Li, Z.; Xue, W.; Winijkul, E.; Shrestha, S. Spatio-Temporal Dynamics of Non-Point Source Pollution in Jiulong River Basin (China) Using the Soil & Water Assessment Tool Model in Combination with the GeoSOS-FLUS Model. Water 2023, 15, 2763. [Google Scholar] [CrossRef]
- Nakaya, T.; Fotheringham, A.S.; Brunsdon, C.; Charlton, M. Geographically weighted Poisson regression for disease association mapping. Stat. Med. 2005, 24, 2695–2717. [Google Scholar] [CrossRef]
- Zhang, S.; Liu, S.; Zhong, Q.; Zhu, K.; Fu, H. Assessing Eco-Environmental Effects and Its Impacts Mechanisms in the Mountainous City: Insights from Ecological–Production–Living Spaces Using Machine Learning Models in Chongqing. Land 2024, 13, 1196. [Google Scholar] [CrossRef]
- Laino, E.; Iglesias, G. Multi-hazard assessment of climate-related hazards for European coastal cities. J. Environ. Manag. 2024, 357, 120787. [Google Scholar] [CrossRef] [PubMed]
- Laino, E.; Iglesias, G. Extreme climate change hazards and impacts on European coastal cities: A review. Renew. Sustain. Energy Rev. 2023, 184, 113587. [Google Scholar] [CrossRef]
- Chung, J.; Kim, J.; Sung, K. Analysis of heat mitigation capacity in a coastal city using InVEST urban cooling model. Sustain. Cities Soc. 2024, 113, 105669. [Google Scholar] [CrossRef]
- Dubois, E.; Cherif, S.M.A.; Abidine, M.M.; Bah, M.F.O.; Chenal, J.; Marshall, M.; Oumarou, W.; Grossiord, C.; Perona, P. Nature-based solution enhances resilience to flooding and catalyzes multi-benefits in coastal cities in the Global South. Sci. Total Environ. 2024, 928, 172282. [Google Scholar] [CrossRef]
- Lai, S.; Sha, J.; Eladawy, A.; Li, X.; Wang, J.; Kurbanov, E.; Lin, Z.; Wu, L.; Han, R.; Su, Y.-C. Evaluation of ecological security and ecological maintenance based on pressure-state-response (PSR) model, case study: Fuzhou city, China. Hum. Ecol. Risk Assess. Int. J. 2022, 28, 734–761. [Google Scholar] [CrossRef]
- Cihlar, J.; Laurent, L.S.; Dyer, J.A. Relation between the normalized difference vegetation index and ecological variables. Remote Sens. Environ. 1991, 35, 279–298. [Google Scholar] [CrossRef]
- Fu, H.; Fu, L.; Dávid, L.D.; Zhong, Q.; Zhu, K. Bridging Gaps towards the 2030 Agenda: A Data-Driven Comparative Analysis of Government and Public Engagement in China towards Achieving Sustainable Development Goals. Land 2024, 13, 818. [Google Scholar] [CrossRef]
- Hu, X.; Xu, H. A new remote sensing index for assessing the spatial heterogeneity in urban ecological quality: A case from Fuzhou City, China. Ecol. Indic. 2018, 89, 11–21. [Google Scholar] [CrossRef]
- Yu, Z.; Guo, X.; Zeng, Y.; Koga, M.; Vejre, H. Variations in land surface temperature and cooling efficiency of green space in rapid urbanization: The case of Fuzhou city, China. Urban For. Urban Green. 2018, 29, 113–121. [Google Scholar] [CrossRef]
- Plowright, R.K.; Sokolow, S.H.; Gorman, M.E.; Daszak, P.; Foley, J.E. Causal inference in disease ecology: Investigating ecological drivers of disease emergence. Front. Ecol. Environ. 2008, 6, 420–429. [Google Scholar] [CrossRef]
- Song, H.M.; Xue, L. Dynamic monitoring and analysis of ecological environment in Weinan City, Northwest China based on RSEI model. Ying Yong Sheng Tai Xue Bao = J. Appl. Ecol. 2016, 27, 3913–3919. [Google Scholar]
- Zhou, J.; Liu, W. Monitoring and evaluation of eco-environment quality based on remote sensing-based ecological index (RSEI) in Taihu Lake Basin, China. Sustainability 2022, 14, 5642. [Google Scholar] [CrossRef]
- Rao, C.R. The use and interpretation of principal component analysis in applied research. Sankhyā Indian J. Stat. Ser. A 1964, 26, 329–358. [Google Scholar]
- Zhang, J.; Zhou, Q.; Cao, M.; Liu, H. Spatiotemporal Change of Eco-Environmental Quality in the Oasis City and Its Correlation with Urbanization Based on RSEI: A Case Study of Urumqi, China. Sustainability 2022, 14, 9227. [Google Scholar] [CrossRef]
- Pettorelli, N.; Vik, J.O.; Mysterud, A.; Gaillard, J.-M.; Tucker, C.J.; Stenseth, N.C. Using the satellite-derived NDVI to assess ecological responses to environmental change. Trends Ecol. Evol. 2005, 20, 503–510. [Google Scholar] [CrossRef] [PubMed]
- Chen, J.; Jönsson, P.; Tamura, M.; Gu, Z.; Matsushita, B.; Eklundh, L. A simple method for reconstructing a high-quality NDVI time-series data set based on the Savitzky–Golay filter. Remote Sens. Environ. 2004, 91, 332–344. [Google Scholar] [CrossRef]
- Bohmanova, J.; Misztal, I.; Cole, J.B. Temperature-humidity indices as indicators of milk production losses due to heat stress. J. Dairy Sci. 2007, 90, 1947–1956. [Google Scholar] [CrossRef] [PubMed]
- Bradford, K.J.; Dahal, P.; Bello, P. Using relative humidity indicator paper to measure seed and commodity moisture contents. Agric. Environ. Lett. 2016, 1, 160018. [Google Scholar] [CrossRef]
- Pritchard, J.C.; Burn, C.C.; Barr, A.R.S.; Whay, H.R. Validity of indicators of dehydration in working horses: A longitudinal study of changes in skin tent duration, mucous membrane dryness and drinking behaviour. Equine Vet. J. 2008, 40, 558–564. [Google Scholar] [CrossRef]
- Büssing, A.; Baiocco, F.; Baumann, K. Spiritual dryness in catholic laypersons working as volunteers is related to reduced life satisfaction rather than to indicators of spirituality. Pastor. Psychol. 2018, 67, 1–15. [Google Scholar] [CrossRef]
- Fiveland, W.A. Discrete-ordinates solutions of the radiative transport equation for rectangular enclosures. J. Heat Transf. 1984, 106, 699–706. [Google Scholar] [CrossRef]
- Jiang, Y.F. An Implicit Finite Volume Scheme to Solve the Time-dependent Radiation Transport Equation Based on Discrete Ordinates. Astrophys. J. Suppl. Ser. 2021, 253, 49. [Google Scholar] [CrossRef]
- Soba, A.; Cazado, M.E.; Houzeaux, G.; Gutierrez-Milla, A.; Mantsinen, M.J.; Saez, X. Validations of the radiation transport module NEUTRO: A deterministic solver for the neutron transport equation. Fusion Eng. Des. 2021, 169, 112497. [Google Scholar] [CrossRef]
- Shlens, J. A tutorial on principal component analysis. arXiv 2014, arXiv:1404.1100. [Google Scholar]
- Bollen, J.; Van de Sompel, H.; Hagberg, A.; Chute, R. A principal component analysis of 39 scientific impact measures. PLoS ONE 2009, 4, e6022. [Google Scholar] [CrossRef]
- Smith, D.; Elmore, A.C. A modification of freeze-core technology for collecting granular fluvial sediment samples. Environ. Earth Sci. 2014, 71, 4149–4156. [Google Scholar] [CrossRef]
- Christy, T.M. A permeable membrane sensor for the detection of volatile compounds in soil. In Proceedings of the 11th EEGS Symposium on the Application of Geophysics to Engineering and Environmental Problems, Environment and Engineering Geophysical Society. Chicago, Chicago, IL, USA, 22–26 March 1998; p. cp-203-00007. [Google Scholar]
- Jian, K.; Wang, S.; Guo, L.; Zhang, Q. Spatial distribution simulation and trend analysis of land use in Sanya based on GeoSOS-FLUS model. Urban Reg. Plan 2020, 5, 97. [Google Scholar]
- Lai, J.; Li, J.; Liu, L. Predicting Soil Erosion Using RUSLE and GeoSOS-FLUS Models: A Case Study in Kunming, China. Forests 2024, 15, 1039. [Google Scholar] [CrossRef]
- Xiao, Y.; Huang, M.; Xie, G.; Zhen, L. Evaluating the impacts of land use change on ecosystem service values under multiple scenarios in the Hunshandake region of China. Sci. Total Environ. 2022, 850, 158067. [Google Scholar] [CrossRef]
- Wang, W.; Chen, H.; Cao, S.; Wang, B. Analysis of Urban Dual-Carbon Targets and Countermeasures Based on GeoSOS-FLUS Simulation—A Case of Hangzhou City, Zhejiang Province. In Proceedings of the International Conference on Green Building, Civil Engineering and Smart City, Guilin, China, 8–10 April 2022; Springer: Singapore, 2022; pp. 32–43. [Google Scholar]
- Geng, J.; Yu, K.; Xie, Z.; Zhao, G.; Ai, J.; Yang, L.; Yang, H.; Liu, J. Analysis of spatiotemporal variation and drivers of ecological quality in Fuzhou based on RSEI. Remote Sens. 2022, 14, 4900. [Google Scholar] [CrossRef]
- Chen, N.; Cheng, G.; Yang, J.; Ding, H.; He, S. Evaluation of Urban Ecological Environment Quality Based on Improved RSEI and Driving Factors Analysis. Sustainability 2023, 15, 8464. [Google Scholar] [CrossRef]
- Gong, C.; Lyu, F.; Wang, Y. Spatiotemporal change and drivers of ecosystem quality in the Loess Plateau based on RSEI: A case study of Shanxi, China. Ecol. Indic. 2023, 155, 111060. [Google Scholar] [CrossRef]
- Gong, E.; Shi, F.; Wang, Z.; Hu, Q.; Zhang, J.; Hai, H. Evaluating environmental quality and its driving force in northeastern China using the remote sensing ecological index. Sustainability 2022, 14, 16304. [Google Scholar] [CrossRef]
- Xing, D.; He, H.; Xie, G.; Zhou, Z.; He, C.; Li, L. Spatial and Temporal Change Assessment and Driving Force Analysis of Urumqi Ecological Environment Based on RSEI. Environ. Resour. Ecol. J. 2022, 6, 66–78. [Google Scholar]
- Seto, K.C.; Güneralp, B.; Hutyra, L.R. Global forecasts of urban expansion to 2030 and direct impacts on biodiversity and carbon pools. Proc. Natl. Acad. Sci. USA 2012, 109, 16083–16088. [Google Scholar] [CrossRef]
- Li, Y.; Wang, S. Exploration of Eco-Environment and Urbanization Changes Based on Multi-Source Remote Sensing Data—A Case Study of Yangtze River Delta Urban Agglomeration. Sustainability 2024, 16, 5903. [Google Scholar] [CrossRef]
- Mendiratta, P.; Gedam, S. Assessment of urban growth dynamics in Mumbai Metropolitan Region, India using object-based image analysis for medium-resolution data. Appl. Geogr. 2018, 98, 110–120. [Google Scholar] [CrossRef]
- Laurance, W.F. A crisis in the making: Responses of Amazonian forests to land use and climate change. Conserv. Biol. 2002, 16, 578–588. [Google Scholar] [CrossRef]
- Munteanu, C.; Kuemmerle, T.; Boltiziar, M.; Butsic, V.; Gimmi, U.; Halada, L.; Kaim, D.; Király, G.; Konkoly-Gyuró, É.; Kozak, J.; et al. Forest and agricultural land change in the Carpathian region—A meta-analysis of long-term patterns and drivers of change. Land Use Policy 2014, 38, 685–697. [Google Scholar] [CrossRef]
- Koko, A.F.; Yue, W.; Abubakar, G.A.; Hamed, R.; Alabsi, A.A.N. Analyzing urban growth and land cover change scenario in Lagos, Nigeria using multi-temporal remote sensing data and GIS to mitigate flooding. Geocarto Int. 2021, 36, 631–652. [Google Scholar] [CrossRef]
- Fragkias, M.; Güneralp, B.; Seto, K.C.; Goodness, J. A synthesis of global urbanization projections. In Urbanization, Biodiversity and Ecosystem Services: Challenges and Opportunities; Springer: Berlin/Heidelberg, Germany, 2013; pp. 409–435. [Google Scholar] [CrossRef]
- Dietzel, C.; Clarke, K. The effect of disaggregating land use categories in cellular automata during model calibration and forecasting. Comput. Environ. Urban Syst. 2006, 30, 78–101. [Google Scholar] [CrossRef]
- Cao, C.; Dragićević, S.; Li, S. Short-term forecasting of land use change using recurrent neural network models. Sustainability 2019, 11, 5376. [Google Scholar] [CrossRef]
- Grimm, N.B.; Faeth, S.H.; Golubiewski, N.E.; Redman, C.L.; Wu, J.; Bai, X.; Briggs, J.M. Global change and the ecology of cities. Science 2008, 319, 756–760. [Google Scholar] [CrossRef]
- Kabisch, N.; Byrne, J.; Newell, J.P. Urban green space, public health, and environmental justice: The challenge of making cities ‘just green enough’. Landsc. Urban Plan. 2016, 150, 131–139. [Google Scholar]


| Name | Year | Source | Resolution |
|---|---|---|---|
| Slope | 2000, 2010, 2020 | SRTMGL1_003 | 30 m |
| Precipitation | 2000, 2010, 2020 | ERA5 | 11,132 m |
| Temperature | 2000, 2010, 2020 | Landsat8 | 30 m |
| AOD | 2000, 2010, 2020 | MCD19A2 | 1000 m |
| FVC | 2000, 2010, 2020 | Landsat8 | 30 m |
| LAI | 2000, 2010, 2020 | MOD15A2H | 500 m |
| GDP | 2000, 2010, 2020 | Socioeconomic statistics | 1000 m |
| POP | 2000, 2010, 2020 | WorldPop | 100 m |
| Grade | Index | Describe |
|---|---|---|
| very poor | 0 ≤ RSEI ≤ 0.2 | The conditions are relatively harsh, and human activities are restricted to a certain extent. |
| poor | 0.2 ≤ RSEI ≤ 0.4 | Vegetation coverage is poor, and there are factors that obviously limit human activities. |
| medium | 0.4 ≤ RSEI ≤ 0.6 | Moderate vegetation coverage, more suitable for human life |
| good | 0.6 ≤ RSEI ≤ 0.8 | High vegetation coverage, rich biodiversity, suitable for human habitation |
| excellent | 0.8 ≤ RSEI ≤ 1.0 | High vegetation coverage, rich biodiversity, stable ecological environment |
| Formula | Explain | |
|---|---|---|
| Law of infrared radiation | is the absolute black body radiation output ); speed of light c = 2.99793 ; Planck constant ; Boltzmann constant J/K; T is the absolute temperature of the black body; is the wavelength. | |
| Surface emissivity | According to previous studies, remote sensing images are divided into three types: water body, town, and natural surface [42,43,44]; water represents the pixel specific radiation rate of the water body, and ε_surface represents the pixel specific radiation rate of the natural surface; ε_building represents the specific radiation rate of urban pixels; p_v represents the degree of vegetation coverage; NDVI is the normalized difference vegetation index; NDVI_S represents the NDVI value of bare soil pixels or areas without vegetation coverage, NDVI_V represents the NDVI value of vegetation, and the empirical values NDVI_V = 0.70 and NDVI_S = 0.05 [37]. | |
| Black body radiance | ε represents the specific emissivity of the surface; τ represents the transmittance in the thermal infrared band of the atmosphere; Ts represents the true temperature of the surface (in K); B(Ts) represents the thermal radiation brightness of the black body. The atmospheric transmittance τ in the thermal infrared band, the atmospheric upward thermal radiation brightness L↑, the atmospheric downward thermal radiation brightness L↓ and other radiation parameter information can be found on the official website of the NASA Atmospheric Correction (http://atmcorr.gsfc.nasa.gov/ (accessed on 9 August 2024)) on the remote sensing image imaging time of the study area and the longitude and latitude of the center point of the remote sensing image. | |
| Real surface temperature | K1, K2 indicate the constant preset by the satellite before launch; for Landsat8 TIRS Band 10, K1 = 774.89 W/(m2*μm*sr), K2 = 1321.08 K. |
| Type Land | Scope | |
|---|---|---|
| I | Grassland | Including grasslands, meadows, savannas, and artificial grasslands |
| II | Cultivated land | Including land for growing crops and shrub cash crops |
| III | water | Including rivers, lakes, ponds, and reservoirs |
| IV | Forest land | Including forests, woodlands, greening, cultivated land, and other green vegetation-covered areas |
| V | Construction land | Including urban construction land, cement, asphalt pavement, and transportation construction land |
| NDVI | Wet | NDBSI | LST | Eigenvalues | Eigenvalue Contribution Ratio (%) | ||
|---|---|---|---|---|---|---|---|
| 2000 | PC1 | 0.5617 | 0.3245 | −0.6835 | −0.3347 | 0.0255 | 69.00 |
| PC2 | 0.7568 | −0.4477 | 0.4633 | −0.1098 | 0.0076 | 20.65 | |
| PC3 | −0.3030 | −0.1351 | 0.1434 | −0.9324 | 0.0036 | 9.68 | |
| PC4 | −0.1407 | −0.8222 | −0.5456 | 0.0809 | 0.0002 | 0.66 | |
| 2005 | PC1 | 0.6857 | 0.1659 | −0.5590 | −0.4357 | 0.0224 | 62.87 |
| PC2 | −0.6258 | 0.1336 | −0.1388 | −0.7558 | 0.0077 | 21.64 | |
| PC3 | −0.3543 | 0.3728 | −0.7047 | 0.4887 | 0.0054 | 15.01 | |
| PC4 | −0.1128 | −0.9031 | −0.4142 | 0.0099 | 0.0002 | 0.48 | |
| 2010 | PC1 | 0.4464 | 0.2589 | −0.4711 | −0.7154 | 0.0224 | 61.50 |
| PC2 | 0.8058 | −0.3690 | 0.4476 | −0.1191 | 0.0076 | 20.96 | |
| PC3 | −0.3603 | −0.1448 | 0.2972 | −0.8723 | 0.0062 | 16.92 | |
| PC4 | 0.1471 | 0.8808 | 0.4467 | −0.0548 | 0.0002 | 0.62 | |
| 2015 | PC1 | 0.6974 | 0.1428 | −0.5435 | −0.4448 | 0.0210 | 62.95 |
| PC2 | −0.6687 | 0.1355 | −0.2648 | −0.6814 | 0.0082 | 24.42 | |
| PC3 | −0.2494 | 0.2811 | −0.7219 | 0.5811 | 0.0041 | 12.37 | |
| PC4 | −0.0651 | −0.9393 | −0.3369 | 0.0079 | 0.0001 | 0.26 | |
| 2020 | PC1 | 0.5451 | 0.2559 | −0.6780 | −0.4215 | 0.0253 | 62.08 |
| PC2 | −0.8158 | 0.2417 | −0.2939 | −0.4355 | 0.0088 | 21.60 | |
| PC3 | −0.1542 | 0.2961 | −0.5064 | 0.7951 | 0.0065 | 15.87 | |
| PC4 | −0.1164 | −0.8879 | −0.4443 | 0.0251 | 0.0002 | 0.44 | |
| 2022 | PC1 | 0.6758 | 0.2219 | −0.6334 | −0.3091 | 0.0203 | 62.94 |
| PC2 | 0.7323 | −0.3091 | 0.5546 | 0.2461 | 0.0069 | 21.47 | |
| PC3 | −0.0292 | −0.1709 | 0.3515 | −0.9200 | 0.0049 | 15.06 | |
| PC4 | 0.0785 | 0.9089 | 0.4094 | −0.0149 | 0.0002 | 0.53 |
Disclaimer/Publisher’s Note: The statements, opinions and data contained in all publications are solely those of the individual author(s) and contributor(s) and not of MDPI and/or the editor(s). MDPI and/or the editor(s) disclaim responsibility for any injury to people or property resulting from any ideas, methods, instructions or products referred to in the content. |
© 2024 by the authors. Licensee MDPI, Basel, Switzerland. This article is an open access article distributed under the terms and conditions of the Creative Commons Attribution (CC BY) license (https://creativecommons.org/licenses/by/4.0/).
Share and Cite
Long, T.; Bai, Z.; Zheng, B. Spatiotemporal Dynamics and Driving Forces of Ecological Environment Quality in Coastal Cities: A Remote Sensing and Land Use Perspective in Changle District, Fuzhou. Land 2024, 13, 1393. https://doi.org/10.3390/land13091393
Long T, Bai Z, Zheng B. Spatiotemporal Dynamics and Driving Forces of Ecological Environment Quality in Coastal Cities: A Remote Sensing and Land Use Perspective in Changle District, Fuzhou. Land. 2024; 13(9):1393. https://doi.org/10.3390/land13091393
Chicago/Turabian StyleLong, Tianxiang, Zhuhui Bai, and Bohong Zheng. 2024. "Spatiotemporal Dynamics and Driving Forces of Ecological Environment Quality in Coastal Cities: A Remote Sensing and Land Use Perspective in Changle District, Fuzhou" Land 13, no. 9: 1393. https://doi.org/10.3390/land13091393