Article

The Impact of Urbanization on Surface Runoff and Flood Prevention Strategies: A Case Study of a Traditional Village

by
Jiaxin Li
1,2,
Wuzhong Zhou
1 and
Cong Tao
1,*
1
School of Design, Shanghai Jiao Tong University, Shanghai 200240, China
2
College of Art and Design, Shanghai Normal University Tianhua College, Shanghai 201815, China
*
Author to whom correspondence should be addressed.
Land 2024, 13(9), 1528; https://doi.org/10.3390/land13091528
Submission received: 7 August 2024 / Revised: 13 September 2024 / Accepted: 19 September 2024 / Published: 21 September 2024
(This article belongs to the Section Land – Observation and Monitoring)

Abstract

:
Increasingly severe flooding disasters have caused heavy casualties and property losses worldwide. Traditional Chinese villages that rarely experienced flooding disasters in the past have begun to frequently suffer from floods due to unreasonable reconstruction activities such as ground hardening and pond filling caused by urbanization. However, previous studies on hydrological changes and flood disasters caused by reconstruction activities in rural areas are scarce, especially lacking in quantitative analysis and research. In this study, the Storm Water Management Model (SWMM) is used to construct two hydrological models before and after the reconstruction of Hezhai Village, a traditional Chinese village. By simulating and comparing the changes in hydrological indicators of the two models, this study quantitatively analyzes how reconstruction activities caused changes in surface runoff and flooding disasters in Hezhai Village. The results show that the increase in the impervious ratio in the village has obvious effects on the total runoff, peak runoff, and runoff coefficient. And the reconstruction of ponds and canals has a notable impact on flooding. This study further delves into the logic of flooding at ponds and ordinary nodes and analyzes the specific reasons for flooding in Hezhai Village. Based on this, the paper provides recommendations for the optimization of the reconstruction of Hezhai Village.

1. Introduction

The intensification of global climate change and the frequent occurrence of high-intensity rainstorms result in an increasing frequency of global flooding disasters [1]. Rapid urbanization is exacerbating the problem [2]. Urbanization leads to dramatic land cover change and an increase in impervious surface, which greatly alter the surface hydrology [3,4,5,6]. Different regions around the world have suffered from serious flooding problems [1,7,8].
In contrast, many traditional Chinese villages have rarely suffered from floods, as recorded in written history. This is because these traditional villages have accumulated rich ecological wisdom of stormwater management in the process of long-term adaptation to the natural environment [9]. However, with the progress of China’s Rural Revitalization and New Urbanization strategy, rural reconstruction has developed unprecedentedly. The hardening of roads and sites in rural areas has led to an increase in the impervious rate of villages, resulting in frequent occurrences of flood disasters [9,10]. This reveals a lack of awareness of experiences and ecological knowledge of stormwater management in traditional villages among modern people, as well as a lack of scientific assessment of the potential ecological and environmental impacts, especially those related to flood disasters, that may arise from rural reconstruction activities. Fortunately, these have attracted the attention of some scholars, who have carried out some studies.
Many studies have begun to pay attention to the experience and ecological knowledge of stormwater management in traditional Chinese villages. For example, Liu et al. analyzed the ecological knowledge of site selection and flood prevention in traditional Chinese villages [11]. Zhou et al. found that the western suburb of Beijing has formed a complex rainwater regulation system integrating the functions of “water diversion—water storage—water drainage—water diversion”, which is an excellent case of stormwater management [12]. Li et al. discussed the wisdom and role of stormwater management facilities such as ponds and canals in stormwater management in Zhuge’s traditional village [9]. Overall, the above studies provide a certain understanding of the rainwater management facilities and mechanisms in traditional villages, but there is no in-depth exploration of how reconstruction activities affect the village’s rainwater management system.
Regarding the impact of urbanization construction activities on floods and surface hydrology in urban and rural areas, many studies argue that urbanization has altered the nature of urban underlying surfaces. This results in an increased runoff coefficient, higher surface runoff volumes, significantly faster rainwater convergence speeds, and an earlier occurrence of flood peaks [13,14,15]. Many studies have explored the relationship between the impervious area ratio and the runoff coefficient [16,17]. Paul et al. proposed, through a summative analysis of previous studies, that with an increase of 10–100% in impermeable area, the runoff formed by the same rainfall will increase by 200–500% [18].
In addition, some studies suggested that the reconstruction of drainage systems, such as straightening, dredging, and regulating natural river channels in cities, can increase channel flow velocity, leading to increased runoff velocity and peak discharge [19]. Babaei et al. explored the causes of urban floods and suggested that floods can occur when the water depth in nodes or conduits exceeds their maximum designed depth [20].
Many studies have focused on the role of ponds in stormwater management, revealing that ponds contribute to reducing flood intensity [21,22]. The size and spatial configuration of ponds play a crucial role in the effectiveness of stormwater regulation (reducing peak discharge, etc.) [23,24]. The integration of ponds and canals can better facilitate their role in regulating stormwater runoff [25]. However, urbanization has led to the landfill of ponds, which has become a common phenomenon that has resulted in a reduced capacity for hydrological regulation and an increased risk of flooding [25,26].
There are also studies that have begun to pay attention to the impacts of reconstruction activities on surface hydrology and rainfall-induced floods in rural areas [27]. Some studies have explored the problems of land use change in rural areas due to urbanization, resulting in surface runoff change and water pollution [16,28]. Some scholars have especially discussed the flooding problem caused by the transformation of permeable pavement into impervious pavement on roads in rural areas [29,30].
Previous studies on the impact of human construction activities on the water environment in urban and rural areas mainly focused on the changes in hydrology, runoff, and flooding caused by land use changes. But, little attention has been paid to the impact of the destruction of stormwater management facilities on village surface hydrology.
However, in traditional Chinese villages, there are generally well-established rainwater regulation systems composed of stormwater management facilities, which play a key role in village surface hydrological regulation [9]. The main aims of this study are to quantitatively analyze the changes in village stormwater management facilities caused by reconstruction activities, and the resulting alterations in surface runoff by using the SWMM, which is a commonly used rainstorm management model [8] and well suited to hydrological simulation and analysis [2,31]. Then, the reasons behind the emergence of flooding issues in traditional Chinese villages since the acceleration of urbanization are explained. From the perspective of stormwater management, the rationality of village reconstruction activities is evaluated to provide a scientific basis for guiding the construction or reconstruction of the villages in a sustainable and responsible manner.

2. Materials and Methods

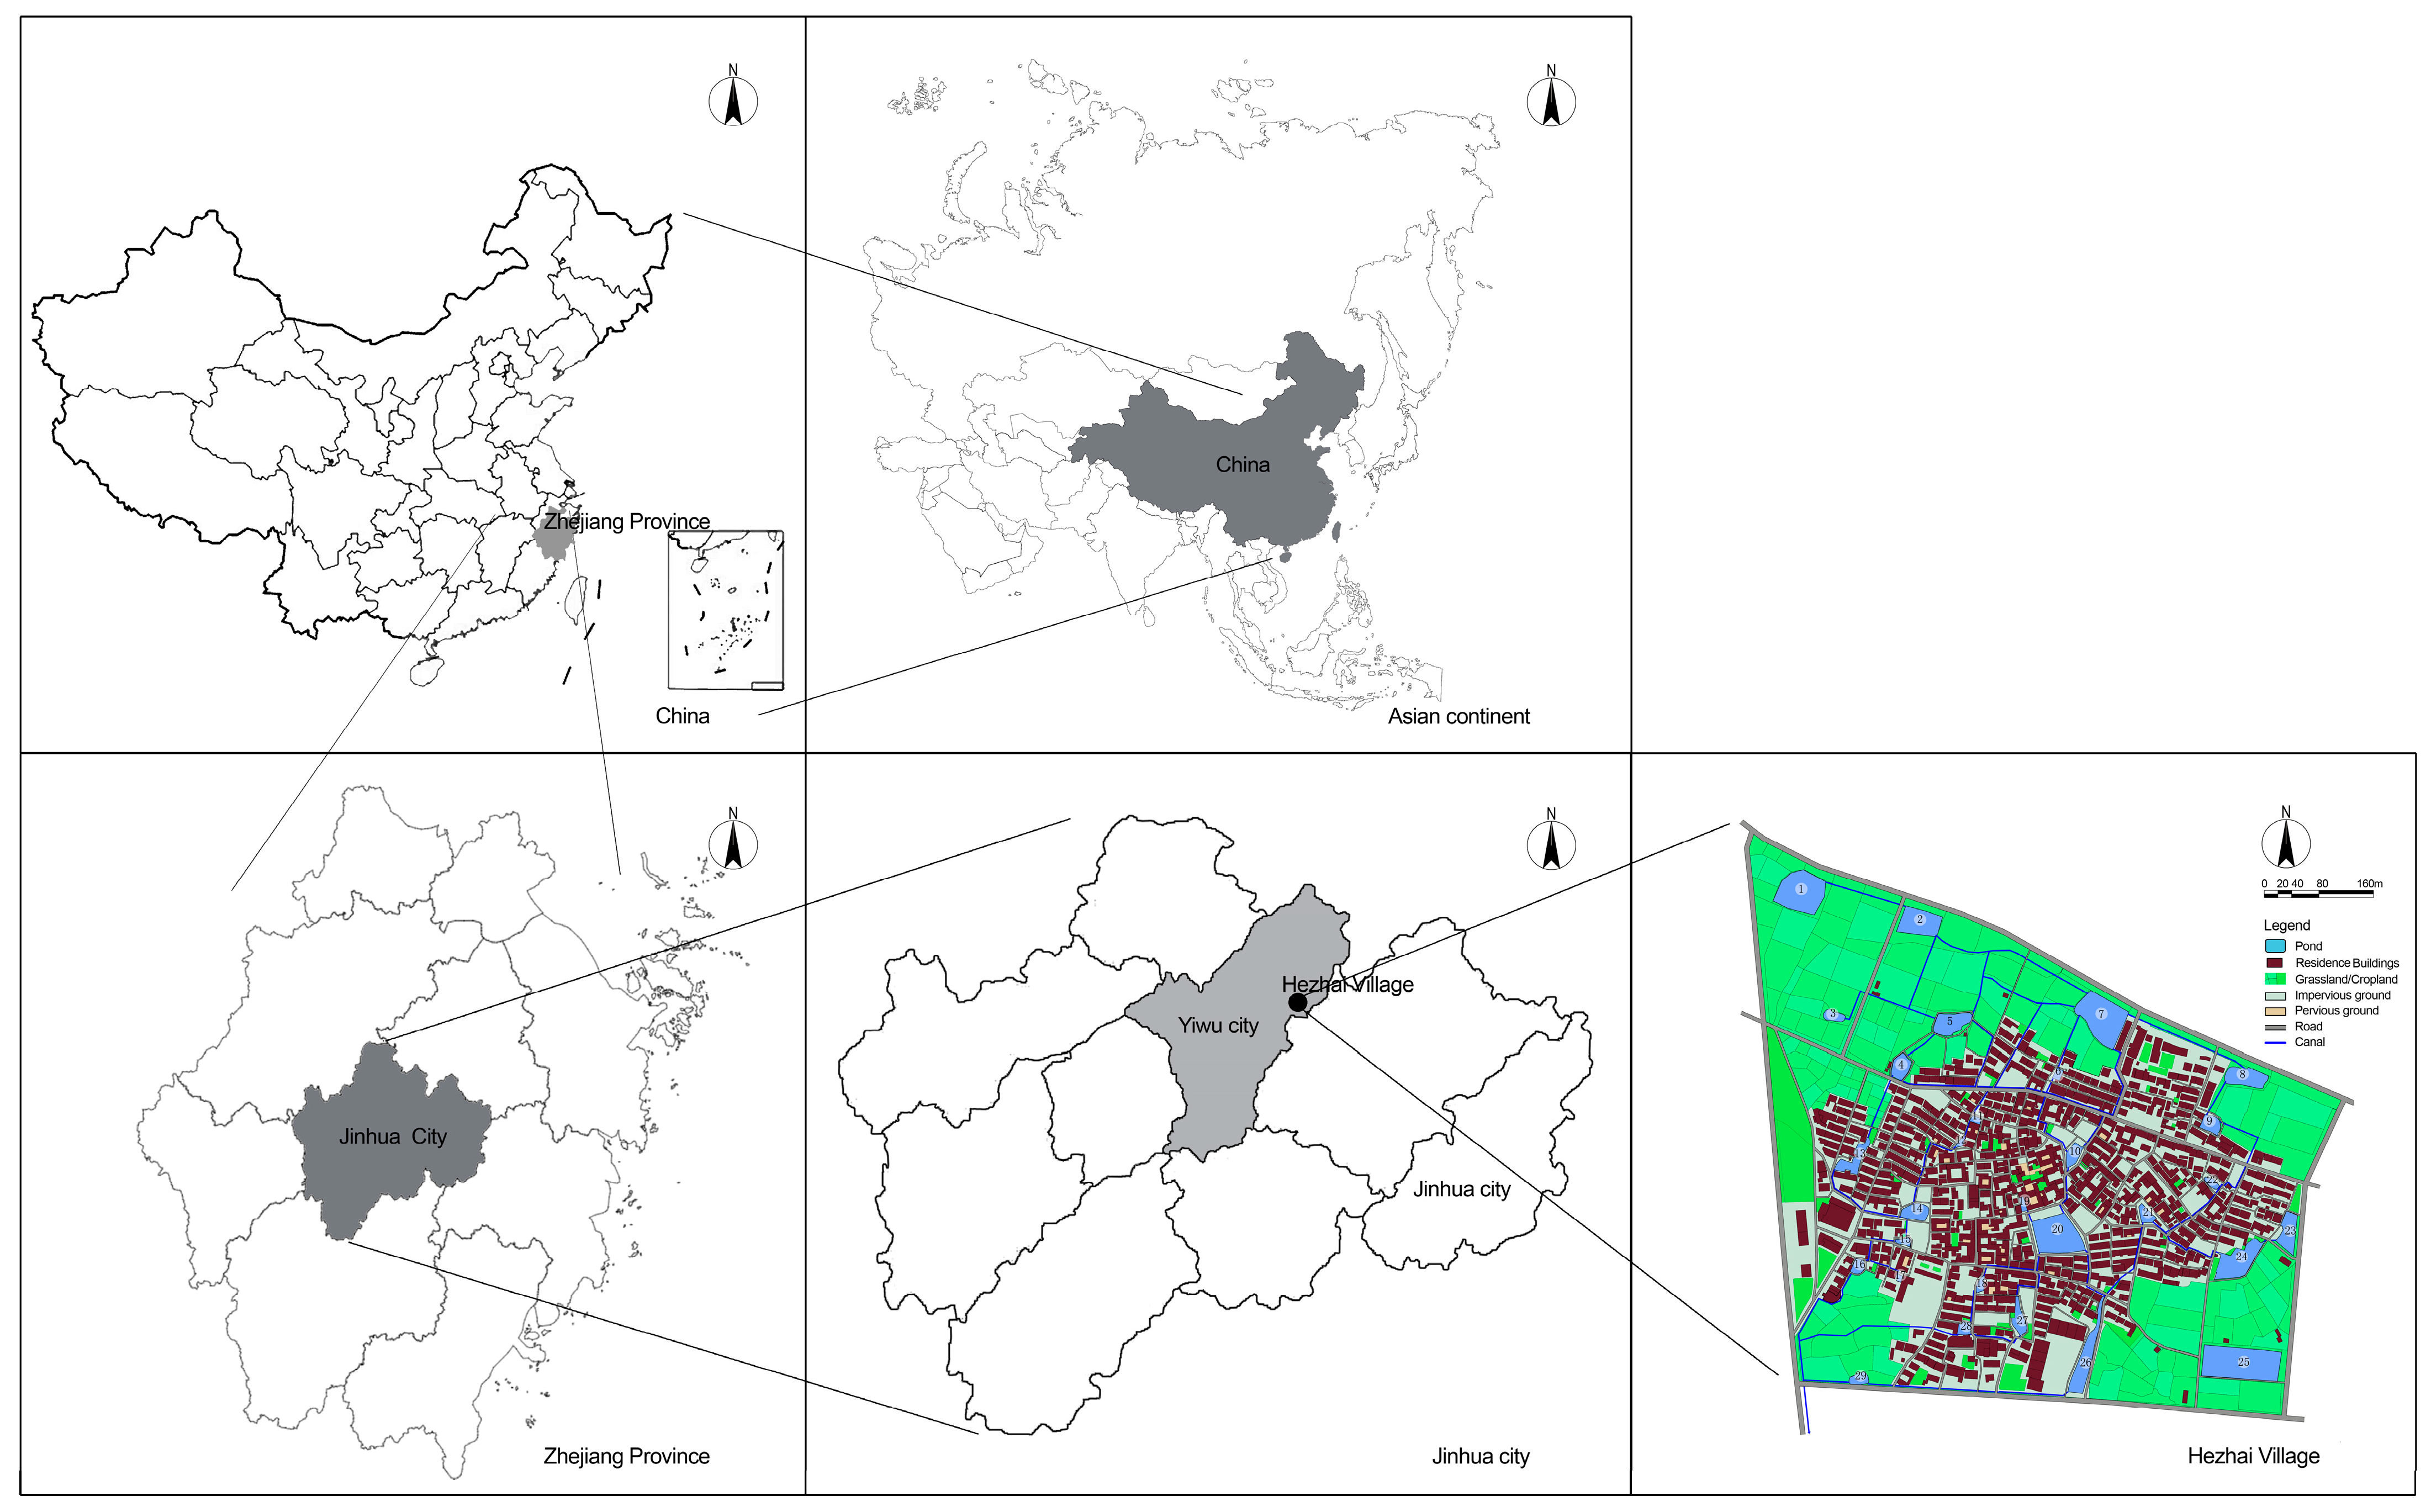
2.1. Description of the Study Area
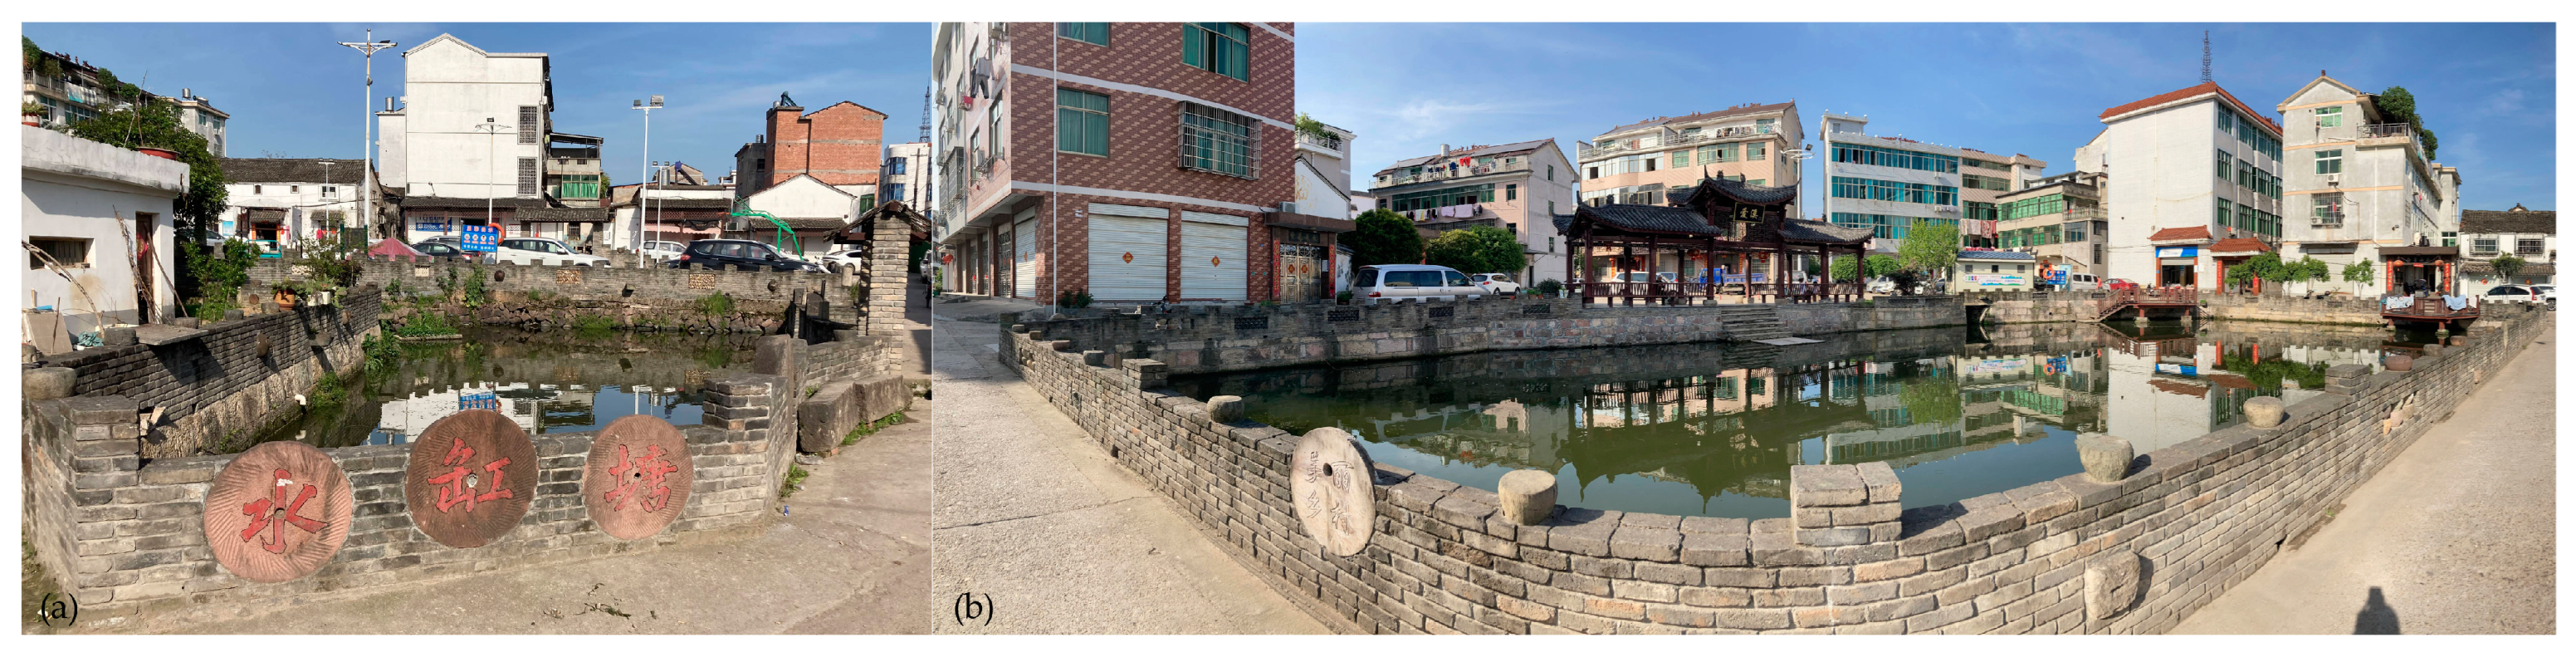
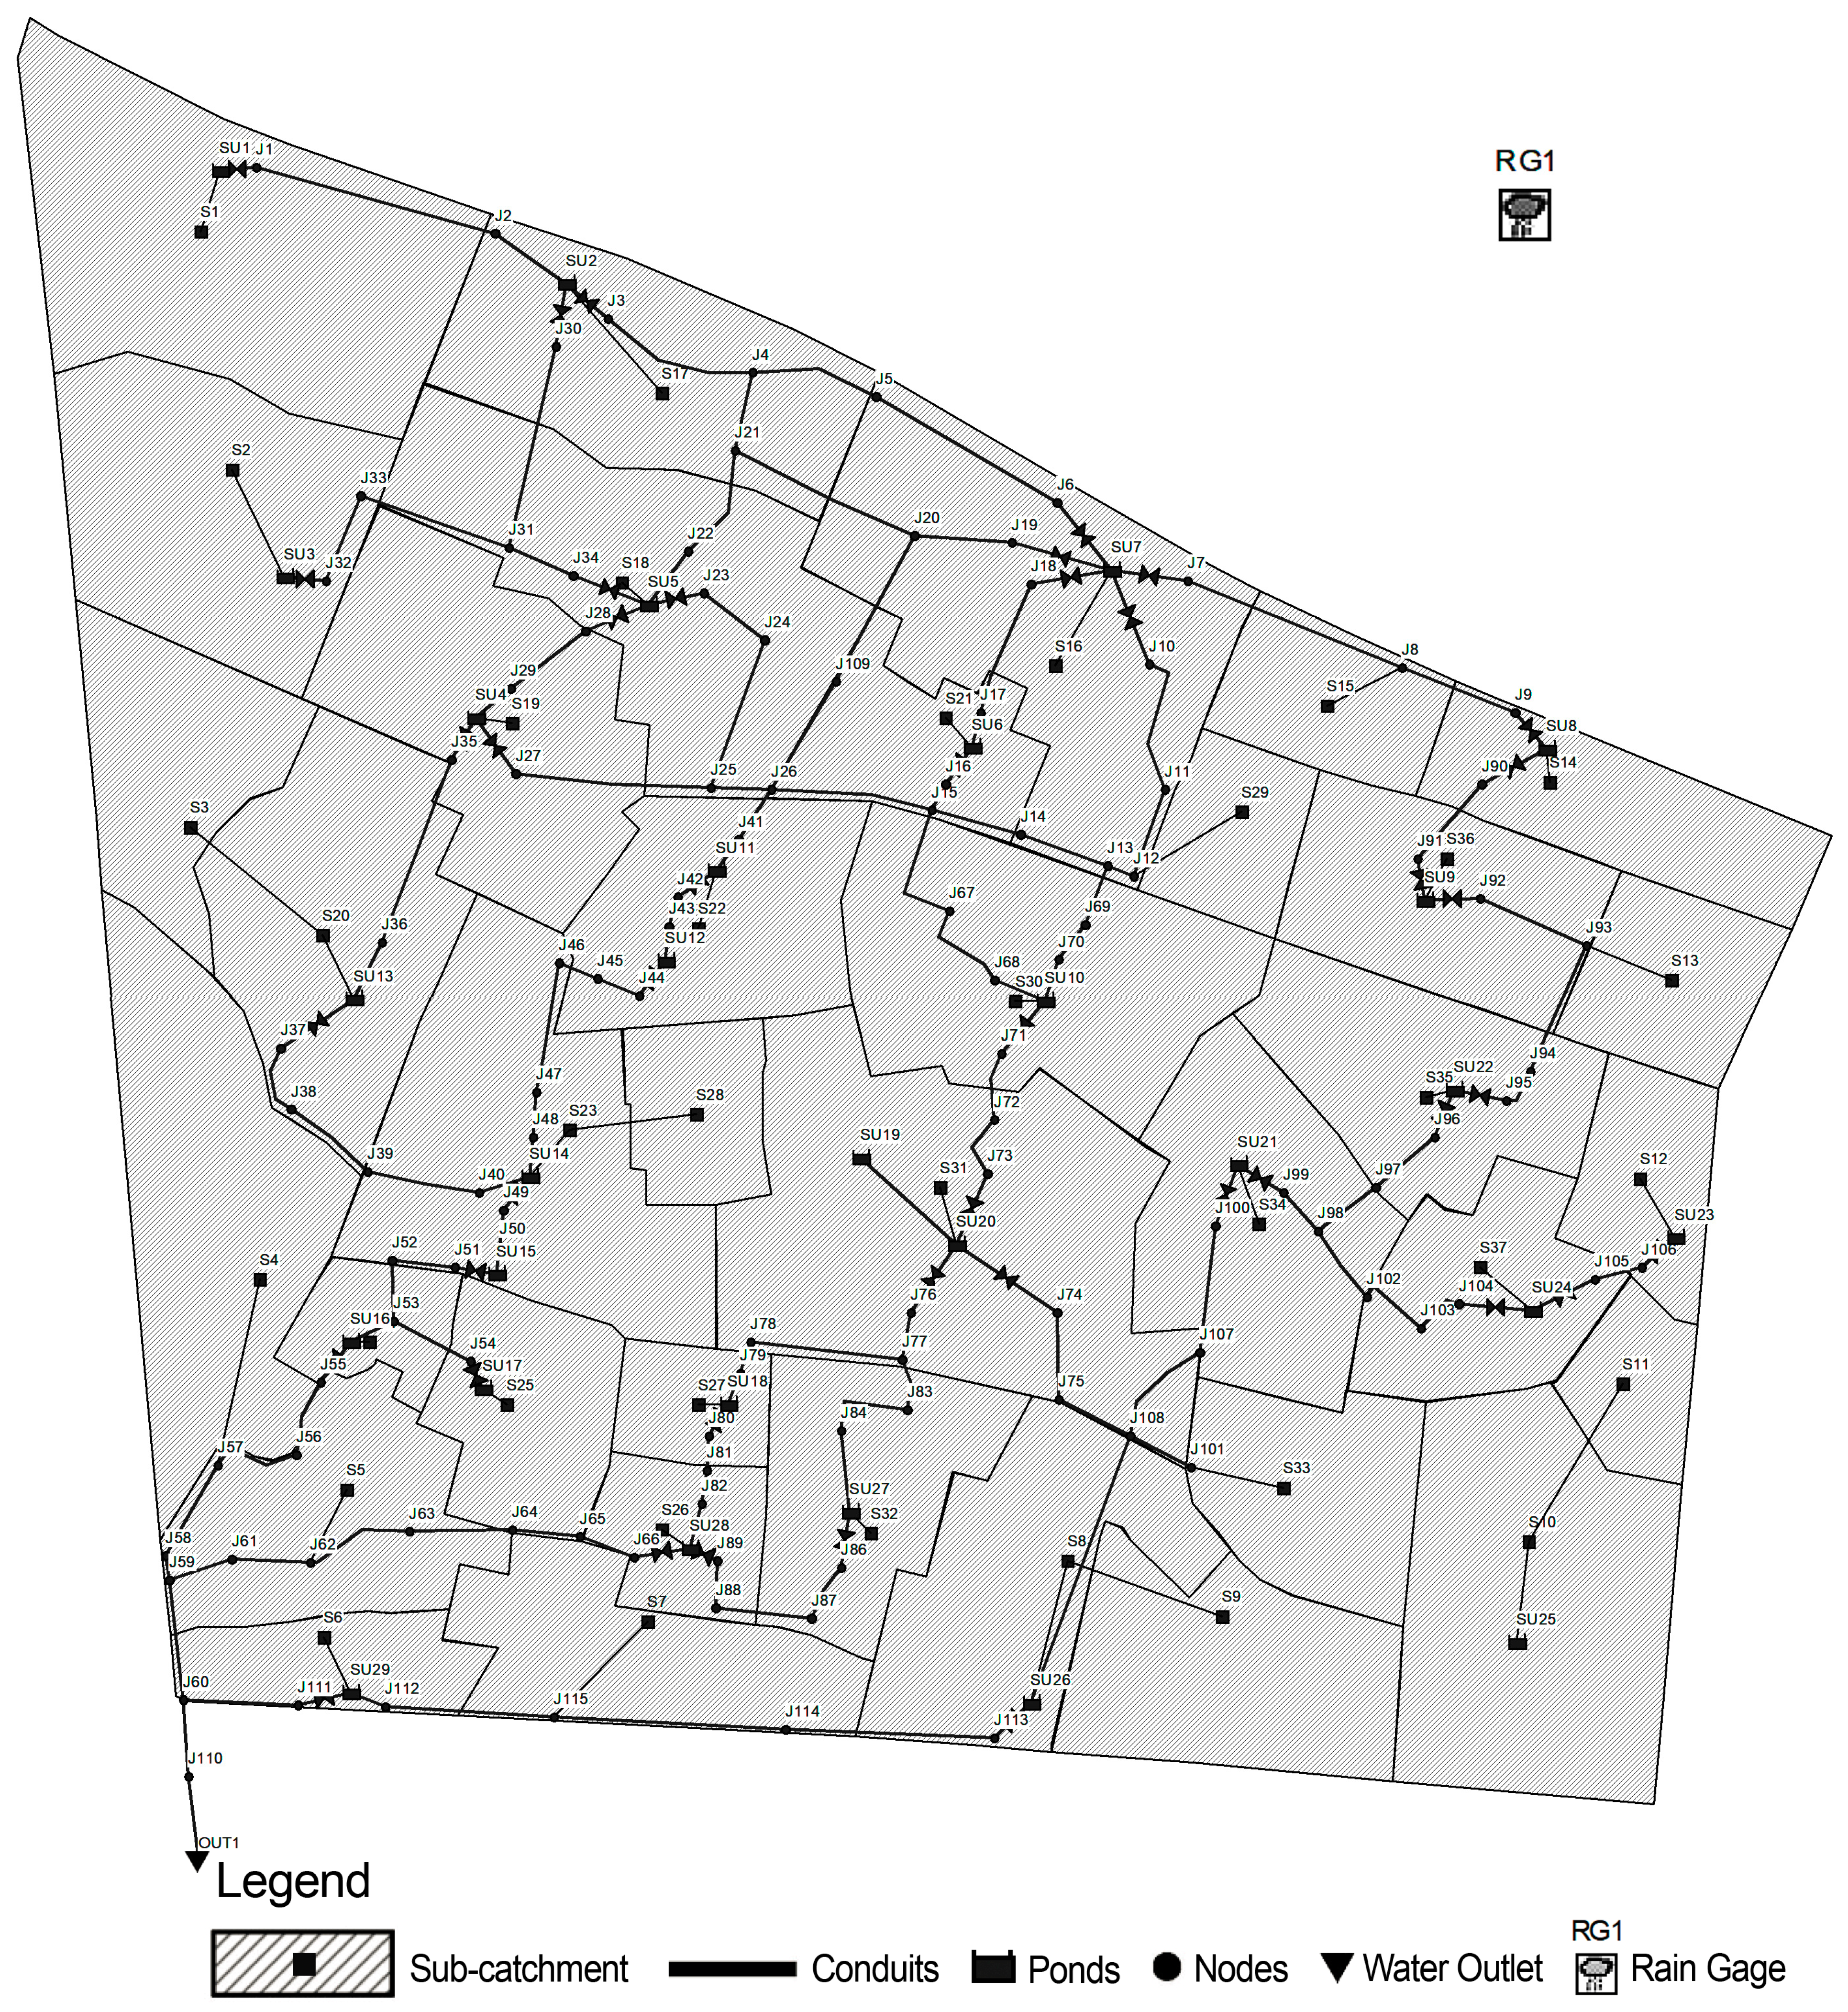
2.1.1. Study Area

The study area is located in Hezhai Village, the easternmost part of Yiwu City, Jinhua City, Zhejiang Province, China, with an area of 50.72 hectares (Figure 1). Hezhai Village is a traditional village with a history of more than 500 years. This village has numerous historical sites and a profound cultural heritage. There are 21 existing ancient buildings, mainly located in the middle of the village. There are many ponds and canals in Hezhai Village. Multiple ponds are the symbolic feature of water culture in Hezhai Village (Figure 2).
Hezhai Village is located in Jinqu Basin in the hilly area of Zhejiang Province, where the overall terrain is low in the south, high in the north, and relatively flat. The lowest point in the south is at an elevation of 68.1 m, and the highest point in the northwest is 75.8 m above sea level, so the average slope of the study site is 1.27%. The annual average temperature is 17.7 °C, the annual average total precipitation is 1386.6 mm, and the rainfall is mainly concentrated from May to September [32]. The main type of soil in the study area is red loam, followed by paddy soil [32]. Affected by terrain and climate conditions, groundwater resources in the study area are abundant, and the groundwater level is only 1–2 m underground [32].
Hezhai Village is a typical traditional settlement in the southern part of the Yangtze River in China. Since these villages are located in shallow hilly areas, their main source of domestic water is ponds rather than rivers. It has been confirmed that artificial rainwater regulation systems composed of ponds, canals, and permeable pavement play an important role in stormwater management in multi-pond villages such as Hezhai Village [9].
Ponds are the key element of the rainwater regulation system in Hezhai Village, serving dual purposes of water storage and flood discharge. Rainwater from the surrounding areas of each pond converges into them, creating a catchment zone. Water canals, as primary water transportation infrastructure, facilitate the connection between ponds, water diversion, and drainage, ensuring efficient management of water resources in the village. Open canals are more common in Hezhai Village, with a width between 0.5 m and 1.5 m and a depth between 0.6 m and 1.2 m. Permeable pavement has the function of rainwater evacuation and infiltration. Traditionally, Hezhai Village features permeable pavements for sites and roads. In order to facilitate the quick evacuation of rainwater, most of the wide roads in the village are paved with smooth bluestone slabs. At the same time, in order to facilitate the easier penetration of rainwater, many narrow roads and sites are frequently paved with gravel or pebbles, which can slow stormwater runoff.

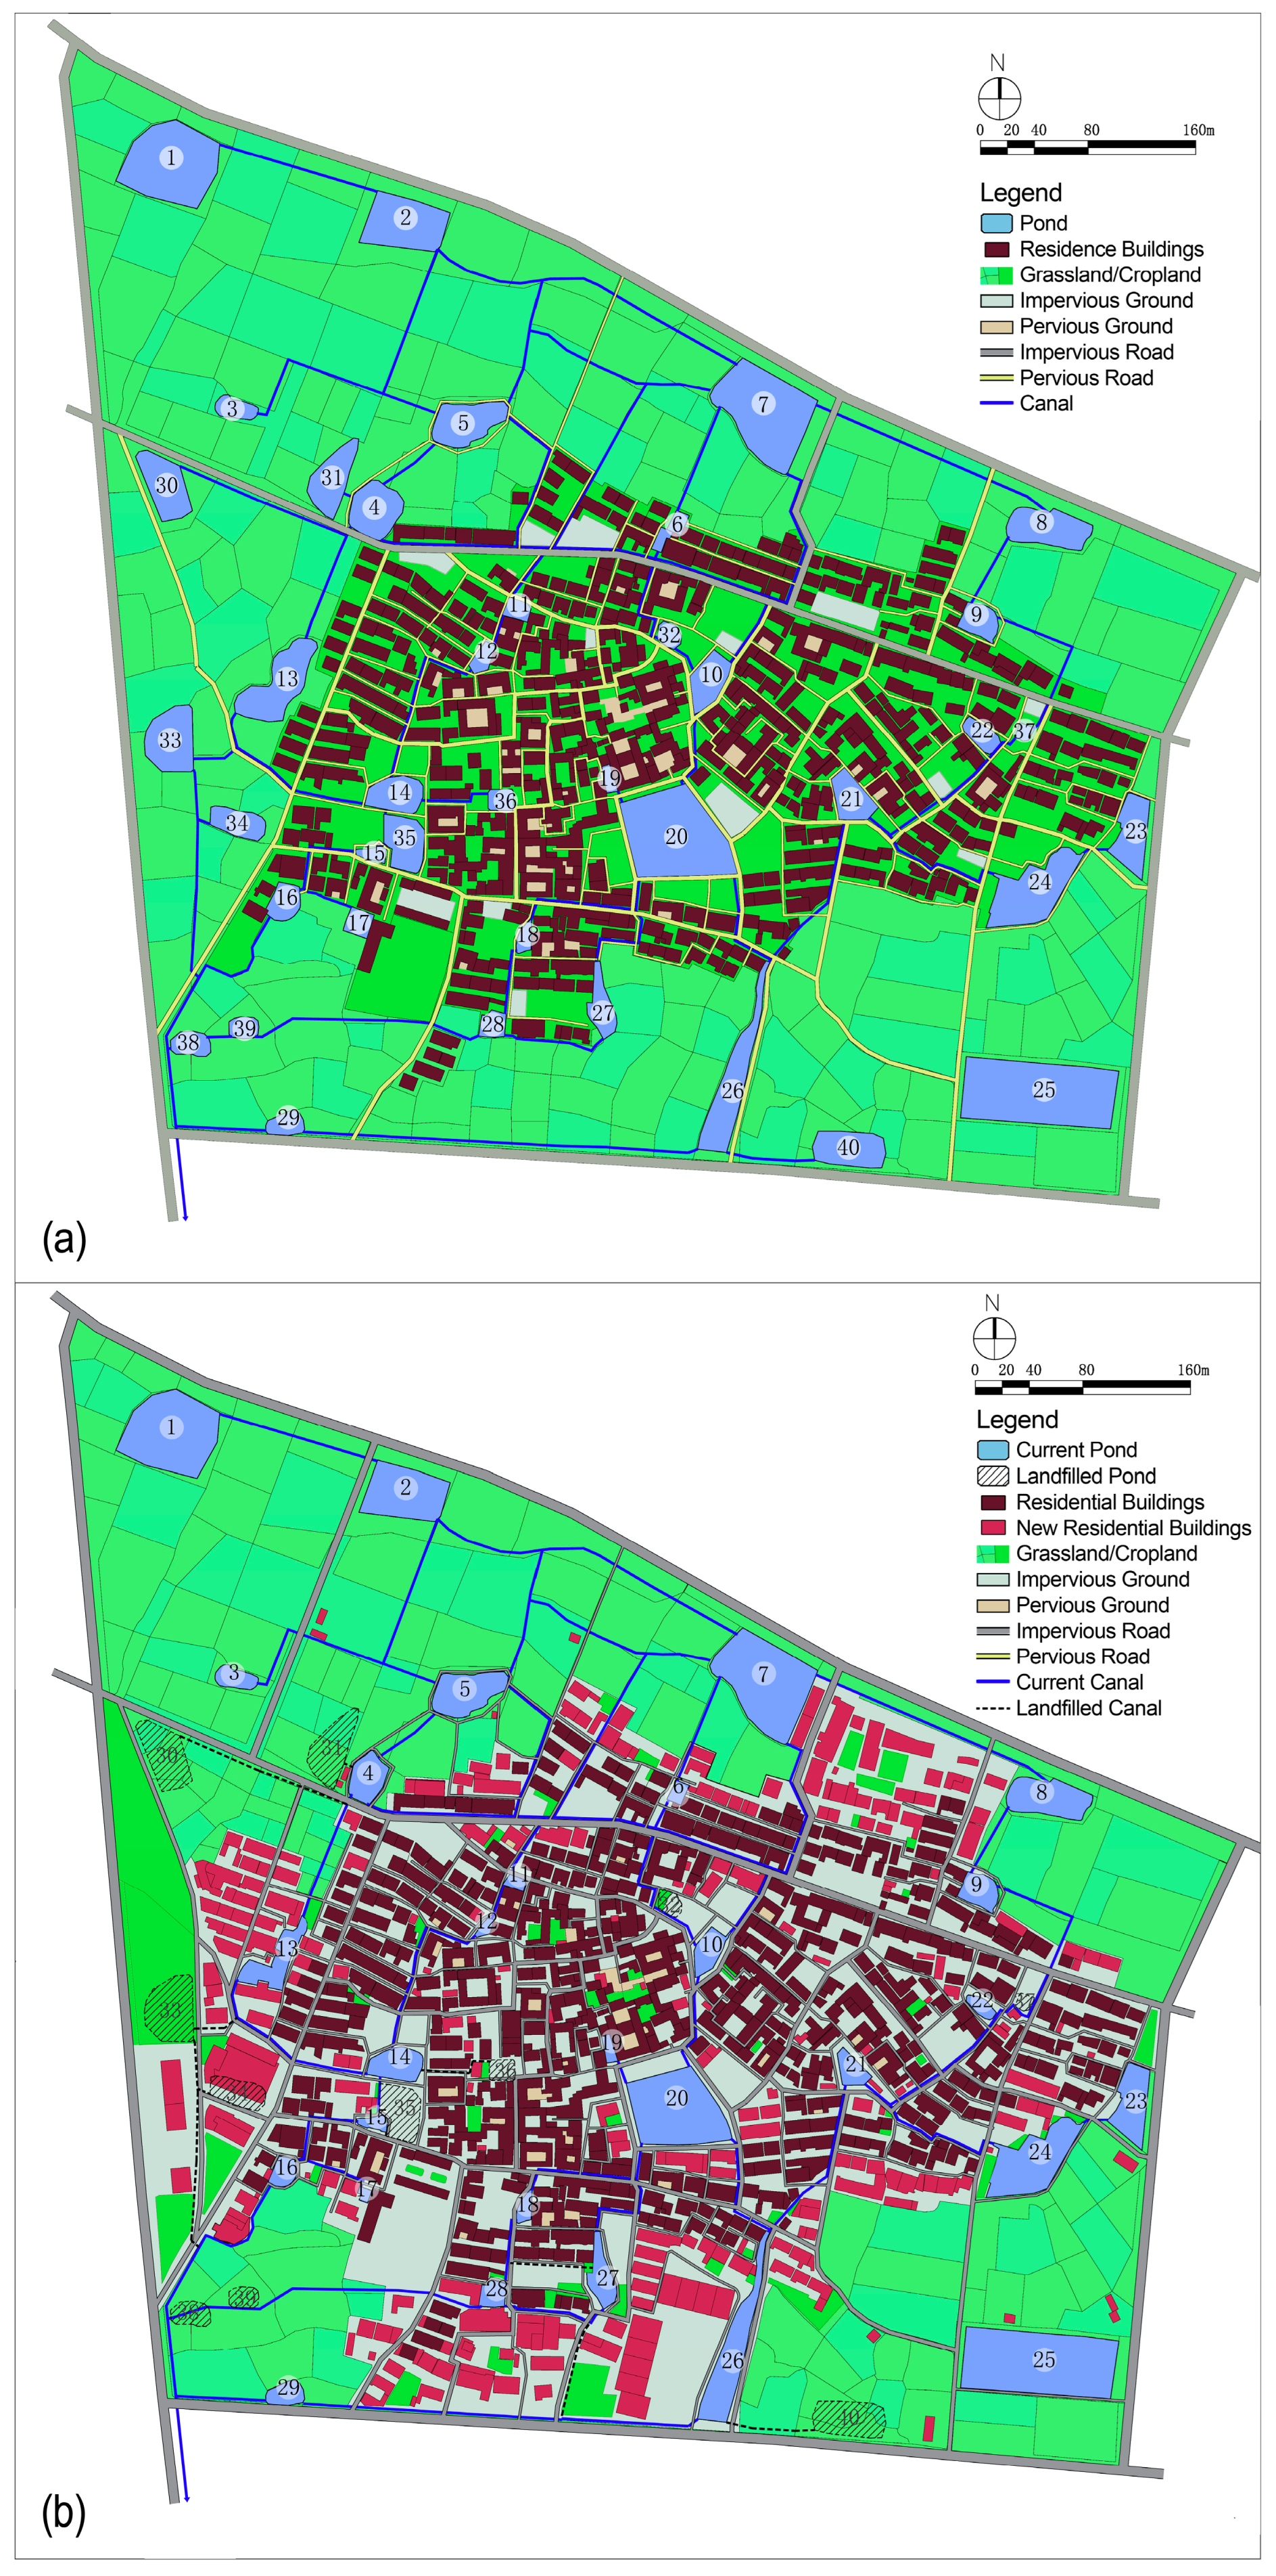
2.1.2. Changes before and after Reconstruction in the Study Area

Thirty years ago, Hezhai Village largely maintained its traditional state, with slow changes to its spatial layout and relatively stable ponds and canals. The roads and sites within the village were mainly paved with permeable materials, and a significant amount of green space was preserved (see Figure 3a). With the progress of urbanization in China, Hezhai Village began large-scale construction and reconstruction activities around 1995. These included hardening of roads and ground, reduction in green space, filling or shrinking of ponds, narrowing or filling of canals, etc. Although such reconstruction activities have made villages cleaner and cars more convenient to travel with and park, they have also exposed the problem of flooding. According to villagers’ descriptions, in recent years, flooding has been a common occurrence during heavy rainfalls in the village, causing inconvenience and safety concerns for the villagers.
In order to quantitatively analyze the impact of urbanization-driven reconstruction activities on the surface runoff of Hezhai Village, this study compared the village scenario 30 years ago (before the reconstruction) with the current situation (after the reconstruction). Based on the 2019 survey map of the research area, drone aerial photos, and on-site investigation, a current situation plan (Figure 3b) was created (after reconstruction, 2023). According to the 1991 survey map, the 1993 satellite image, and the on-site identification of local elders, the plan of Hezhai Village 30 years ago (see Figure 3a) was created.
Due to the urbanization-driven reconstruction activities, major stormwater management facilities in Hezhai Village have undergone great changes, which mainly include the following: (1) 11 ponds have been landfilled and 12 ponds have been shrunk; (2) 14 sections of canals have been narrowed and 13 canals have been landfilled; (3) before the reconstruction, the roads and sites within the study area were mainly paved with permeable materials such as pebbles and crushed stones; there were also plenty of green spaces within the study area. After the reconstruction, the original permeable roads were changed to impervious cement pavement, the large area of green space in the village was also changed to impervious cement sites, and 267 new buildings were added, so the impervious rate of the whole study area increased from 23.88% to 49.60%. Specifically, for the individual sub-catchment areas, the impervious area ratio increased by more than 40% in S4, S7, S8, S12, S15, S21, S23, S24, S25, S27, S28, S29, S30, S32, S34, S35, and S37. The impervious area ratio increased by more than 30% in S20, S22, S26, and S31, as shown in Figure 4.

2.2. Data Used

The SWMM is used to simulate and quantify the hydrological changes in Hezhai Village before and after reconstruction. The following data are needed to construct an SWMM: sub-catchment data, conduit data, node data, pond data, topographic elevation data, land use data, etc. The sub-catchment areas are calculated automatically in SWMM software (Version 5.1.011). The average slope of the sub-catchment area is calculated by GIS, according to the elevation data of Hezhai Village provided by the Niansanli Town government. Characteristic width (W) is calculated based on the following formula:
W = K A
where A is the catchment area, m2; 0.2 < K < 5.
Conduit data, junction data, pond data, and topographic data were primarily sourced from the Niansanli Town government and the Hezhai Village Committee, complemented by field measurements. The land use data were obtained by field measurements and aerial maps provided by the Niansanli Town government.

2.3. Research Methods

This study mainly uses the SWMM to quantitatively analyze the impact of urbanization-driven reconstruction activities on the surface runoff of Hezhai Village and then attempts to answer the question of why Hezhai Village, which rarely experienced flooding before reconstruction, frequently experienced flooding after reconstruction. Specifically, (1) two SWMM hydrological models before and after the reconstruction of Hezhai Village are constructed, and the model parameters are calibrated; (2) the changes in hydrological parameters such as total runoff, runoff coefficient, runoff peak, flooding volume, etc., of the two SWMMs before and after reconstruction at 5a (5-year returned rainfall) and 50a (50-year returned rainfall) are simulated and analyzed; (3) the problems of how reconstruction activities such as pond filling or shrinking, canal filling or narrowing, and impervious rate increasing caused hydrological changes and flooding in Hezhai Village are quantitatively analyzed; (4) based on the above analysis, suggestions for the reasonable reconstruction of Hezhai Village are put forward (see Figure 5).

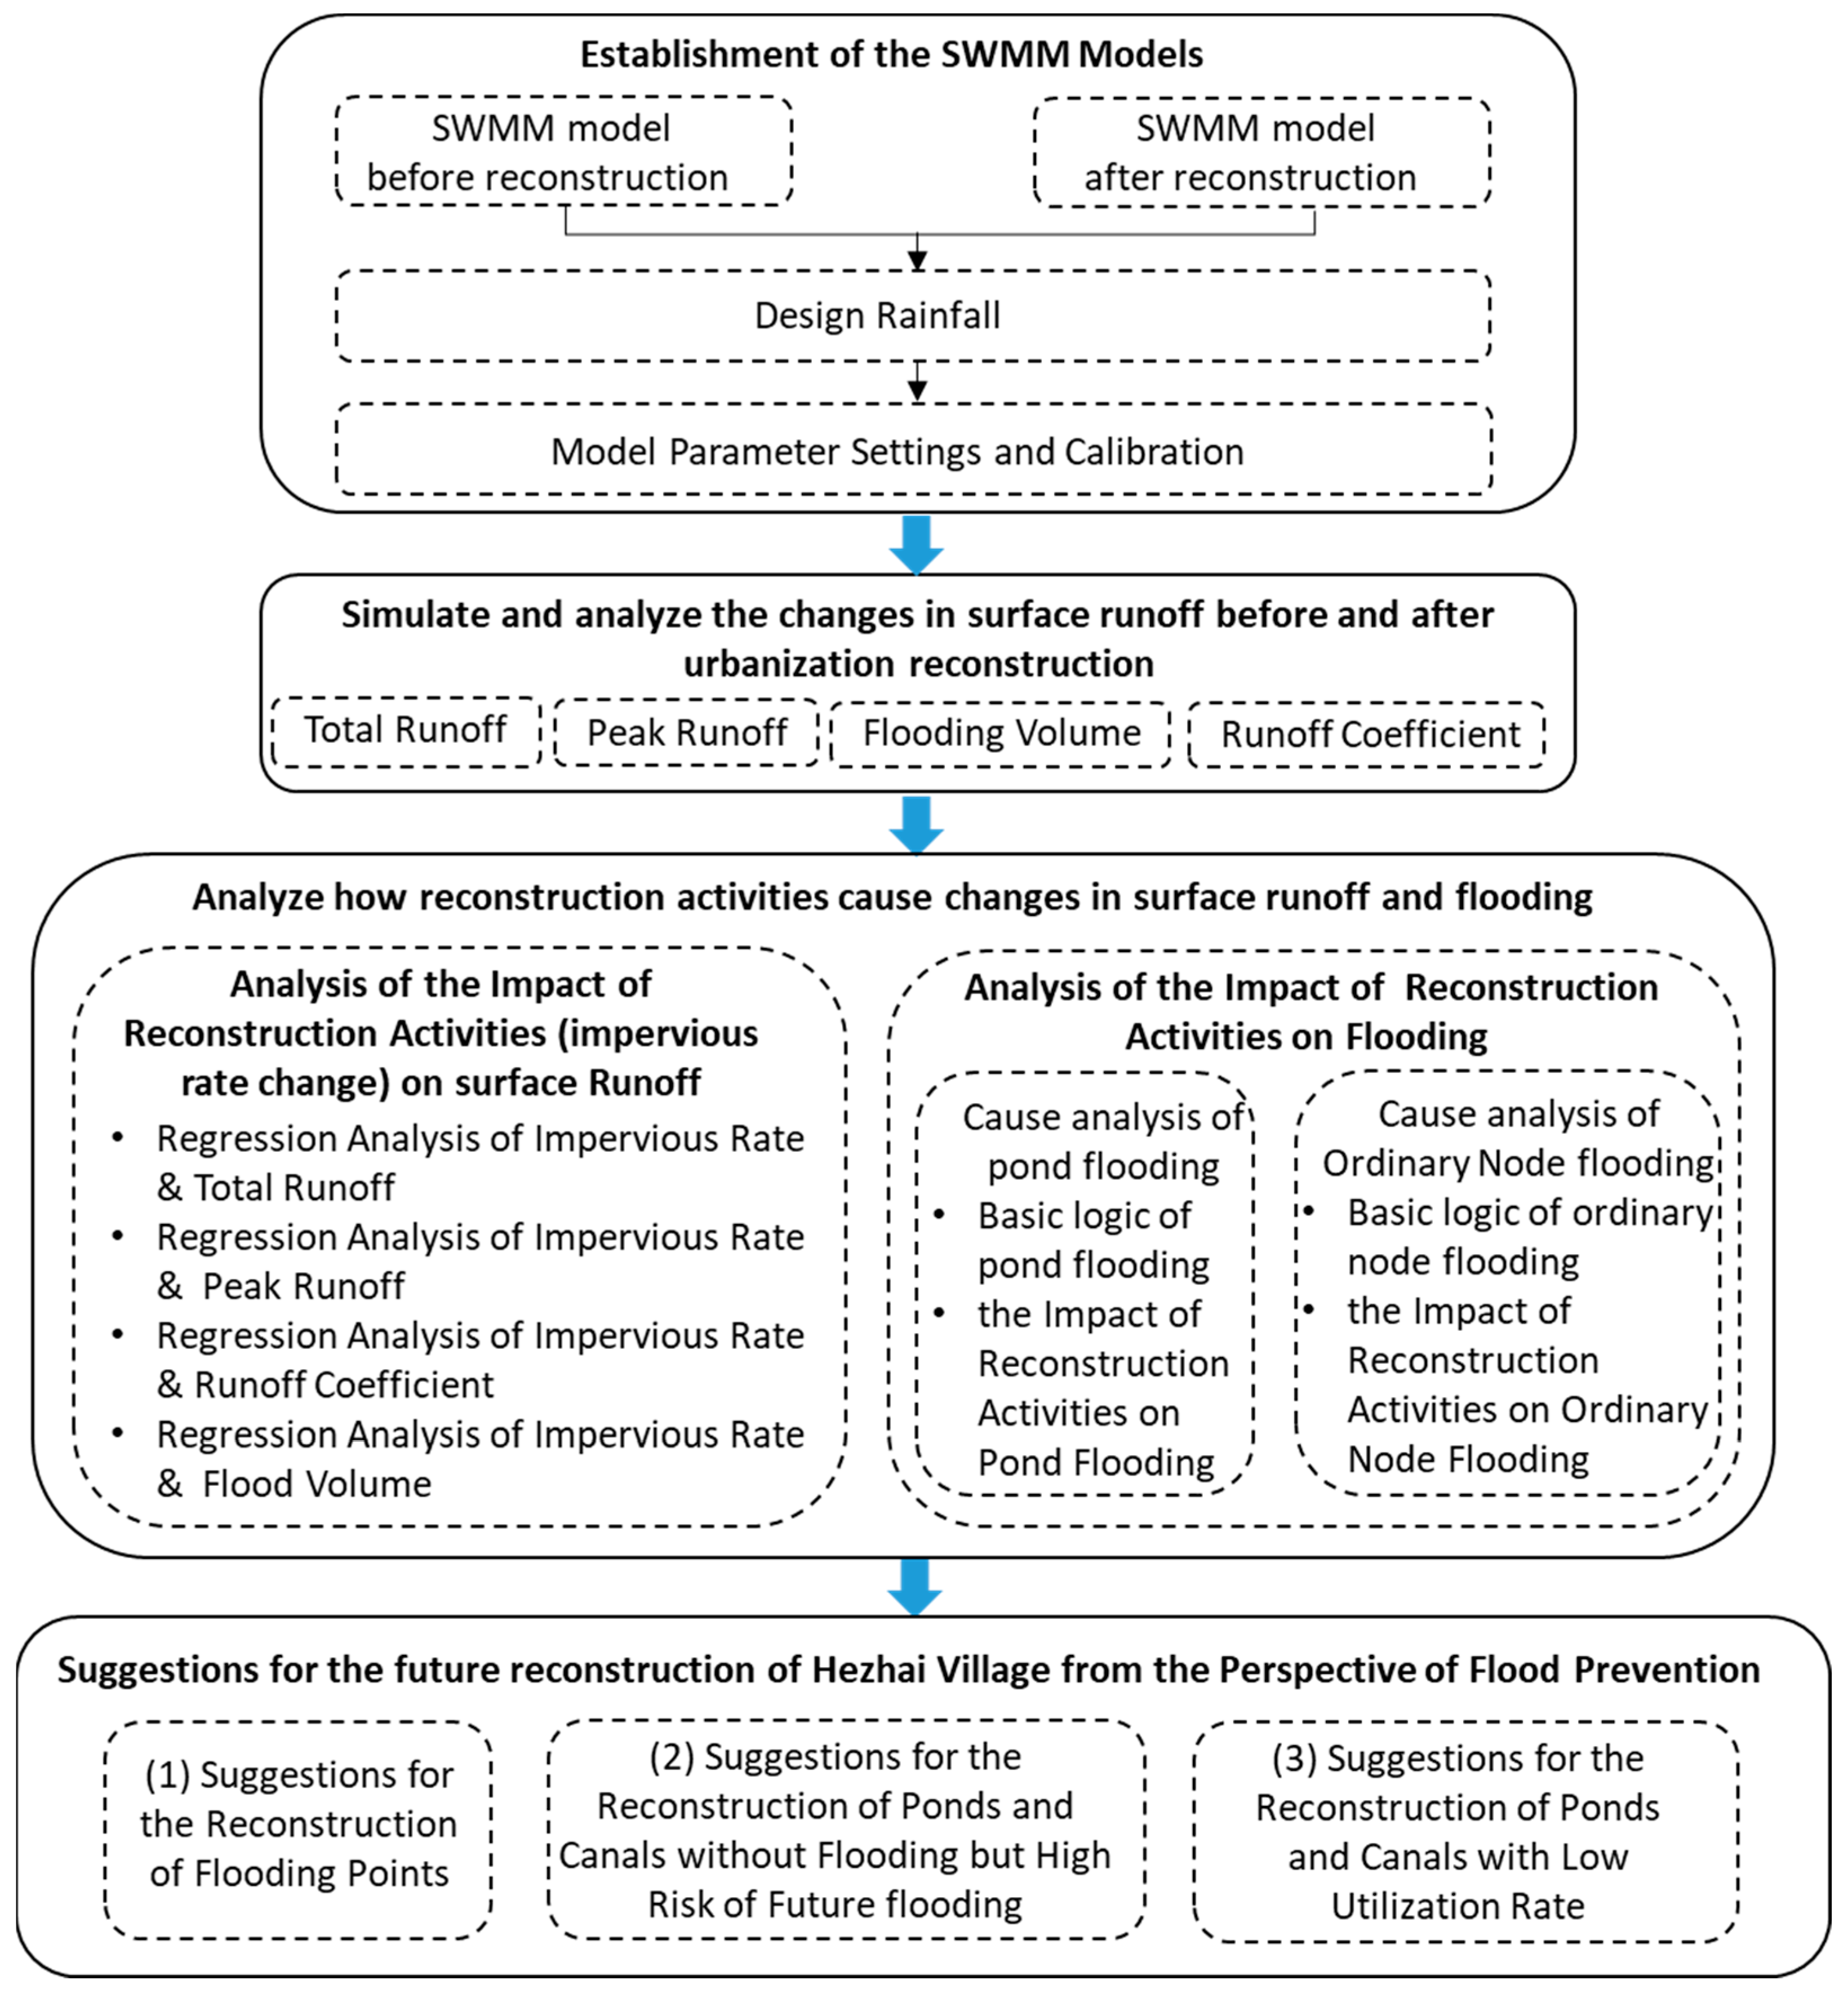
2.3.1. Establishment of the SWMM

(1) SWMM
The EPA Storm Water Management Model (SWMM) is a dynamic rainfall–runoff simulation tool developed by the United States Environmental Protection Agency (USEPA) in 1971 for predicting and managing rainfall runoff and water quality [33,34]. The SWMM can simulate hydrological and water quality in both urbanized and non-urbanized areas [8]. The SWMM is now widely used in the planning, analysis, and design of drainage systems and the evaluation of rainstorm management measures [35].
In the SWMM, sub-catchments are used as the spatial unit to simulate the surface runoff of the whole basin (study area). A sub-catchment is an area of land whose runoff drains to a common outlet point, which could be either a node of the drainage network or another sub-catchment. Sub-catchment areas are generally divided according to topography, land use, and pipe network layout. Each sub-catchment area can be divided into permeable ground and impervious ground. Impervious ground is divided into impervious ground with low-lying storage capacity and impervious ground without low-lying storage capacity. The rainfall in the sub-catchment area with a certain spatial and temporal distribution is transformed into the runoff process through two stages of runoff production and confluence. The runoff from each sub-catchment area enters the pipelines and river channels and finally flows out from the outlet of the basin, and the rainstorm hydrological process of the basin can be obtained through the discharge calculation [33,34]. The whole SWMM calculation process can be divided into three parts: precipitation module, surface runoff module, and pipe network transport module [34].
(2) Conceptualization of Drainage Systems in Research Area
The study area of Hezhai Village is located within the boundaries of four surrounding roads, with minimal external surface runoff entering the area, providing favorable conditions for hydrological simulation by the SWMM. To compare the hydrological changes before and after the reconstruction of Hezhai Village, conceptual models of the drainage system for both the pre-reconstruction and post-reconstruction states of Hezhai Village are constructed, as shown in Figure 6 and Figure 7.
The study area, taking into account the terrain and the direction of water canal convergence, has been meticulously divided into 37 distinct sub-catchments. In the SWMM, the ponds are designated as storage units. Each pond’s inlet is interconnected with the upstream conduits, with a setting orifice at the pond outlet. Most conduits are open canals, and their depth and width are set in accordance with the actual survey and measurement values obtained from on-site investigations. In the model before reconstruction, there are 40 ponds, 124 sections of conduits, and 1 runoff outlet. In the model after reconstruction, there are 29 ponds, 111 sections of conduits, and 1 runoff outlet. The changes in permeable pavement before and after reconstruction are mainly reflected in the SWMM by adjusting the proportion of impermeable area in each sub-catchment area.
In this research, the assumption is made that the precipitation in each sub-catchment region of the research area is uniformly distributed, and for surface runoff simulation, the nonlinear reservoir model is employed [36]. Meanwhile, the method of dynamic wave routing is adopted during the flow routing process [36].
(3) Designed Rainfall
Rainfall is an important variable for constructing the SWMM. In this study, the designed rainfall hyetograph is adopted, and the rainstorm intensity is represented by the Horner rainstorm intensity formula [37]. The Chicago rainfall pattern [38,39,40], which is similar to the common rainstorm pattern in China, is used to reflect the rainfall process. The Horner rainstorm intensity formula is as follows [37]:
i = A ( 1 + C l g P ) 167 ( t + b ) n
where i refers to the rainstorm intensity (mm/min); t refers to the rainstorm duration (min); P refers to the return period (year); and A, C, b, and n are the constants, varying by cities and regions. In Yiwu City, A is 7015.518, b is 20.951, C is 0.802, and n is 0.96 [41].
The calculated rainfall for return periods of 1a, 2a, 3a, 5a, 20a, and 50a are 43.73 mm, 54.29 mm, 60.47 mm, 68.25 mm, 89.36 mm, and 103.32 mm, respectively, without considering spatial variations in precipitation. The Chicago rainfall pattern model is adopted, with a rain peak coefficient r of 0.4, a time interval of 1 min, and a rainfall duration of 2 h. The results of designed rainfall for different return periods are shown in Figure 8.
(4) Model Parameter Settings and Calibration
The parameters involved in the SWMM include deterministic parameters and uncertain parameters. Deterministic parameters generally have clear physical meaning and can be obtained directly by measurement or calculation [9,33,34]. Uncertain parameters generally require calibration to determine the values. The calibration process typically involves two steps: (1) setting initial values for uncertain parameters; (2) calibrating the uncertain parameters.
(1) Initial value setting of uncertainty parameters
The initial values for uncertain parameters are set according to the SWMM manual and relevant literature [9,33,34,35,42], as shown in Table 1.
(2) Uncertain parameter calibration
Due to the lack of rainstorm runoff measurement data in the study area, the uncertain parameters in SWMM cannot be calibrated with actual data. So, this study uses the runoff coefficient method [43] to calibrate the uncertain parameters. Because the comprehensive runoff coefficient of a certain area is a relatively stable value, when the simulated value of the comprehensive runoff coefficient calculated by the SWMM is equivalent to the actual comprehensive runoff coefficient value, it indicates that the model parameters are reasonable.
Since this study has constructed two SWMMs for Hezhai Village, one before and one after reconstruction, and there are significant differences in parameters such as imperviousness between the two models, it is necessary to calibrate the parameters for each model separately.
The calibration process is as follows: The comprehensive runoff coefficients of the study area before and after reconstruction are taken as the objective function, and the initial values of uncertain parameters are set according to relevant studies. Three rainfall hyetographs with different return periods of 1a, 2a, and 3a are designed according to the Chicago approach. The simulated value of the comprehensive runoff coefficient of the study area during rainfall for the 2a return period is obtained by the SWMM, and the uncertain parameters are calibrated several times to make the simulated value of the comprehensive runoff coefficient equal to the value of the objective function, so as to obtain a “satisfactory solution”. Then, the robustness of the calibrated models is verified using the rainfall processes with return periods of 1a and 3a, respectively. If both meet the empirical value of the comprehensive runoff coefficient, it indicates that the model parameters are reasonable.
Based on the runoff coefficient values and their area proportions of different land use types in the study area, the comprehensive runoff coefficient value of the study area can be calculated through weighted averaging [44]. According to the Standard for Design of Outdoor Wastewater Engineering (GB 50014-2021) [38] and relevant literature [40], the runoff coefficient values for the main land use types in Hezhai Village are as follows: 0.85 for buildings or impermeable sites/roads, 0.4 for permeable pavement sites/roads, 1 for water surfaces, and 0.15 for green lands or croplands. Finally, the comprehensive runoff coefficient before the reconstruction of Hezhai Village is about 0.405, and the comprehensive runoff coefficient after the reconstruction is about 0.549.
The parameters to be calibrated for the two models before and after the reconstruction of Hezhai Village were manually calibrated 5 and 7 times, respectively. The simulated runoff coefficient of the model before the reconstruction is approximately equal to the objective function value of 0.405, the simulated runoff coefficient after the reconstruction is approximately equal to the objective function value of 0.549, and the “satisfactory solution” of the model parameters is obtained.
The rainfall processes with two return periods, 1a and 3a, were then used to test the two models. The impervious rate in the study area before the reconstruction is 23.88%, which belongs to the area with the sparsest buildings [1]; the simulated runoff coefficients for 1a and 3a of the model before the reconstruction are 0.307 and 0.458, respectively, which are consistent with the empirical values for areas with the sparsest building density (Table 2).
The impervious rate in the study area after the reconstruction is 49.60%, which belongs to the area with sparser buildings [1]; the simulated runoff coefficients for 1a and 3a of the model after the reconstruction are 0.494 and 0.585, respectively, which are consistent with the empirical values for areas with a sparser building density (Table 2).
This indicates that both models have good stability and reasonable parameters, which can be used for subsequent research. The validated parameter values for the two models are shown in Table 3.
Admittedly, due to the lack of real data, this study takes the comprehensive runoff coefficient of the study area as the calibration target to calibrate the parameters of the SWMMs, and the simulation results are only “similar” to the real situation or “different parameters with the same effect” with the real data.

2.3.2. Simulation and Analysis of the Changes in Surface Runoff before and after Urbanization Reconstruction

In order to analyze the impact of urbanization on surface runoff, the SWMM was used to simulate and analyze the changes in total runoff, peak runoff, flooding, and runoff coefficient before and after the reconstruction of Hezhai Village in two rainfall return periods, 5a and 50a.
The reason for selecting these parameters is that total runoff, peak runoff, and runoff coefficient are important indicators reflecting rainstorm hydrology. Flooding is one of the most concerning natural disasters for Chinese village residents, as it significantly impacts their lives, economy, and safety. Briefly, 5a returned rainfall represents relatively common rainstorms that have a notable impact on villages, while rainstorms with return periods exceeding 50a are classified as catastrophic rainstorms in China, and the general flood control standards for urban and rural areas are often set for a 50a rainstorm event. So, this study takes rainstorms with return periods of 5a and 50a as the research scenarios.

2.3.3. Analysis of the Impact of Reconstruction Activities (Impervious Rate Change) on Surface Runoff

Since the rapid urbanization, the reconstruction activities that have had a great impact on surface runoff in Hezhai Village mainly include the improvement of impervious rate due to the extensive hardening of roads and sites, the filling or reduction of ponds, and the filling or narrowing of canals. This study found that a change in surface impervious rate has obvious effects on the total runoff, peak runoff, and runoff coefficient; however, the changes in ponds and canals have no obvious impacts on surface runoff [9].
Therefore, the changes in impervious rates of the 37 sub-catchment areas before and after the reconstruction are taken as independent variables, and the total runoff changes, peak runoff changes, runoff coefficient changes, and flood volume changes before and after the reconstruction of the 37 sub-catchment areas are taken as dependent variables, and a regression analysis is conducted to reveal the impact of village reconstruction activities, represented by the increase in impervious rate, on surface runoff.

2.3.4. Analysis of the Impact of Reconstruction Activities on Flooding

Flooding is one of the most concerning stormwater problems in Chinese rural villages. According to simulations and actual observations, flooding in Hezhai Village mainly occurs in ponds and a few nodes. As water storage units, ponds have a certain water storage function. Therefore, the causes of pond flooding are different from those of ordinary nodes. So, we will analyze the causes of flooding in ponds and ordinary nodes separately.
(1) Cause Analysis of pond flooding
(i) Basic logic of pond flooding
The basic logic of pond flooding, given the pond’s capacity, can be stated as follows: when the total inflow volume into the pond exceeds the total outflow volume, and this excess exceeds the pond’s capacity, flooding will occur, i.e.,
F = I – O − C
where F is the flooding volume; I is the inflow volume; O is the outflow volume; and C is the pond capacity.
In the SWMM, the total inflow volume of a pond is the sum of the inflow from upstream conduits, the runoff from the sub-catchment area where the pond is located, and the initial water storage volume of the pond [39], i.e.,
I = L + IC + Si
where I is the total inflow volume of a pond; L is the runoff from the sub-catchment area (lateral inflow); IC is the inflow from upstream conduits (conduit inflow); Si is the initial water storage volume of the pond (initial storage).
In the SWMM, the total outflow volume of the pond mainly refers to the total outflow from the outlet orifice of the pond.
From the occurrence of a rainstorm to the occurrence of flooding, and then to the stop of flooding, the final stop of surface runoff is a process. The pond runoff process in a rainstorm event is divided into five stages for the convenience of analysis in this study.
Stage 1: From the initial start of the rainstorm until the pond is full but no flooding occurs (see Figure 9).
This stage corresponds to the initial phase of the rainstorm event, where the inflow is greater than the outflow. The net inflow volume (NI) into the pond gradually increases but does not exceed the pond’s storage capacity. The pond fills up gradually until it reaches a state of being just full, but the flooding has not yet occurred, that is,
NI = I − O ≤ C
where NI is the net inflow volume; C is the pond capacity; I is the inflow volume; and O is the outflow volume.
Stage 2: When the pond is flooding (see Figure 9).
In this stage, once the pond reaches its full capacity, the NI begins to exceed the capacity of the pond (C), leading to flooding at the pond. Specifically, the flood volume (F) is equal to the difference between NI and the pond’s capacity, that is,
F = NI − C
where F is the flood volume; NI is the net inflow volume; and C is the pond capacity.
Stage 3: The pond stops flooding but remains full (see Figure 9).
As the rainfall intensity gradually decreases, the inflow velocity (VI) also decreases until it equals the outflow velocity (VO), at which point the NI of the pond reaches its maximum value (NImax). At this moment, the pond stops flooding, but the pond remains in a full state. This situation may remain for a short time, or it may quickly transition to stage 4.
At this point, the flooding volume at the pond node reaches its maximum value (i.e., the final total flooding volume), that is,
Ftotal = NImax − C
where Ftotal is the final total flooding volume; NImax is the maximum net inflow volume; and C is the pond capacity.
Of course, if the pond does not flood, the NI will always be lower than the pond capacity. When the NI reaches its maximum (NImax), the pond is still not full but has reached the Maximum Percent Full value, and at the same time, the minimum remaining capacity (RCmin) of the pond is obtained, that is,
RCmin = C − NImax
where RCmin is the minimum remaining capacity of the pond; NImax is the maximum net inflow volume; and C is the pond capacity.
Stage 4: The pond’s water level gradually declines (see Figure 9).
In this stage, as the rainfall intensity decreases further, the inflow velocity (VI) of the pond gradually becomes less than the outflow velocity (VO). Consequently, the pond stops flooding, and its water level begins to gradually decline.
Stage 5: The pond stops runoff (no inflow, no outflow) (see Figure 9).
In this stage, after the rainfall stops, the inflow of the pond gradually decreases until it stops completely. When the inflow of the pond is 0, and the water above the bottom of the pond orifice in the pond has also run out from the pond outlet, there is no more outflow. Then, the runoff process in the pond stops (i.e., both inflow and outflow are 0).
Of course, the above five stages do not necessarily progress strictly in chronological order (this is a theoretical process). In reality, due to fluctuations in rainfall intensity and the complexity of the study area surface, stages 2, 3, and 4 may experience repetition.
(ii) Analysis of the Impact of Reconstruction Activities on Pond Flooding
Based on the above analysis, it can be concluded that NI and pond capacity (C) are the key factors determining whether flooding occurs. Due to reconstruction activities, such as the increase in impervious paving, NI increased, and the pond capacity decreased due to the partial landfill of the pond. These changes have led to flooding at many ponds within Hezhai Village after reconstruction, despite there being no flooding before reconstruction.
To further quantify the impact of reconstruction activities on pond flooding, this study analyzed the relationship between the maximum net inflow volume, pond capacity, and the flooding volume from the perspective of changes before and after the reconstruction in Hezhai Village.
For the same pond, before reconstruction, there was no flooding, so Formula (8) is applicable. After reconstruction, flooding occurred, so Formula (7) is adopted. In order to distinguish between before and after reconstruction, each variable of Formulas (7) and (8) is labeled with BR (before reconstruction) or AR (after reconstruction), that is,
Ftotal AR = NImax AR − C AR
RCmin BR = CBR − NImax BR
Adding Equation (9) to Equation (10), we obtain
(NImax AR − NImax BR) − (C AR − CBR) = Ftotal AR + RCmin BR
Furthermore,
N I m a x C = F total   AR + R C min   BR
that is,
N I m a x + ( C ) = F total   AR + R C min   BR
where N I m a x is the increase in maximum net inflow volume of the pond after reconstruction compared to before reconstruction; C is the increase in pond capacity after reconstruction compared to before reconstruction, so C is the decrease in pond capacity after reconstruction compared to before reconstruction; R C m i n B R is the minimum remaining capacity (when the pond reaches the Maximum Percent Full) of the pond before reconstruction; F t o t a l A R is the total flooding volume of the pond after reconstruction.
The above equation shows that the sum of the increase in the net inflow volume and the decrease in the pond capacity, that is, the amount of retained rainwater increased after the pond reconstruction, is equal to the flooding volume except for filling the remaining capacity (minimum remaining capacity) of the pond before the reconstruction. This provides a basis for the quantitative analysis of the causes of flooding after pond reconstruction.
(2) Cause analysis of flooding at Ordinary Nodes
(i) Basic logic of ordinary node flooding
Flooding at ordinary nodes differs from that at ponds. Due to the lack of water storage capacity at ordinary nodes, flooding can occur when the downstream canals of the nodes reach full capacity [33]. Therefore, if the Max/Full Depth ratio of the downstream conduit is less than 1, there will be no flooding at the ordinary node. If the Max/Full Depth ratio of the downstream conduit is equal to 1, flooding is likely to occur at the ordinary node.
(ii) Analysis of the Impact of Reconstruction Activities on Ordinary Node Flooding
Based on the above analysis, flooding at ordinary nodes is primarily caused by the full flow of the downstream conduits. The reasons for full flow of the conduits can be traced to two main aspects: increased inflow and reduced outflow.

3. Results

3.1. Changes in Surface Runoff before and after the Reconstruction of Hezhai Village

From the simulation results for the return periods 5a and 50a, there are obvious differences in hydrological parameters before and after the reconstruction, as shown in Figure 10. For the return periods of 5a and 50a, the total runoff of Hezhai Village after the reconstruction increases by 4720 m3 and 5840 m3, and the peak runoff increases by 3.66 m3/s and 3.97 m3/s, respectively, compared with that before the reconstruction. The situation of flooding is even more obvious. Before the reconstruction, there was no flooding observed at 5a and 50a. But after the reconstruction, the total flood volume is 697 m3 and 4357 m3, respectively, at 5a and 50a.

3.2. Identification of Flooding Points after Reconstruction of Hezhai Village

The identification of flooding points is important for stormwater management. The SWMM simulation results provided the specific flooding nodes and flood volume in Hezhai Village at 5a and 50a, as shown in Table 4. The ponds with flooding in Hezhai Village include SU10, SU11, SU12, SU13, SU14, SU15, SU17, SU21, and SU22; the ordinary nodes with flooding include J37, J38, J39, J87, and J98.
The comparison between the actual flooding observed during a heavy rainstorm in Hezhai Village on 23 June 2023, which had an intensity comparable to the 5-year returned rainfall, and the simulated flooding conditions for the 5a scenario is a valuable validation of the SWMM’s accuracy. Through field observations during the rainstorm and combined with the observation of post-rain flood traces, this study compiled a list of the actual flooding nodes during the storm on 23 June 2023. It is found that the actual flooding points are relatively consistent with the 5a simulation scenario, as shown in Table 5, which verifies the reliability of the flooding simulation.

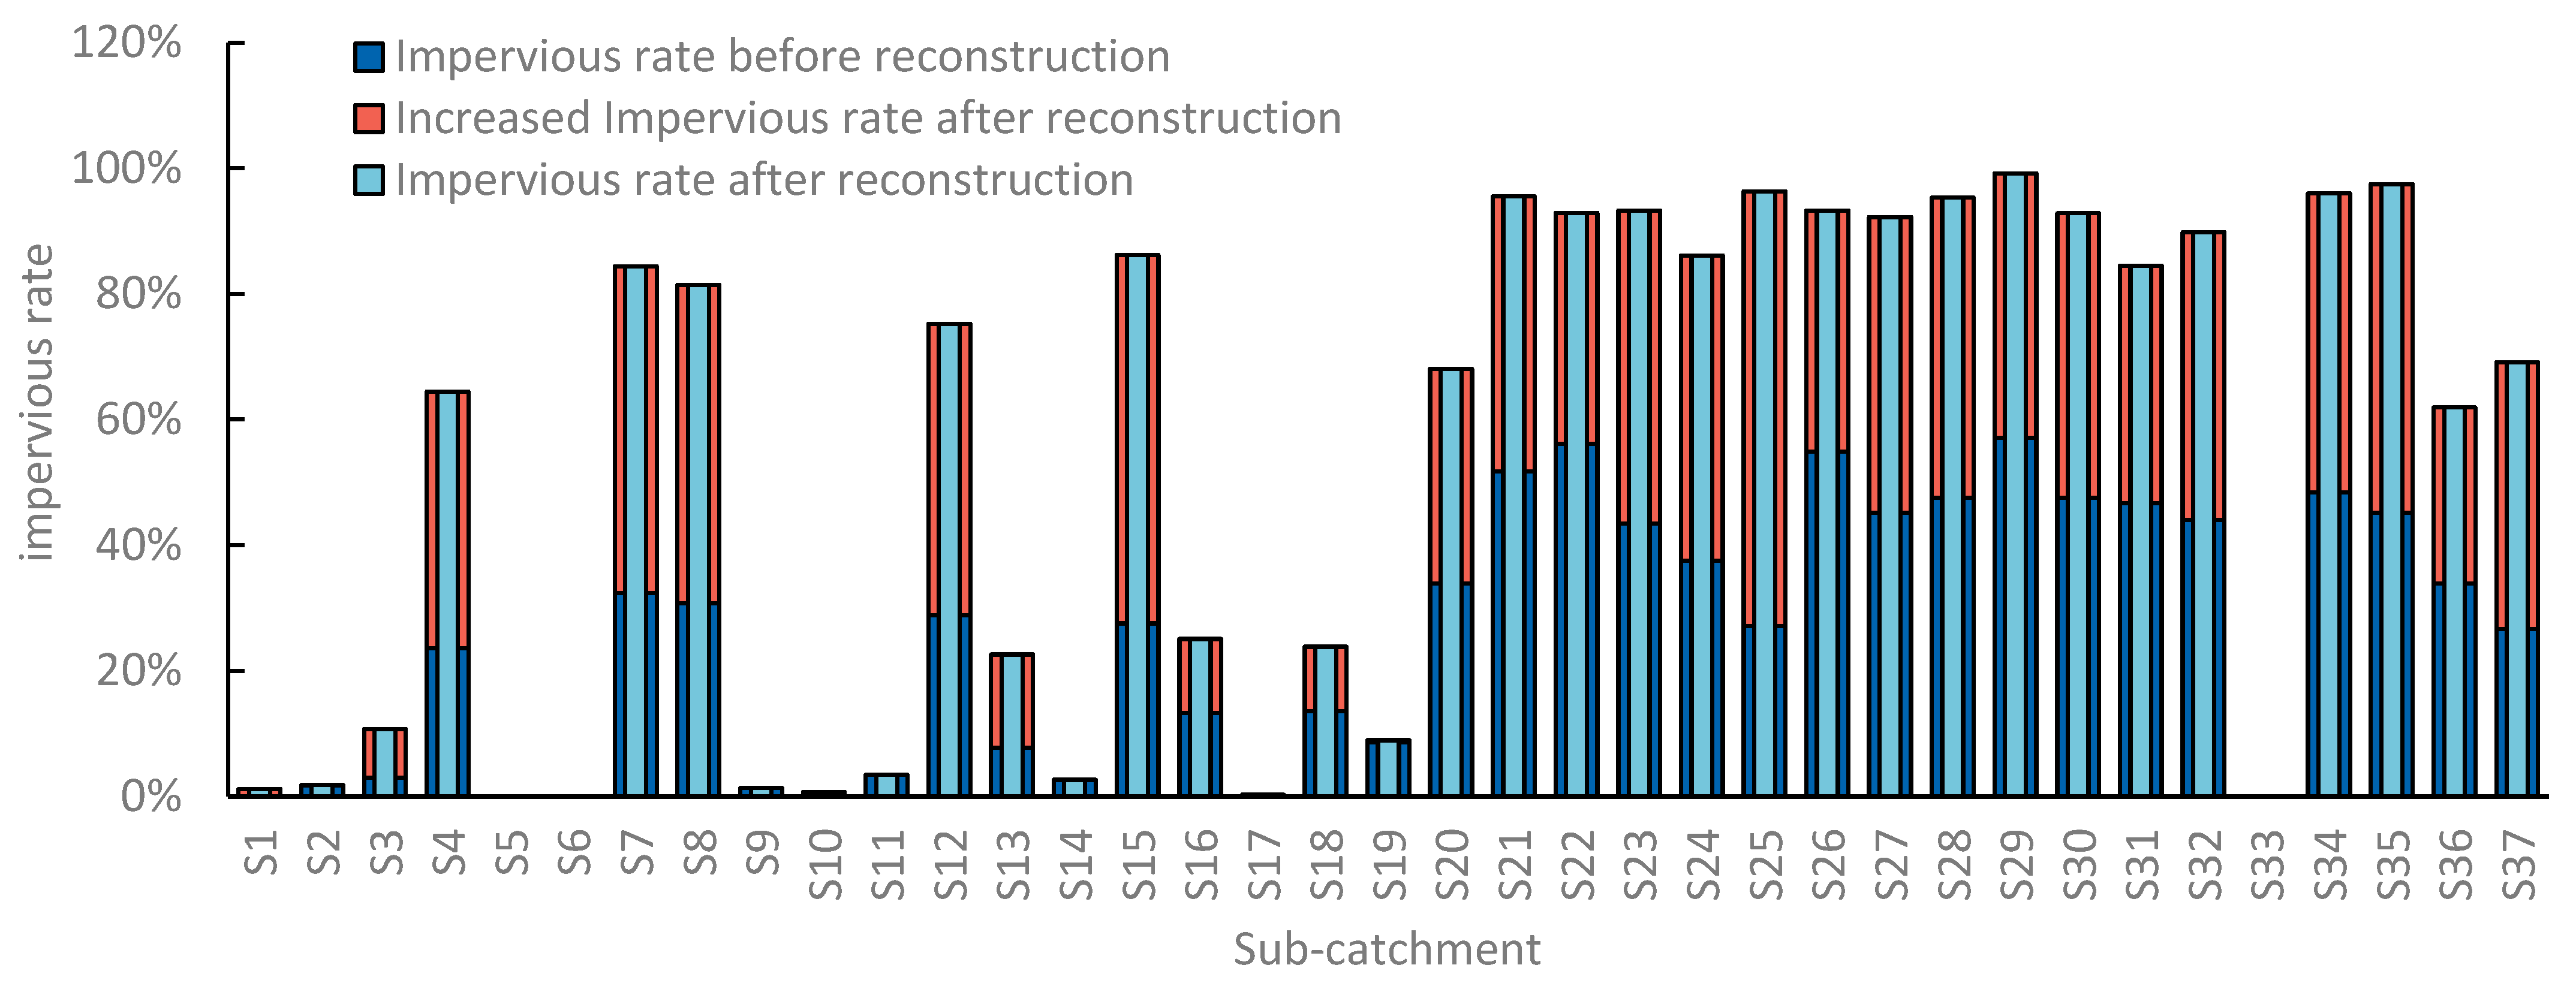
3.3. The Impact of Impervious Rate Change on Surface Runoff

The regression analysis results of changes in impervious rate with changes in total runoff, peak runoff, runoff coefficient, and flood volume are shown in Figure 11.
The R2 for the correlation of impervious rate with total runoff is 0.4045, showing that the increase in impermeable pavement in Hezhai Village will to some extent increase the total runoff of the village (see Figure 11a). The R2 for the correlation of impervious rate with peak runoff is 0.6063, showing that the increase in impervious surfaces in Hezhai Village will lead to more pronounced peaks in runoff during rainfall events (see Figure 11b). Specifically, the R2 for the correlation of impervious rate with runoff coefficient is 0.992, a highly significant correlation between the two variables (see Figure 11c), indicating that the change in impervious rate would cause significant changes in runoff coefficient. However, the correlation between impervious rate and flood volume is not obvious; the R2 for the correlation of impervious rate with flood volume is 0.0046 (see Figure 11d).

4. Discussion

4.1. Analysis of the Impact of Urbanization Reconstruction Activities on Surface Runoff Changes in Hezhai Village

4.1.1. Analysis of the Impact of Impervious Rate Change on Surface Runoff

From the correlation analysis between impervious rate and hydrological indicators of surface runoff, we find that there is an obvious positive correlation of imperviousness rate with total runoff and peak runoff, and a significant positive correlation with runoff coefficient, indicating that a change in impervious rate would cause obvious changes in total runoff, peak runoff, and runoff coefficient. This is consistent with the conclusion of many studies that reducing the impervious rate of the study area can significantly decrease the total runoff, peak runoff, and runoff coefficient [1,3,46].
However, the correlation between impervious rate and flood volume is not obvious. One possible reason is that at 50a, only eight sub-catchment areas in Hezhai Village experienced flooding, and the analysis results may not be reliable due to the small sample size. Another possible reason is that flooding in Hezhai Village is influenced by many factors, so there may not be a direct correlation between impervious rate and flood volume. However, it cannot be said that impervious rate has no relationship with flood volume. In fact, as found in subsequent research, an increase in impervious rate can lead to an increase in total runoff, which subsequently has an impact on flood volume.

4.1.2. Analysis of the Impact of Urbanization Reconstruction Activities on Flooding

(1) Cause analysis of pond flooding
This study delves into the logic of pond flooding, decomposing the pond runoff process into five stages, which provides a theoretical basis for the analysis of the causes of pond flooding.
According to the analysis of the five stages of pond runoff, it can be concluded that in the third stage, the NI of the pond reaches its maximum value, and the pond reaches the Maximum Percent Full, which has a specific output value in the SWMM. Generally, when this output value reaches 100%, the pond will be flooding, while when it is less than 100%, it indicates that the pond is not full, so there will be no flooding.
According to the SWMM simulation results, for the rainfall return periods of 50a, the Maximum Percent Full values of SU10, SU11, SU12, SU13, SU14, SU15, SU17, SU21, and SU22 all reach 100%, and flooding occurs in these ponds. For other ponds whose Maximum Percent Full values do not reach 100%, no flooding occurs. This is consistent with the results in Table 4.
(2) Analysis of the Impact of Reconstruction Activities on Pond Flooding
This study finds that the increase in the NI of ponds caused by reconstruction activities, such as an increase in impervious pavement, and the decrease in pond capacity caused by pond filling or reduction are the two main causes of pond flooding in villages. Related studies have also pointed out the issue of ponds being filled in or reduced in size due to the urbanization process [26,47]. And a similar conclusion has been drawn in other studies, i.e., that the size of the pond is directly related to the role of stormwater regulation, so the landfill or reduction of the pond will reduce its flood detention capacity and may cause local flooding problems [23,47].
In order to further quantify the impact of reconstruction activities on pond flooding, the increase in the maximum net inflow volume (∆NImax), the decrease in the pond capacity (−∆C), the minimum remaining capacity of the pond before reconstruction (RCmin BR), and the total flooding volume after reconstruction (Ftotal AR) of all flooding ponds in Hezhai Village are analyzed according to the above Equation (10) (see Figure 12). It is found that the ponds with negative NImax values are SU11, SU12, SU13, SU17, SU21, and SU22, indicating that NImax decreased after reconstruction of these ponds. Therefore, the flooding in these ponds is not caused by the increase in NI, but by the decrease in pond capacity (−∆C). The decreased capacity of these ponds is greater than the flooding volume, indicating that if the ponds do not shrink, there will be no flooding.
Ponds with positive NImax values, including SU10, SU14, and SU15, indicate that the increase in NI is the key factor contributing to flooding in these ponds. Furthermore, ponds SU10 and SU14 also experienced a reduction in pond capacity after reconstruction, suggesting that both the increase in NI and the increase in NI capacity contributed to the flooding in these ponds. In contrast, the size of pond SU15 remained unchanged, indicating that flooding is primarily caused by an increase in NI.
NI represents the difference between the inflow volume and outflow volume of a pond. Since the outflow is solely determined by the outlet of the pond, and the pond outlets in Hezhai Village were not changed during the reconstruction, the changes in the ponds’ NI are mainly caused by the changes in the inflows of the ponds. Since the NI of a pond comes from the upstream conduit inflow, the runoff from the sub-catchment area where the pond is located and the initial storage water of the pond affect flooding [33]. The initial water storage volume of SU15 remained unchanged, while the initial water storage volume in SU10 and SU14 decreased slightly due to the shrinkage of the ponds. Therefore, the reason for the increase in NImax in ponds SU10, SU14, and SU15 lies in the increased inflow from upstream conduits and the increased runoff from the sub-catchment areas where these ponds are located.
Detailed analysis is as follows: The impervious rate in the S30 catchment area where pond SU10 is located increased by 45.27% after reconstruction, resulting in an increase in runoff of 390 m3. Consequently, this led to an increase in the NImax of SU10 of 96.39 m3. The impervious rate in the S23 catchment area where pond SU14 is located increased by 49.81%, resulting in an increase in runoff of 1000 m3. Additionally, the landfill of water canals C116–C119 led to a significant increase in the flow in conduits C43, C44, and C45 between J38 and J40. Consequently, the inflow of SU14 from the J40 direction increased by 3050 m3, ultimately resulting in an increase in the NImax of SU14 of 1353.36 m3. The impervious rate in the S23 catchment area where pond SU15 is located increased by 49.81%, resulting in an increase in runoff. Additionally, the landfill of SU35 located upstream of SU15 led to a reduction in rainwater storage capacity in this area of 738.3 m3, which in turn caused an increase in the inflow from upstream conduits of SU15 of 3790 m3. Consequently, the NImax of SU15 increased by 310.18 m3.
(3) Cause analysis of flooding at Ordinary Nodes
This study finds that there is a close relationship between the occurrence of flooding in ordinary nodes and the maximum full flow ratio (Max/Full Depth ratio) of downstream water canals. For example, at 50a, after the reconstruction of Hezhai Village, there were five ordinary nodes where flooding occurred, and the Max/Full Depth ratio of the downstream conduits of these five nodes all reached 1. However, before the reconstruction, at 50a, the Max/Full Depth ratio of these downstream conduits did not reach 1, so no flooding occurred at these five nodes, as shown in Table 6.
This point is also recognized in Babaei’s study on the surface runoff of urban sub-catchments [20], where the “ratio of depth to full depth” is considered one of the variables that determine the potential of runoff transport through canals in urban drainage systems. When the canal depth exceeds the maximum designed depth, flooding will occur at nearby nodes [20].
(4) Analysis of the Impact of Reconstruction Activities on Ordinary Node Flooding
According to the logic of flooding at ordinary nodes, the reasons for flooding are the following two aspects: an increase in inflow and a reduction in outflow.
Specifically, the impervious rate of the S20 catchment area where nodes J37, J38, and J39 are located increased by 34.18%, resulting in an increase in runoff of 820 m3. Additionally, the reduction in the capacity of upstream pond SU13 of 1910.67 m3 led to an increase in the inflow to nodes J37, J38, and J39 of 890 m3, 880 m3, and 2660 m3, respectively. In terms of outflow, the diversion conduits C116–C119 downstream of J38 were all landfilled, resulting in the conduits C43, C44, and C45 between the nodes of J37, J38, and J39 reaching a 100% full state. Consequently, this caused flooding at the above-mentioned three nodes.
The impervious rate of the S32 catchment area where node J87 is located increased by 45.82%, resulting in an increase in runoff of 230 m3. The inflow of J87 increased by 1220 m3. In terms of outflow, the original diversion conduit C2 downstream of J87 was landfilled, resulting in C86 downstream of J87 reaching a 100% full state. As a result, flooding occurred at the J87 node. The impervious rate of the S34 catchment area where node J98 is located increased by 47.63%, resulting in an increase in runoff of 320 m3. The inflow of J98 increased by 590 m3. In terms of outflow, the downstream conduit C9 of node J98 experienced a reduction in width from 1.2 m to 0.8 m, which led to C9 reaching a 100% full state, causing flooding at node J98.
It is important to note that full flow in a conduit does not necessarily lead to flooding at the upstream node. For example, at 50a, after the reconstruction of Hezhai Village, a total of eight canals experienced full flow, with flooding occurring at the upstream nodes of five of these canals, while the upstream nodes of the remaining three full flow canals did not experience flooding.
For the convenience of observation and comparison, the causes of flooding in ponds and ordinary nodes are summarized in Table 7.

4.2. Suggestions for the Future Reconstruction of Hezhai Village Based on Flood Prevention

4.2.1. Suggestions for the Reconstruction of Flooding Points at 50a in Hezhai Village

Based on the above cause analysis of flooding in Hezhai Village, it can be seen that the filling or shrinking of ponds, the filling or narrowing of canals, and the increase in impervious pavement are all important factors contributing to flooding.
Currently, the ponds in Hezhai Village that are experiencing flooding at 50a include SU11, SU12, SU13, SU17, SU21, and SU22. The main cause of flooding in these ponds is the reduction in their capacity (see Table 7). Therefore, the recommended solution is to restore these ponds to their original sizes.
The flooding of ponds SU10, SU14, and SU15 is caused by a combination of reduced pond capacity and increased NI (see Table 7), resulting in a more severe flooding issue. The solutions require both an increase in pond capacity and a decrease in NI. Therefore, ponds SU10 and SU14 need to be restored to their sizes and capacities before reconstruction. The following measures can be taken to decrease the NI: (1) The landfilled SU35 pond should be restored to play an important role in runoff buffering in this area. (2) In the sub-catchment area S23 where ponds SU15 and SU14 are located, an increase in green space should be implemented. Impervious surfaces such as parking lots and roads should be converted to permeable pavements, aiming to reduce the impervious rate of S23 to the level before reconstruction. (3) Additionally, due to the severe flooding issue in SU14, it is necessary to expand its water outlet so that rainwater can quickly flow away from SU14 during heavy rainfall.
For the flooding issues at ordinary nodes such as J37, J38, and J39, restoring the buried canals C116–119 would undoubtedly be the simplest solution. However, given that the S4 sub-catchment area where C116–119 were located has already been developed, restoring the above canals is no longer feasible. Therefore, this study proposes addressing the issue by widening and deepening the canals that connect these flooded nodes. Simulations have shown that when the width of canals C44, C45, and C46 is increased to 1.2 m and their depth is increased to 1 m, the J37, J38, and J39 nodes no longer experience flooding.
For the flooded node J87, a similar situation exists. Given the infeasibility of restoring canal C2, this study has discovered that by widening the width of canal C86 to 1 m, the flooding issue at node J87 can similarly be mitigated. The flooding at node J98 is caused by the narrowing of the downstream canal C9, resulting in a full flow condition. As C9 is an important main canal within the village, it is recommended to restore and widen it. Simulations have shown that when the width of C9 is restored to 1.2 m, node J98 will no longer experience flooding during 50a storm events.

4.2.2. Suggestions for the Reconstruction of Ponds and Canals without Flooding but with a High Risk of Future Flooding

According to the above analysis, the Maximum Percent Full value of the pond and the Maximum/Full Depth ratio of the canal are both important indicators for the risk of flooding. The ponds SU4, SU5, SU6, SU9, SU16, SU18, SU19, SU20, SU23, SU24, SU26, SU27, SU28, and SU29 in Hezhai Village have a Maximum Percent Full value exceeding 80%. It is recommended that these ponds should not be reduced in size, and it is advisable to appropriately expand ponds such as SU6, SU16, SU19, SU20, SU26, SU27, and SU29, which are close to full capacity, in order to avoid flooding during heavy rainstorms. The canals C56, C20, C47, C94, C10, C112, C14, C15, C97, C114, C16, C57, C37, C99, C24, C98, C39, C84, C17, and C42 have a Max/Full Depth ratio exceeding 0.8 (where 1 indicates full flow). These canals should not be narrowed, and it is advisable to widen them appropriately in order to prevent upstream nodes from flooding during rainstorms.

4.2.3. Suggestions for the Reconstruction of Ponds and Canals with Low Utilization Rate

This study also finds that ponds SU1, SU2, SU7, SU8, and SU25 in Hezhai Village have a low utilization rate (<80%) and a large remaining capacity. A simulation has revealed that reducing the size of these ponds by approximately 20% would still not cause any flooding issues. In addition, ponds such as SU30, SU31, SU36, SU38, and SU39 do not cause flooding in the surrounding areas after being buried. This indicates that these ponds play a relatively small role in stormwater management and can be reduced or even landfilled in the process of village reconstruction. This also corroborates the findings of relevant studies, which indicate that the rainwater regulation effect of ponds is localized, and the rationality of pond configuration plays a significant role in determining the extent of the rainwater regulation effectiveness [23,24]. Ponds located in less significant positions have a smaller role, or their role can even be negligible.
Similarly, canals C26, C27, C28, C29, C30, C31, C32, and C33 also have very low utilization rates (≤0.1). Simulations have revealed that filling in these canals would not result in flooding issues; therefore, these canals can potentially be narrowed or even landfilled.
However, multiple ponds are an important feature of the water culture in Hezhai Village. Therefore, from a cultural preservation perspective, it is not recommended to fill in the ponds. If it is indeed necessary for modernization development (such as the need for parking lots), then selecting a few ponds with lower utilization rates for filling in could be considered. In this case, it would be advisable to widen the downstream canals to accommodate potential changes in water flow. But most of the ponds should still be preserved.

5. Conclusions

In this study, by applying the SWMM tool, a quantitative analysis was conducted to examine the impact of the village’s main construction activities on surface runoff during rainstorms. The specific reasons for flooding in Hezhai Village were identified, and subsequently, suggestions for the reasonable reconstruction of the village were proposed. The main conclusions are as follows:
  • The construction and reconstruction activities that have a significant impact on surface runoff in Hezhai Village mainly include the following: 11 ponds have been filled in; 10 ponds have been reduced; 13 channels have been filled in; 14 channels have been narrowed; and the impervious rate of Hezhai Village has increased from 23.88% to 49.60%, representing an increase of 25.72%.
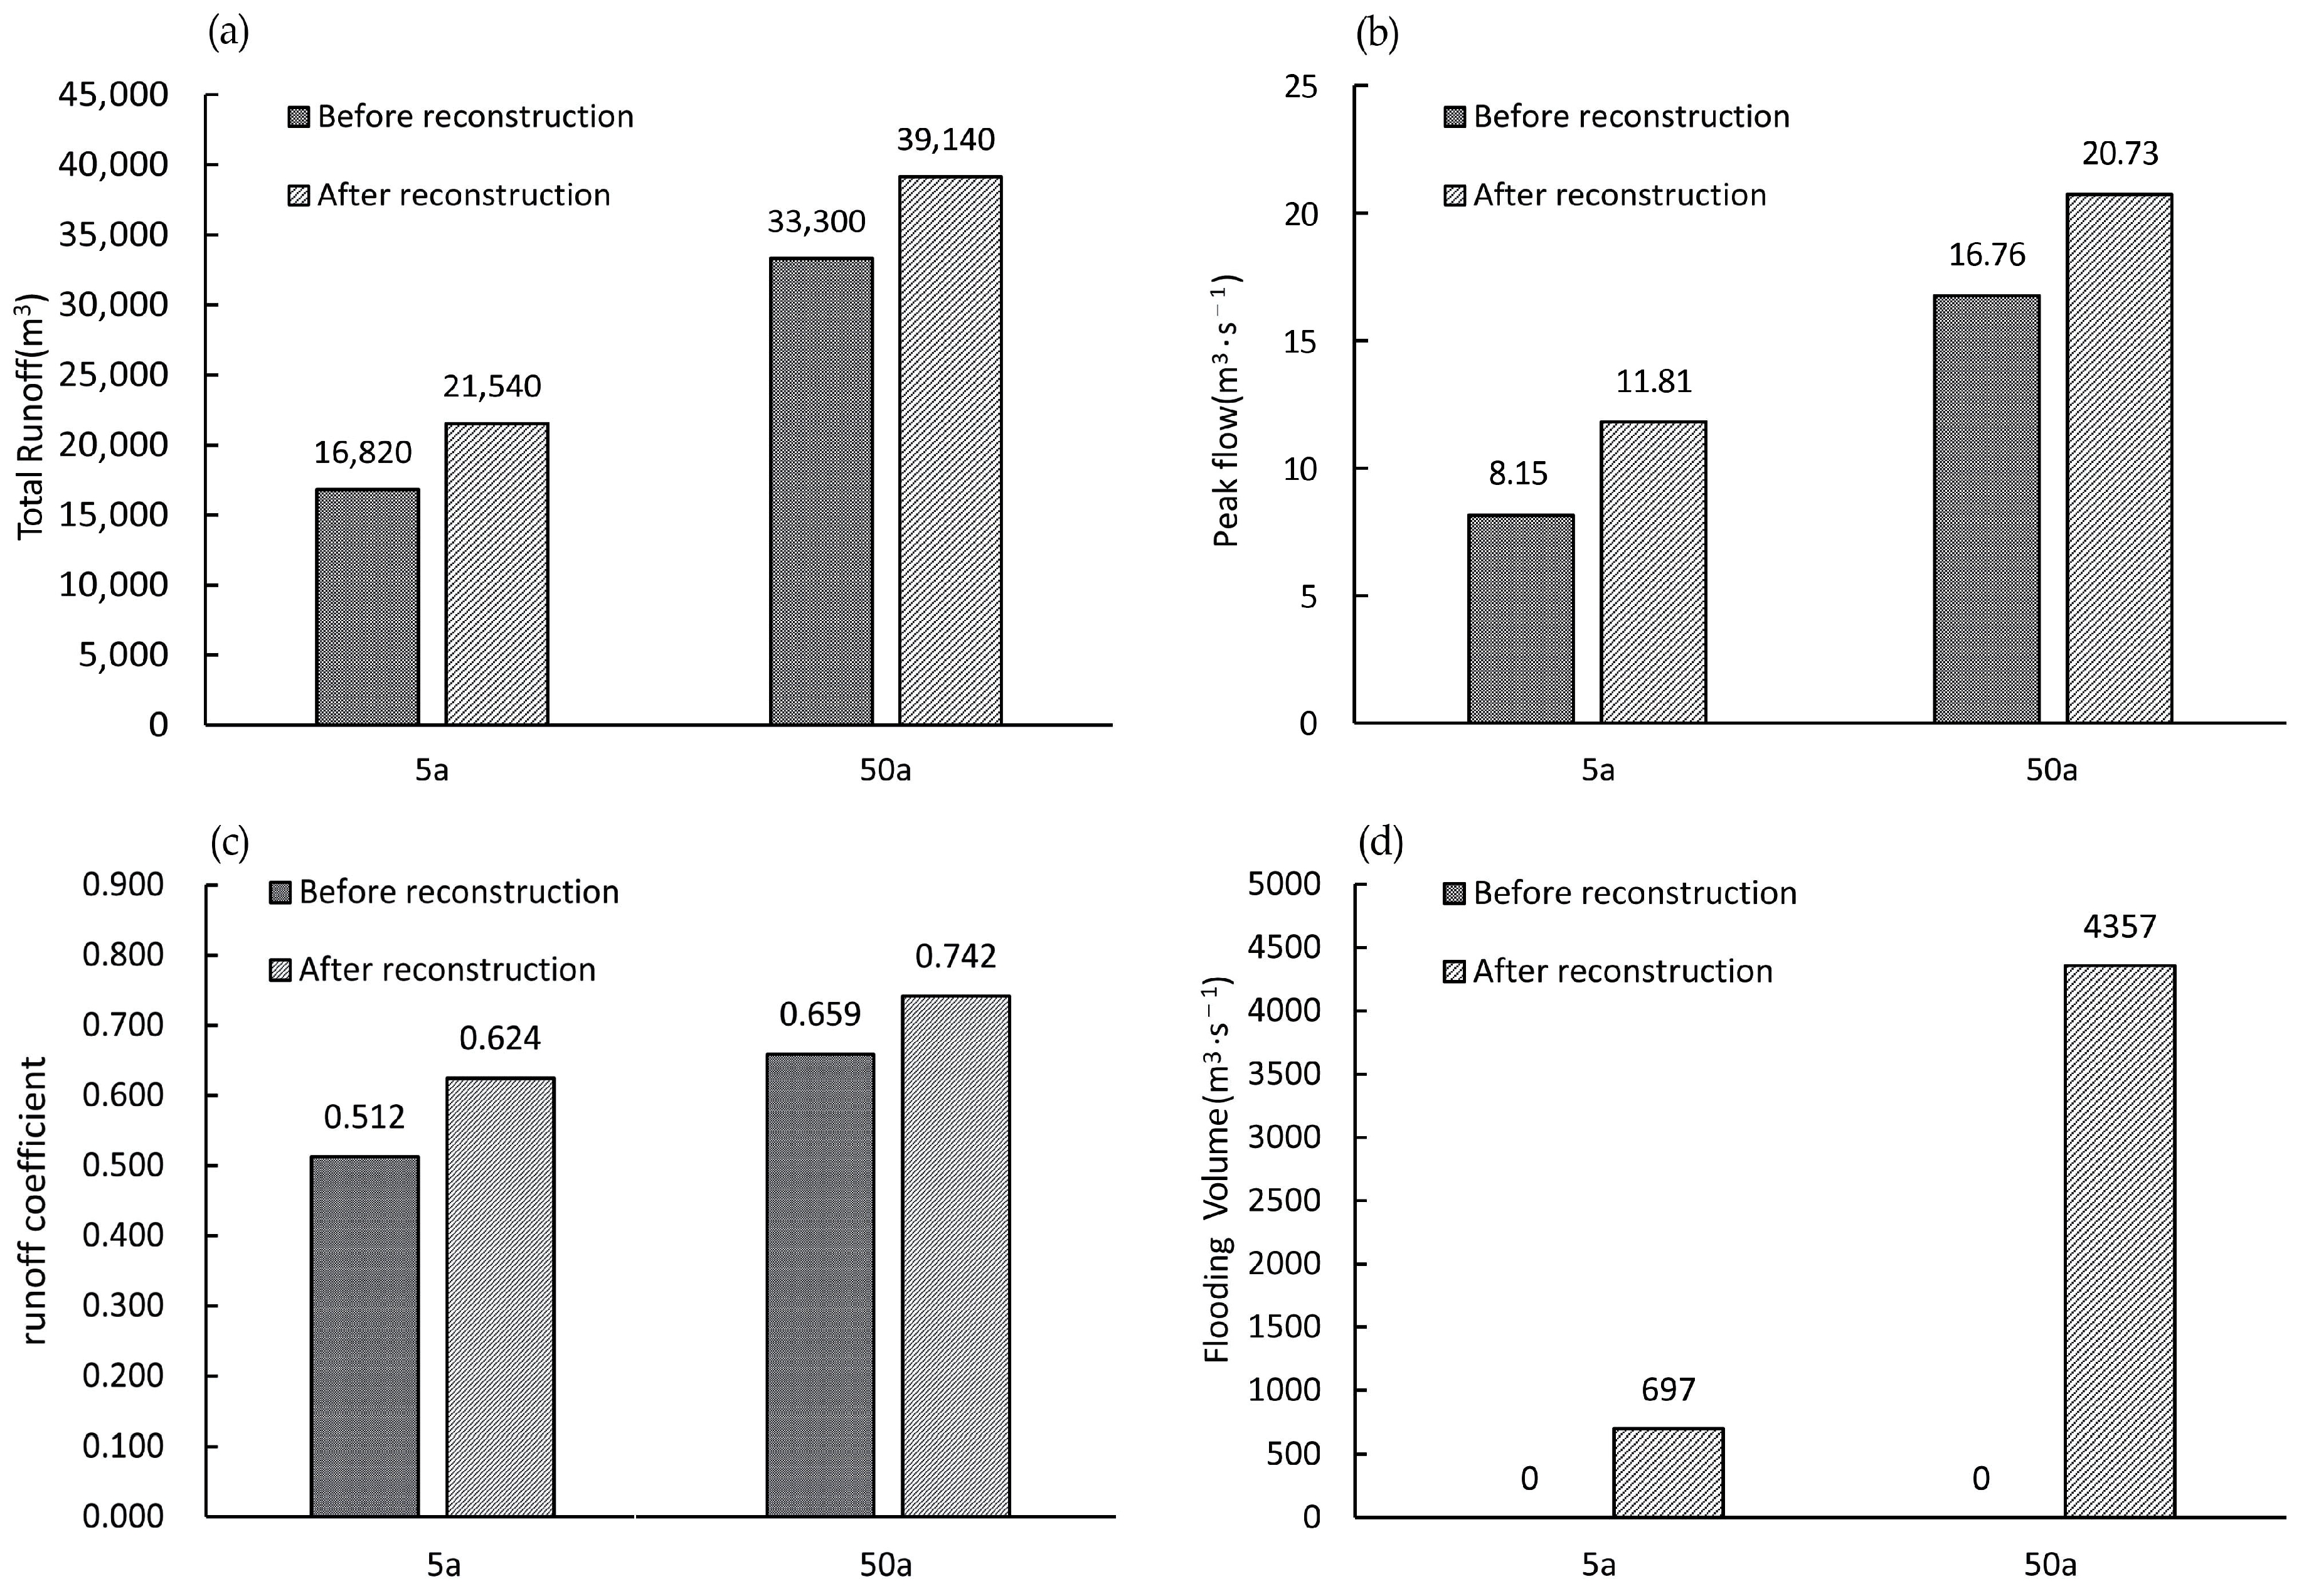
  • The surface runoff changed obviously during the rainstorm after the reconstruction of Hezhai Village. According to the SWMM simulation results, for the rainfall return periods of 5a and 50a, the total runoff after the reconstruction increased by 4720 m3 and 5840 m3, respectively, and the peak runoff increased by 3.66 m3/s and 3.97 m3/s, respectively, compared with before the reconstruction. Before the reconstruction, there was no flooding observed at 5a and 50a, but after the reconstruction, the total flooding volume was 697 m3 and 4357 m3, respectively, at 5a and 50a. Regarding flooding points, for the 5a rainfall return period, there are five flooded ponds and two flooded nodes in Hezhai Village. For the 50a rainfall return period, there are nine flooded ponds and five flooded nodes in Hezhai Village.
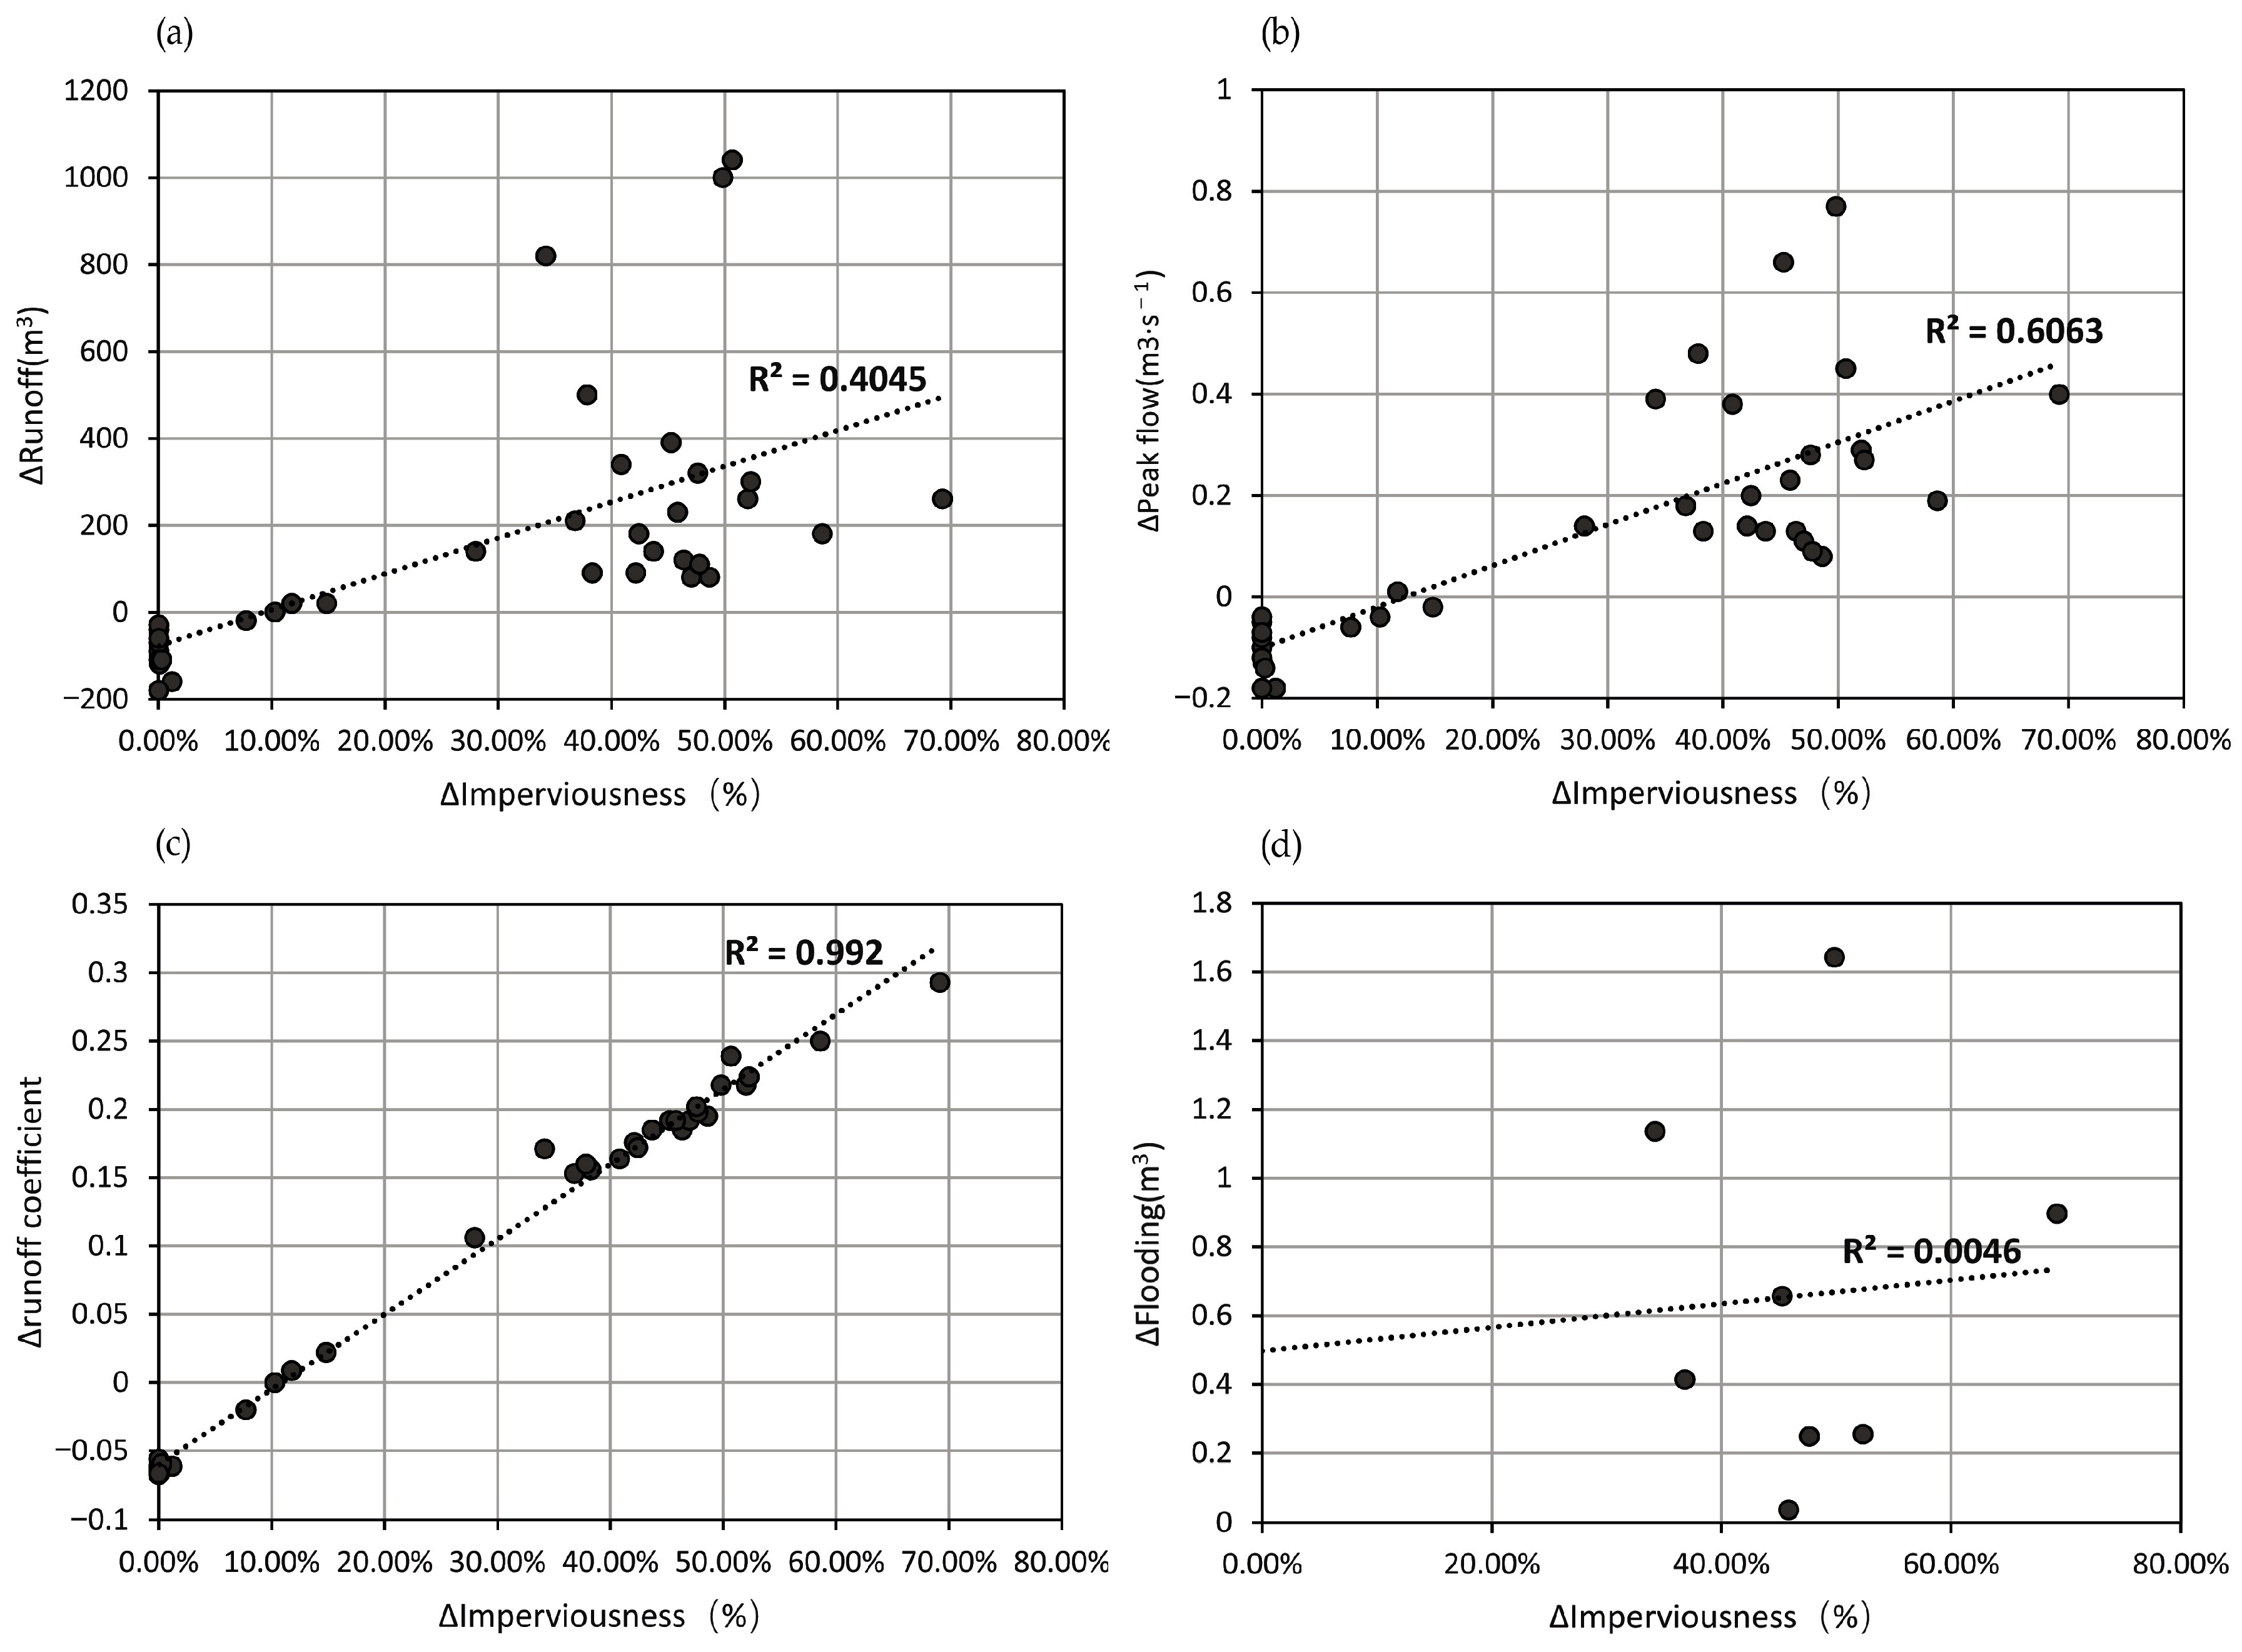
  • Regression analysis of impervious rate with total runoff, peak runoff, and runoff coefficient in 37 sub-catchment areas in Hezhai Village reveals a certain positive correlation between impervious rate and total runoff, an obvious positive correlation between impervious rate and peak runoff, and a significant positive correlation between impervious rate and runoff coefficient. However, the correlation between impervious rate and flooding volume is not obvious.
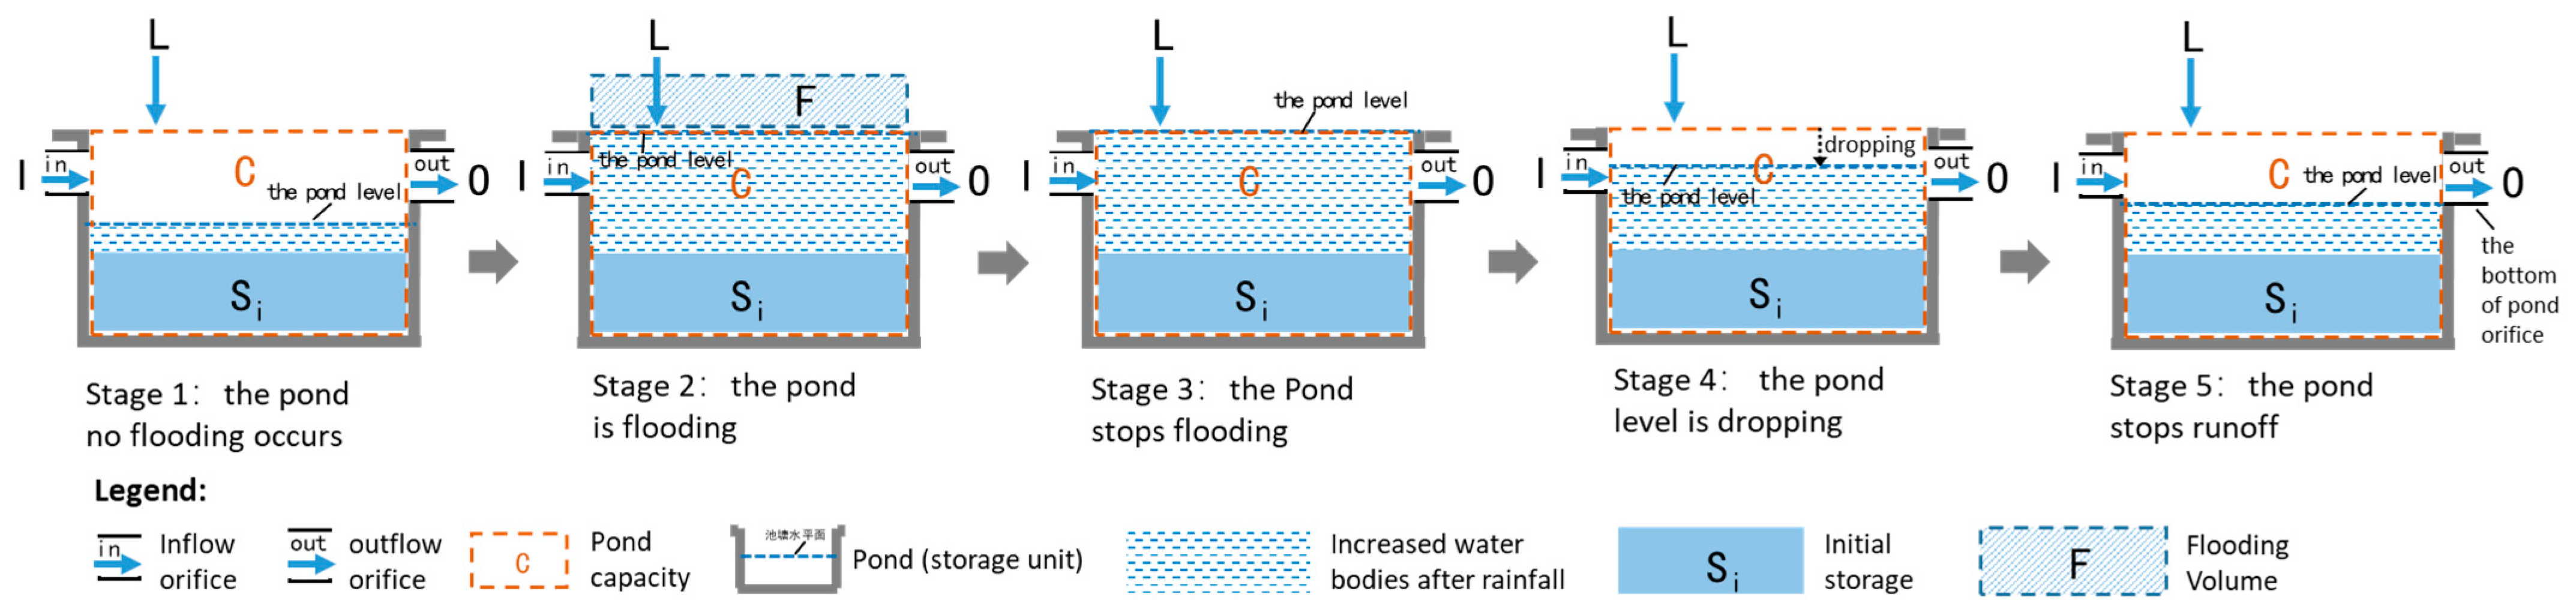
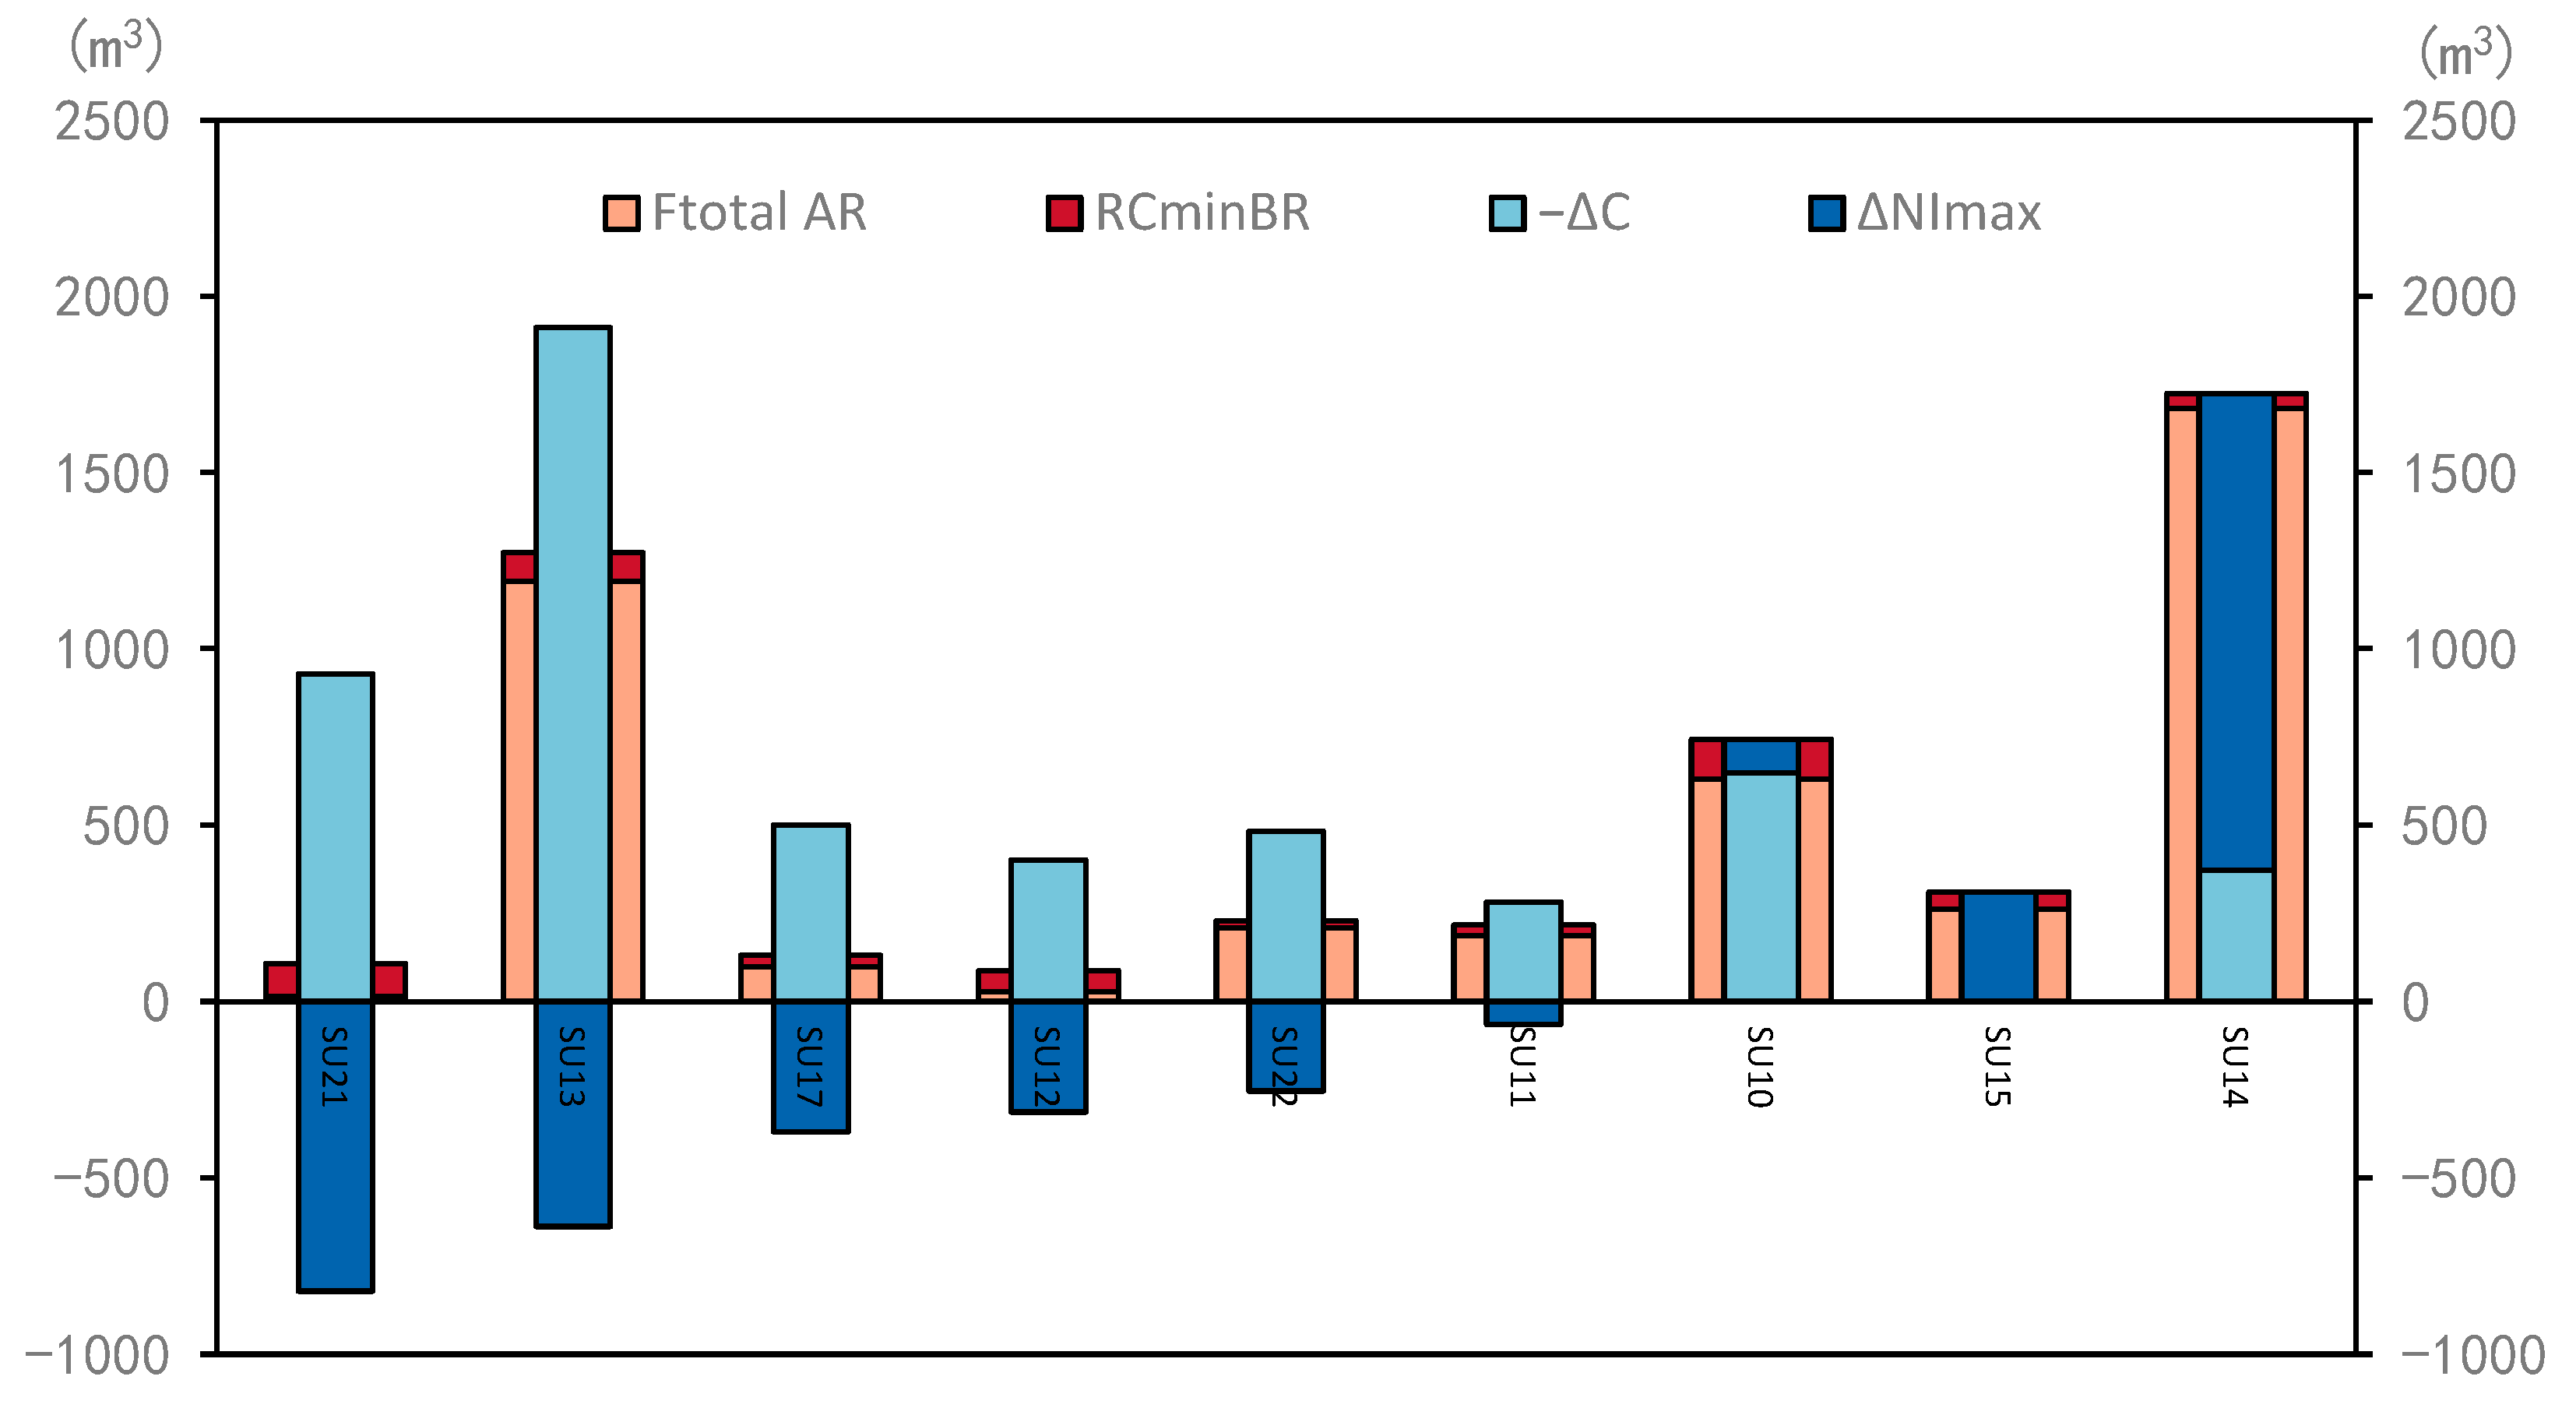
  • This study analyzed the causes of flooding in ponds and ordinary nodes. Pond flooding is mainly determined by the net inflow volume (NI, the difference between inflow and outflow) and the pond capacity (C). When NI exceeds C, the pond begins to flood. Since the ordinary node has almost no water storage capacity, generally speaking, when the Max/Full Depth ratio of the conduit downstream of an ordinary node is less than 1, there will be no flooding at that node. If the Max/Full Depth ratio of the conduit downstream of a node equals 1, it indicates that the node is prone to flooding.
  • Based on the analysis of the impact of urbanization reconstruction activities on flooding, this study finds that the increase in the NI of ponds caused by reconstruction activities, such as an increase in impervious pavement, and the decrease in pond capacity caused by pond filling or reduction are the two main causes of the pond flooding in Hezhai Village, and the flooding of ordinary nodes is mainly caused by the full flow of the downstream conduits, which are attributed to two major factors: the increase in inflow and the increase in inflow.
  • Suggestions for the future reconstruction of Hezhai Village from the perspective of flood prevention are put forward. To avoid the problem of pond flooding, efforts can be made in two aspects: increasing pond capacity and reducing net inflow. For the flooding issues at several ordinary nodes, solutions can include restoring landfilled water canals, and widening the width and deepening the depth of the downstream canals. For ponds in Hezhai Village where there is no flooding but a high risk of flooding, it is recommended that ponds with a Maximum Percent Full ratio exceeding 80% should not be reduced in size and should ideally be appropriately expanded to avoid flooding during high-intensity rainstorms. Indeed, the figure of 80% is merely a rough, operational convenience-oriented standard value. When it comes to the actual reconstruction of the village, specific reconstruction methods and measures must be determined through comprehensive analysis based on the SWMM simulation. As for the ponds and canals in Hezhai Village with low utilization rates and relatively small roles in stormwater management, it is considered that they can be appropriately reduced or even landfilled in the process of village reconstruction.
This study quantitatively analyzed the impact of reconstruction activities on the surface runoff of Hezhai Village and deeply explored the flooding logic of ponds and ordinary nodes, providing a theoretical basis for the analysis of the causes of village flooding problems. From the perspective of stormwater management, it provides an effective analytical method for evaluating the rationality of village reconstruction activities.

Author Contributions

Conceptualization, W.Z., C.T., and J.L.; methodology, C.T. and J.L.; software, J.L. and C.T.; investigation, C.T. and J.L.; resources, C.T. and J.L.; data curation, J.L. and C.T.; writing—original draft preparation, J.L. and C.T.; writing—review and editing, C.T.; visualization, J.L.; supervision, W.Z.; project administration, C.T.; funding acquisition, C.T., W.Z., and J.L. All authors have read and agreed to the published version of the manuscript.

Funding

This research was funded by the National Natural Science Foundation of China under grant number 51708343.

Data Availability Statement

Data can be made available upon request.

Acknowledgments

The authors are extremely grateful to the government of Niansanli Town and the Hezhai Village Committee for providing the information and data.

Conflicts of Interest

The authors declare no conflicts of interest.

References

  1. Yang, B.; Zhang, T.; Li, J.; Feng, P.; Miao, Y. Optimal designs of LID based on LID experiments and SWMM for a small-scale community in Tianjin, north China. J. Environ. Manag. 2023, 334, 117442. [Google Scholar] [CrossRef] [PubMed]
  2. Qin, H.P.; Li, Z.X.; Fu, G. The effects of low impact development on urban flooding under different rainfall characteristics. J. Environ. Manag. 2013, 129, 577–585. [Google Scholar] [CrossRef] [PubMed]
  3. Guan, M.; Sillanpää, N.; Koivusalo, H. Modelling and assessment of hydrological changes in a developing urban catchment. Hydrol. Process 2015, 29, 2880–2894. [Google Scholar] [CrossRef]
  4. Shuster, W.D.; Bonta, J.; Thurston, H.; Warnemuende, E.; Smith, D.R. Impacts of impervious surface on watershed hydrology: A review. Urban. Water J. 2005, 2, 263–275. [Google Scholar] [CrossRef]
  5. Dietz, M.E.; Clausen, J.C. Stormwater runoff and export changes with development in a traditional and low impact subdivision. J. Environ. Manag. 2008, 87, 560–566. [Google Scholar] [CrossRef]
  6. Jinkang, D.; Li, Q.; Hanyi, R.; Tianhui, Z.; Dapeng, Z.; Youpeng, X.; Xu, C.Y. Assessing the effects of urbanization on annual runoff and flood events using an integrated hydrological modeling system for Qinhuai River basin, China. J. Hydrol. 2012, 464–465, 127–139. [Google Scholar]
  7. San Liew, Y.; Desa, S.M.; Noh, M.N.M.; Tan, M.L.; Zakaria, N.A.; Chang, C.K. Assessing the Effectiveness of Mitigation Strategies for Flood Risk Reduction in the Segamat River Basin, Malaysia. Sustainability 2021, 13, 3286. [Google Scholar] [CrossRef]
  8. Ekmekcioğlu, Ö.; Yılmaz, M.; Özger, M.; Tosunoğlu, F. Investigation of the low impact development strategies for highly urbanized area via auto-calibrated Storm Water Management Model (SWMM). Water Sci. Technol. 2021, 84, 2194–2213. [Google Scholar] [CrossRef]
  9. Li, J.; Zhou, W.; Tao, C. The Value of Traditional Ecological Knowledge in Stormwater Management: A Case Study of a Traditional Village. Land 2024, 13, 242. [Google Scholar] [CrossRef]
  10. Zhang, H. Rural Pond Landscape Design in Zhejiang under the background of New Rural Construction. Master’s Thesis, Shanghai Normal University, Shanghai, China, 2019. [Google Scholar]
  11. Liu, H.; Gu, X. Water Ecological Wisdom and Practice of Traditional Village: Inspiration from Liukeng Village in Fuzhou, Jiangxi for Rural Revitalization. Ecol. Environ. Monit. Three Gorges 2018, 3, 51–58. [Google Scholar]
  12. Zhou, C.; Cao, P. Contribution and Enlightenment of Ancient Chinese Landscape Architecture and Rainwater Management—Taking Beijing Yuquan Water System as the Example. Chin. Landsc. Archit. 2017, 33, 114–118. [Google Scholar]
  13. Miller, J.D.; Hutchins, M. The impacts of urbanisation and climate change on urban flooding and urban water quality: A review of the evidence concerning the United Kingdom. J. Hydrology. Reg. Stud. 2017, 12, 345–362. [Google Scholar] [CrossRef]
  14. Lin, Z.; Xu, Y.; Dai, X.; Wang, Q.; Gao, B.; Xiang, J.; Yuan, J. Changes in the plain river system and its hydrological characteristics under urbanization—Case study of Suzhou City, China. Hydrol. Sci. J. 2019, 64, 2068–2079. [Google Scholar] [CrossRef]
  15. Jankowfsky, S.; Branger, F.; Braud, I.; Rodriguez, F.; Debionne, S.; Viallet, P. Assessing anthropogenic influence on the hydrology of small peri-urban catchments: Development of the object-oriented PUMMA model by integrating urban and rural hydrological models. J. Hydrol. 2014, 517, 1056–1071. [Google Scholar] [CrossRef]
  16. Atharinafi, Z.; Wijaya, N. Land Use Change and Its Impacts on Surface Runoff in Rural Areas of the Upper Citarum Watershed (Case Study: Cirasea Sub-watershed). J. Reg. City Plan. 2021, 32, 36–55. [Google Scholar] [CrossRef]
  17. Jiang, Y.; Zhang, S. Influence of urbanization on hydrologic cycle and countermeasures. Water Sci. Eng. Technol. 2010, 06, 30–32. [Google Scholar]
  18. Paul, M.J.; Meyer, J.L. Streams in the urban landscape. Annu. Rev. Ecol. Evol. Syst. 2001, 32, 333–365. [Google Scholar] [CrossRef]
  19. Li, S.; Huang, T. Influence on Rainfall Run-off due to Urbanization and Rain-water Flood Control in the City. China Munic. Eng. 2002, 99, 35–37. [Google Scholar]
  20. Babaei, S.; Ghazavi, R.; Erfanian, M. Urban flood simulation and prioritization of critical urban sub-catchments using SWMM model and PROMETHEE II approach. Phys. Chem. Earth. Parts A/B/C 2018, 105, 3–11. [Google Scholar] [CrossRef]
  21. Gautam, K.; Corzo, G. Evaluating the impact of ponds on flood and drought mitigation in the Bagmati River Basin, Nepal. Hydrol. Res. 2023, 54, 1163–1180. [Google Scholar] [CrossRef]
  22. Yazdi, J. Optimal Operation of Urban Storm Detention Ponds for Flood Management. Water Resour. Manag. 2019, 33, 2109–2121. [Google Scholar] [CrossRef]
  23. Birkinshaw, S.J.; Krivtsov, V. Evaluating the Effect of the Location and Design of Retention Ponds on Flooding in a Peri-Urban River Catchment. Land 2022, 11, 1368. [Google Scholar] [CrossRef]
  24. Ayalew, T.B.; Krajewski, W.F.; Mantilla, R. Insights into Expected Changes in Regulated Flood Frequencies due to the Spatial Configuration of Flood Retention Ponds. J. Hydrol. Eng. 2015, 20, 4015010. [Google Scholar] [CrossRef]
  25. Ferk, M.; Ciglič, R.; Komac, B.; Loczy, D. Management of small retention ponds and their impact on flood hazard prevention in the Slovenske Gorice Hills. Acta Geogr. Slov. 2020, 60, 107–125. [Google Scholar] [CrossRef]
  26. Tseng, K.; Yang, T.; Chen, P.; Chien, H.; Chen, C.; Hung, Y. Exploring the Feasibility of Mitigating Flood Hazards by an Existing Pond System in Taoyuan, Taiwan. Drones 2023, 7, 1. [Google Scholar] [CrossRef]
  27. Napoli, M.; Massetti, L.; Orlandini, S. Hydrological response to land use and climate changes in a rural hilly basin in Italy. Catena 2017, 157, 1–11. [Google Scholar] [CrossRef]
  28. Hasenmueller, E.A.; Criss, R.E.; Winston, W.E.; Shaughnessy, A.R.; Lyons, W.B.; Gardner, C.B.; Long, D.T. Stream hydrology and geochemistry along a rural to urban land use gradient. Appl. Geochem. 2017, 83, 136–149. [Google Scholar] [CrossRef]
  29. Wang, J. Research on the Renovation Design of Village Environment Reconstruction in Scenic Spot: Taking the Scenic Spot of Qing Yazhai Reserve as an Example. Master’s Thesis, Xi’an University of Architecture and Technology, Xi’an, China, 2019. [Google Scholar]
  30. Li, S. Research on Renewal Planning of Traditional Villages in Taihang Mountain Area under the Concept of Low Impact Development. Master’s Thesis, China University of Mining and Technology, Xuzhou, China, 2022. [Google Scholar]
  31. Palla, A.; Gnecco, I. Hydrologic modeling of low impact development systems at the urban catchment scale. J. Hydrol. 2015, 528, 361–368. [Google Scholar] [CrossRef]
  32. Yiwu local Chronicles Compilation Committee. Yiwu Yearbook 2022; Fangzhi Publishing House: Beijing, China, 2022. [Google Scholar]
  33. Rossman, L.; Simon, M. Storm Water Management Model User’s Manual Version 5.2; EPA/600/R-22/030; U.S. Environmental Protection Agency: Washington, DC, USA, 2022.
  34. Rossman, L.A.; Huber, W.C. Storm Water Management Model Reference Manual Volume I—Hydrology (Revised); National Risk Management Laboratory, U.S. Environmental Protection Agency: Cincinnati, OH, USA, 2016.
  35. Campbell, C.W.; Sullivan, S.M. Simulating time-varying cave flow and water levels using the Storm Water Management Model. Eng. Geol. 2002, 65, 133–139. [Google Scholar] [CrossRef]
  36. Li, J.; Li, Y.; Li, Y. SWMM-based evaluation of the effect of rain gardens on urbanized areas. Environ. Earth Sci. 2016, 75, 17. [Google Scholar] [CrossRef]
  37. Xu, T.; Jia, H.; Wang, Z.; Mao, X.; Xu, C. SWMM-based methodology for block-scale LID-BMPs planning based on site-scale multi-objective optimization: A case study in Tianjin. Front. Environ. Sci. Eng. 2017, 11, 1. [Google Scholar] [CrossRef]
  38. GB 50014-2021; Ministry of Housing and Urban-Rural Development of the People’s Republic of China Standard for Design of Outdoor Wastewater Engineering. China Planning Press: Beijing, China, 2021.
  39. Xie, J.; Wu, C.; Li, H.; Chen, G. Study on Storm-Water Management of Grassed Swales and Permeable Pavement Based on SWMM. Water 2017, 9, 840. [Google Scholar] [CrossRef]
  40. Yang, Y.; Li, J.; Huang, Q.; Xia, J.; Li, J.; Liu, D.; Tan, Q. Performance assessment of sponge city infrastructure on stormwater outflows using isochrone and SWMM models. J. Hydrol. 2021, 597, 126151. [Google Scholar] [CrossRef]
  41. Zhejiang Provincial Department of Housing and Urban-Rural Development. Calculation Criteria of Rainstorm Intensity; China Statistics Press: Beijing, China, 2020.
  42. Rossman, L.A.; Huber, W.C. Storm Water Management Model Reference Manual Volume II—Hydraulics; National Risk Management Laboratory, U.S. Environmental Protection Agency: Cincinnati, OH, USA, 2017.
  43. Liu, X. Parameter calibration method for urban rainfall-runoff model based on runoff coefficient. Water Wastewater Eng. 2009, 35, 213–217. [Google Scholar]
  44. Li, Y.; Ye, S.S.; Wu, Q.Z. Analysis and countermeasures of the “7.20” flood in Zhengzhou. J. Asian Arch. Build. 2023, 22, 3782–3798. [Google Scholar] [CrossRef]
  45. Beijing Municipal Design and Research Institute. Concise Drainage Design Manual; China Architecture & Building Press: Beijing, China, 1990. [Google Scholar]
  46. Wang, L.; Zhang, J.; Wang, X. Simulation analysis of rain and flood control of permeable pavementbased on LID theory. Water Resour. Dev. Manag. 2022, 8, 48–54. [Google Scholar]
  47. Li, H. Investigation of Highway Stormwater Management Pond Capacity for Flood Detention and Water Quality Treatment Retention via Remote Sensing Data and Conventional Topographic Survey. Transp. Res. Rec. 2020, 2674, 514–527. [Google Scholar] [CrossRef]
Figure 1. Site map of the study area. The study area is located in Hezhai Village, Yiwu City, Jinhua City, Zhejiang Province, China.
Land 13 01528 g001
Figure 2. Ponds in Hezhai Village: (a) Shuigang Pond; (b) Huangzhai Pond.
Land 13 01528 g002
Figure 3. Plan of Hezhai Village before and after reconstruction: (a) plan before reconstruction (around 1993); (b) plan after reconstruction (around 2023). 1–40 refers to the pond number.
Land 13 01528 g003
Figure 4. Changes in impervious rate before and after the reconstruction of each sub-catchment area.
Land 13 01528 g004
Figure 5. Flow of the overall research framework.
Land 13 01528 g005
Figure 6. The SWMM of Hezhai Village before reconstruction.
Land 13 01528 g006
Figure 7. The SWMM of Hezhai Village after reconstruction.
Land 13 01528 g007
Figure 8. Rainfall hydrograph of different rainfall return periods in Yiwu City when the rainfall peak coefficient is 0.4. In the graph, 1a is the rainstorm of a 1-year return period; 2a is the rainstorm of a 2-year return period; 3a is the rainstorm of a 3-year return period; 5a is the rainstorm of a 5-year return period; 20a is the rainstorm of a 20-year return period; 50a is the rainstorm of a 50-year return period.
Land 13 01528 g008
Figure 9. Five stages of pond runoff.
Land 13 01528 g009
Figure 10. Surface runoff changes in Hezhai Village before and after reconstruction for 5a and 50a return periods: (a) total runoff; (b) peak flow; (c) runoff coefficient; (d) flooding volume.
Land 13 01528 g010
Figure 11. Regression analysis of impervious rate and surface hydrological parameters in Hezhai Village: (a) impervious rate and total runoff; (b) impervious rate and peak runoff; (c) impervious rate and runoff coefficient; (d) impervious rate and flood volume.
Land 13 01528 g011
Figure 12. Analysis of the causes of pond flooding in Hezhai Village based on Equation (12).
Land 13 01528 g012
Table 1. Initial value of uncertain parameters.
ParameterInitial Value
N-Impervious0.012
N-Pervious0.3
Dstore-Impervious1.5
Dstore-Pervious3.8
Max. Infil. Rate (mm/h)76.2
Min. Infil. Rate (mm/h)5
Decay Constant (1/h)3
Drying Time (day)7
N-Conduit0.015
Table 2. Experience values of comprehensive runoff coefficient [1,45].
Area SituationComprehensive Runoff Coefficient
areas with densest buildings (impervious area rate ≥ 70%)0.6~0.8
areas with denser buildings (impervious area rate 50~70%)0.5~0.7
areas with sparser buildings (impervious area rate 30~50%)0.4~0.6
areas with sparsest buildings (impervious area rate ≤ 30%)0.3~0.5
Table 3. The uncertain parameters’ calibration results.
TypeParameterUnitParameter Calibration Result of the Model before ReconstructionParameter Calibration Result of the Model after Reconstruction
Sub-catchment parametersN-Impervious/0.014 0.014
N-Pervious/0.110.15
Dstore-Imperviousmm1.2 1.2
Dstore-Perviousmm2.5 7.4
Max. Infil. Rate (mm/h)mm/h7272
Min. Infil. Rate (mm/h)mm/h55
Decay Constant (1/h)1/h2.10 2.10
Drying Time (day)day77
Conduit parametersN-Conduit/0.0150.015
Table 4. Flooding conditions in Hezhai Village after reconstruction for 5a and 50a.
50aflooding nodesJ37J38J39J87J99SU10SU11SU12SU13SU14SU15SU17SU21SU22
flood volume (m3)12.017.016.036.0179.0657.0181.032.01134.01533.0267.096.02.0230.0
5aflooding nodes/J38J39 /SU10/SU12/SU14SU15SU17//
flood volume (m3)/1.01.0 /76.0/7.0/432.0153.011.0//
Table 5. Comparison between simulated (5a) and actual flooding points (June 23, 2023) after the reconstruction of Hezhai Village.
Rainfall ScenarioRainfall IntensityFlooding Nodes
simulation scenario at 5a58.32 (mm/h)SU10SU12SU14SU15SU17J38J39/
actual rainfall scenario on June 23, 202354.65
(mm/h)
SU10/SU14SU15SU17J38J39J37
Table 6. Flooded ordinary nodes at 50a in Hezhai Village.
Flooded Node LabelFlooding
Volume(m3)
Downstream
Conduit
Max/Full Depth Ratio of Conduit BR Max/Full Depth Ratio of Conduit AR
J3712.0C430.661
J3817.0C440.621
J3916.0C450.831
J8736.0C860.581
J98179.0C90.901
Table 7. Summary of causes of flooding in ponds and nodes at 50a in Hezhai Village after the reconstruction.
Flooded Node LabelFlooding
Volume
(m3)
Causes of Flooding
Pond LandfillPond ShrinkConduit LandfillConduit NarrowImpervious Rate Increases
J3712.0/Upstream pond SU13’s capacity decreased by 1910.67 m3Diversion conduits C116-C119 downstream of J38 were all landfilled/The impervious rate of the S20 catchment area increased by 34.18%
J3817.0/Same as aboveSame as above/Same as above
J3916.0/Same as aboveSame as above/Same as above
J8736.0//Diversion conduit C2 downstream of J87 was landfilled/The impervious rate of the S32 catchment area where J87 is located increased by 45.82%
J98179.0///The width of C9 downstream of J98 is reduced from 1.2 m to 0.8 mThe impervious rate of the S34 catchment area where J98 is located increased by 47.63%
SU10657.0/The capacity of pond SU10 is reduced//The impervious rate of the S30 catchment area where SU20 is located increased by 45.27%
SU11181.0/The capacity of pond SU11 is reduced///
SU1232.0/The capacity of pond SU12 is reduced///
SU131134.0/The capacity of pond SU13 is reduced///
SU141533.0/The capacity of pond SU14 is reducedDue to the landfill of conduits C116-C119, the inflow of SU14 from J40 increased by 3050 m3/The impervious rate of the S23 catchment area where SU14 is located increased by 49.81%
SU15267.0The landfill of SU35 upstream of SU15 resulted in a decrease of 738.3 m3 in rainwater storage, which in turn resulted in an increase of 3790 m3 in the inflow of SU15 from the upstream conduit///The impervious rate of the S23 catchment area where SU15 is located increased by 49.81%
SU1796.0/The capacity of pond SU17 is reduced///
SU212.0/The capacity of pond SU21 is reduced///
SU22230.0/The capacity of pond SU22 is reduced///
Disclaimer/Publisher’s Note: The statements, opinions and data contained in all publications are solely those of the individual author(s) and contributor(s) and not of MDPI and/or the editor(s). MDPI and/or the editor(s) disclaim responsibility for any injury to people or property resulting from any ideas, methods, instructions or products referred to in the content.

