Article

Historical and Contemporary Geographic Data Reveal Complex Spatial and Temporal Responses of Vegetation to Climate and Land Stewardship

by
Miguel L. Villarreal
1,*,
Laura M. Norman
1,
Robert H. Webb
2 and
Raymond M. Turner
3
1
Western Geographic Science Center, US Geological Survey, 520 N. Park Ave, Tucson, AZ 85719, USA
2
National Research Program, US Geological Survey, 520 N. Park Ave, Tucson, AZ 85719, USA
3
Retired, US Geological Survey, 520 N. Park Ave, Tucson, AZ 85719, USA
*
Author to whom correspondence should be addressed.
Land 2013, 2(2), 194-224; https://doi.org/10.3390/land2020194
Submission received: 26 March 2013 / Revised: 8 May 2013 / Accepted: 9 May 2013 / Published: 15 May 2013

Abstract

:
Vegetation and land-cover changes are not always directional but follow complex trajectories over space and time, driven by changing anthropogenic and abiotic conditions. We present a multi-observational approach to land-change analysis that addresses the complex geographic and temporal variability of vegetation changes related to climate and land use. Using land-ownership data as a proxy for land-use practices, multitemporal land-cover maps, and repeat photography dating to the late 19th century, we examine changing spatial and temporal distributions of two vegetation types with high conservation value in the southwestern United States: grasslands and riparian vegetation. In contrast to many reported vegetation changes, notably shrub encroachment in desert grasslands, we found an overall increase in grassland area and decline of xeroriparian and riparian vegetation. These observed change patterns were neither temporally directional nor spatially uniform over the landscape. Historical data suggest that long-term vegetation changes coincide with broad climate fluctuations while fine-scale patterns are determined by land-management practices. In some cases, restoration and active management appear to weaken the effects of climate on vegetation; therefore, if land managers in this region act in accord with on-going directional changes, the current drought and associated ecological reorganization may provide an opportunity to achieve desired restoration endpoints.

1. Introduction

Monitoring and characterizing the interacting effects of land use and climate on land surface processes is a primary focus of land change science [1], and of particular concern in arid environments where both landscapes and livelihoods can be impacted by short-term climate variability [2,3]. A considerable amount of research conducted in the western United States documents and describes a wide range of anthropogenic and climate-driven vegetation changes over the past several centuries [4,5,6,7]. Much of the focus in the southwest has been on: (1) the conversion of native grassland to shrubland and savanna through the process of woody plant encroachment [8,9], and (2) changes in the distribution and cover of species-rich riparian vegetation related to ground and surface water use [10,11]. Grasslands and riparian systems share ecological and hydrologic linkages that are important for sustaining watershed function: grassland species composition, cover, and disturbance history will influence run-off, erosion, and groundwater recharge, ultimately affecting water availability for riparian vegetation [12,13,14]. Spatial models describing past landscape changes to upland and riverine systems can provide important baseline information for restoration of arid watersheds.
Desert grasslands are of major conservation concern in temperate regions as they provide a number of ecological services ranging from livestock production, carbon storage, nitrogen cycling, rainfall infiltration, and habitat for animal biodiversity [15,16]. Many grasslands around the world are experiencing change through the encroachment of woody shrubs and trees, and there is currently no consensus concerning the exact causes of woody plant expansion into grasslands. In western North America, several key drivers have been identified including overgrazing, wildfire suppression, climate change, and recent CO2 and N enrichment of the environment [2,7,8,9,10,11]. Prior to Anglo-American settlement, woody plants in grasslands were suppressed by periodic wildfires that helped to maintain range productivity and cycle nutrients [7,16,17,18]. Livestock grazing effectively suppressed grassland wildfires by consuming and disrupting the continuity of fine fuels [5] and browsing helped to disperse and establish leguminous seeds of woody plants like mesquite (Prosopis velutina) [19]. Broad climate fluctuations during the 20th century, particularly periods of unusually high winter precipitation, are implicated in the preferential establishment of C3 woody shrubs over warm-season-active C4 grasses [7,20].
In addition to woody invasion of rangelands, riparian areas, including both densely forested riverine riparian corridors and narrow xeroriparian woodlands (woody plants with dense cover or interlocking canopies adjacent to ephemeral, dry washes) along tributaries, have undergone considerable anthropogenic and climate-driven changes since Anglo-American settlement in the southwest [10,11]. Like grasslands, change in western riparian vegetation is a topic of debate; but it is the amount and location of change rather than the drivers of change that are contested [10]. Riparian areas provide valuable cultural, regulating, and provisioning services like flood control, biodiversity, water quality, scenic values, habitat corridors, and pollution buffers [21,22]. More than a century of livestock grazing, urban development, surface-water development, groundwater over extraction, and climate-related hydrological changes have influenced the spatial extent and quality of riparian vegetation in southeastern Arizona and northern Mexico [10,11,23,24]. These ecological changes to grasslands and riparian areas of the western US due to climatic fluctuations, water development, and livestock-related disturbances have been compounded by increasing conversion to rural and exurban land uses during the past 30–50 years, as the economic value of rangeland shifted from a pastoral economy to real-estate developments [25,26].
Restoration of degraded lands and adaptation to changing climate and land uses requires identification of the rates, patterns and drivers of vegetation change in both the temporal and spatial dimensions. Currently, many adaptive management models are informed by studies conducted using small plots within experimental ranges and/or protected areas, and therefore may have limited applicability for management of large, heterogeneous landscapes [12,27]. In addition to non-representative locations, ecological field experiments are often carried out within a short academic time frame, and the results, interpretations, and implications of these studies can become distorted by anomalous or extreme climate events occurring within longer-term climate patterns [28,29,30]. Perhaps the most confounding limitation of many early rangeland studies was the failure to incorporate multiple geographic scales, patterns and processes into the research design [31]. Bestlemeyer et al. [32] recently reviewed a number of rangeland studies that implemented State and Transition Models (STMs) and concluded that the lack of information describing spatial heterogeneity over the landscape is a major factor that severely limits the use of STMs for management. They believe that land use history and spatial feedbacks between adjacent vegetation patches, which have been traditionally ignored in the models, may affect transition narratives [32], and multi-scale approaches to STMs will provide additional evidence to uncover spatial processes in vegetation change [31,33].
The objective of this study was to assess historical rates and spatial patterns of grassland and riparian change within a topographically complex watershed that contains a heterogeneous and bi-national land use mosaic. More specifically, our goals were to develop an integrative, multi-observational approach to landscape-change analysis that combines change detection methods from quantitative multitemporal (satellite imagery) and semi-quantitative long-term (repeat ground photography) data that would allow us to contextualize variability in the spatial and temporal dynamics of vegetation change relative to climate and land-use.

1.1. Historical Data

By providing documentation of ecosystem conditions in the past, replicated historical photographs are an important source of information on long-term biological and ecological changes in various regions and landscapes throughout the globe [34,35]. Both qualitative and quantitative change detection techniques have been applied to repeat photography to answer ecological research questions ranging from assessments of forest canopy changes to desert-plant population dynamics [36,37,38,39,40,41,42]. Repeat photography has proven to be a particularly powerful tool for identifying long-term vegetation and ecosystem trends in the desert southwest [7,10].
The use of repeat photography for change analysis has several weaknesses, particularly when compared to more systematically collected, multispectral imagery from space-based platforms. For example, the oblique angle of ground photographs makes precise estimation of area (and consequently, vegetation cover) difficult, especially when the time of day and seasonality of the image collection can influence interpretation (but see [41]). New and novel approaches to change detection using ground photography have been pursued using digital image processing and analysis [43]. Complex image-processing techniques may ultimately offer no real advantage over visual interpretation if the objective is to simply assess if a certain vegetation type has increased, decreased, or remained unchanged. In many cases, visual interpretation of the photograph is sufficient to provide sound estimates of change in vegetation community types or percent cover [44,45].
Another obstacle in the interpretation and application of repeat photography is the non-random, spatial bias of the samples: many locations were originally selected for cultural, aesthetic, or commercial reasons [46]. Original photo sites were often located along travel routes with heavy use or close to settlements, and the vegetation conditions depicted often contain signs of human use or disturbances that may not reflect the broader landscape. This limits the interpretation of original photography as a record of vegetation in its “natural state” or “pre-settlement” conditions. There are cases of non-biased samples, like those photographed in 1892 by D.R. Payne as part of the USA/Mexico Boundary Commission survey; the establishment of the US/Mexico border led them through remote parts of the desert southwest ([4,7] note: several of these photographs were used in this research).

1.2. Fusion of Historical and Contemporary Data

While presenting many challenges, the linkage of repeat photography with remotely-sensed images can strengthen the overall observational power of remote sensing by offering multiple lines of evidence as well as yielding information at multiple temporal and geographic scales. For example, historical photography extends the temporal envelope of remote-sensing analysis and provides useful ground-verification data for historical satellite imagery [47]. Conversely satellite-platform remote sensing expands the spatial coverage and inferences made from a small sample of repeat photographs, putting the location of these long-term monitoring data into a broader context of landscape change albeit over a shorter time span. To date, very few studies have attempted to analyze long-term changes with both repeat ground photography and multitemporal satellite data or use historical photography to validate land-cover changes [42].
Interpretation and analysis of both ecosystem monitoring data from remotely-sensed imagery and long-term field data allow us to quantify temporal changes over entire watersheds that include a wide range of plant assemblages, soil types, land uses, and land use histories. Thus far, land-change analyses in the region have been accomplished using either long-term monitoring data or remote sensing, both of which, when used on their own, have inherent limitations that weaken spatial and temporal inferences. In this paper, we analyze medium-term land-cover change in conjunction with long-term repeat photography at discrete locations. The temporal and spatial-scale issues addressed in this research are particularly important given the uncertainties surrounding vegetation change under predicted future warming, and the potential intensification of changes related to interactions with changing land use. We address these issues by examining change patterns in the context of long-term climate and land management. This long-term, spatially explicit information describing vegetation changes can help land stewards better manage, restore, and adapt in light of predicted future climate and land use and urban growth scenarios.

1.3. Study Area

The upper Santa Cruz Watershed occupies 9,146 km
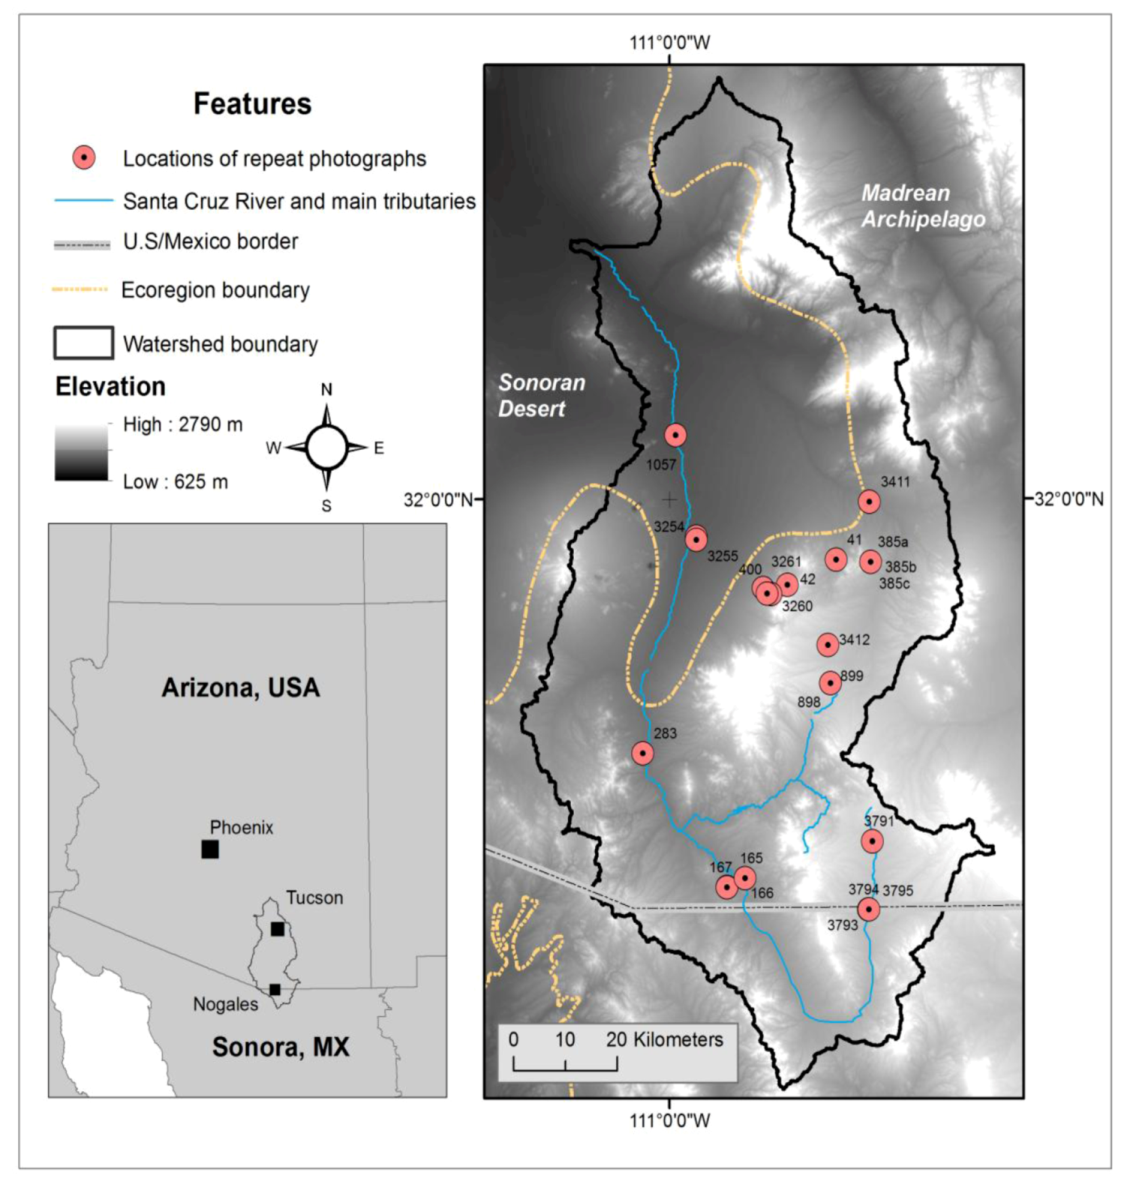
2 of southern Arizona, USA, and northern Sonora, Mexico, with most of the watershed in the United States. The watershed contains two major urbanized areas: the greater Tucson metropolitan area (2011 population: 989,569) and “Ambos Nogales,” a contiguous urban area that contains both Nogales, Sonora (2010 population: 220,292) and Nogales, Arizona (2011 population: 20,948) divided by the USA/Mexico border (Figure 1). The remaining landscape within the watershed is predominantly rural and sparsely populated.
Figure 1. Location of the Santa Cruz Watershed including Ecoregion boundaries, repeat photography camera stations, elevation, and the USA/Mexico boundary.
Land 02 00194 g001
The topographically complex watershed ranges in elevation from 625 to 2,790 m and straddles the Sonoran Desert and the Madrean Archipelago Ecoregions [48]. The greater Sonoran Desert Ecoregion, which covers arid portions of southeastern California and southwestern Arizona in the USA, and northeastern Baja California and northwestern Sonora in Mexico, is characterized by a dry subtropical desert climate and basin and range physiography, with elevations ranging from sea level to 1,400 m. The greater Madrean Archipelago Ecoregion spans southeast Arizona, southwest New Mexico in the USA, and northern Sonora in Mexico, and is characterized by a dry, subtropical to mid-latitude steppe climate and medium to high relief basin and range physiography with elevations ranging from 800–3,000 m. The separation between these two ecoregions in the Santa Cruz Watershed occurs at an elevation of approximately 1,000 m. Nearly 61% of the watershed is in the upper elevation Madrean Ecoregion; the lower basin, where the Tucson metropolitan area is situated, is primarily lower elevation Sonoran Desert. The watershed supports various plant associations and alliances ranging from Sonoran desert scrub to mixed-conifer forests.
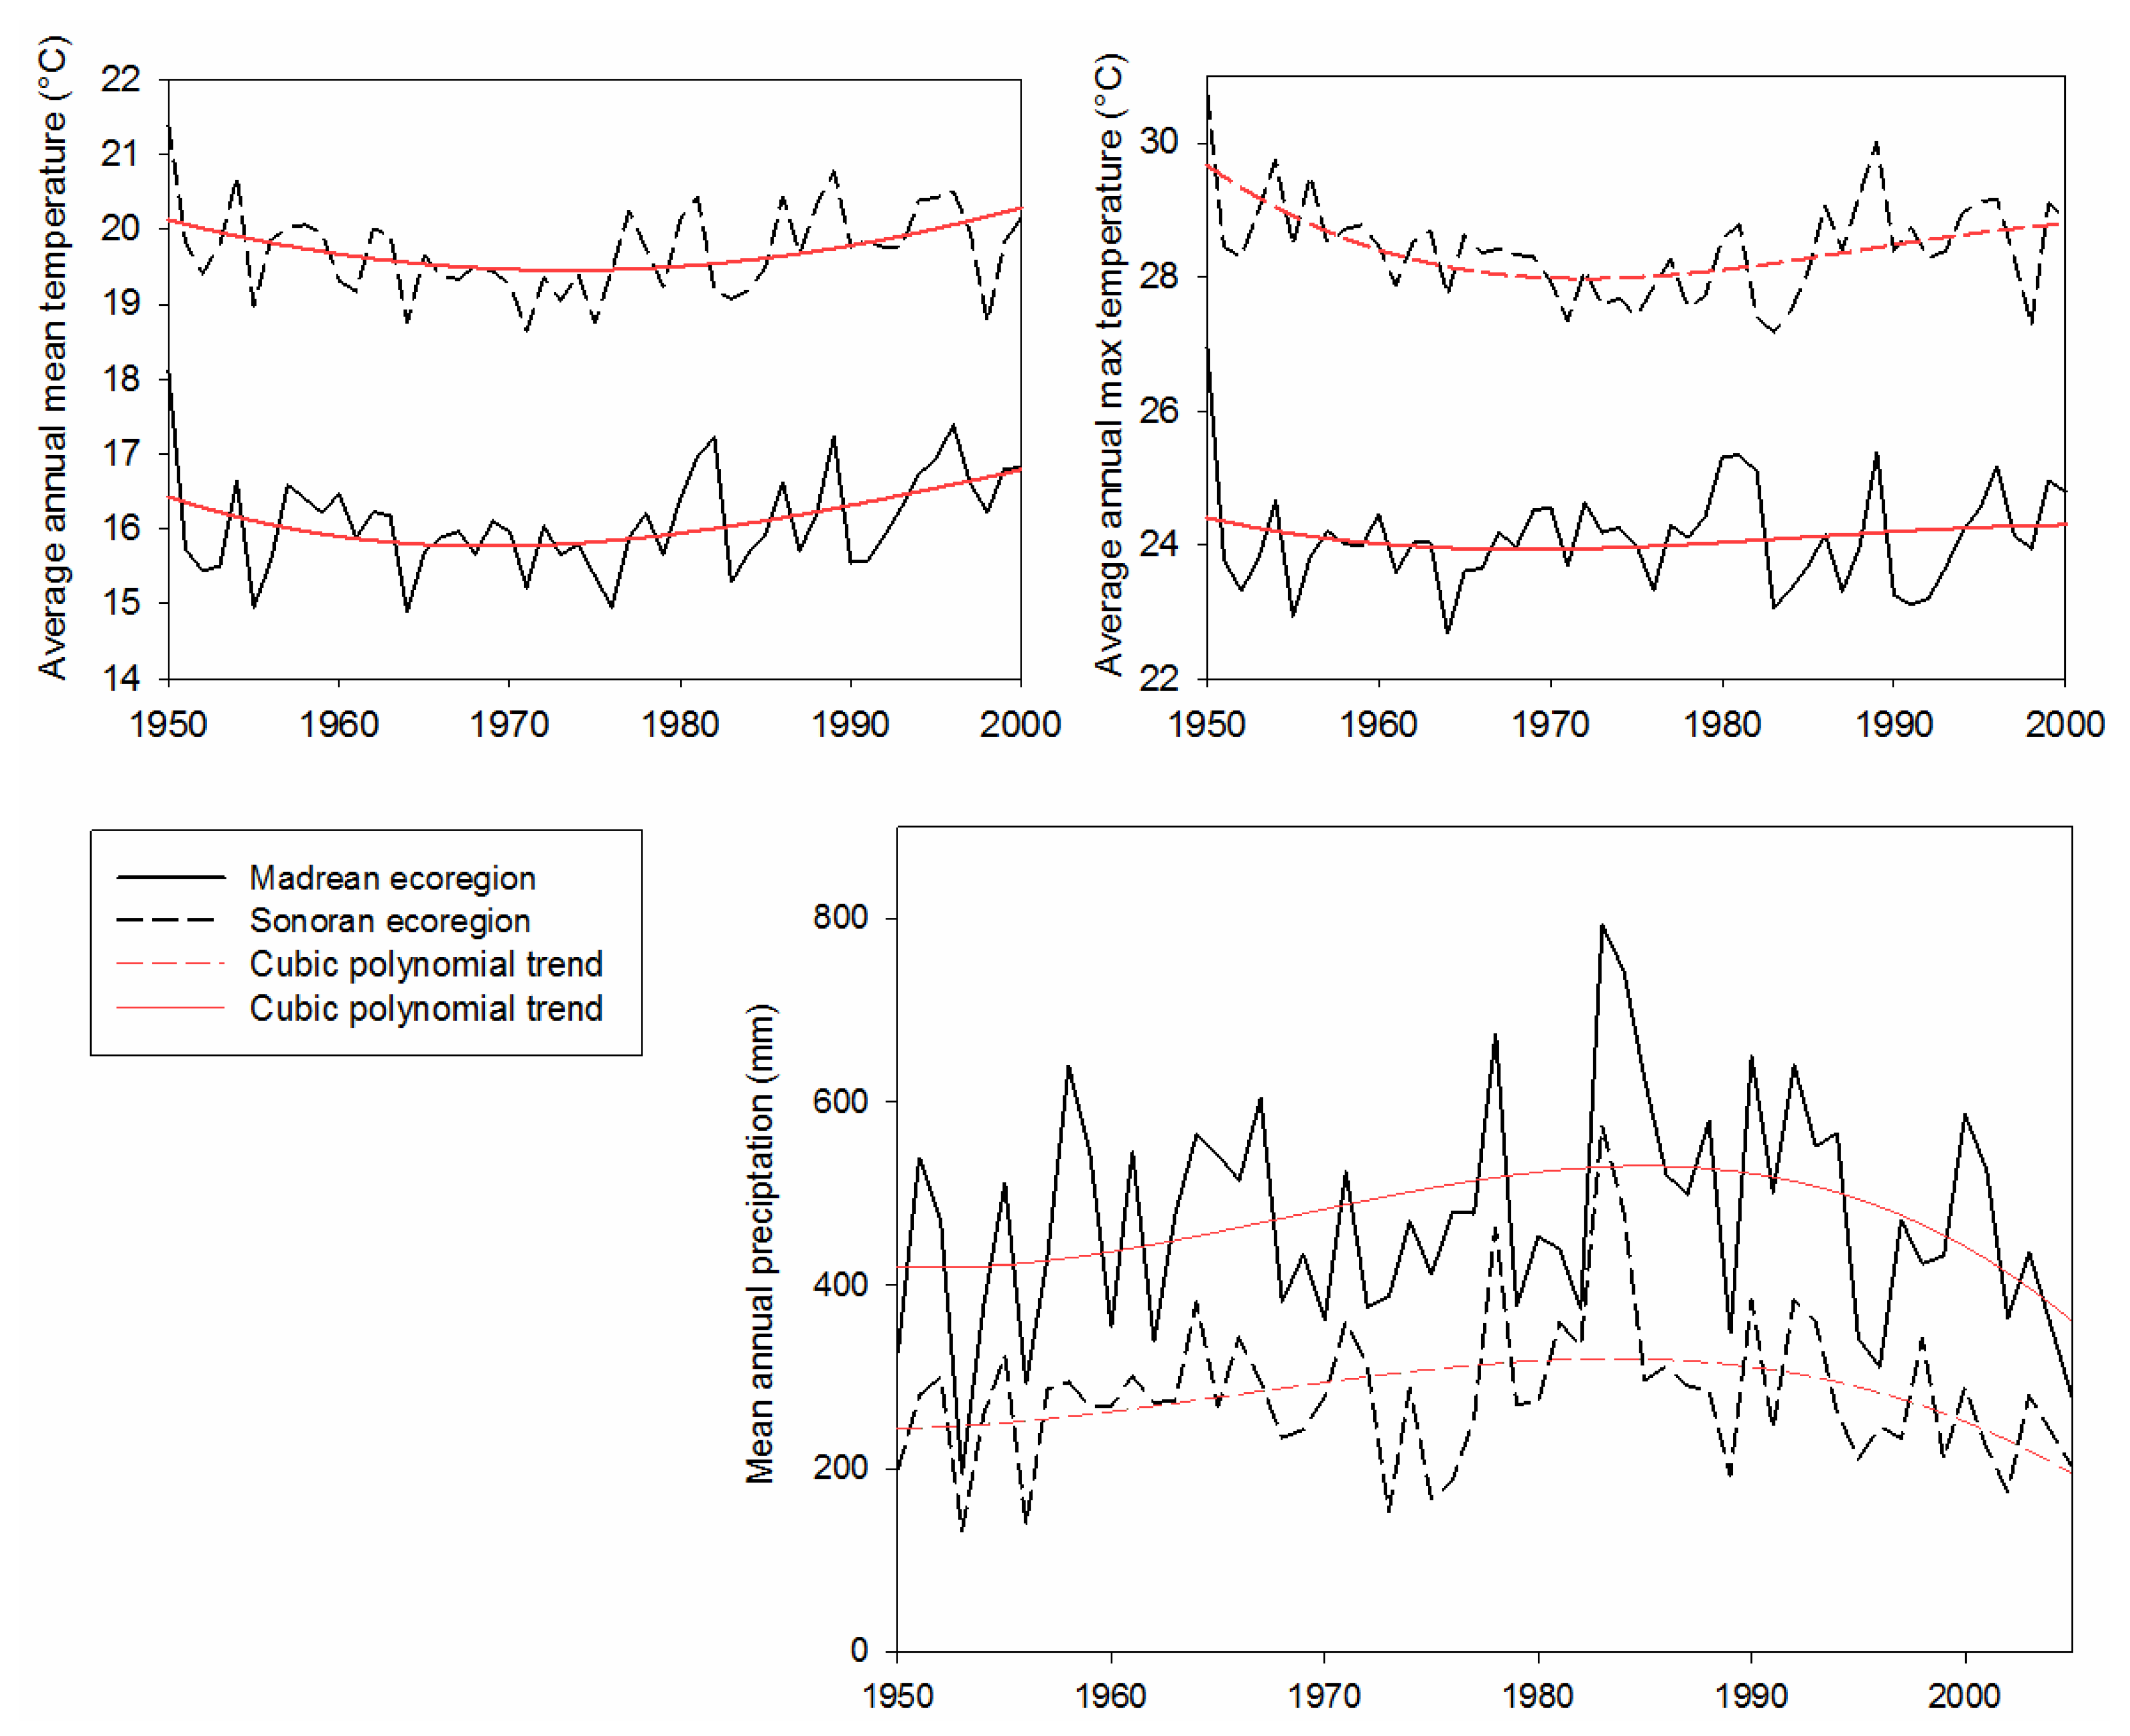
The climate of the watershed is characterized by mild winter and high summer temperatures and a bimodal precipitation pattern. Between 1950 and 2005, the minimum annual precipitation was 104 mm (measured at Anvil Ranch in 1956) and the maximum was 890 mm (measured at the Santa Rita Experimental Range in 1983). Average annual precipitation was 278 mm in the Sonoran Ecoregion and 470.5 mm in the Madrean. Mean temperature ranged from 16.09 °C in the Madrean to 19.71 °C in the Sonoran. Average monthly minimum temperature in the two Ecoregions ranged from 0.39 to −0.328 °C, and average maximum ranged from 32.44 °C to 37.83 °C.

1.4. Materials and Methods

We created a series of four (1979, 1989, 1999 and 2009) land use/land cover (LULC) maps to quantify and map land-cover change, acquired hardcopies and locations of historical, repeated ground photographs and rephotographed the locations to capture current day (2011–2012) conditions. The photographic time series were analyzed relative to landscape change patterns calculated from satellite data. Temporal and spatial landscape changes were then analyzed relative to broad historical climate patterns by ecoregion, and relative to fine-scale land ownership and management data. The following sections describe in detail the data used for analysis and the methods employed.

1.4.1. Multitemporal Land Cover

Primary spatial data were derived from four LULC maps with 14 cover classes mapped at decadal intervals (1979–2009; [49]). The LULC classification scheme and classification techniques are based generally on methods used to develop the US Geological Survey (USGS) National Land Cover Database (NLCD) [
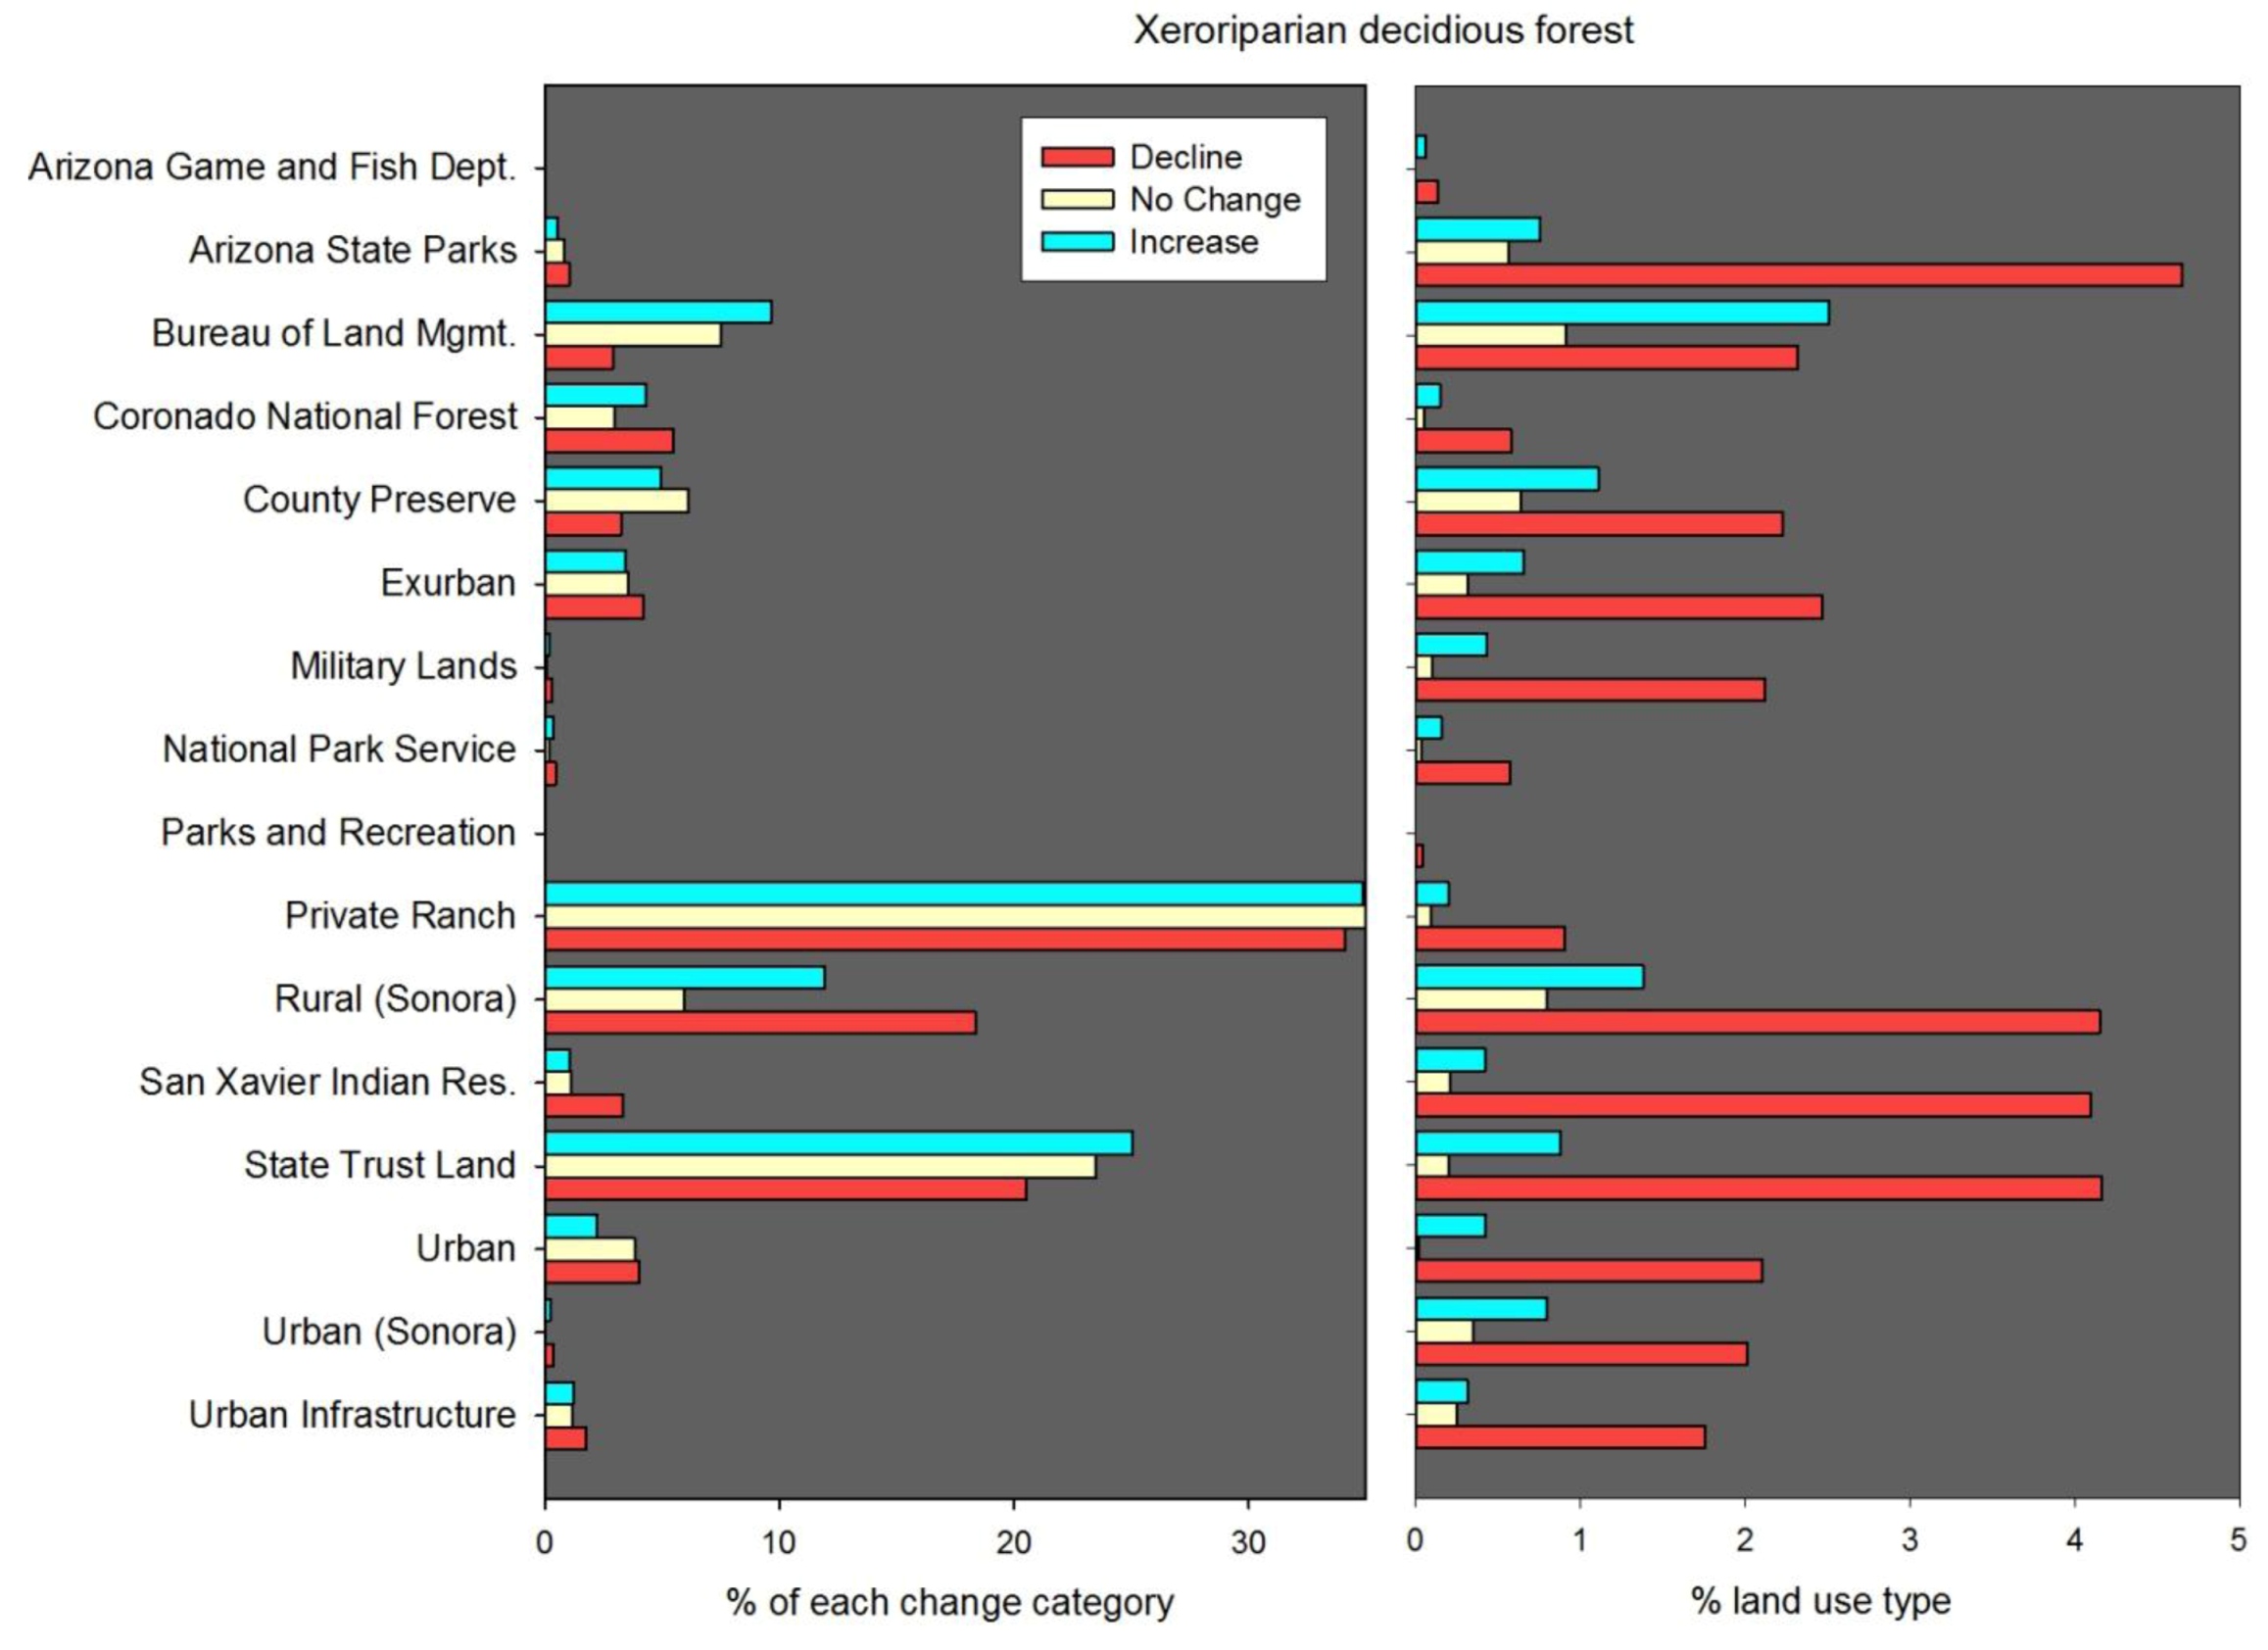
50]. There were some major, and deliberate, differences between our LULC dataset and existing NLCD maps. First, NLCD land cover was mapped for the conterminous United States only, whereas the LULC maps we developed of Santa Cruz Watershed included portions of Mexico. Second, the general NLCD classes we used were tailored to represent specific vegetation types that are of regional and local interest with an emphasis on accurately mapping riparian and xeroriparian classes, which were poorly characterized by NLCD in our study region. Although we mapped 14 classes of land cover, we prioritized our analysis on two classes of interest for rangeland conservation and restoration: grassland/herbaceous and xeroriparian deciduous forest (we classified xeroriparian and mesquite riparian bosque (forest) communities as NLCD class “41 - Deciduous Forest”). Common woody plant species found in these xeroriparian communities include Prosopis velutina, Acacia spp., Parkinsonia florida, Ziziphus obtusifolia, and Lycium andersonii. Grasslands in the watershed are made up of mixed native grasses (Bouteloua spp., Aristida spp.) and non-native grasses (e.g., Eragrostis lehmanniana), interspersed with large woody plants (e.g., Prosopis velutina, Quercus spp.) desert shrubs (e.g., Acacia spp., Mimosa biuncifera), and cacti and succulents (e.g., Agave spp. Opuntia spp., Yucca elata).
Landsat Multispectral Scanner (MSS) and Thematic Mapper (TM) bands, image-based transformations, and ancillary data sets were used to develop Classification and Regression Tree (CART) models. For each LULC classification we used two satellite images collected during seasonal extremes with the aim of differentiating land-cover classes based on changes in land surface phenology: one collected during the dry early-summer (May–June) and one after vegetation green-up following summer rains (August and September). The TM images were converted to reflectance values using the cosine of theta (COST) model [51]. The 60 m MSS image was not converted to reflectance (however, this was not required as we made no direct spectral comparisons between years) but was scaled to 30 m. CART input variables included Landsat spectral bands, spectral transformation (including image variance and multitemporal Kauth Thomas [52]) and ancillary environmental data (including slope and hydrology) (see [49] for detailed methods).
CART is a non-parametric model that has proven useful in applications that involve both multispectral and ancillary data [53]. The CART model recursively splits multidimensional data into a dichotomous classification tree based on statistical characteristics of the training data. In this case the CART classifications were trained using reference data from high-resolution aerial photographs collected on or near the date of the Landsat imagery. For example, training areas for the 1979 map were digitized from three dates of aerial photographs (1975 panchromatic, 1980 panchromatic, and 1984 color infrared imagery). Training classes were discriminated based on visual interpretation (i.e., deciduous and evergreen tree cover is determined by color and texture of tree canopy structure). When possible the same training sites were used to classify all four dates of imagery (if the training sample locations experienced no vegetative change over time period). By developing decision-tree models for the different dates of satellite imagery using this invariant sampling approach, we reduce classification errors associated with potential spatial and temporal variability of land-cover training samples and spectral data.
Land-cover classes were assigned to a training area based on visual interpretation of percentage of cover types present in the sample area and identification of the dominant cover type. For example, if an area had a mixture of cover types, grassland was selected over a shrubland if the dominant cover type in the area was herbaceous, rather than tree, shrub, or bare soil. This cover-based approach to classifier training theoretically allows for hard classification of subtle spectral shifts in community composition over time. If, for example, at time t, a 5% per decade shrub encroachment occurred in a pixel that was at t-1 dominated by 42% herbaceous cover, 40% bare soil, and 18% shrub cover, then that pixel could in theory be classified at t-2 as bare soil or remain herbaceous, depending on which cover type the shrubs replaced. This approach makes the models more flexible, but also makes change interpretation more difficult. In this example, depending on what the output class was, we are not certain whether woody plant encroachment occurred or if the land had become desertified. Villarreal et al. [49] reports land-cover class accuracies, kappa statistics, and analysis of errors. A condensed version of this information, including overall map accuracies, kappas and accuracies of our two classes of interest are presented in Table 1.
Table 1. Classification accuracy of land cover data used in this study.
DateLand Cover MapsDeciduous ForestGrassland
Overall Accuracy (%)KappaUsers (%)Producers (%)Users (%)Producers (%)
197984.80.83590857889
198984.30.82992807465
199981.80.80278818686
200986.50.85486848380

1.4.2. Post-Classification Change Detection

Detecting temporal changes in land cover or vegetation using remotely sensed imagery is a challenging task and the focus of considerable research [54,55,56]. There are numerous change detection techniques available, each with advantages and disadvantages [
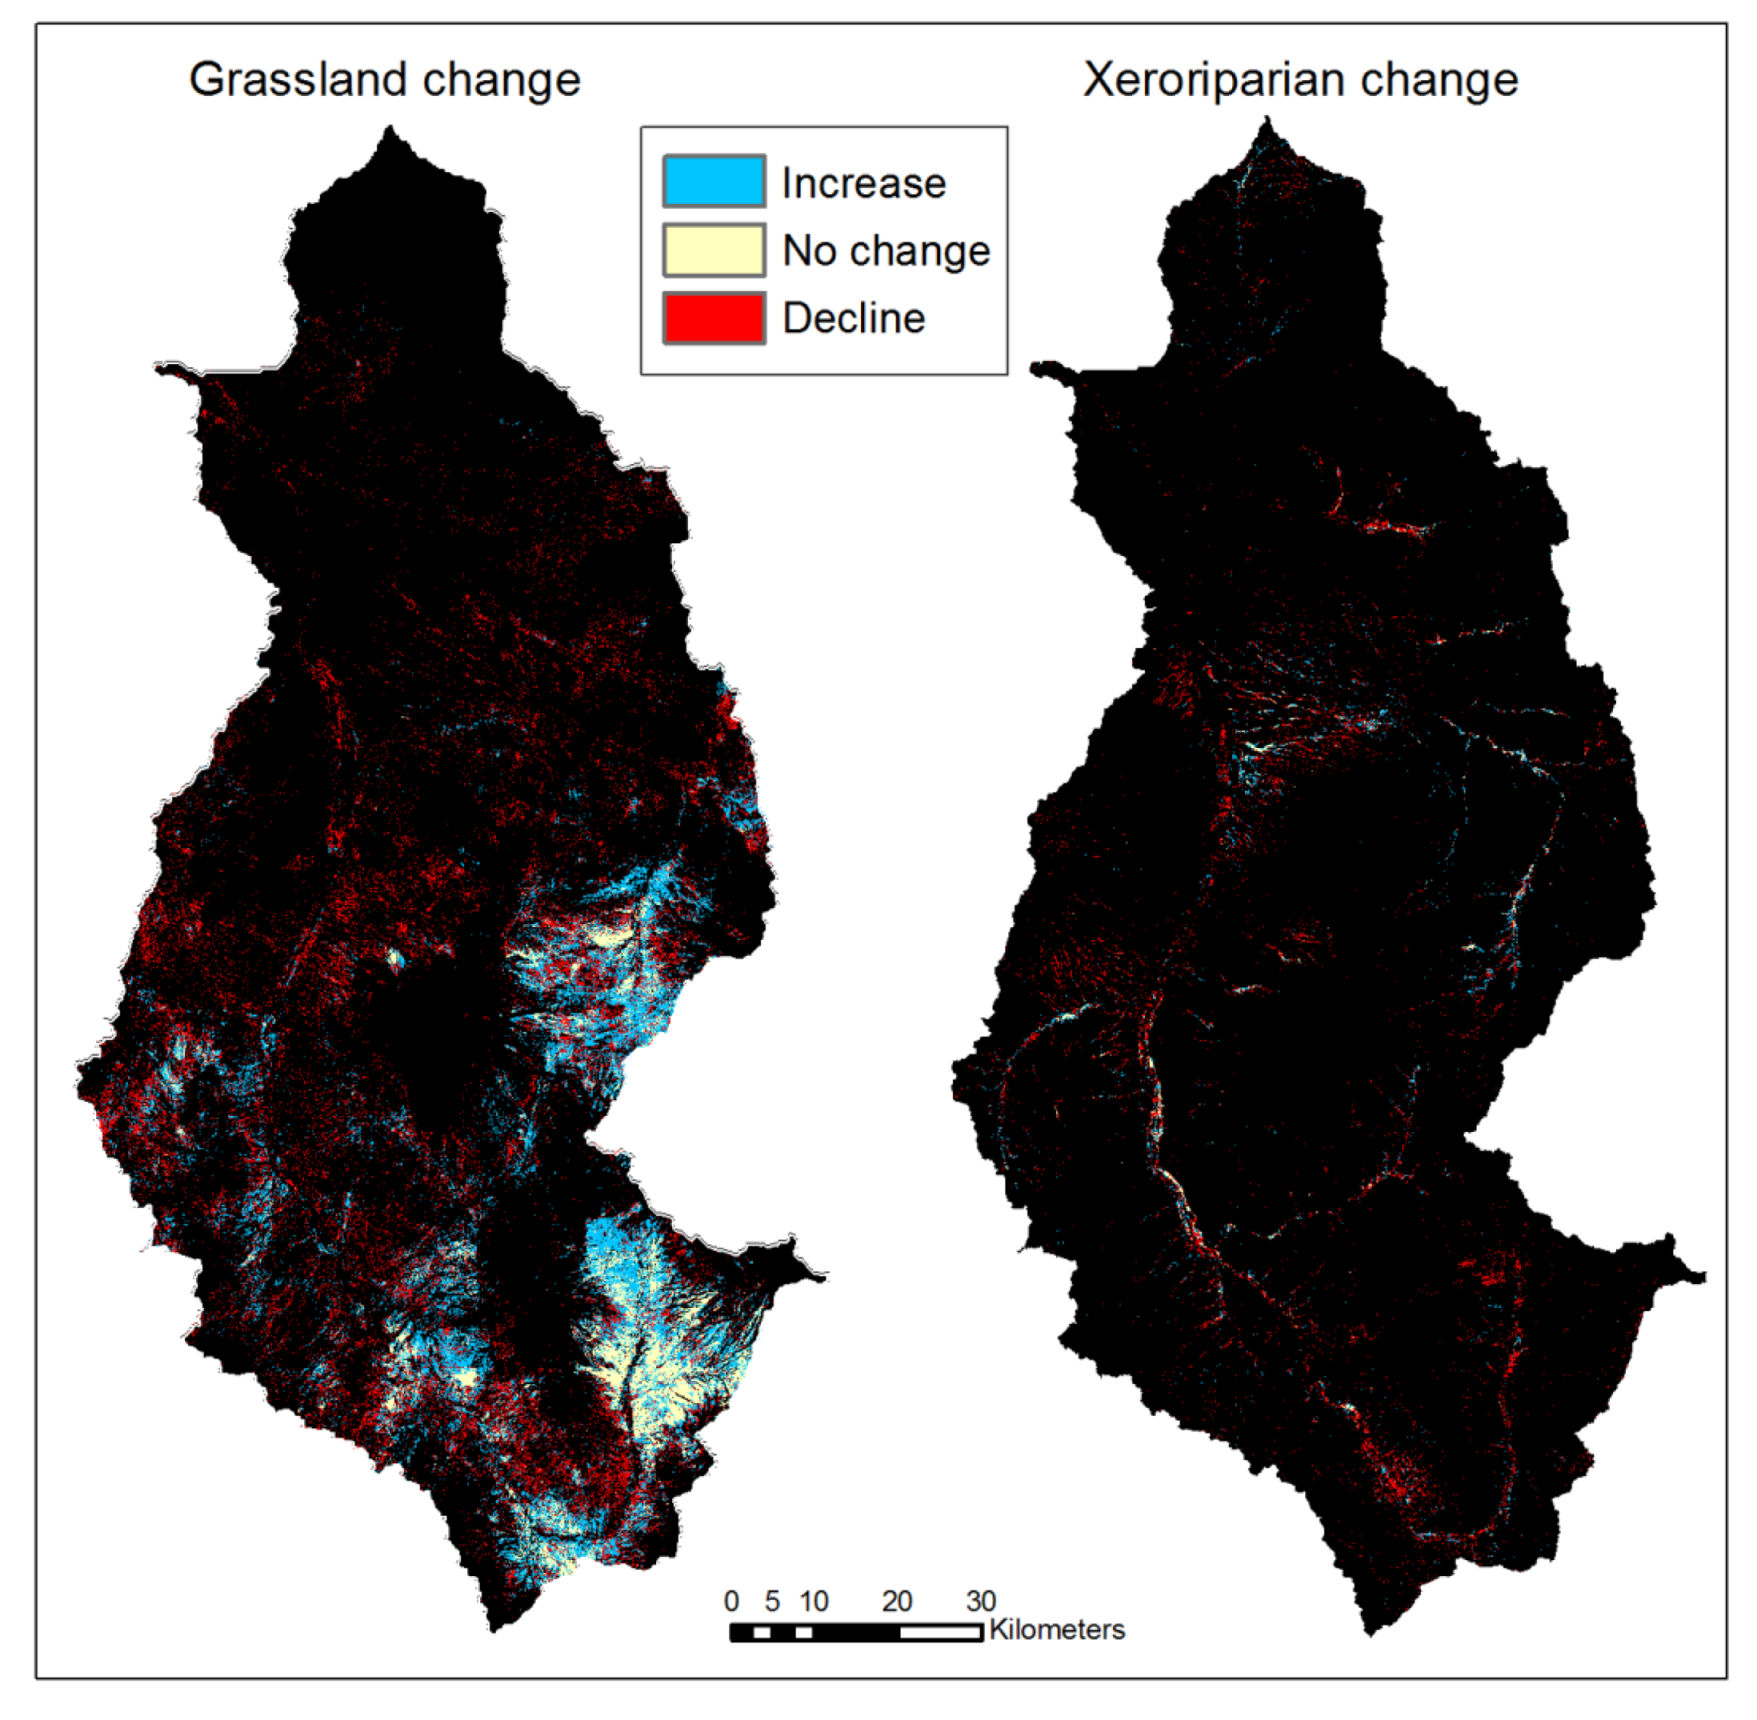
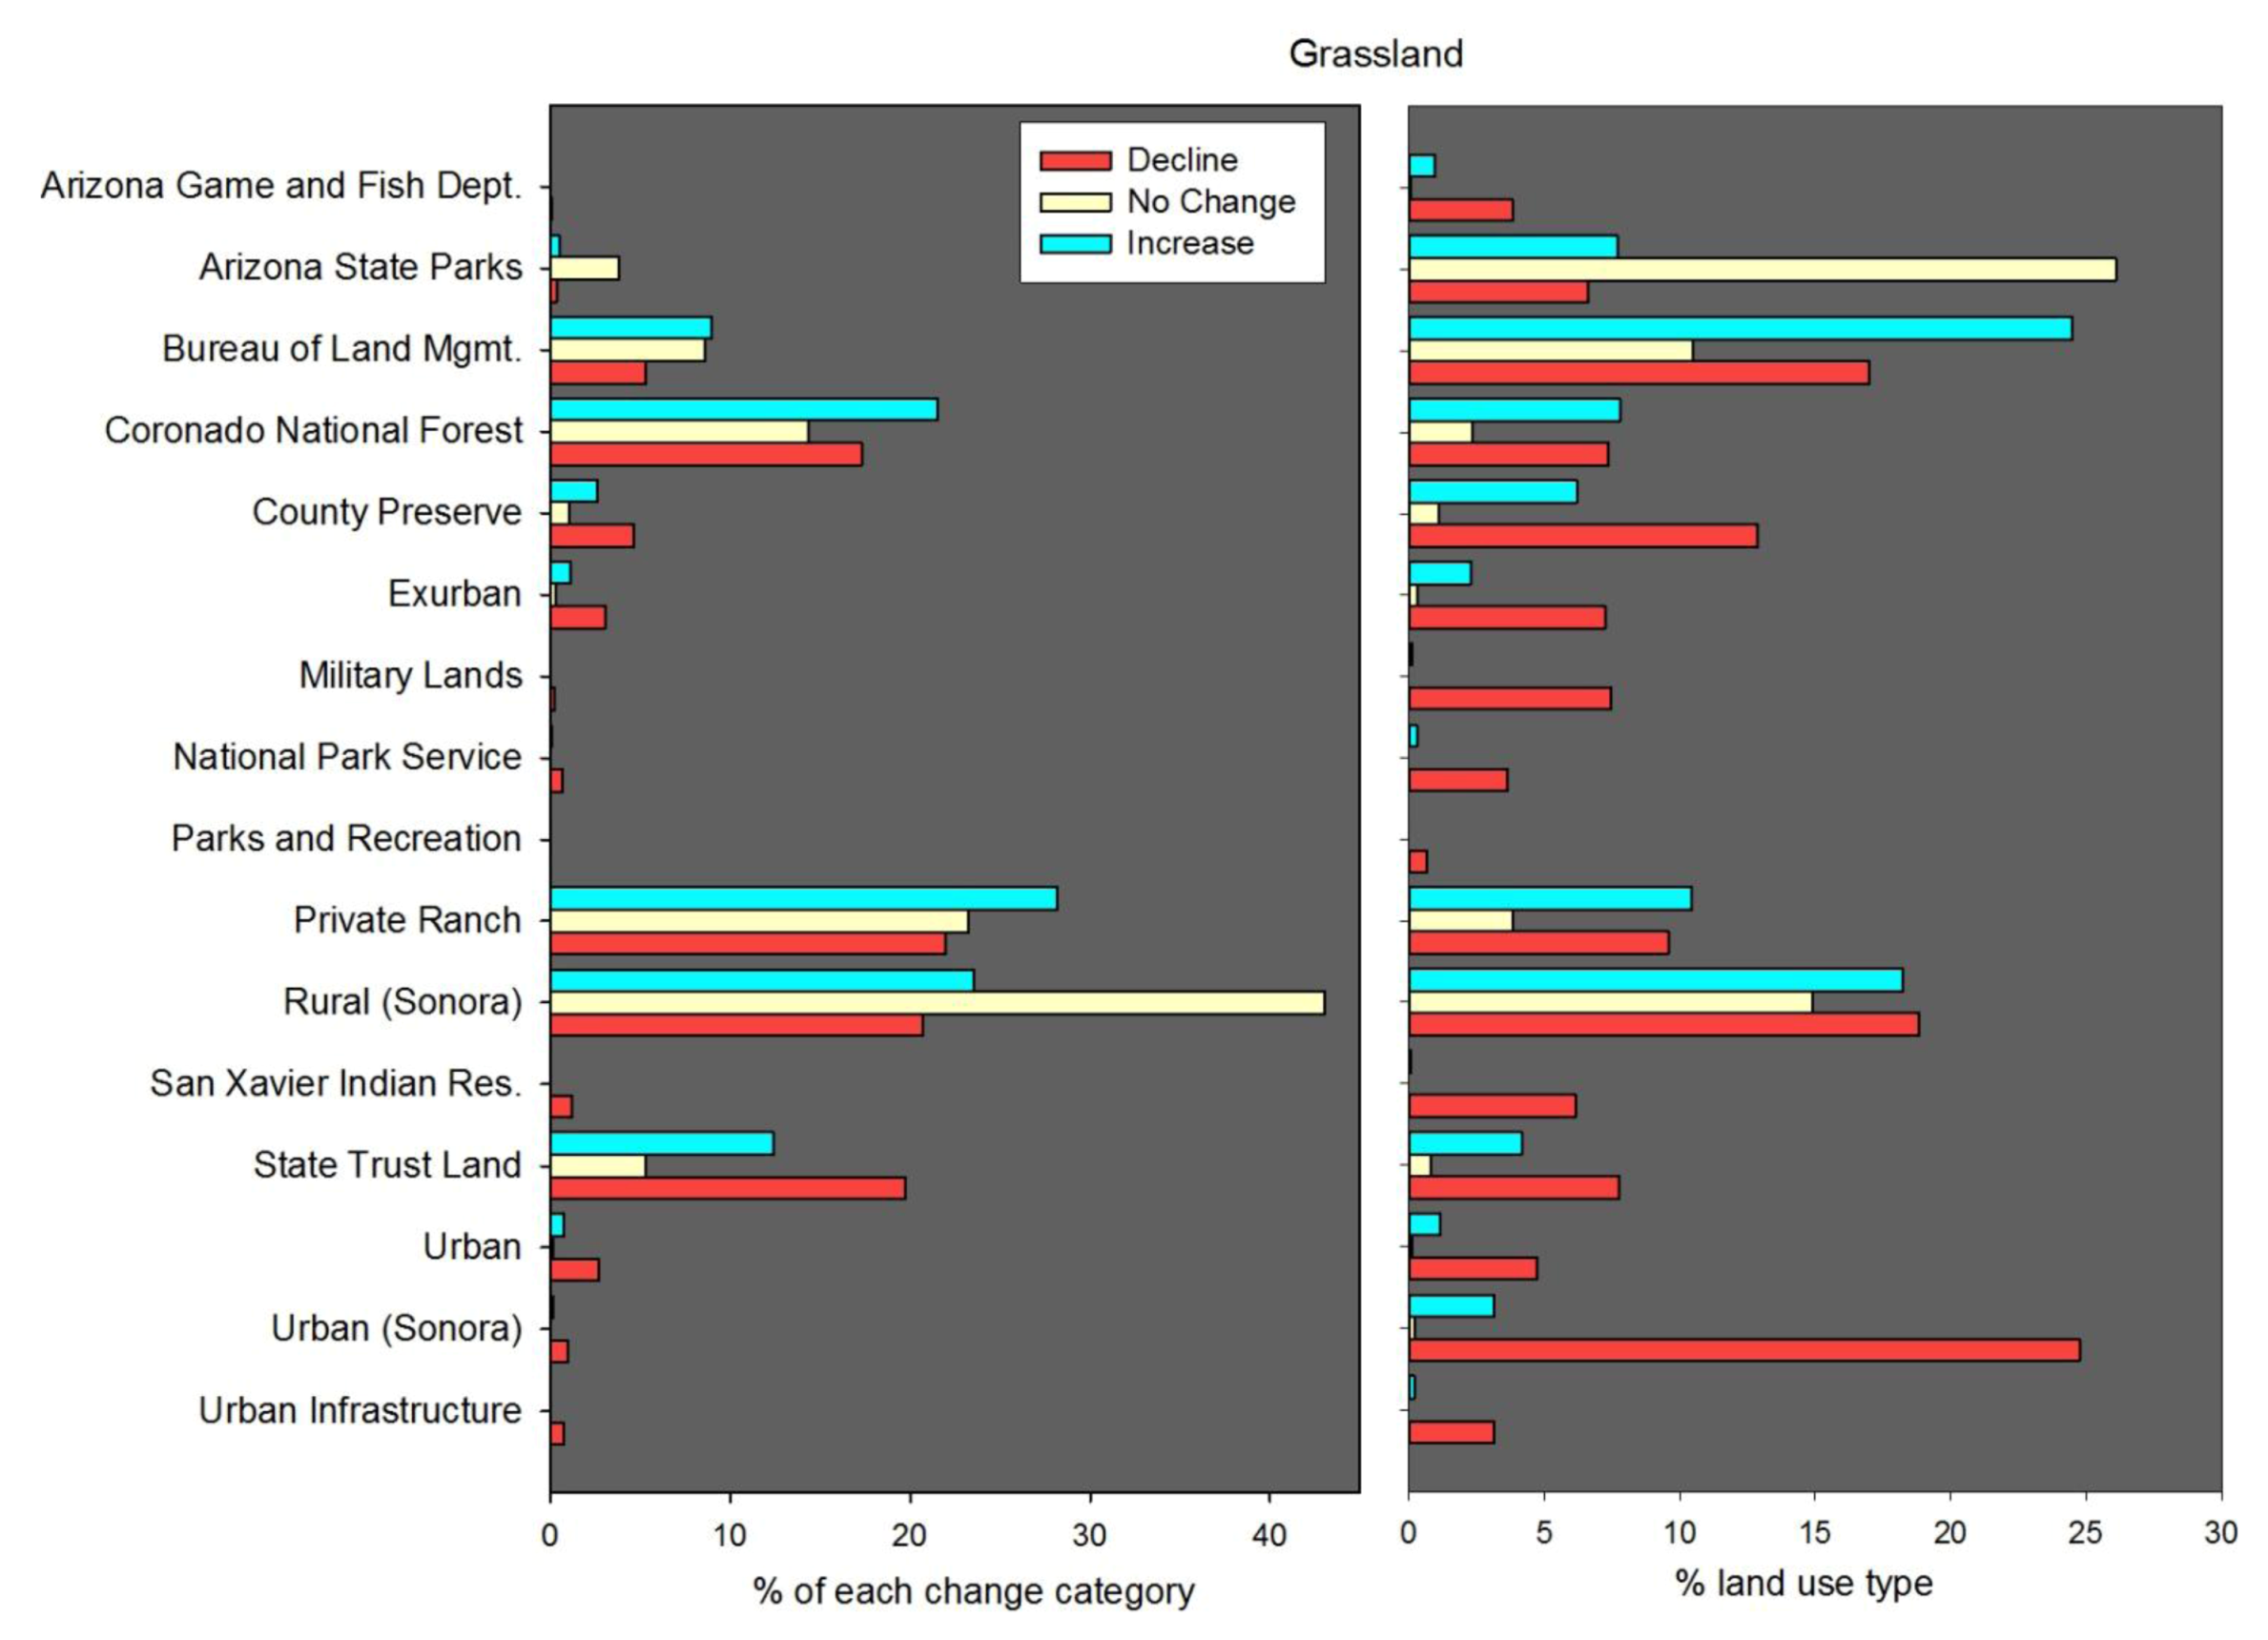
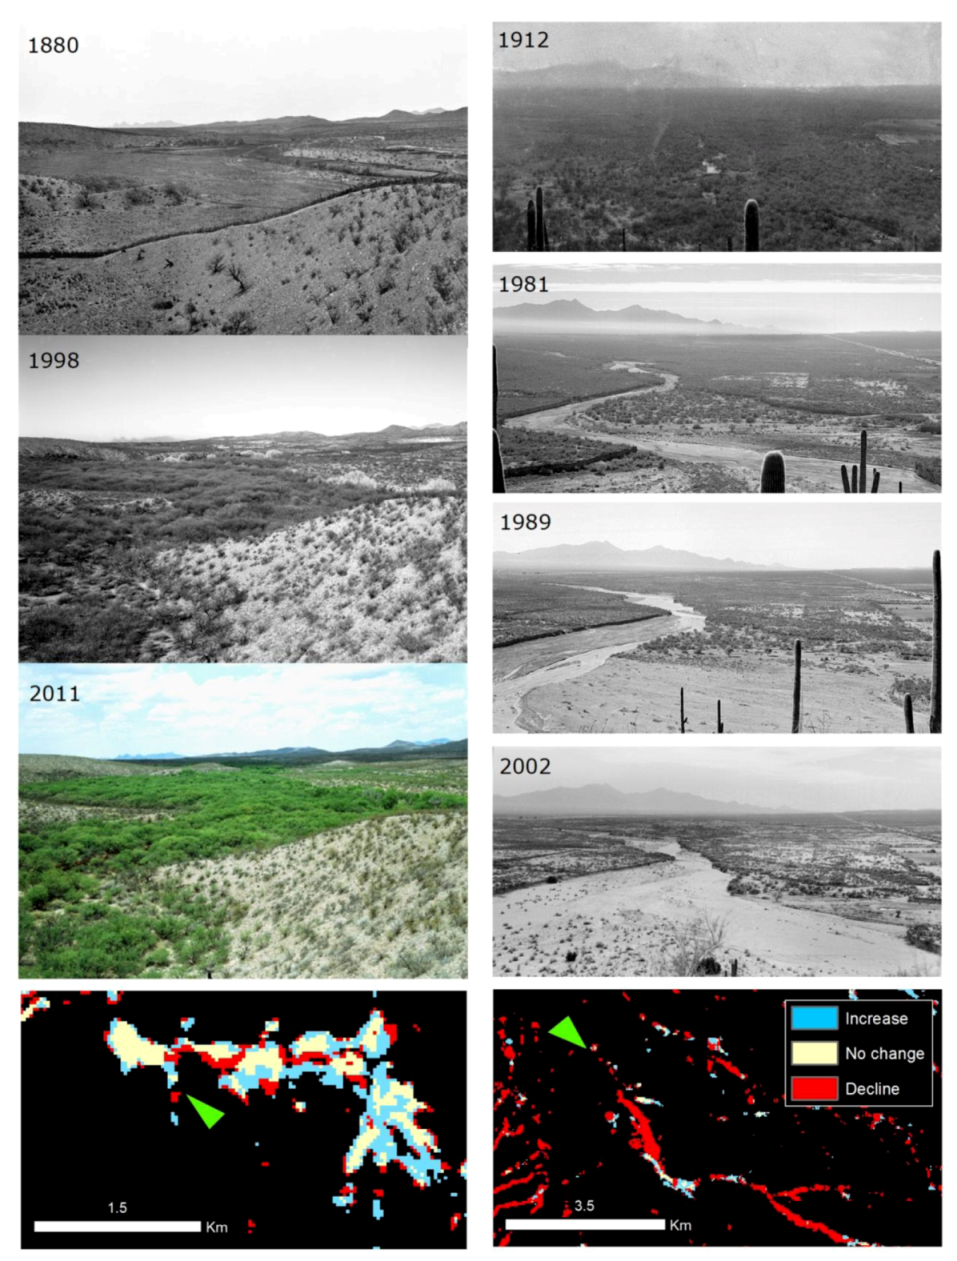
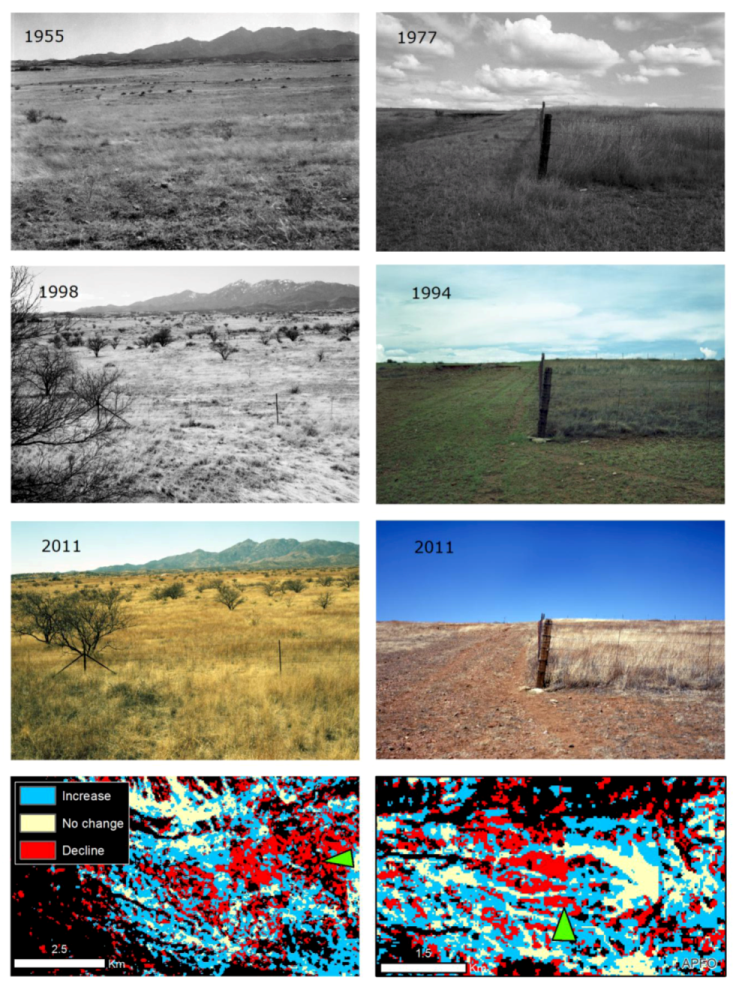
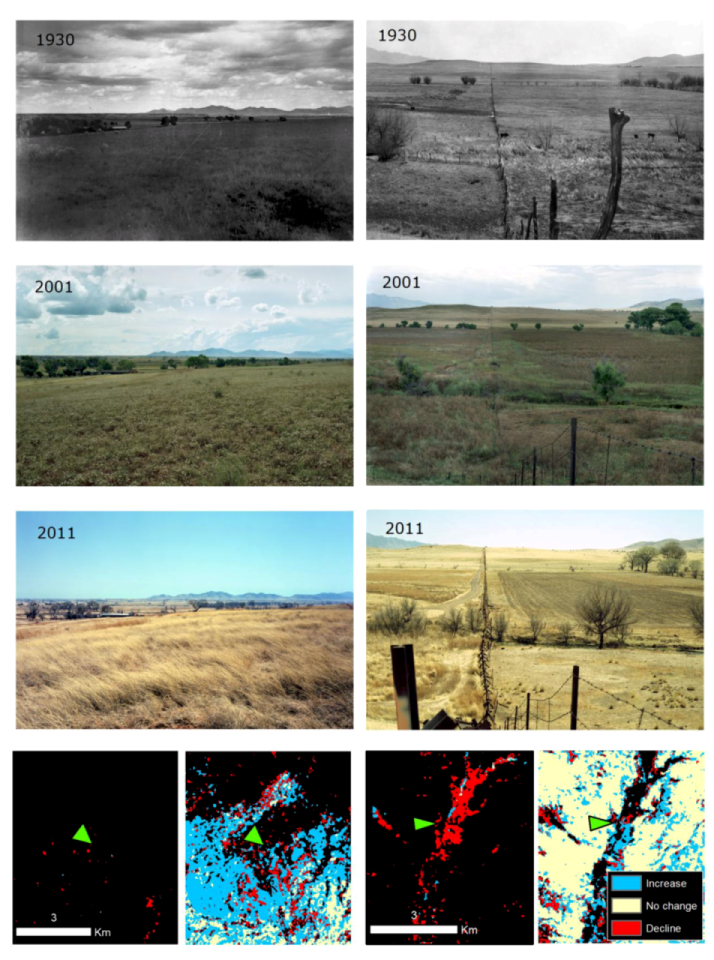
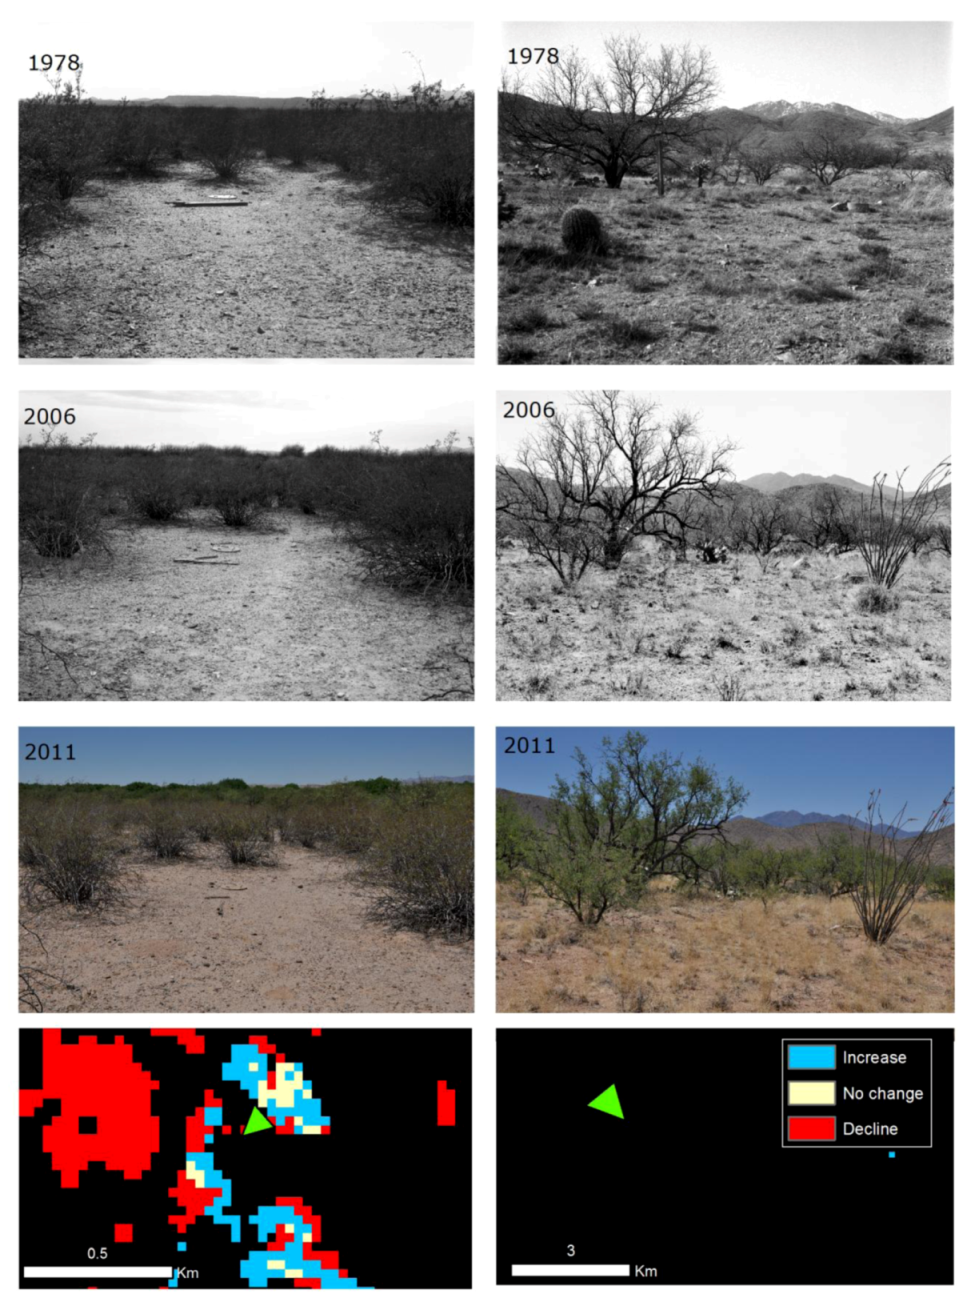
57]. The choice of change detection technique is typically informed by the specific research question, satellite data parameters, and temporal range of the analysis. For this study we created post-classification change detection maps by executing map algebra expression on the four dates of land cover. We chose post-classification change detection because we were interested in mapping and assessing changes in area and spatial distribution of specific land cover types. A major drawback of post-classification change detection is the number of potential change combinations resulting from the number of classes (14) and number of raster matrices (4). Because of the potentially large number of change combinations between the four dates we developed a set of criteria to categorize change classes as either “increase,” “no change,” or “decline.” For example, the “grassland increase” category included pixels mapped as grassland (1) only in 1999 or 2009, (2) in 1979 and again in 1999 or 2009, (3) in 1989 and again in 2009, and (4) in 1999 and 2009. The “grassland no change” category included pixels mapped as grassland in (1) all years, as well as (2) 1979, 1999, and 2009, and (3) 1989, 1999, and 2009. The “grassland decline” category included pixels mapped as grassland (1) only in 1979 but not after, (2) only in 1989 but not after, and (3) in both 1979 and 1989 but not in subsequent years. The xeroriparian deciduous forest change map was classified using the same criteria described above.

1.4.3. Repeat Photography

We identified georeferenced (Latitude/Longitude) locations of repeat ground photography in the Santa Cruz watershed from the US Geological Survey Desert Laboratory Collection of Repeat Photography [58]. We identified photographic series with coordinates that overlapped mapped xeroriparian or grassland change classes. In addition, we identified and selected photographs located in areas that exhibited no change but depicted desert grassland and/or mesquite cover types. We revisited and rephotographed the sites if the most recent photograph was more than 5 years old. We ultimately rephotographed and qualitatively analyzed vegetation change at 24 camera stations (
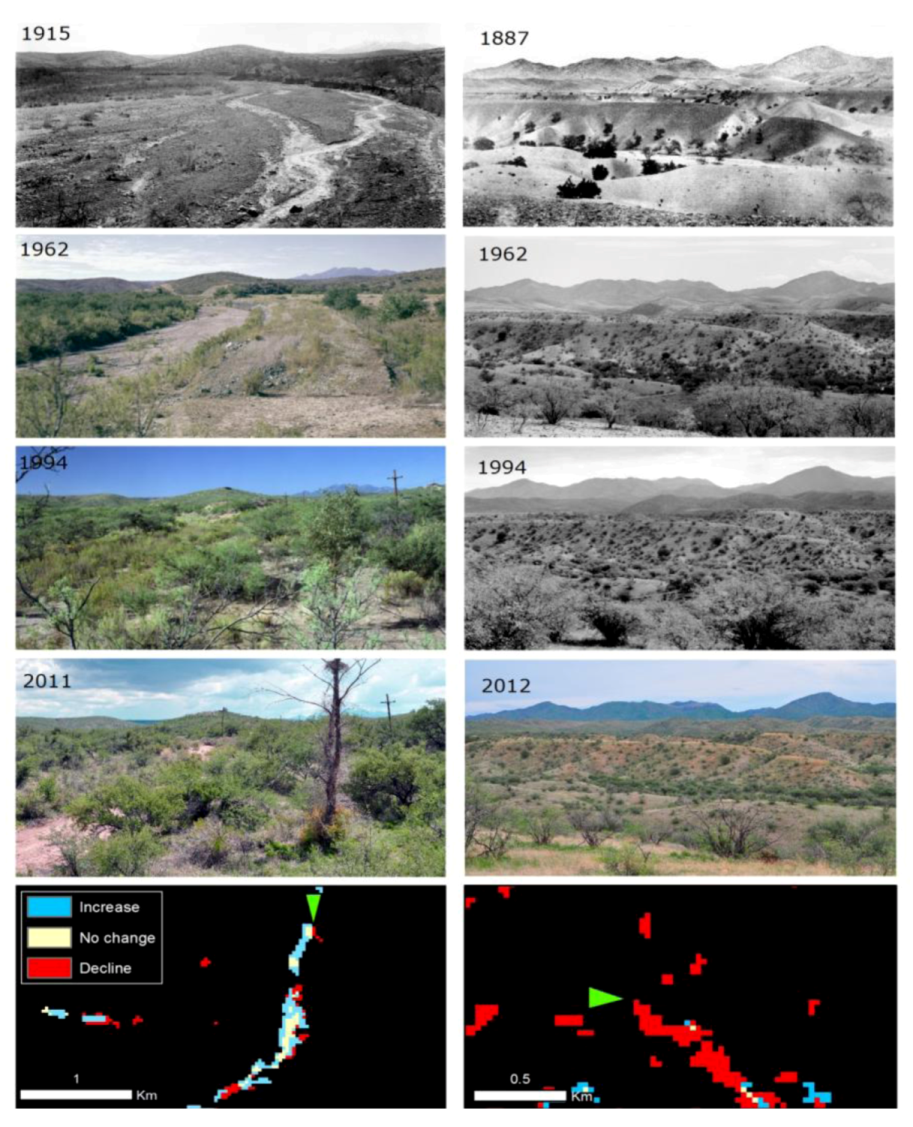
Figure 1). Repeat photographs were taken using both a 4 × 5 film camera with black and white and color film, and a digital SLR. Film negatives were scanned and corrected and the digital files were matched with original photographs using Adobe Photoshop. We assigned change classes to each series of repeat photographs for both long-term historical trends and satellite-era trends (i.e., [59]). Geographic locations and camera direction were overlaid on Landsat-derived change maps and the changes were analyzed according to the landscape area and view angel depicted in the photographs.

1.4.4. Land Ownership and Ecoregion

We analyzed landscape change and photography data within (1) units of land management and ownership, and by (2) ecoregions, that is, biogeographic units that contain similar long-term climate, vegetation assemblages, and landforms. We assembled a binational land-ownership dataset from multiple sources with varying degrees of categorical detail: Arizona State Land Department Public Land Ownership, Santa Cruz County Parcels, Pima County Preserves, Pima County Parcels, Nogales Mexico Carta Urbana (Urban Map), and Integrated Mexican Basic Geo-Statistical Areas (Mexican Census boundaries). Privately-owned parcels from the United States part of the watershed were classified into 3 subgroups based on size: (1) <1.69 ha (Urban: high density urban residential to suburban ranch), (2) 1.7–6.7 ha (Exurban: rural homesteads – guest ranch and lodges), and (3) >6.8 ha (Ranch: low density rural -working ranches). These subgroups were based on Land Use Code zoning information for the City of Tucson, Pima County, and Santa Cruz County. Land in Sonora, Mexico, was divided into two categories: (1) urban (as defined in the Carta Urbana), and (2) rural, from the Mexican Census. The rural-land boundaries roughly delineate large 
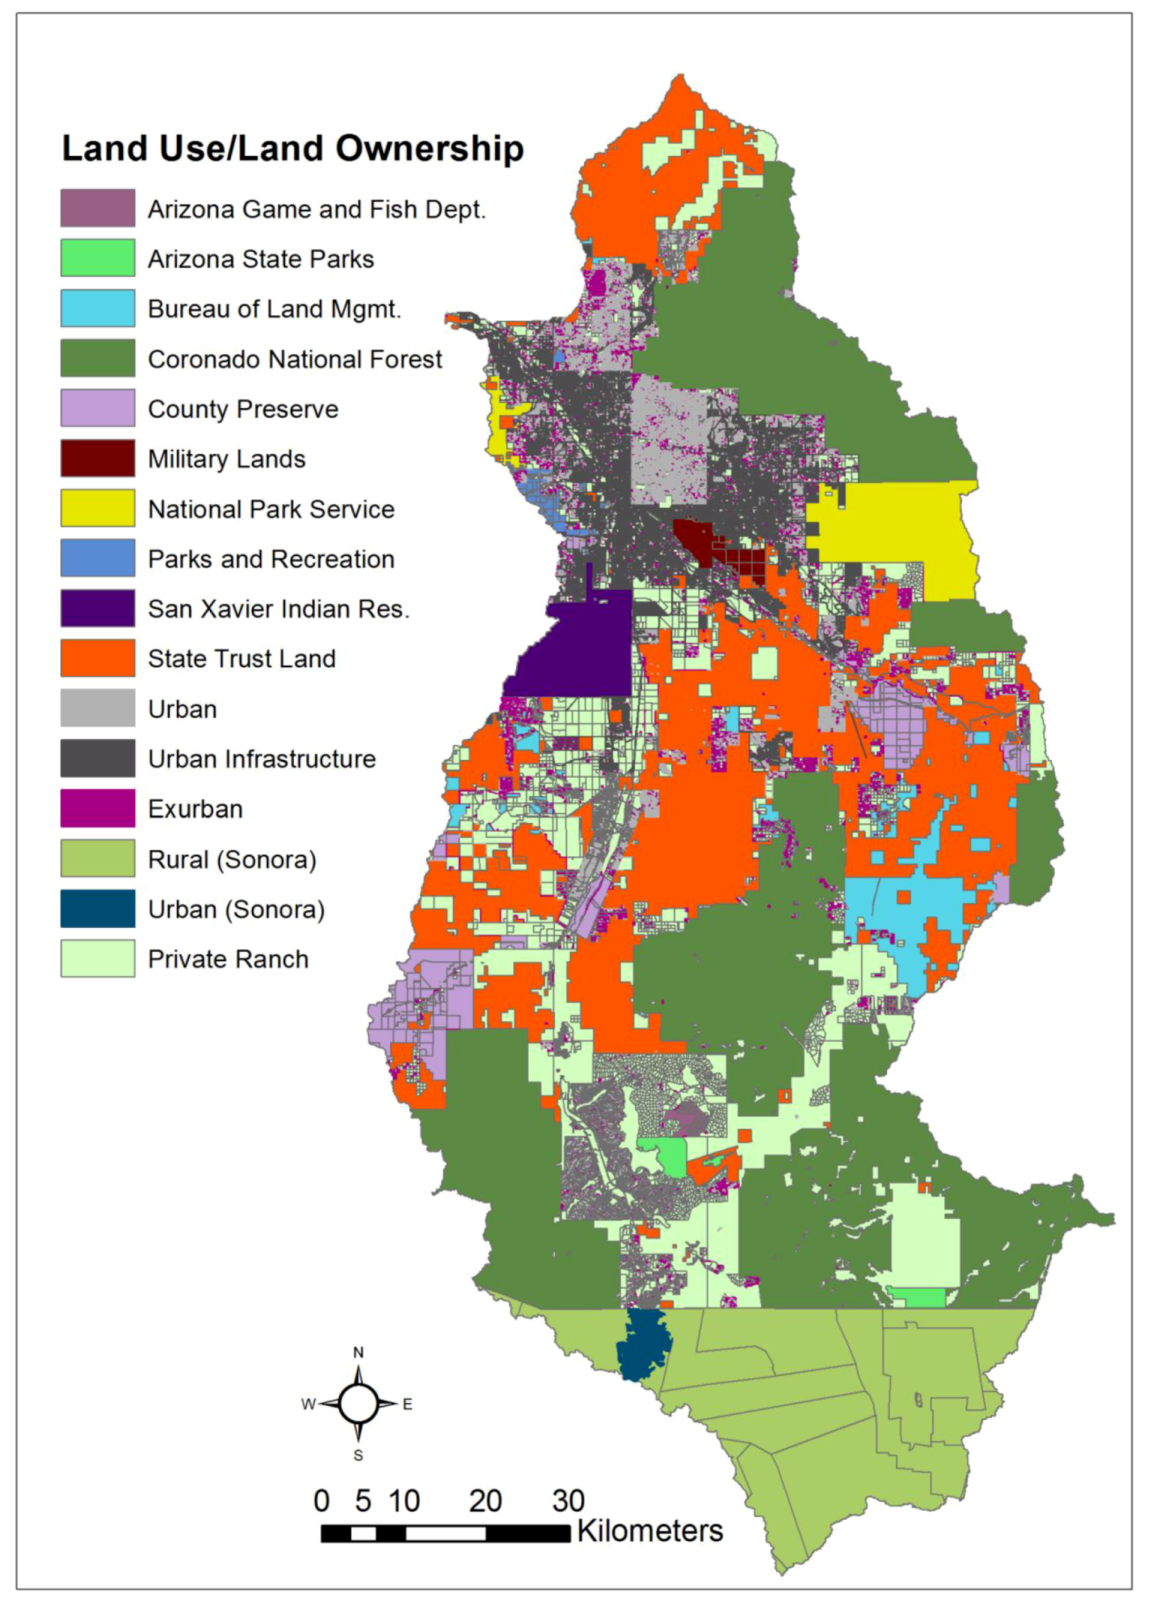
ejidos, or communal lands used for ranching and agriculture. The main ownership types, as well as their descriptions and distributions, are reported in Table 2 and Figure 2.
Table 2. Descriptive statistics of land use/land ownership parcel data.
Land Use/Land OwnershipDescriptionArea (ha)# of unitsMean (ha)
AZ Game and Fish Dept.Managed by Arizona Game and Fish Dept.1,4986722.4
AZ State ParksParklands managed by the State of Arizona.3,8195668.2
Bureau of Land Mgmt.Uses range from ranching to conservation.21,35927665.2
Coronado National ForestManaged by US National Forest Service.190,175466451.9
County PreserveRanches and open space purchased for conservation.24,49544049.1
Exurban1.7–6.7 ha. Uses include rural homesteads and guest ranches.33,88211,7542.9
Military LandsDepartment of Defense lands.4,3515965.9
National Park ServiceManaged by US National Park Service.23,3323507.4
Parks and RecreationParklands managed by Pima and Santa Cruz counties.2,79914218.6
Private Ranch> 6.8 ha. Uses include cattle grazing and agriculture.175,4753,98739.5
Rural (Sonora)Communal ejido lands. Uses include grazing and agriculture.98,714273,655.0
San Xavier Indian Res.Managed by the Tohono O'odham Nation.15,44781,931.0
State Trust LandAZ undeveloped lands auctioned to provide Trust revenue. 175,685641193.6
Urban< 1.7 ha. High density urban to suburban ranch uses.53,946127,7370.4
Urban (Sonora)High density urban lands in and around Nogales, Sonora.3,74914326.2
Urban InfrastructureRoad networks, freeways, airports.32,406163,150.7
Figure 2. Distribution of land management and land-use units over the study area.
Land 02 00194 g002
We masked out land-cover classes that were not subject to change to reduce the likelihood of skewing change values relative to total watershed area and management-unit area. A mask was created from the initial 1979 land-cover map using only classes that had a low likelihood of transitioning to grassland or xeroriparian deciduous forests. These classes include Developed, Open Space; Developed, Low Intensity; Developed, Medium Intensity; Developed, High Intensity; Barren Land (Rock/Sand/Clay); and Evergreen Forest. The mask was overlain to block irrelevant data from analysis, allowing us to calculate a more realistic figure of total area subject to change within each land use/ownership type.
We analyzed long-term measurements from four climate stations that were split between the two ecoregions (Sonoran = Anvil Ranch, Station #0287; Tucson, Station #8820; Madrean = Santa Rita Experimental Range, Station #7593; and Canelo, Station #1231). Average-annual climate for each ecoregion was calculated from the two stations, which were selected to roughly represent the upper- and lower-elevational distribution of the grassland and xeroriparian vegetation classes. Climate variables include monthly mean precipitation (1950–2005), mean monthly temperature (1950–2000), and the average maximum monthly temperature (1950–2000). The non-parametric Mann-Whitney Rank Sum test was used to test for differences in precipitation between ecoregions, and t-tests for temperature variables. Land-cover and repeat-photography data were stratified by ecoregion to analyze and understand the potential influence of climate on observed vegetation changes.

2. Results

2.1. Photographic Evidence of Change, Pre-Land Cover (1887–1978)

Visual evidence from repeat photography documents declining areas of grassland from 1887 to 1978. Sixteen camera stations depict grasslands and, of these, nine images recorded either decline of grass cover or conversion of grassland to savanna through woody plant encroachment. The other seven depicted “stable” grasslands but of these, five were from sites where the earliest photographs were taken during the late 1970s (and discussed in Section 2.5) (Table 3). There were no instances of areas with increasing grass cover between 1887 and 1978. Nine repeat photographs depicted xeroriparian deciduous communities, and seven documented increases in woody species since the earliest dates; at several sites, major increases in woody species occurred after the 1960s. The link between these historical data and contemporary land-cover changes are described in Section 2.5.

2.2. Broad Landscape-Scale Changes, 1979–2009

Analysis of land-cover change indicates that between 1979 and 2009, a total of 69,114 ha of grassland declined, 59,943 ha increased, and 25,983 ha did not change significantly. The total area of increase and no change in grassland exceeded the declines by 16,812 ha. During this same period, xeroriparian deciduous forest declined by 17,746 ha, increased by 6,312 ha, and 2,621 ha did not change significantly. Relative to the amount of area covered in 1979, grasslands increased by 15% in 2009 and xeroriparian deciduous forests decreased by −19.5% (Figure 3). However, these changes were not directional: grassland cover declined slightly from 1979 to 1989 (−0.7 %), had a large increase between 1989 and 1999 (14.5%), and had only a small increase between 1999 and 2009 (3.5%) (Figure 3). Conversely, xeroriparian deciduous forests increased from 1979 to 1989 (4.0%), decreased from 1989 to 1999 (−7.1%), and decreased more from 1999 to 2009 (−13.3%) (Figure 3). A majority of the grassland and xeroriparian changes (both declines and increases) were the result of conversion to or from shrubland, and most of the major changes for both types occurred during the 1989–1999 period (Table 4). Conversion to barren or developed classes contributed only a small amount to the net changes (Table 4.) Our results show that landscape-scale change during the period from 1979 to 2009 were spatially and temporally heterogeneous (Figure 4).
Table 3. Information on repeat photographs, interpreted changes, and relationships to land ownership and satellite-based change detection.
LocationStake #1st DatePhotos (n) Land Use/Land OwnershipVegetationHistorical ∆Recent ∆Mapped ∆*
Santa Cruz16518874Private RanchGrasslandGrass (-)Grass (+)Grass (+)
Nogales16618874Private RanchGrasslandWoody (+)Woody (=)Woody (=)
Nogales16718874Private RanchGrasslandWoody (+)Woody (=)Woody (=)
Helvetia40019094State Trust LandGrasslandWoody (+)Woody (=)Woody (=)
Lopez Exclosure89819774Coronado National ForestGrasslandGrass (=)Grass (=)Grass (=)
Lopez Exclosure89919774PrivateGrasslandGrass (=)Grass (-)Grass (-)
Santa Rita Range325519782Coronado National ForestGrasslandGrass (=)Grass (=)Grass (=)
Santa Rita Range326019782Coronado National ForestGrasslandGrass (=)Grass (=)Grass (=)
Santa Rita Range326119783Coronado National ForestGrasslandGrass (=)Grass (=)Grass (=)
Santa Rita341219553PrivateGrasslandGrass (-)Grass (-)Grass (-)
San Rafael Valley379119323PrivateGrasslandGrass (=)Grass (=)Grass (=)
Lochiel - MEX379319303PrivateGrasslandGrass (-)Grass (=)Grass (=)
Lochiel - USA379319303PrivateGrasslandGrass (=)Grass (=)Grass (=)
Total Wreck Mine358a19093State Trust LandGrasslandWoody (+)(=)(=)
Total Wreck Mine385b19093State Trust LandGrasslandWoody (+)(=)(=)
Total Wreck Mine385c19093State Trust LandGrasslandWoody (+)(=)(=)
Davidson Creek4119154ExurbanXeroriparianWoody (+)Woody (-)Woody (-)
Rosemont Mine4219104Coronado National ForestXeroriparianWoody (+)Woody (-)Woody (=)
Yerba Buena 16518874Private RanchXeroriparianWoody (+)Woody (-)Woody (-)
Tumacacori28318903National Park ServiceXeroriparianWoody (+)Woody (=)Woody (=)
Santa Rita Range325419783Coronado National ForestXeroriparianWoody (=)Woody (+)Woody (+)
San Rafael Valley379119323PrivateXeroriparianWoody (+)Woody (-) Woody (-)
Lochiel 379319303PrivateXeroriparianWoody (+)Woody (-) Woody (-)
Martinez Hill105719124San Xavier Indian Res.Xeroriparian Woody (-)Woody (-) Woody (-)
Cienega Creek341118803County PreserveXeroriparian Woody (+)Woody (=)Woody (=)
Change (∆) symbols: Increase (+), no change (=) and decline (-); *Bold and italicized indicate no agreement between mapped change and photography.
Figure 3. Change in xeroriparian deciduous forest and grassland over time.
Land 02 00194 g003
Table 4. Decadal patterns of major grassland and xeroriparian cover changes in hectares.
Cover Change1979–19891989–19991999–2009
Shrubland to grassland39,43631,60232,582
Grassland to shrubland39,94124,47430,661
Grassland to developed1,657493873
Grassland to barren7243921,029
Net change grassland−2,8866,24319
Shrubland to xeroriparian5,3172,6202,434
Xeroriparian to shrubland4,0593,4942,760
Xeroriparian to developed8101,058800
Xeroriparian to barren241155193
Net change xeroriparian207−2,086−1319

2.3. Broad Changes within Different Land-Use Units

The amount and location of vegetation change during the period from 1979 to 2009 varied by land-use type (Figure 5). The greatest areas of xeroriparian deciduous forest increase occurred on Private Ranches (34.9%), State Trust Lands (25%), Rural Sonora (11.9%), and Bureau of Land Management (BLM) lands (9.7%). Large declines occurred on Private Ranches (34%), State Trust Lands (20.5%), and Rural Sonora (18.3%), suggesting these land-management units have dynamic land-cover changes. Only one land-use type, BLM, had a net gain of xeroriparian deciduous forest. The largest net losses occurred on Private Ranches, Rural Sonora and State Trust Lands. As a percent of the total land area in that land-use type, which describes changes relative to management area, the greatest declines in xeroriparian vegetation occurred on Arizona State Parks (4.7% of land area), State Trust Lands (4.2%), Rural Sonora (4.1%), and San Xavier Indian Reservation (4.1%) (Figure 5). Cover of xeroriparian deciduous forest increased on 2.5% of total BLM land area and 1.4% of Rural Sonora land area.
Figure 4. Maps depicting the location of vegetation change from 1979 to 2009.
Land 02 00194 g004
Figure 5. Xeroriparian deciduous forests change as a percent of change within each change category (left) and percent of total area within each land use type (right).
Land 02 00194 g005
As a percent of each change category, large grassland increases occurred on Private Ranches (28.2%), Rural Sonora (24%), and Coronado National Forest (22%) with major declines occurring on Private Ranches (22%), Rural Sonora (20.7%), State Trust Lands (19.8%) and Coronado National Forest (17.3%)(Figure 6). State Trust Lands had the greatest overall net loss of grasslands, followed by County Preserves and Exurban. Net increases occurred on BLM, Private Ranch and Coronado National Forest. As a percent of the total area within each land use type, BLM lands had the greatest increase in grassland area (25%). Rural Sonora had larger increases (18%) than private ranches in the US (10.4%), as well as larger declines (19% and 9.6% respectively), but private ranch lands had a small net gain (1%) and rural Sonora a small net loss (1%). Arizona State Parks and Coronado National Forest had small net gains in grassland area. AZGFD, County Preserve, Military Lands, National Park Service (NPS), San Xavier Indian Reservation and Urban (all categories) had declining grasslands (Figure 6).
Figure 6. Grassland change as a percent of change within each change category (left) and percent of total area within each land use type (right).
Land 02 00194 g006

2.4. Change within Ecoregions, 1979–2009

The climatic variables showed differences among ecoregions that could help to explain changes in land cover. Differences in mean-annual precipitation were statistically significant (t (55) = 1797, p ≤ 0.001) for the Sonoran (278 mm) and Madrean (470.5 mm). Maximum annual precipitation was recorded in 1983, with 573 mm for the Sonoran and 793 mm for the Madrean. Minimum was recorded in 1953, with 132 mm in the Sonoran and 194 mm in the Madrean. Figure 7, fitted with cubic polynomial trendlines, shows the broad climatic trend for the two ecoregions for mean and maximum temperatures (1950–2000) and mean-annual precipitation (1950–2005). Both regions follow a general pattern which proceeds from high temperatures and drought in the 1950s to a cool and wet ENSO period from 1978 to 1994, which ends with warming and drought conditions starting in the mid-1990s (Figure 7). While both ecoregions follow a general pattern, differences in mean-annual temperature was significant (t = 29.42, p ≤ 0.001) for the Sonoran (σ = 19.71 °C) and Madrean (16.09 °C), as was mean annual maximum temperature (Sonoran median = 28.4 °C and Madrean median = 24 °C; t (51) = 1326, p ≤ 0.001), indicating that the Sonoran region experienced considerably higher mean and maximum temperatures and lower precipitation during this period. Mean-annual maximum temperature was less variable over time in the Madrean when compared to the Sonoran ecoregion (Figure 7).
Figure 7. Annual average mean and maximum temperature and precipitation data for Sonoran and Madrean ecoregions.
Land 02 00194 g007
Most of the grassland (88%) and deciduous forest change (58%) occurred in the Madrean ecoregions (Table 4); these figures are not surprising given that 60% of the watershed is in this ecoregion. However, as a percentage of area with change potential in each ecoregion, grassland declines in the Sonoran (84.2%) were over twice those in the Madrean (39.0%) (Table 4). Grassland increases were almost three times greater in the Madrean (41.7%) than in the Sonoran (14.3%). Only 1.5% of Sonoran grassland remained unchanged, compared to 19.3% of Madrean (Table 5). The amount of xeroriparian deciduous forest increase was slightly higher in the Madrean and the decline was higher in the Sonoran (Table 5).
Table 5. Distribution of vegetation changes as (1) a proportion of the greater watershed and (2) specific changes within each ecoregion.
VegetationTotal Change within Each Ecoregion (%)Ecoregion Specific
% Decline % No Change% Increase
Sonoran deciduous forest42.270.911.118.0
Madrean deciduous forest57.867.610.122.4
Sonoran grassland12.284.21.514.3
Madrean grassland 87.839.019.341.7
Grasslands declined across all land-ownership categories in the Sonoran, with most of the decline occurring on State Trust Lands (Table 6). In the Madrean ecoregion, virtually no net gain or loss occurred on State Trust Lands; the total amount of State Trust Lands with grassland is slightly higher in the Madrean (12,139 ha) than Sonoran (9,686 ha), which implicates the effects of climate (higher temperature and lower precipitation) on the large losses in the Sonoran. Grassland declines in exurban and urban areas were likely due to conversion through land development, although climate could still have been a factor (Table 4). In the Madrean parts of the watershed, grassland increased on Private Ranches, CNF, and BLM. (Table 6).
Table 6. Land use/land ownership and changes in grassland area by ecoregion.
Land Use/Land OwnershipMadrean Grassland (ha)Sonoran Grassland (ha)
DeclineNo ChangeIncreaseDeclineNo ChangeIncrease
Arizona Game and Fish Dept.55114NANANA
Arizona State Parks240951281100
Bureau of Land Mgmt.3447213849851301
Coronado National Forest997635571170919601
County Preserve242626313616120106
Exurban125080580746251
National Park Service15903733501
Parks and RecreationNANANA1701
Private Ranch11531569314963277365648
Rural (Sonora)134731066313032NANANA
San Xavier Indian Res.NANANA805112
State Trust Land54551170551378421981647
Urban91935404848122
Urban (Sonora)661684NANANA
Urban InfrastructureNANANA497130

2.5. Photographic Evidence of Change during the Land-Cover Period

We use 12 illustrations of coupled repeat photography and land-cover change data to show the spatial and temporal complexity of vegetation changes over the landscape (Figure 8, Figure 9, Figure 10, Figure 11, Figure 12, Figure 13). These illustrations and the data in Table 3 suggest that many of the historical trends that predate the changes observed with satellite data have ceased. For example, Figure 8 shows two Madrean xeroriparian areas, one 60 km north of the other. Both of the sites show increasing woody xeroriparian vegetation from the earliest date to the photographs in 1994, but the most recent photographs from 2011 and 2012 show mesquite and cottonwood mortality both on the stream banks and in the upland areas (Figure 8). The land-cover declines (red pixels) apparent in Figure 8 appear to result from the local mortality of cottonwood and mesquite.
Figure 8. Repeat photographs and land-cover change maps with the locations and orientation of the cameras (arrow). Left: Stake 41, Davidson Creek (31.90143, −110.66256). The xeroriparian vegetation increased since 1915, with a pronounced growth of woody plants by 1994. In 2011, some of the foreground and terrace mesquite are dead as is the cottonwood in the foreground. Right: Stake 165 Yerba Buena Ranch (31.38396, −110.84806). The xeroriparian area at the valley bottom showed an increase in woody plants from 1887 to 1962 and has exhibited no change since. Since 1994 the mesquite shrubs in the foreground have significant signs of mortality and branch die-back.
Land 02 00194 g008
Figure 9. Repeat photographs and land-cover change maps with the locations and orientation of the cameras (arrow). Left: Stake 3411, Cienega Creek Natural Preserve (31.99578, −110.59408). This area was a wetland in 1880, but groundwater drawdown and likely influenced the change to a riparian forest. The area is now a county preserve and has seen very little change since 1998. Right: Stake 1057, Martinez Hill (32.10444, −110.98778). The view looking south over the Santa Cruz River shows the decline of the mesquite forest after 1912 caused by channel erosion. Signs of upland vegetation loss are apparent in the 1989 photograph, likely due to urban and agricultural groundwater uses.
Land 02 00194 g009
Figure 10. Repeat photographs and land-cover change maps with the locations and orientation of the cameras (arrow). Left: Stake 3412, Santa Rita Mountains from Sonoita Hwy (31.76254, −110.67903). Woody plants invaded the grassland between 1955 and 1998. Right: Stake 899, Forest Service grazing exclosure (31.70111, −110.67444). This area is at a junction of a Forest Service experimental exclosure, grazed Forest Service land and private ranch land, and the change map correctly identified some differences associated with the geometry of land management units.
Land 02 00194 g010
Figure 11. Repeat photographs and land-cover change maps with the locations and orientation of the cameras (arrow). Left: Stake 3791, San Rafael Valley/Santa Cruz headwaters (31.44358, −110.59099). Grasslands appear stable, with some change from annual dominated to perennial grasses between 2001 and 2011. Several riparian trees in the background died during the same period. Right: Stake 3793, Santa Cruz headwaters at the USA/Mexico border (31.33307, −110.59873). Grasslands are generally stable. Riparian trees have died in the near side channel.
Land 02 00194 g011
Figure 12. Repeat photographs and land-cover change maps with the locations and orientation of the cameras (arrow). Left: Stake 3254, Santa Rita Range (31.93915, −110.94623). Increases in deciduous tree cover can be seen behind the foreground shrubs, first visible in 2006. The Santa Cruz River floodplain in this area is a mixture of orchard and mesquite bosque; the red patches likely occur where orchard replaced riparian and the blue occur along the river terrace and in feeder washes. Right: Stake 3261, Santa Rita Range (31.84657, −110.80222). No major change occurred in this area during the period.
Land 02 00194 g012
Figure 13. Repeat photographs and land-cover change maps with the locations and orientation of the cameras (arrow). Left: Stake 166, Proto Ridge/Nogales (31.37028, −110.88444). Considerable woody plant encroachment into the grasslands occurred between 1887 and 1962. This change continued into 2012, with much of the mesquite growth occurring at the toe slopes which was correctly identified in the change data. Right: Stake 385, Total Wreck Mine/Empire Mountains (31.8975, −110.59222). The number of woody plants increased from 1909 to 1968 in this disturbed area, following the decline of mining-related land uses, with very little change in cover since 1968.
Land 02 00194 g013
Repeat photography and land-cover data illustrate the complexity of change related to land uses. Figure 9 shows two xeroriparian areas separated longitudinally by 38 km: Cienega Creek Natural Preserve (left) is in the Madrean ecoregion and managed as a county preserve, and Martinez Hill (right) depicts a landscape that crosses the San Xavier District of the Tohono O’odham Nation and private lands in the Sonoran ecoregion. The land-cover data and the repeat photography data show the extent of the spatial and temporal heterogeneity of landscape change over this short distance with absolute decline and degradation of the xeroriparian vegetation south of Martinez Hill since 1912, and complete development and maintenance of the Cienega Creek riparian area since 1880. Webb et al. (in press) attribute the declines south of Martinez Hill to excessive groundwater extraction [60].
Heterogeneous and bold landscape patterns related to national and international land management are often better distinguished in grassland ecosystems (Figure 10, Figure 11). Some changes are subtle background changes that were not in the subject of the initial photographs (Figure 12), and some areas showed little to no change in either the photographs or the land-cover data (Figure 13). Recent historical photographs did on all but one occasion corroborate recent landscape changes observed in the land-cover data (Table 3), suggesting that recent trends mapped using change-detection techniques are spatially and ecologically accurate.

2.6. Discussion

The historical photography used in this research confirms major 20th century vegetation changes documented in other research [5,7,9,10]. Woody plant encroachment, desertification (loss of biomass and ground cover) of grasslands, and changing riparian and xeroriparian woody vegetation occurred in both ecoregions following human settlement. Since the turn of the century, vegetation changes appear to be more subtle and some of the past trajectories appear to be reversing; most notable are recent mesquite declines in xeroriparian and upland areas, and changes from shrubland to grassland area in the Madrean ecoregion. The decadal cover changes identified with land cover data were temporally variable, reflecting broad climate changes during the period from 1979 to 2009. The most dynamic cover changes occurred during the period from 1989 to 1999, a period with two intense droughts (1989–1990 and 1995–1996). In the Santa Cruz Watershed, the degree of vegetation change driven by climate was related to topographic setting: vegetation declines were greater per unit area in the lower elevation Sonoran ecoregion where temperatures are higher and precipitation lower than in the Madrean. Fine-scale changes occurring within these broad climate patterns were likely the result of land use practices: declines were highest on state lands (grazing) and increases highest on private ranches and some federal lands (active mesquite removal and watershed restoration).
The most striking change seen in recent historical photography and, to some degree, in land-cover data is the decline and mortality of mesquite in both xeroriparian areas and in uplands (see Figure 8). Mesquite’s domination of southwestern grasslands and the resurgence of riparian vegetation cover coincided with a period in the climate record of the Southwest from the late 1970s to early 1990s with above-average (and cool-season dominated) precipitation and cooler temperatures than the rest of the record (Figure 7). Mesquite, a native species that inhabits both upland and riparian areas, is often believed to be an indomitable range invader that can withstand drought due to its fast growth and extremely long taproots; but despite this adaptation, there are notable instances of large-scale mesquite mortality during droughts [61]. Climate conditions contributed in part to the success of woody species during the period from 1970s, however, the drought beginning in the 1990s, combined with higher mean and maximum temperatures, may have ultimately favored grasses with the C4 photosynthetic pathway that successfully photosynthesize in high temperature environments and are adapted to exploit intermittent warm season precipitation. The recent decline of grasslands in the Sonoran ecoregion and the increase in grassland of the Madrean ecoregion suggests that more extreme climate conditions like those of the Sonoran ecoregion may limit grassland productivity. It is conceivable, given some climate predictions [62], that a warming southwest may soon face increased mortality of woody riparian and upland plants at lower elevations, and accelerated invasion of grassland communities by woody plants at higher elevations.
In addition to broad climate drivers, land-use practices influenced the fine-scale pattern of vegetation changes over the past 30 years. Grassland changes suggests a balance over time on both managed private ranches in Arizona and Sonora, which may result from conservation practices that include rotational grazing, fire management, and woody plant removal. Some grassland increases observed with satellite data are likely related to the successful establishment and spread of non-native grasses like Lehmann lovegrass (Eragrostis lehmanniana); Lovegrass invasions can negatively alter native grasslands by reducing diversity and through changes to hydrological and fire cycles [63,64]. However, given the possible alternative outcomes (i.e., state changes from grassland to savannas, desertification) non-native grass proliferation is a potentially better outcome for a formerly native grassland ecosystem and dependent organisms [65].
The most notable vegetation changes were on unmanaged State Trust Lands, with large grassland declines and no equivalent increases; these changes are likely due to a combination of land-use practices, such as urban development and overgrazing. Sales of State Trust Lands provide revenue to fund education for the state of Arizona. The Arizona State Land Department, who manages State Trust Lands, receives no state or federal funding to implement management practices that might improve the land (including prescribed fire, stream restoration and treatment of invasive plants). Therefore if any management occurs on State Trust Lands, it is at the expense of the grazing lessee, who is unlikely to invest in conservation, restoration, and management of lands slated for eventual sale by the state.
There are some exceptions where conservation of State Trust Lands is a priority, which was apparent in the land-cover change data. For instance, increases in grassland area on State Trust Lands occurred on lands surrounding BLM’s Las Cienegas National Conservation Area in the Madrean ecoregion. State Trust Lands in this area are managed under the Sonoita Valley Planning Partnership, an association of government agencies and other groups interested in preserving the natural resources of the valley. Another example where grassland area increased is in the Sonoran portion of the basin and is part of the Sopori Ranch (Upper Santa Cruz and Southern Altar Valley Reserve). Parts of the Sopori ranch were purchased for conservation in 2009 by county bonds as part of the Sonoran Desert Conservation Plan and the remainder of the historic ranch includes lease lands on State Trust Lands, BLM, and Forest Service lands. Prior to sale, the Sopori Ranch was managed with the use of irrigated pastures that reduced grazing pressure on native vegetation during the early growing season, which explains why this Sonoran grassland area stands out in the land-cover change maps. This same area showed an increase in deciduous forest during the time period, contributing to the increase on both county preserve and private ranch lands in the Sonoran ecoregion.
Our data reveal that the largest positive changes in both grasslands and xeroriparian forests in the watershed, on a unit area basis, were on BLM lands, primarily in areas designated as National Conservation Areas, and on private ranch lands. As stated above, Las Cienegas National Conservation Area is the center of a regional effort to restore grasslands and bottomland riparian areas [66]. Beginning in 2006, the BLM actively removed mesquite from ~500 ha of grasslands in an effort to restore pronghorn habitat and have both passively and actively improved the ciénegas and riparian areas by reducing livestock grazing in the uplands and establishing erosion control structures in the riparian areas. Restoration of ephemeral streams using check dams and other methods have been employed on both private and public lands in both the USA and Mexico, with positive impacts on flow, vegetation, and wildlife [67,68].
Identifying the cause of recent xeroriparian decline in the watershed is difficult, the changes observed from satellite imagery are largely due to: (1) continued erosion and aggrading of stream channels during floods, (2) vegetation dieback due to warming temperatures and lower precipitation that reduced the transient soil moisture in wash environments, or (3) a self-regulation of dense populations as observed in other studies of upland mesquite change [69]. In all likelihood it is a combination of all of the above, and the data from Rural Sonora (greatest net loss of xeroriparian) suggest that land use (i.e., heavy livestock grazing) might still be contributing to erosion and streamside vegetation loss during extreme precipitation events. Villarreal et al. documented historical patterns of conversion from mesquite bosque to agricultural and urban land uses along the Santa Cruz River between 1936 and 2006, as well as the rapid rate of bosque regrowth when floodplain agriculture is abandoned [70]. However, the land-cover data used this paper indicate the loss of xeroriparian vegetation to urban development was small (Table 4), and most of the declines were conversion to shrubland that occurred during the 1989–2009 drought period. It is also clear from many of the repeat photographs that in the United States the observed decline is often related to large floods, drought-induced mortality and branch die-back of woody species, wildfire and freezes.

3. Conclusions

Private ranch owners and public land managers have initiated restoration based on past science documenting long-term vegetation changes in the southwest. Much of the documented research predicted scenarios where unmanaged rangelands experienced nonlinear, threshold-type changes to a point potentially beyond recovery. When considering vegetation changes over the greater watershed and over areas with different land-uses there are several instances where land stewardship and restoration have produced ecosystems that appear more resilient to recent drought than neighboring, un-managed ecosystems. Variable climate and heterogeneous land use patterns appear to have fostered multiple states of savannah and grassland ecosystems across the landscape and across time periods. Our data suggest that the recent drought and warming may have favored upper elevation grassland communities and contributed to landscape-scale decline of woody xeroriparian vegetation and some upland woody species. It is feasible that land managers in the area can use best management practices and restoration to encourage more resilient ecosystems, and potentially steer or nudge the ecological outcomes of climate change and drought.

Acknowledgments

This research was supported by a Mendenhall Fellowship through the USGS Land Change Science and Land Remote Sensing Programs. We would like to thank Diane Boyer and Helen Raichle for their help locating, scanning, and matching archived photographs. We thank Benjamin Sleeter and three anonymous reviewers for their thoughtful reviews of this manuscript.

Conflict of Interest

The authors declare no conflict of interest.

References

  1. Turner, B.L.; Lambin, E.F.; Reenberg, A. The emergence of land change science for global environmental change and sustainability. Proc. Natl. Acad. Sci. USA 2007, 104, 20666–20671. [Google Scholar] [CrossRef]
  2. Stafford Smith, D.M.; McKeon, G.M.; Watson, I.W.; Henry, B.K.; Stone, G.S.; Hall, W.B.; Howden, S.M. Learning from episodes of degradation and recovery in variable Australian rangelands. Proc. Natl. Acad. Sci. USA 2007, 104, 20690–20695. [Google Scholar] [Green Version]
  3. Reynolds, J.F.; Smith, D.M.S.; Lambin, E.F.; Turner, B.L.; Mortimore, M.; Batterbury, S.P.J.; Downing, T.E.; Dowlatabadi, H.; Fernández, R.J.; Herrick, J.E.; et al. Global desertification: Building a science for dryland development. Science 2007, 316, 847–851. [Google Scholar]
  4. Bahre, C.J.; Bradbury, D.E. Vegetation change along the arizona-sonora boundary. An. Assoc. Am. Geogr. 1978, 68, 145–165. [Google Scholar] [CrossRef]
  5. Bahre, C.J. A Legacy of Change: Historic Human Impact on Vegetation in the Arizona Borderlands; University of Arizona Press: Tucson, AZ, USA, 1991. [Google Scholar]
  6. Swetnam, T.W.; Allen, C.D.; Betancourt, J.L. Applied historical ecology: Using the past to manage for the future. Ecol. Appl. 1999, 9, 1189–1206. [Google Scholar] [CrossRef]
  7. Turner, R.M.; Webb, R.H.; Bowers, J.E.; Hastings, J.R. The Changing Mile Revisited: An Ecological Study of Vegetation Change with Time in the Lower Mile of an Arid and Semiarid Region; University of Arizona Press: Tucson, AZ, USA, 2003. [Google Scholar]
  8. Bahre, C.J.; Shelton, M.L. Historic vegetation change, mesquite increases, and climate in southeastern Arizona. J. Biogeogr. 1993, 20, 489–504. [Google Scholar] [CrossRef]
  9. Archer, S. Tree-grass dynamics in a Prosopis-thornscrub savanna parkland: Reconstructing the past and predicting the future. Ecoscience 1995, 2, 83–99. [Google Scholar]
  10. Webb, R.H.; Leake, S.A.; Turner, R.M. The Ribbon of Green: Change in Riparian Vegetation in the Southwestern United States; University of Arizona Press: Tucson, AZ, USA, 2007. [Google Scholar]
  11. Poff, B.; Koestner, K.A.; Neary, D.G.; Henderson, V. Threats to riparian ecosystems in Western North America: An analysis of existing literature1. J. Am. Water Resour. Assoc. 2011, 47, 1241–1254. [Google Scholar] [CrossRef]
  12. Wilcox, B.P.; Thurow, T.L. Emerging issues in rangeland ecohydrology: Vegetation change and the water cycle. Rangel. Ecol. Manag. 2006, 59, 220–224. [Google Scholar] [CrossRef]
  13. Polyakov, V.O.; Nearing, M.A.; Stone, J.J.; Hamerlynck, E.P.; Nichols, M.H.; Holifield Collins, C.D.; Scott, R.L. Runoff and erosional responses to a drought-induced shift in a desert grassland community composition. J. Geophys. Res. 2010, 115, G04027. [Google Scholar] [CrossRef]
  14. Wilcox, B.P.; Turnbull, L.; Young, M.H.; Williams, C.J.; Ravi, S.; Seyfried, M.S.; Bowling, D.R.; Scott, R.L.; Germino, M.J.; Caldwell, T.G.; et al. Invasion of shrublands by exotic grasses: Ecohydrological consequences in cold versus warm deserts. Ecohydrology 2011, 5, 160–173. [Google Scholar]
  15. McClaran, M.P.; van Devender, T.R. The Desert Grassland; The University of Arizona Press: Tucson, AZ, USA, 1995. [Google Scholar]
  16. McPherson, G.R. Ecology and Management of North American Savannas; The University of Arizona Press: Tucson, AZ, USA, 1997. [Google Scholar]
  17. Wilson, T.B.; Thompson, T.L. Soil nutrient distributions of mesquite-dominated desert grasslands: Changes in time and space. Geoderma 2005, 126, 301–315. [Google Scholar] [CrossRef]
  18. Havstad, K.M.; James, D. Prescribed burning to affect a state transition in a shrub-encroached desert grassland. J. Arid Environ. 2010, 74, 1324–1328. [Google Scholar] [CrossRef]
  19. Brown, J.R.; Archer, S. Woody plant seed dispersal and gap formation in a North American subtropical savanna woodland: The role of domestic herbivores. Vegetatio 1988, 73, 73–80. [Google Scholar] [CrossRef]
  20. Brown, J.H.; Valone, T.J.; Curtin, C.G. Reorganization of an arid ecosystem in response to recent climate change. Proc. Natl. Acad. Sci. USA 1997, 94, 9729–9733. [Google Scholar] [CrossRef]
  21. Naiman, R.J.; Decamps, H.; McClain, M.E. Riparia: Ecology, Conservation, and Management of Streamside Communities; Elsevier Acadmeic Press: San Diego, CA, USA, 2005. [Google Scholar]
  22. Norman, L.M.; Villarreal, M.L.; Lara-Valencia, F.; Yuan, Y.; Nie, W.; Wilson, S.; Amaya, G.; Sleeter, R. Mapping socio-environmentally vulnerable populations access and exposure to ecosystem services at the US-Mexico borderlands. Appl. Geogr. 2012, 34, 413–424. [Google Scholar] [CrossRef]
  23. Poff, N.L.; Allan, J.D.; Bain, M.B.; Karr, J.R.; Prestegaard, K.L.; Richter, B.D.; Sparks, R.E.; Stromberg, J.C. The natural flow regime. BioScience 1997, 47, 769–784. [Google Scholar] [CrossRef]
  24. Belsky, A.J.; Matzke, A.; Uselman, S. Survey of livestock influences on stream and riparian ecosystems in the western United States. J. Soil Water Conserv. 1999, 54, 419–431. [Google Scholar]
  25. Sheridan, T.E. Cows, condos, and the contested commons: The political ecology of ranching on the Arizona-Sonora Borderlands. Hum. Organ. 2001, 60, 141–152. [Google Scholar]
  26. Curtin, C.G.; Sayre, N.F.; Lane, B.D. Transformations of the Chihuahuan Borderlands: Grazing, fragmentation, and biodiversity conservation in desert grasslands. Environ. Sci. Policy 2002, 5, 55–68. [Google Scholar] [CrossRef]
  27. Sayre, N.; deBuys, W.; Bestelmeyer, B.; Havstad, K. “The Range Problem” after a century of rangeland science: New research themes for altered landscapes. Rangel. Ecol. Manag. 2012. [Google Scholar] [CrossRef]
  28. Martin, S.C.; Severson, K.E. Vegetation response to the Santa Rita grazing system. J. Range Manag. 1988, 41, 291–295. [Google Scholar] [CrossRef]
  29. Geiger, E.L.; McPherson, G.R. Response of semi-desert grasslands invaded by non-native grasses to altered disturbance regimes. J. Biogeogr. 2005, 32, 895–902. [Google Scholar] [CrossRef]
  30. Briske, D.D.; Derner, J.D.; Brown, J.R.; Fuhlendorf, S.D.; Teague, W.R.; Havstad, K.M.; Gillen, R.L.; Ash, A.J.; Willms, W.D. Rotational grazing on rangelands: Reconciliation of perception and experimental evidence. Rangel. Ecol. Manag. 2008, 61, 3–17. [Google Scholar] [CrossRef]
  31. Peters, D.P.C.; Bestelmeyer, B.T.; Herrick, J.E.; Fredrickson, E.L.; Monger, H.C.; Havstad, K.M. Disentangling complex landscapes: New insights into arid and semiarid system dynamics. BioScience 2006, 56, 491–501. [Google Scholar] [CrossRef]
  32. Bestelmeyer, B.T.; Goolsby, D.P.; Archer, S.R. Spatial perspectives in state-and-transition models: A missing link to land management? J. Appl. Ecol. 2011, 48, 746–757. [Google Scholar] [CrossRef]
  33. Okin, G.S.; Parsons, A.J.; Wainwright, J.; Herrick, J.E.; Bestelmeyer, B.T.; Peters, D.C.; Fredrickson, E.L. Do changes in connectivity explain desertification? BioScience 2009, 59, 237–244. [Google Scholar] [CrossRef]
  34. Hart, R.H.; Laycock, W.A. Repeat photography on range and forest lands in the western United States. J. Range Manag. 1996, 49, 60–67. [Google Scholar] [CrossRef]
  35. Webb, R.H.; Boyer, D.E.; Turner, R.M. Repeat Photography: Methods and Applications in the Natural Sciences; Island Press: Washington, DC, USA, 2010. [Google Scholar]
  36. Vankat, J.L.; Major, J. Vegetation changes in sequoia national park, California. J. Biogeogr. 1978, 5, 377–402. [Google Scholar] [CrossRef]
  37. Webb, R.H.; Steiger, J.W.; Newman, E.B. The Effects of Disturbance on Desert Vegetation in Death Valley National Monument, California; US Geological Survey Bulletin 1793; US Government Printing Office: Washington, DC, USA, 1988; p. 103. [Google Scholar]
  38. Bowers, J.E.; Webb, R.H.; Rondeau, R.J. Longevity, recruitment and mortality of desert plants in Grand Canyon, Arizona, USA. J. Veg. Sci. 1995, 6, 551–564. [Google Scholar] [CrossRef]
  39. Clay, G.R.; Marsh, S.E. Monitoring forest transitions using scanned ground photographs as a primary data source. Photogramm. Eng. Remote Sensing 2001, 67, 319–330. [Google Scholar]
  40. Manier, D.J.; Laven, R.D. Changes in landscape patterns associated with the persistence of aspen (Populus tremuloides Michx.) on the western slope of the Rocky Mountains, Colorado. For. Ecol. Manag. 2002, 167, 263–284. [Google Scholar] [CrossRef]
  41. Hoffman, T.M.; Todd, S.W. Using Fixed Point Photography, Field Surveys, and GIS to Monitor Environmental Change: An Example from Riemvasmaak, South Africa. In Repeat Photography: Methods and Applications in the Natural Sciences; University of Arizona Press: Tucson, AZ, USA, 2010; pp. 46–56. [Google Scholar]
  42. McClaran, M.P.; Browning, D.M.; Huang, C.-Y. Temporal Dynamics and Spatial Variability in Desert Grassland Vegetation. In Repeat Photography: Methods and Applications in the Natural Sciences; University of Arizona Press: Tucson, AZ, USA, 2010; pp. 145–166. [Google Scholar]
  43. Clark, P.E.; Hardegree, S.P. Quantifying vegetation change by point sampling landscape photography time series. Rangel. Ecol. Manag. 2005, 58, 588–597. [Google Scholar] [CrossRef]
  44. Tape, K.; Sturm, M.; Racine, C. The evidence for shrub expansion in Northern Alaska and the Pan-Arctic. Glob. Chang. Biol. 2006, 12, 686–702. [Google Scholar] [CrossRef]
  45. Bullock, S.H.; Turner, R.M. Plant Population Fluxes in the Sonoran Desert shown by Repeat Photography. In Repeat Photography: Methods and Applications in the Natural Sciences; University of Arizona Press: Tucson, AZ, USA, 2010; pp. 119–132. [Google Scholar]
  46. Kull, C.A. Historical landscape repeat photography as a tool for land use change research. Nor. Geogr. Tidsskr. Nor. J. Geogr. 2005, 59, 253–268. [Google Scholar] [CrossRef]
  47. De Mûelenaere, S.; Frankl, A.; Haile, M.; Poesen, J.; Deckers, J.; Munro, N.; Veraverbeke, S.; Nyssen, J. Historical landscape photographs for calibration of Landsat land use/cover in the northern Ethiopian Highlands. Land Degrad. Develop. 2012. [Google Scholar] [CrossRef] [Green Version]
  48. Omernik, J.M. Ecoregions of the conterminous United States. An. Assoc. Am. Geogr. 1987, 77, 118–125. [Google Scholar] [CrossRef]
  49. Villarreal, M.L.; Norman, L.M.; Wallace, C.; van Riper, C., III. A Multitemporal (1979–2009) Land-use/Land-cover Dataset of the Binational Santa Cruz Watershed; US Geological Survey Open-File Report 2011-1131; US Government Printing Office: Washington, DC, USA, 2011; p. 26. [Google Scholar]
  50. Homer, C.; Huang, C.; Yang, L.; Wylie, B.; Coan, M. Development of a 2001 national landcover database for the United States. Photogramm. Eng. Remote Sensing 2004, 70, 829–840. [Google Scholar]
  51. Chavez, P.S. Image-based atmospheric corrections—Revisited and improved. Photogramm. Eng. Remote Sensing 1996, 62, 1025–1036. [Google Scholar]
  52. Collins, J.B.; Woodcock, C.E. An assessment of several linear change detection techniques for mapping forest mortality using multitemporal Landsat TM data. Remote Sens. Environ. 1996, 56, 66–77. [Google Scholar] [CrossRef]
  53. Lawrence, R.L.; Wright, A. Rule-based classification systems using classification and regression tree (CART) analysis. Photogramm. Eng. Remote Sensing 2001, 67, 1137–1142. [Google Scholar]
  54. Mas, J.-F. Monitoring land-cover changes: A comparison of change detection techniques. Int. J. Remote Sens. 1999, 20, 139–152. [Google Scholar] [CrossRef]
  55. Coppin, P.; Jonckheere, I.; Nackaerts, K.; Muys, B.; Lambin, E. Digital change detection methods in ecosystem monitoring: A review. Int. J. Remote Sens. 2004, 25, 1565–1596. [Google Scholar] [CrossRef]
  56. Lu, D.S.; Mausel, P.; Brondizio, E.; Moran, E. Relationships between forest stand parameters and Landsat TM spectral responses in the Brazilian Amazon Basin. For. Ecol. Manag. 2004, 198, 149–167. [Google Scholar] [CrossRef]
  57. Gillanders, S.N.; Coops, N.C.; Wulder, M.A.; Gergel, S.E.; Nelson, T. Multitemporal remote sensing of landscape dynamics and pattern change: Describing natural and anthropogenic trends. Prog. Phys. Geogr. 2008, 32, 503–528. [Google Scholar] [CrossRef]
  58. Webb, R.H.; Boyer, D.E.; Turner, R.M. The Desert Laboratory Repeat Photography Collection—An Invaluable Archive Documenting Landscape Change; US Geological Survey Fact Sheet 2007-3046; US Government Printing Office: Washington, DC, USA, 2007; p. 4. [Google Scholar]
  59. Zier, J.L.; Baker, W.L. A century of vegetation change in the San Juan Mountains, Colorado: An analysis using repeat photography. For. Ecol. Manag. 2006, 228, 251–262. [Google Scholar] [CrossRef]
  60. Webb, R.H.; Betancourt, J.L.; Johnson, R.R.; Turner, R.W. Requiem for a River: Historic Change in the Santa Cruz River near Tucson; Univerity of Arizona Press: Tucson, AZ, USA, 2014. [Google Scholar]
  61. Carter, M.G. Effects of drougth on mesquite. J. Range Manag. 1964, 17, 275–276. [Google Scholar] [CrossRef]
  62. Seager, R.; Ting, M.; Held, I.; Kushnir, Y.; Lu, J.; Vecchi, G.; Huang, H.-P.; Harnik, N.; Leetmaa, A.; Lau, N.-C.; et al. Model Projections of an Imminent Transition to a More Arid Climate in Southwestern North America. Science 2007, 316, 1181–1184. [Google Scholar] [CrossRef]
  63. Anable, M.E.; McClaran, M.P.; Ruyle, G.B. Spread of introduced Lehmann lovegrass Eragrostis lehmanniana Nees. in Southern Arizona, USA. Biol. Conserv. 1992, 61, 181–188. [Google Scholar] [CrossRef]
  64. Williams, D.; Baruch, Z. African Grass Invasion in the Americas: Ecosystem Consequences and the Role of Ecophysiology. Biol. Invas. 2000, 2, 123–140. [Google Scholar] [CrossRef]
  65. Jones, Z.F.; Bock, C.E. The Botteri’s sparrow and exotic Arizona grasslands: An ecological trap or habitat regained? Condor 2005, 107, 731–741. [Google Scholar]
  66. National Landscape Conservation System, Las Ciénegas National Conservation Area FY 2011 Managers Annual Report; US Bureau of Land Management: Phoenix, AZ, USA, 2011; p. 26.
  67. Debano, L.F.; Schmidt, L.J. Potential for enhancing riparian habitats in the southwestern United States with watershed practices. For. Ecol. Manag. 1990, 33–34, 385–403. [Google Scholar] [CrossRef]
  68. Malcom, J.; Radke, W.R. Effects of riparian and wetland restoration on an avian community in southeast Arizona, USA. Open Conserv. Biol. J. 2008, 2, 30–36. [Google Scholar] [CrossRef]
  69. Browning, D.M.; Archer, S.R.; Asner, G.P.; McClaran, M.P.; Wessman, C.A. Woody plants in grasslands: Post-encroachment stand dynamics. Ecol. Appl. 2008, 18, 928–944. [Google Scholar] [CrossRef]
  70. Villarreal, M.L.; Drake, S.; Marsh, S.E.; McCoy, A.L. The influence of wastewater subsidy, flood disturbance and neighbouring land use on current and historical patterns of riparian vegetation in a semi-arid watershed. River Res. Appl. 2012, 28, 1230–1245. [Google Scholar] [CrossRef]

