1. Introduction
Land abandonment and the subsequent re-forestation are key developments with respect to the provision of ecosystem services in European mountain regions [
1,
2,
3,
4,
5]. Land abandonment is driven by the interaction of environmental and socio-economic factors, such as climate, topography, soil conditions, lack of road-infrastructure development, or degree of part-time farming within a region [
6,
7,
8,
9,
10]. These interactions result in complex social-ecological systems that can only be investigated by a holistic approach and integrated research [
11,
12,
13].
Traditionally, land abandonment has often been modeled with comparative sector supply models [
14,
15,
16]. Land management decisions in these long term modeling studies were usually represented by simplified and uniform mechanisms (e.g., income maximization) on an aggregated level. More recently, agent-based models (ABM) in land-use change [
17,
18,
19,
20] have been introduced as an opportunity to assess future impacts of land-use change in an integrative framework [
21,
22]. ABM allow interpretation of agent-specific behavior covering individual preferences or motivations beyond income maximization [
23,
24,
25,
26,
27] which play an important role in mountain farming [
28,
29,
30,
31,
32,
33,
34].
Realigning the representation of human decision-making with time scales of ecological processes however presents a major challenge when modeling land abandonment, re-forestation and ecosystem services in mountain regions, especially under climate change [
35]. Social-economic behavior, which involves other than purely economic decision-making, is usually based on empirical data from surveys, interviews or role playing games, derived from the existing generation of farmers [
36,
37]. It therefore has only short and medium term validity. In contrast, reforestation processes and climate change impacts on forests and grassland are only visible in the landscape in the long run,
i.e., in several decades [
38,
39].
Coupled socio-ecological models of land abandonment, such as ABM, therefore often adopt either a short term or a long term perspective. The short term perspective focuses on the agent-specific behavior anchored in the current generation of land users, at the expense of adequately representing longer scale ecological processes. The long-term perspective focuses more on simulating ecological succession, i.e., long term forest development under climate change. By doing so the representation of human behavior is simplified in time and space, also due to large uncertainties about the behavior of the next generation of land users.
Existing ABM studies that address farmland abandonment and that consider individual farm decision-making underline the importance of a spatially explicit examination of the linkage between social behavior and environmental factors, and consequently the dynamic heterogeneity of land abandonment and re-forestation [
40,
41,
42,
43,
44,
45]. None of these studies, however, explicitly discusses the consequences of implementing a particular representation of decision-making and the associated short or long term perspective into their model structure. With this study, we therefore address the following open research questions: (i) to what extent do different aggregation levels of decision-making,
i.e., agent-specific
vs. sectoral optimization, influence modeling results and (ii) what consequences arise for model-based policy assessment in the context of farmland abandonment and ecosystem services in mountain regions?
To address these questions, we present an extensive sensitivity analysis,
i.e., an output space analysis, of two different model versions of the land-use model ALUAM (Alpine Land-Use Allocation Model). The sensitivity analysis is performed without the consideration of agents in a comparative static sector supply model approach based on Briner
et al. [
16] and then compared to a dynamic agent-based version of the same model to assess the different impact of each of these key parameters on the model outcome. We test the importance of exogenous parameters using elementary effects proposed by Morris and a subsequent analysis of a combination of important parameters [
46,
47]. Our ABM is innovative in that we use a comprehensive coupling of typical farm structures with types of farm decision-making in an economic framework,
i.e., based on a constraint income maximization approach. The agent characterization is derived from a cluster analysis based on a survey (
n = 111) and interviews (
n = 15) with farmers in the case study region and the model is validated against empirical data.
The study does not intend to solve the problem of decision making processes over multiple generations. The sensitivity analysis, however, provides a quantitative assessment of the role of agents in the context of dynamic and medium term ABM programming models, compared to traditional sector supply modeling approaches in agriculture using a comparative static perspective. This comparison allows us to specify the differences and commonalities between two models that address land abandonment with different time horizons by applying different aggregation levels of human decision-making. The results help to assess and interpret existing [
48,
49,
50,
51] and future model applications as well as to inform model choice in the context of farmland abandonment and re-forestation in mountain regions.
The manuscript is structured as follows. In
Section 2, we present the case study region and describe methods and data sources. In
Section 3, we present the results of the agent typology and the implementation of this agent-specific behavior in the existing ALUAM framework. Next, we focus on model performance and validation of the adopted agent-based model and provide the results from an extensive sensitivity analysis with and without agents for changes in prices, direct payments schemes, production costs, labor availability and opportunity costs. In
Section 4, we discuss our findings in comparison to existing literature on the assessment of land abandonment and re-forestation in mountain regions.
3. Results
3.1. Agent Typology
The PCA yielded six components capturing 71% of the variance (see description and
Table A1 in Appendix A). The cluster analysis of the regression based principal component scores identified five different farming types.
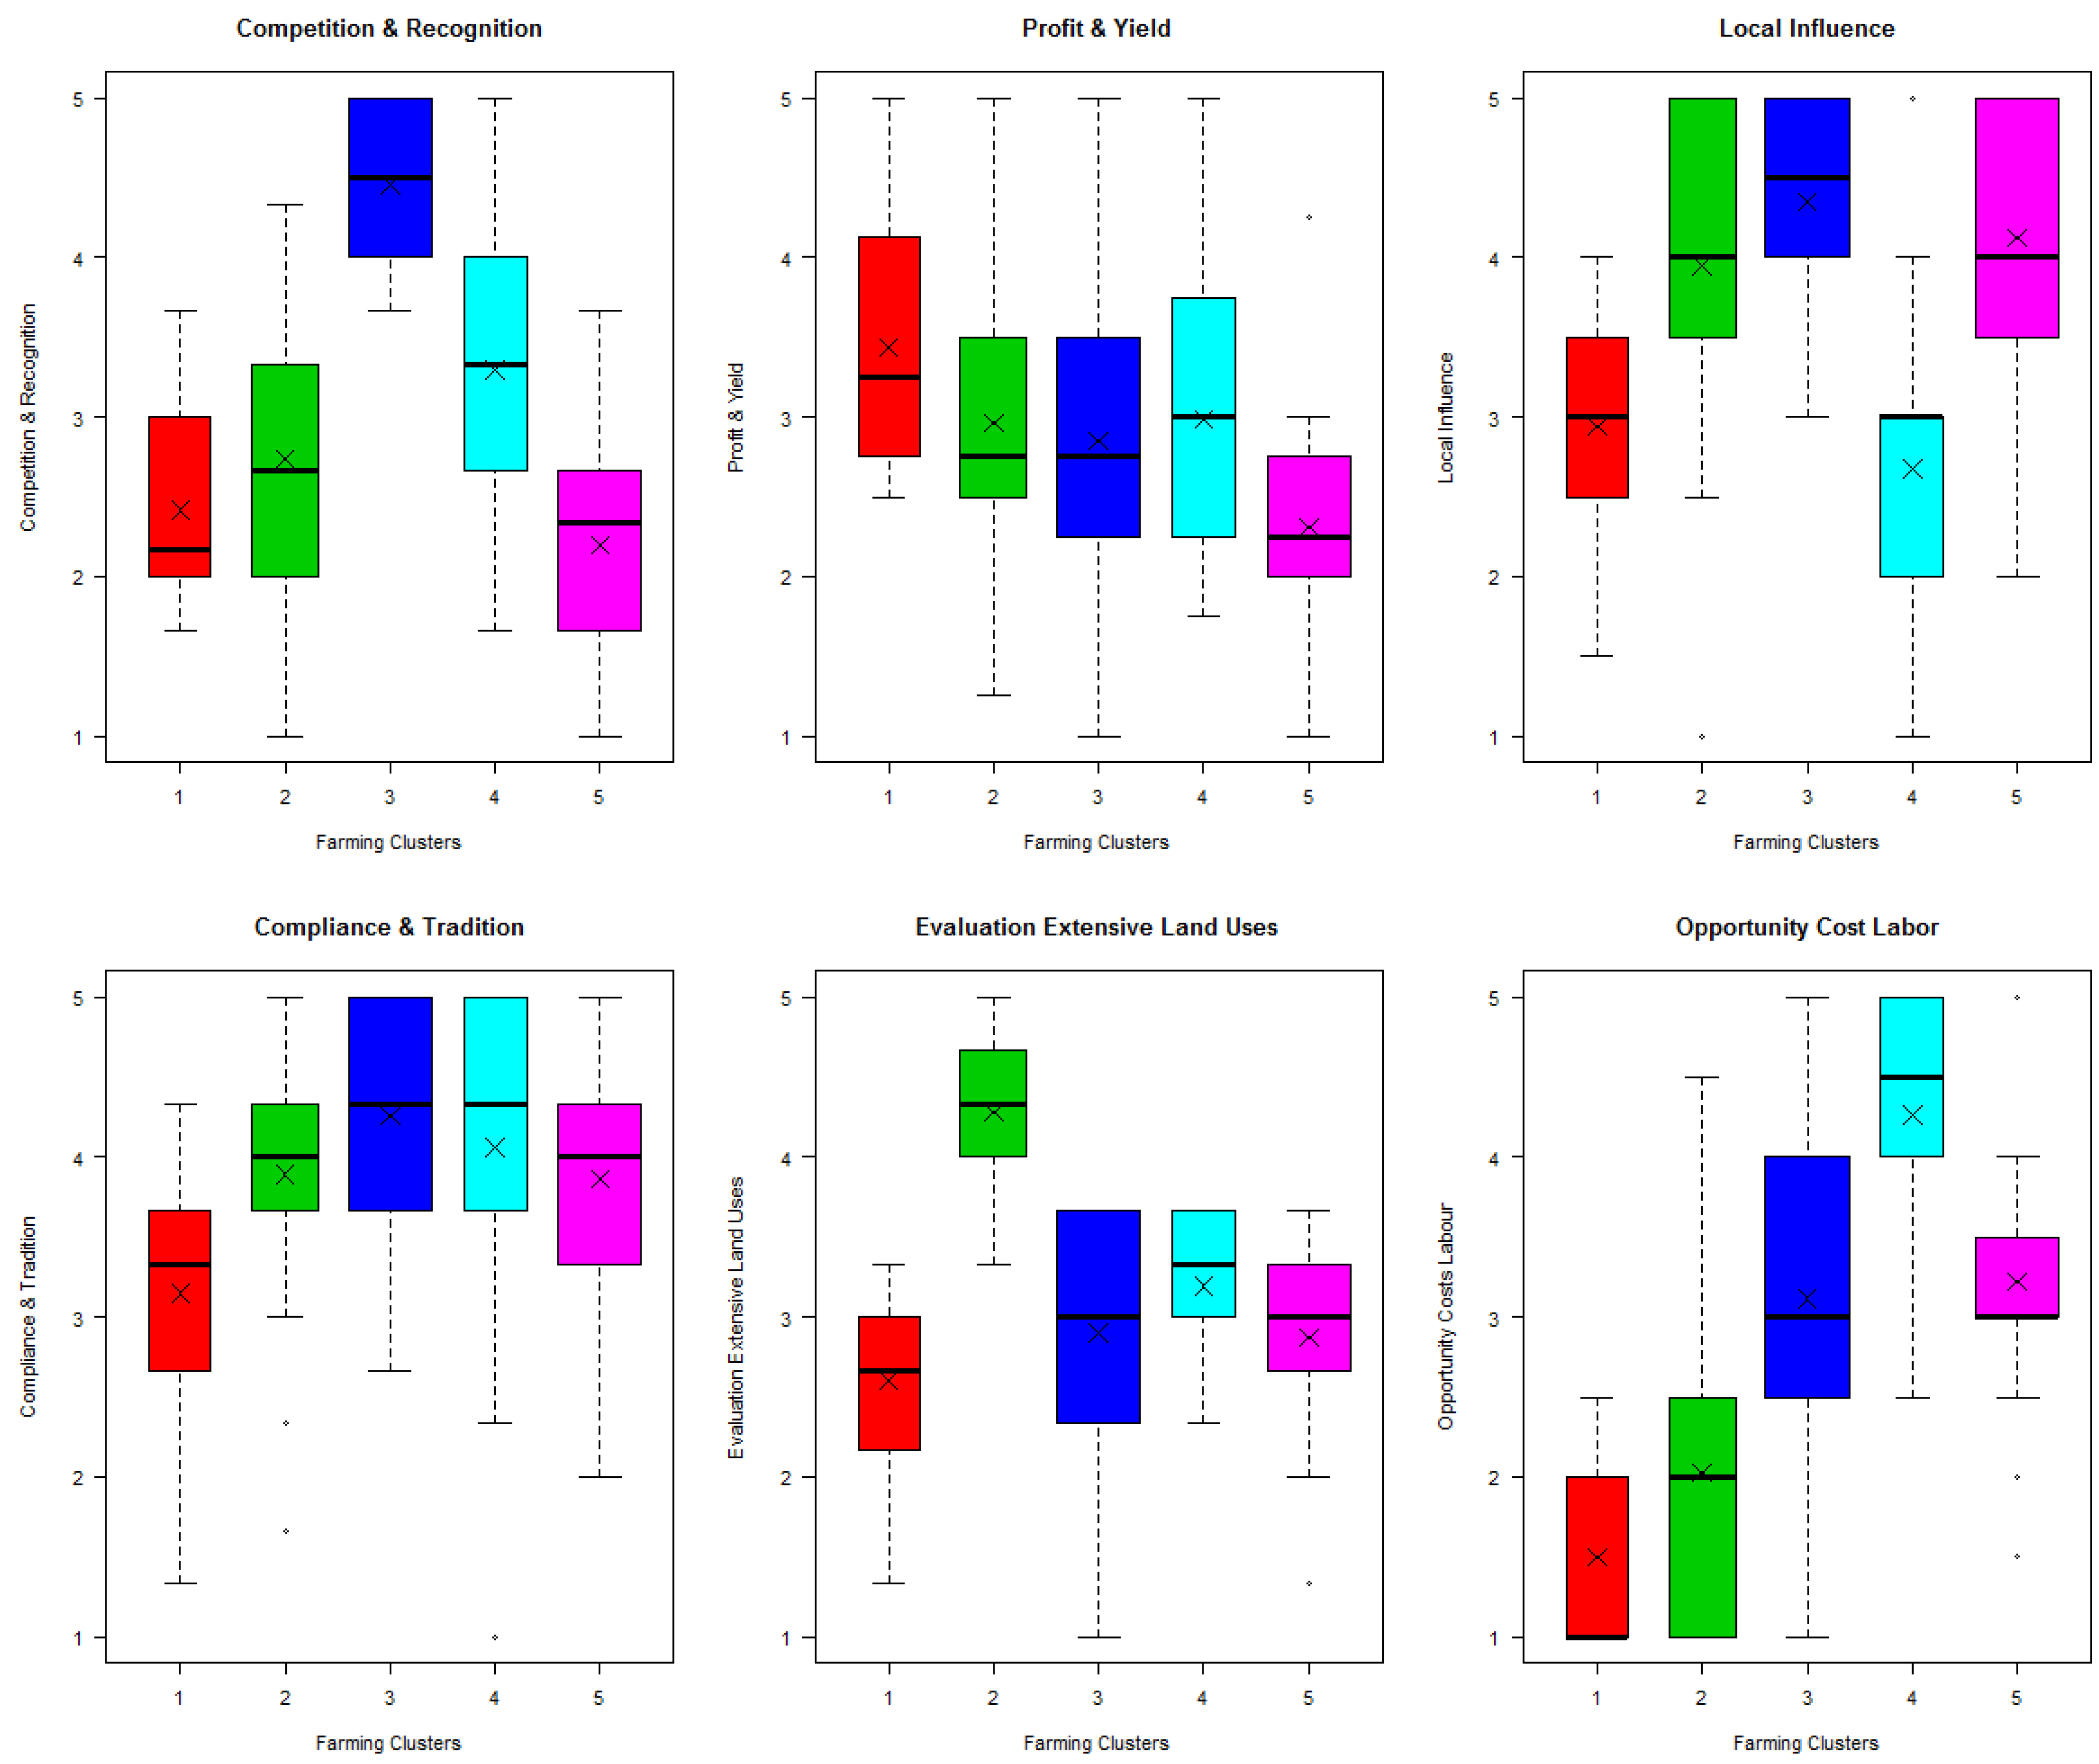
Figure A1 in the Appendix shows the relationship between the factor scores (calculated from items with PCA loadings > 0.5) and the five actor types. The five types locate farmers on a gradual scale between more production-oriented full-time and leisure-oriented farming, and varying dependencies on off-farm work and income opportunities. In the following, we briefly describe the actor types including the most important results of the cross-tabulation with farm structure and census data as presented in
Table 2.
Type 1: Production-oriented farmers
This type of farmer attaches great importance to generating an adequate income, high yields and innovative products from their farming activities. They tend to be less involved in local traditions, breeding competitions, or providing ecosystem or landscape services. With a few exceptions, farming is their primary source of income and most or all available labor is devoted to farming. Many also have access to hired labor. Opportunity costs are low, as they farm largely independent from work commitments outside of agriculture. Average farm size for this type is significantly higher than for the other types, both with respect to area farmed and livestock kept. The farming systems are mostly specialized, consisting of larger dairy, beef/suckling cattle, mixed or commercial sheep enterprises. Overall, however, the proportion of small livestock is low. Production-oriented farmers regard the financial and ecological benefits of extensive land-uses and the provision of ecosystem services as considerably less attractive than the other farming types. They have the lowest share of extensive land-use which is consistent with their attitudes and production-orientation. On average, they farm significantly higher quality farm land both with respect to slope as well as agricultural production zones.
Table 2.
Key characteristics of farmers, farm structure and land use for the five actor types. Numbers in brackets refer to median and standard deviation respectively.
Table 2.
Key characteristics of farmers, farm structure and land use for the five actor types. Numbers in brackets refer to median and standard deviation respectively.
| | | Full-Time Farmers | Part-Time Farmers | Leisure Farmers |
|---|
| | | Production-Oriented Farmers (n = 16) | Ecological and Landscape Stewards (n = 19) | Part-Time/Leisure-Oriented Breeders (n = 30) | Traditionalist Leisure Farmers (n = 17) | Leisure-Oriented Farmers (n = 29) |
|---|
| Total managed land in cluster | ha | 365.8 | 275.9 | 274.2 | 130.2 | 200 |
| Farmer’s age | y | 46 (48; 9.53) | 45 (47; 7.58) | 50 (52.0; 8.36) | 46(47; 10.3) | 47 (47; 8.19) |
| Household income | kCHF | 60 (55; 27) | 82 (85; 30) | 66 (55; 22) | 68 (55; 23) | 76 (85; 16) |
| Household income from agriculture | % | 52 (70; 37) | 35 (30; 32) | 19 (10; 17) | 17 (10; 20) | 13 (10; 8) |
| Labor hours farm manager | h/day | 6.5 (7; 2.82) | 4.6 (3; 3.26) | 4.5 (5; 2.11) | 3.7 (3; 1.76) | 2.8 (3; 0.89) |
| Additional available labour (family or hired) | h/day | 10.2 (2.9; 19.54) | 7.4 (5; 7.91) | 5.4 (3.6; 7.38) | 2.9 (2.5; 3.11) | 4.9 (3; 4.95) |
| Managed agricultural land | ha | 22.9 (18.6; 17.82) | 14.5 (8.8; 13.40) | 9.1 (7.8; 5.12) | 7.7 (6.4; 2.43) | 6.9 (6.5; 2.89) |
| Total livestock | LU | 25.7 (14.8; 32.50) | 16 (9.8; 15.85) | 8.5 (7.2; 5.52) | 6.4 (5.2; 3.15) | 6.4 (5.9; 3.63) |
| of which small livestock | LU | 5.2 (4.3; 5.10) | 3.5 (2.7; 3.92) | 4.9 (4.3; 4.19) | 4.1 (4.1; 3.45) | 4.1 (4.3; 4.14) |
| of which large livestock | LU | 20.5 (3.6; 35.05) | 12.5 (4.4; 16.56) | 3.5 (0; 5.91) | 2.3 (0; 3.24) | 2.3 (1.2; 2.26) |
| of which dairy cows | LU | 14.7 (0; 22.26) | 2.1 (0; 4.99) | 1.4 (0; 2.91) | 0.5 (0; 1.5) | 0.8 (0; 1.55) |
| Small livestock | % | 20 | 22 | 58 | 64 | 65 |
| Land in severely disadvantaged production zone 54 | % | 52 | 83 | 72 | 63 | 58 |
| Land in production zone 53 | % | 15 | 9 | 26 | 32 | 35 |
| Land in best production zone (hill zone 41) | % | 29 | 6 | 1 | 0 | 2 |
| Steep land (> 18°) | % | 51 | 74 | 86 | 78 | 82 |
| Extensive grassland and pastures | % | 20 | 38 | 28 | 30 | 31 |
Type 2: Ecological and landscape stewards
Farmers in this cluster place a stronger emphasis on the social, ecological and landscape aspects of their farming activities than on the achievement of high yields or profits. They consider extensive land-use and the provision of ecological services to be both an adequate source of income and an effective measure to increase biodiversity. Farmers of this type engage mainly in medium sized suckling cow/beef, mixed, or horse enterprises or small to medium scale sheep and goat farming with an increasing focus of their farming activities towards ecological direct payments. While suckling cow and beef enterprises derive the bulk of their household income from agriculture, the average share of agricultural income in the overall cluster amounts to 35%. On average, farmers of this type devote about 4.6 h per day to farm work, with some variation between farms keeping large or small livestock. Perceived dependence on off-farm labor and income however is low, indicating a certain amount of flexibility in labor use due perhaps to extensification of production. Some of the farmers in this group have access to additional hired labor, and all of them to family labor. On average, this provides them with an additional 7.4 h per day of help on the farm. This cluster exhibits the highest proportion of extensive land uses among the five farming types which is consistent with the stronger ecological orientation of these farmers.
Type 3: Part-time or leisure-oriented breeders
Farmers in this cluster share a strong interest in being recognized as “good” farmers or breeders within their respective (farming) communities and like to share their farming passion by participating in exhibitions, competitions, or cow fights. By engaging in these activities, they also aim to maintain local traditions and contribute to village life. They derive their main income off-farm and devote on average about 4.5 h a day to farming. The stronger off-farm engagement of the farm manager is also reflected in higher perceived opportunity costs compared to the “Ecological and landscape stewards”. Most farmers in this group can count on additional family labor of on average 5.4 h per day (median 3.6 h). On average, this farm type houses 8.45 LU and manages an area of 9 ha. In addition to many small to medium scale enterprises focused on breeding small livestock, this cluster also includes farmers who keep low numbers of a specialized cattle breed often used for fighting and small to medium scale suckling/beef enterprises. On average, the proportion of steep land is highest in this cluster.
Type 4: Traditionalist leisure farmers
Farmers of this type undertake small-scale farming as a way to maintain local traditions. Compared to type 3, they do not aim for such a strong involvement in breeding, competitions and local decision-making, and perceive their opportunity costs to be much higher. All of the farmers are employed outside of agriculture and their farming activities depend strongly on off-farm work commitments and income. Therefore, labor invested in agricultural activities is low, as is the share of household income derived from agriculture. Of the 6.4 livestock units housed on average, the overall proportion of small livestock is high (64%). The main farming activities include sheep farming, horses and low numbers of suckling or dairy cows. Farm sizes are among the smallest in the survey.
Type 5: Leisure-oriented farmers
Farmers in this group place a high importance mainly on being involved in local decisions and village life. They are significantly less focused on achieving high income and yields than the other clusters but do not place a strong focus on ecological or competition objectives either. All of the farmers work outside of agriculture and, with an average of 2.8 h, labor invested in agricultural activities is very low. It is however complemented by a few hours of additional family labor (4.9 on average a day, median 3 h). Agriculture only contributes 13% to the total household income. Perceived opportunity costs are midway between the two other leisure-oriented farming types. Farms are small and the majority of the leisure farmers keep sheep only, occasionally mixed with low numbers of suckling cows or beef cattle. On the few farms which keep large livestock, the workload is carried by family members rather than by the farm manager himself.
Table 3 shows how the actor characteristics are implemented into agent types in ALUAM-AB. For the full parameterization of these characteristics we refer to
Table B2 in the Appendix. Consistent with the actor typology, opportunity-cost levels were introduced as a main proxy to reflect non-economic objectives and attitudes in our income optimization model. The level of opportunity costs represent a measure of benefits forgone due to alternative uses of labor. Each agent type is assigned a specific threshold level as a percentage of a fixed monetary value
i.e., the opportunity costs in the aggregated model version. Low opportunity costs imply that farm activities are maintained even though the income generated by these activities is low.
Table 3.
Translation of empirical farm type characteristics into parameter levels for implementation into the agent-based model.
Table 3.
Translation of empirical farm type characteristics into parameter levels for implementation into the agent-based model.
| | Full-Time Farmers | Part-Time Farmers | Leisure Farmers |
|---|
| | 1. Production Oriented Farmers | 2. Ecological and Landscape Stewards | 3. Part-Time/Leisure Breeders | 4. Traditionalist Leisure Farmers | 5. Leisure Farmers |
|---|
| Opportunity costs | Low | Low | Medium | High | Low |
| Available family labor | High | Medium | Medium | Low | Low |
| Farm growth possible | Yes | Yes/No | Yes | No | No |
| Additional hired workforce | Yes | No | No | No | No |
| Minimum income | High | Medium | Medium | Low | Zero |
| Succession rate % | High | Medium | Medium | Low | Low |
| Extensification | Low | High | Low | High | High |
| Farm size | High | Medium | Low | Low | Low |
| Livestock housing capacity | High | Medium | Small | Small | Small |
| Production system flexibility | Specialized | Mixed | Specialized | Mixed | Specialized |
Another important restriction for part-time and leisure-oriented farmers is the available work force. Additional work force, other than the family labor available, can only be hired by production-oriented farmers. In addition, farm growth in the model is only possible for the “Production-oriented farmers” and the “Part-time and leisure breeders” as well as “Ecological and landscape Stewards” since these agents are either more production-oriented or the survey has shown that they are more interested in farm growth. An agent type specific minimum income threshold was introduced as an additional proxy for non-economic farming objectives. In the optimization process, farms exit if they fail to achieve this minimum income threshold. For leisure-oriented farm types however this threshold level is set very low. The succession rate defines the probability that the farm will be taken over when the farmer retires (at the age of 65) and was derived from the farm survey and interviews. Farm extensification describes a maximum level of extensive meadows and pastures on the corresponding farm type. Parameters for farm and livestock housing capacities are derived from census data. Finally, the agents are assigned different production system flexibility, based on their stated preferences for specific farm activities in the survey and the interviews. “Ecological and landscape stewards” and “Traditionalist leisure farmers” can switch between cattle and sheep production. The other farm types, which are currently specialized, may invest in new fixed assets, i.e., farm buildings but cannot switch their production system. Changes in farm activities are further mediated through the land market module.
3.2. Model Validation: Best-Performing Simulation Output
Table 4 shows the results from the error decomposition to assess the single best output performance of ALUAM-AB with respect to the total number of animals measured in livestock units (LU), the number of sheep and cattle and the aggregated areas of intensive and extensive land use. To summarize, the overall errors of the model performance and the unequal variation error are small, and thus the model captures the mean and trends of the observed data satisfactorily. The mean percentage error of the simulation with respect to these output variables ranges between 1.5% for the number of sheep and 10.9% for the total amount of extensive land use.
Table 4.
Error decomposition in the single best-performing output of ALUAM-AB.
Table 4.
Error decomposition in the single best-performing output of ALUAM-AB.
| | Unit | RMSPE % | Bias (UM) | Unequal Variation (US) | Unequal Covariation (UC) |
|---|
| Animal production unit | LU | 0.035 | 0.808 | 0.042 | 0.150 |
| Sheep | Nr. | 0.015 | 0.003 | 0.000 | 0.997 |
| Cattle | Nr. | 0.082 | 0.821 | 0.059 | 0.120 |
| Land-use (intensive) | ha | 0.057 | 0.810 | 0.002 | 0.188 |
| Land-use (extensive) | ha | 0.109 | 0.092 | 0.000 | 0.908 |
The remaining error in the case of sheep production can be attributed to an unequal covariation,
i.e., the simulation shows small lags in the reproduction of observed data (see also
Figure 1a). In contrast, the mean errors in total amount of animals (3.5%), cattle (8.5%) and intensive land use (5.7%) are associated with bias. The simulation results for the total amount of cattle and intensive land use are consistently lower than the actual number of dairy cows, sucklers and beef cattle (see
Figure 1b) and the total amount of intensive grassland in the case study region (see
Figure 1c),
i.e., there is a systematic error between simulation results and observed data.
This bias is associated with the aggregation of agents’ resources, such as livestock housing capacities and workload, as well as fixed assumptions concerning technical parameters, such as nutrient requirements or mechanization. These assumptions are inevitable and could only be replaced by a data intensive expansion of model parameters to smooth the linear production functions in the model, i.e., by adding more production activities and sub-types of these activities. The unequal variation error for these output categories however, is small and thus no deviation from the trend could be detected.
The largest gap between model and observed data can be found for the aggregated area of extensive land use (see
Figure 1d). The error can be attributed to the unequal covariation between simulation results and observed data indicating that the error is unsystematic. The model may not be able to fully capture the changes in the amount of extensive land use. In general, however, there is no systematic deviation from the trend. With respect to land abandonment, a year by year comparison is not possible since observed data on forest regrowth is only available for the whole period (+252 ha of forest). Compared to the initial distribution of parcels, ALUAM-AB abandoned 227 parcels (or ha). Thus, land abandonment is slightly underestimated in our approach.
Figure 1 also illustrates the differences between the sector supply model ALUAM and the agent-based model ALUAM-AB in the single best performing output. Without a specification of the agents, lamb production is not profitable and the number of sheep is continuously decreasing.
Figure 1.
Best-performing model outcome comparing simulation data from ALUAM and ALUAM-AB with observed changes between 2001 and 2012 in animal production (sheep and cattle) and land-use intensities. (a) Sheep production; (b) cattle production; (c) intensive grassland use; (d) extensive grassland use.
The same development can be observed for cattle between the years 2001 and 2008. The increase in prices in 2009 leads to a reversal of this trend. Due to the flexibility constraints, however, the increase is restricted to 10% of the number of cattle in the previous year. For intensive grassland use the aggregated model performs similar to the agent-based model version. In contrast, the amount of extensively used grassland is much lower in ALUAM. More land is abandoned which does not correspond well with the observed data. Overall, the agent-based model shows a better validation to observed data than the sector supply model ALUAM.
3.3. Elementary Effects
Figure 2 visualizes the mean and standard deviation of the elementary effects of the 13 exogenous parameters on land rent (the objective function of the model) and the number of animals in both model versions,
i.e., with and without agents (
n = 520 model runs). A detailed overview of EE effects for all parameters is provided in the Appendix (
Table B3).
Figure 2 shows that the same four parameters emerge as the main exogenous drivers in both model versions: Opportunity costs of labor, milk and lamb prices and the price for energy (fuel).
Figure 2.
Elementary effects (i.e., mean and standard deviation) of land rent and livestock units in the two model approaches for exogenous input factors. (a) EE land rent ALUAM; (b) EE land rent ALUAM-AB; (c) EE livestock units ALUAM; (d) EE livestock units ALUAM-AB.
Figure 2.
Elementary effects (i.e., mean and standard deviation) of land rent and livestock units in the two model approaches for exogenous input factors. (a) EE land rent ALUAM; (b) EE land rent ALUAM-AB; (c) EE livestock units ALUAM; (d) EE livestock units ALUAM-AB.
Compared to these four main drivers, both the mean and standard deviations of other parameters are relatively small, indicating that individual changes in these parameters result in a negligible effect on model outcome (all else being equal). In the sector supply model ALUAM, the mean and standard deviations are large for the impact of diesel price, opportunity costs and milk price on the aggregated land rent (
Figure 2a). Simulations imply that the milk price results in the highest variability with respect to the objective function of the model. The impact of the milk price on the number of livestock units (
Figure 2c) is much smaller since the model can switch its activities,
i.e., from dairy cows to beef and breeding cattle or to sheep production, which overall compensates for the reduction in dairy cows. Such substitution effects are smaller for diesel price and opportunity costs which also have a high impact on the number of livestock. The lamb price has only a small impact on land rent and the number of livestock units in the aggregated model.
In the agent-based model ALUAM-AB, opportunity costs have the highest impact on land rent with respect to mean and standard deviation (
Figure 2b). Milk price has a large impact on the mean, but exhibits a much lower variability compared to the sector supply model. The importance of the fuel price decreases in that it has a lower effect on the variability of the outcome compared to ALUAM. With respect to livestock units (
Figure 2d), the results show that only opportunity costs have a large impact on mean and standard deviation. The influence of other exogenous inputs is reduced. This exemplifies the reduced flexibility in the agent-based model: Since farm types cannot switch to alternative farm activities, the impact of price and costs on the number of livestock units is small while the effect on the land rent,
i.e., their agricultural income, is still high. The extent of this effect depends on the profitability of the corresponding farm activity.
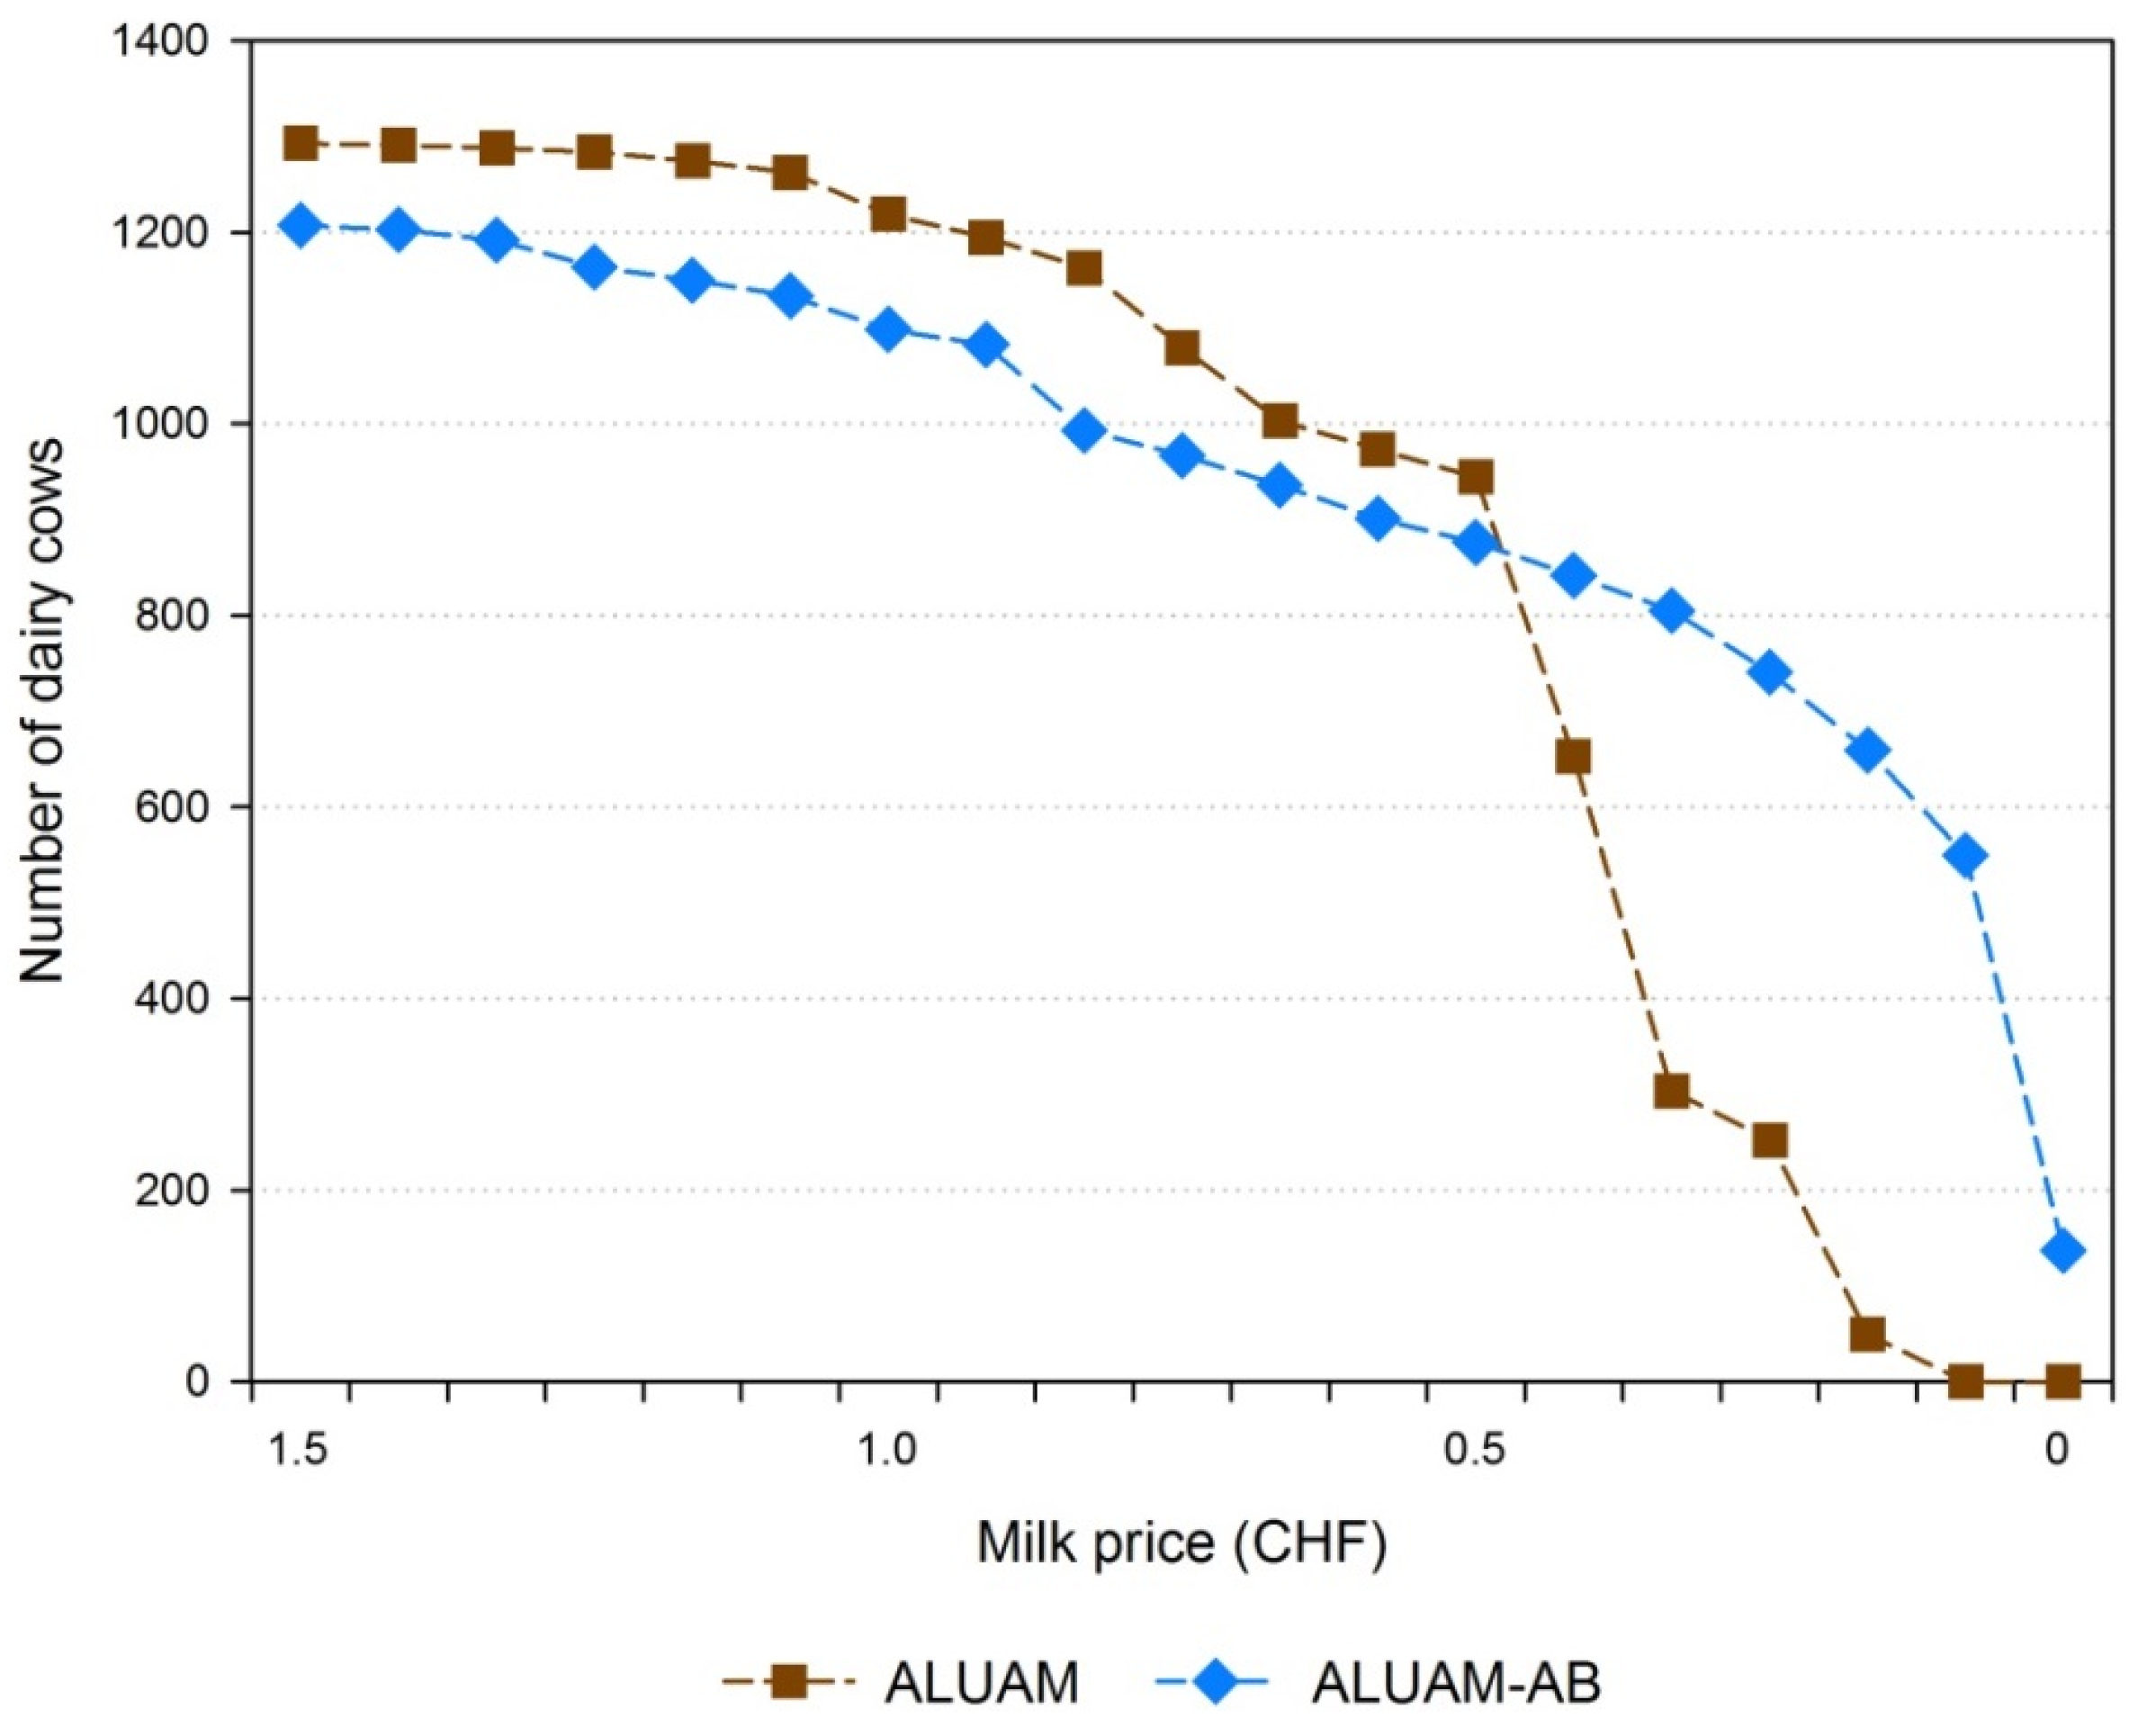
Figure 3.
Comparison of changes in the number of dairy cows with one at a time changes in the milk price between 0 and 1.5 CHF in both model approaches.
Figure 3.
Comparison of changes in the number of dairy cows with one at a time changes in the milk price between 0 and 1.5 CHF in both model approaches.
The higher the profitability, the larger the impact it has on the objective function. Since the productivity of sheep rearing is low, changes in lamb prices have a much lower overall effect on land rent than changes in milk price and diesel costs. Thus, in contrast to the sector supply model, farmers in the agent-based model continue to produce even if prices vary strongly from one year to the next.
This effect is also illustrated in
Figure 3 which shows the changes in the number of dairy cows with a one at a time decrease in milk price. In the aggregated model ALUAM, the number of dairy cows falls drastically if the milk price drops below 0.4 CHF. In contrast, agents in ALUAM-AB continue to produce milk due to structural restrictions (sunk costs in livestock housing capacities and availability of farmland through land market) and farm type characteristics (opportunity costs, intentions to grow and minimum income). This model behavior smoothes the adaptation of farm activities to socio-economic drivers and allows for a more subtle representation of farm structural changes consistent with real world observations (see
Figure 1).
3.4. Sensitivity to Changes in Direct Payments
Figure 4 shows the interaction between the three levels of opportunity costs (10, 20 and 30 CHF) and the impact of two different direct payments schemes,
i.e., with and without payments per livestock unit. Please note that these levels of opportunity costs are multiplied with the agent-specific levels of opportunity costs (low, medium, high) in the agent-based model (see
Table 3 and
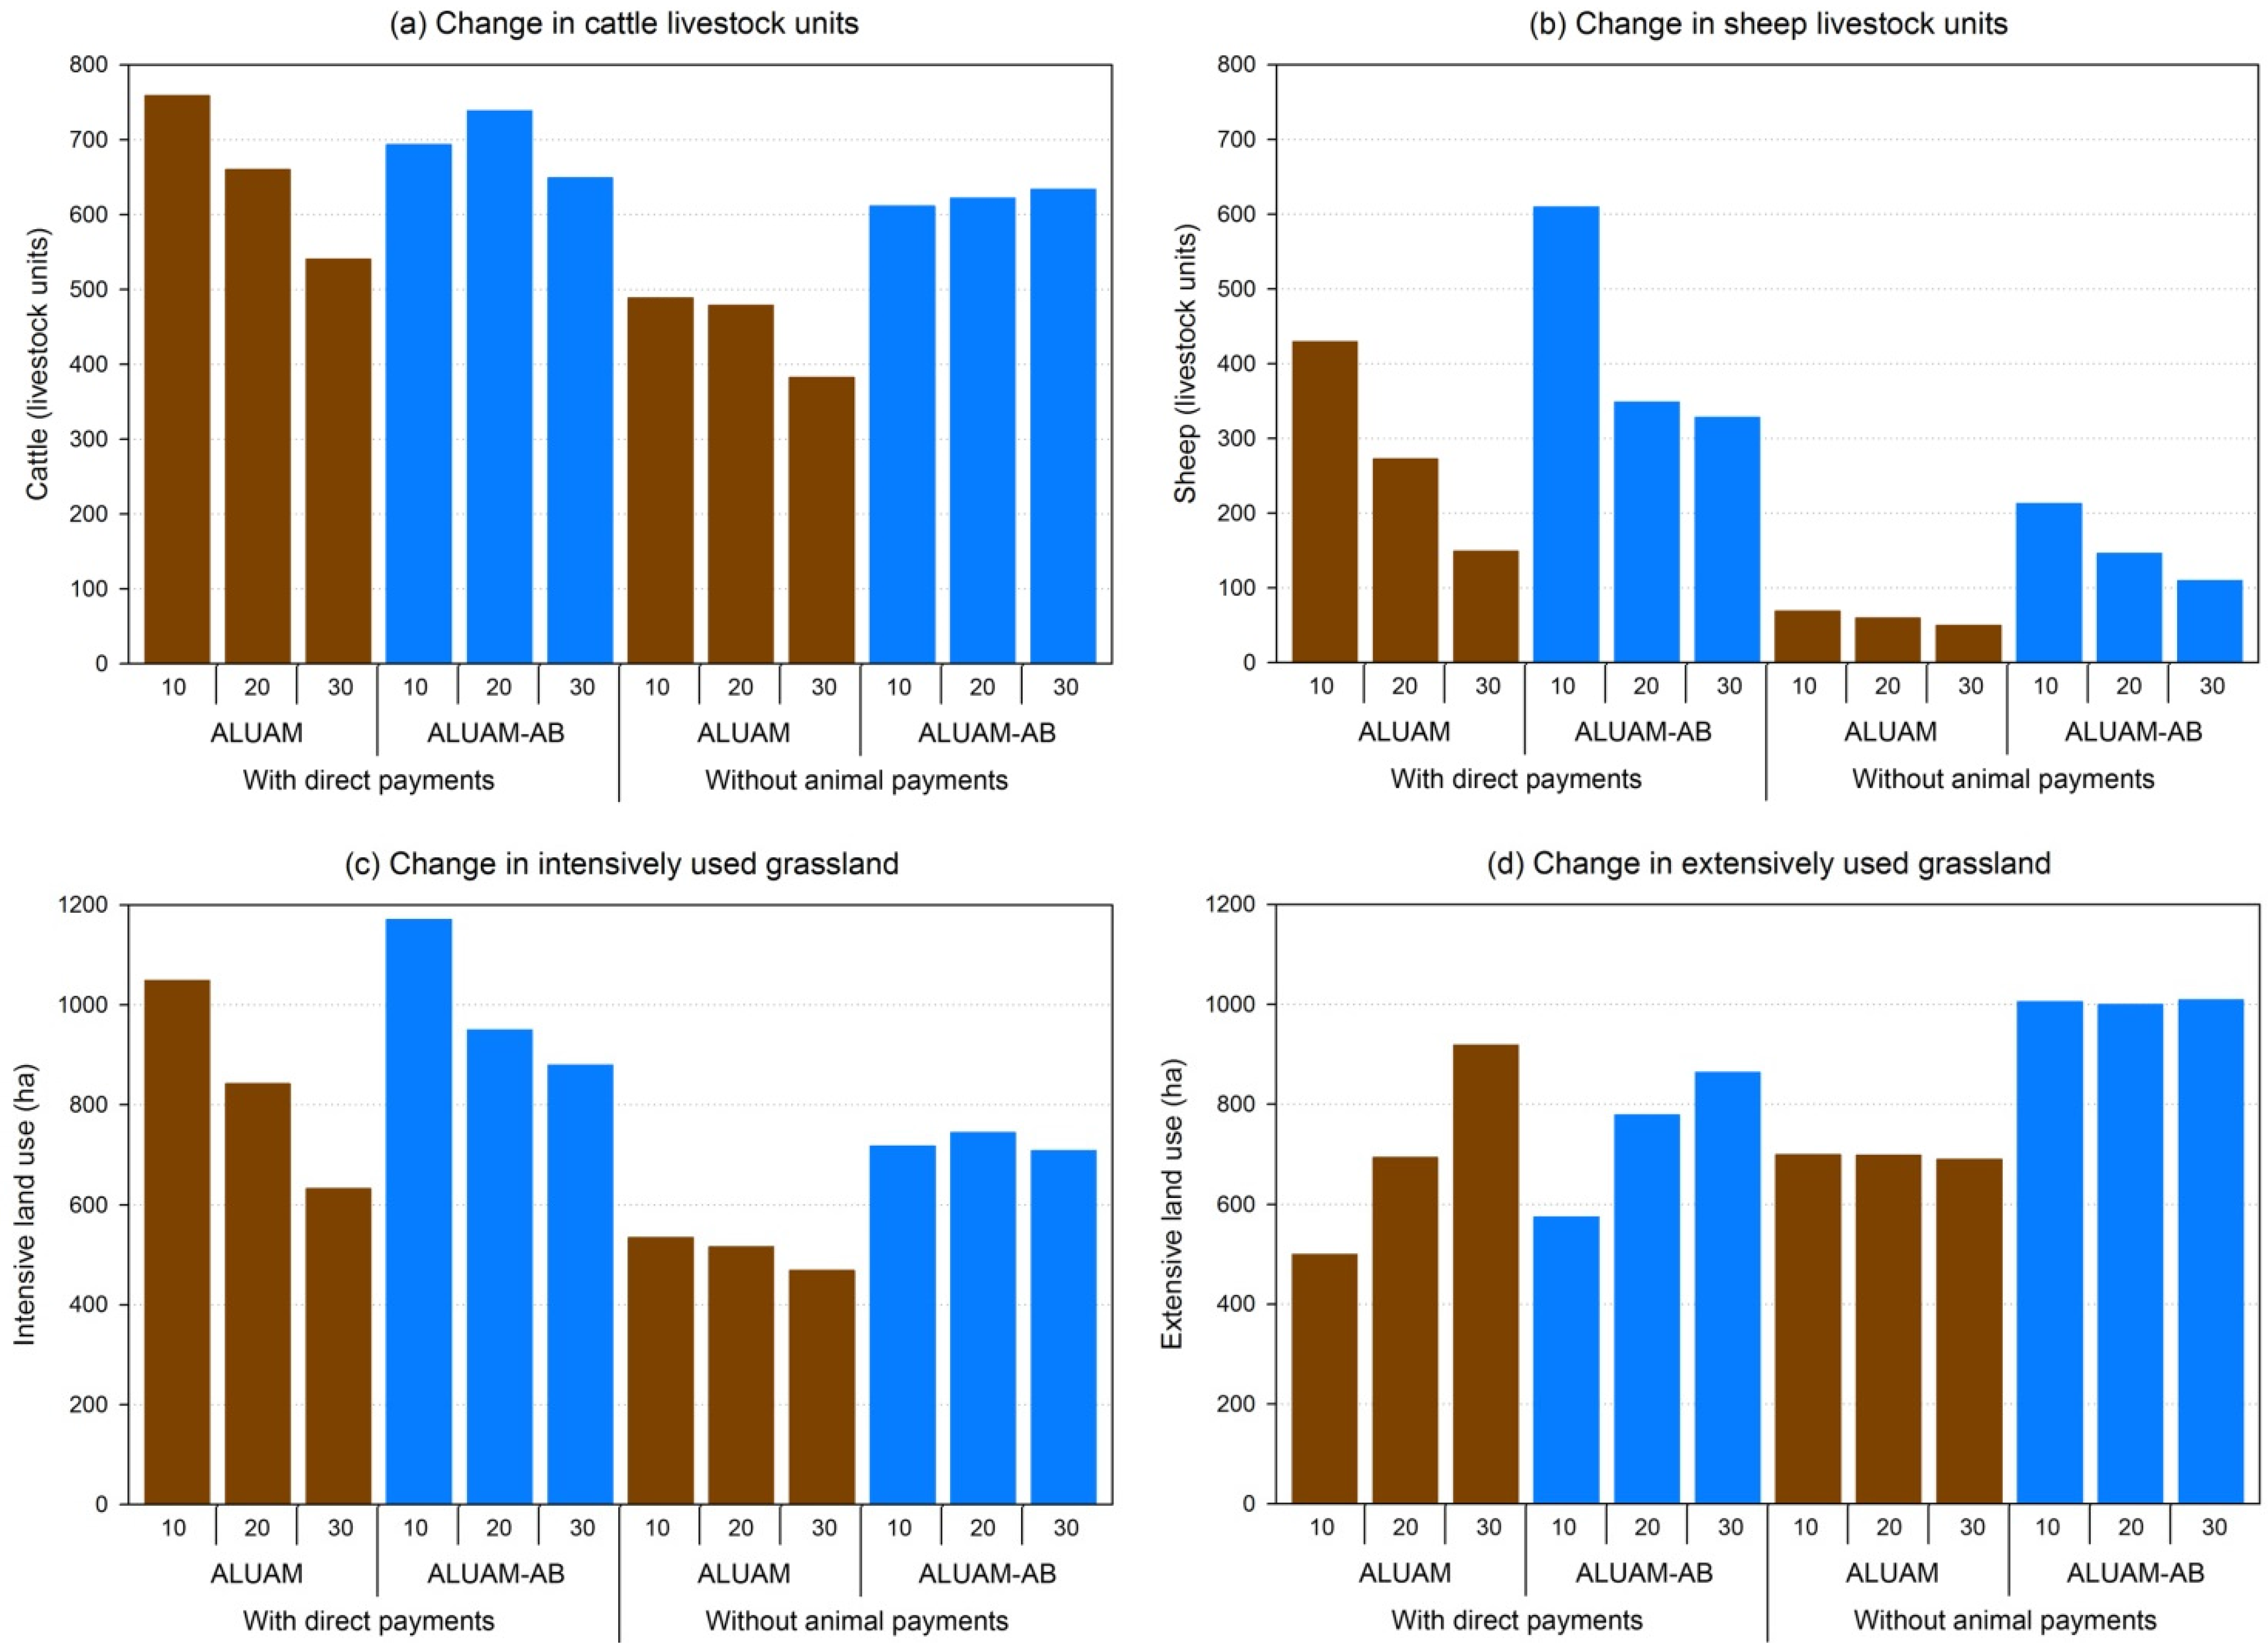
Table B2). The figure directly compares the output from the two model versions with respect to the number of cattle and sheep as well as the amount of intensively and extensively used grassland. The simulation results of the sector supply and the agent-based model are represented with the blue and the brown bars respectively. In general, livestock and intensively used grassland areas in the aggregated model ALUAM are lower compared to the agent-based version ALUAM-AB and the reaction to changes in the direct payments is more pronounced. This is illustrated in the four diagrams:
- (1)
Figure 4a shows that the resulting number of cattle is, in general, higher in the agent-based model than in the sector supply model. The only exception is the basic model run with all direct payments and the lowest level of opportunity costs (10 CHF) where the outputs from ALUAM and ALUAM AB show similar numbers. This exception can be explained by the fact that both models were calibrated to this basic combination of input factors. However, with increasing opportunity costs, the number of cattle decreases in the sector supply model irrespectively of direct payments (e.g., by 28% from 758 to 540 livestock units in the simulation runs with direct payments) whereas in the agent-based model opportunity costs have a smaller impact on the number of cattle. Although benefits foregone due to alternative uses of labor increase, cattle numbers remain stable or even increase slightly (e.g., by 3.6% from 611 to 633 livestock units in the simulation runs without area payments).
- (2)
With respect to sheep,
Figure 4b shows a different simulation behavior of the agent-based model. As in the sector supply model, the number of sheep decreases with increasing opportunity costs (e.g., by 46% from 609 to 328 livestock units in the simulation runs with direct payments). The two models also respond in a similar direction for both direct payment schemes. The abolishment of payments for animals leads to a decrease of sheep in both model versions. In the sector supply model, the number of sheep even falls to the minimum level,
i.e., only production-oriented farmers still produce lamb.
- (3)
The same pattern can also be observed for the amount of intensively used grassland. An increase in opportunity costs generally leads to a decrease in intensive meadows and pastures in both model versions (e.g., by 40% from 1048 to 632 hectares in the ALUAM simulation runs with direct payments). The discontinuation of payments for animals leads to a decrease in intensively used grassland in both model versions.
- (4)
The change in the amount of extensively used grassland presented in
Figure 4d reflects the opposite pattern of intensively used grassland. In the base simulations with direct payments, the amount of extensively used grassland increases with higher opportunity costs. Without payments for animals, the amount of extensive grassland reaches a threshold level,
i.e., a corner solution in both simulation models. The amount of extensively used grassland does not exceed a level of 700 and 1000 ha in ALUAM and ALUAM-AB respectively.
Figure 4.
Sensitivity of model outputs ((a) cattle, (b) sheep, and (c,d) land-use intensities) to the abolition of animal based direct payments with three levels of opportunity costs. ALUAM = Sector supply model; ALUAM-AB = Agent-based ALUAM; 10,20,30 = level of opportunity costs in CHF.
Figure 4.
Sensitivity of model outputs ((a) cattle, (b) sheep, and (c,d) land-use intensities) to the abolition of animal based direct payments with three levels of opportunity costs. ALUAM = Sector supply model; ALUAM-AB = Agent-based ALUAM; 10,20,30 = level of opportunity costs in CHF.
The extent of land abandonment can be calculated by adding up areas of intensive and extensive land-use. Without animal based payments, the agricultural surface decreases by 25% in ALUAM whereas simulation results imply land abandonment of 2% in the ALUAM-AB results.
In conclusion, the simulation results presented in
Section 3.4 illustrate that although the same exogenous inputs drive the outcome of both models, the interaction of policy measures and opportunity costs strongly influences simulation results. Analogous to the arguments discussed in
Section 3.3, these effects can be attributed to the integration of agents’ characteristics into the sector supply model. ALUAM-AB is less flexible since areas and fixed assets,
i.e., livestock housing capacities do not switch directly to more profitable agricultural activities as in the more aggregated model version. In the agent-based version, land can only be transferred via the land market module and farm type characteristics constrain production flexibility. In ALUAM-AB only “Ecological and landscape stewards” and “Traditionalist leisure farmers” can shift their production from sheep to cattle (or vice versa). However, based on the agent typology, full-time sheep farmers (farm businesses) and leisure-oriented farmers still remain in production as long as they meet their income thresholds. This leads to a more diversified production pattern in the agent-based model version.
4. Discussion
Socio-economic changes will continue to influence land abandonment in mountain regions [
3,
7,
16]. Agent-based models offer the opportunity to include non-economic objectives and attitudes into land-use change models [
36,
37]. This is of specific importance when addressing farmers’ behavior in mountain regions [
30,
32,
33]. The analysis of farmers’ decision-making in our case study region in the Valais, Switzerland confirms earlier findings that farmers have multiple values and objectives which translate into different farming strategies whereby profit maximization is only one [
62,
65,
66,
67]. Objectives of part-time and leisure-oriented farmers are particularly diverse and the aspiration to achieve high production and income levels through farming, as assumed by mainstream agricultural policy, is considerably less pronounced. Our analysis also highlights pronounced differences in availability of farm labor and opportunity costs that strongly affect farmers’ behavior, in line with findings from other European mountain regions [
68]. By relating our analysis of farming objectives and attitudes to farm census data, we were able to develop a farmer typology that could be qualitatively integrated within a simulation framework to assess land-use changes in a mountain region.
To that end, we adapted an existing sector supply model to include specific farm type agents. The existing model uses constraint income maximization based on mathematical programming techniques to simulate an optimal allocation of agricultural production factors while considering a large number of constraints. The farm types identified in the survey are used as an empirical foundation for model restrictions with respect to opportunity costs, farm growth intentions or farm succession. This procedure allows us to take into account both structural characteristics (e.g., fixed assets in land and labor) of existing farms and different types of decision-making separately. Thus, the advantage of this framework is that it allows the consideration of different forms of management, agronomic conditions and locally available production factors restricting the flexibility of farmers to react to socio-economic changes while maintaining the micro-economic footing of the simulations [
22]. The constraint agent behavior allows for a good fit of the simulations with observed data (see 4.2). Such behavioral validations are still a challenge in ABM [
69,
70,
72]. In contrast to other ABM studies addressing farmland abandonment [
40,
41,
42,
45], however, we do not model individual farms and remain within the structure of traditional normative farm sector supply modeling approaches [
56]. One key challenge in such normative approaches is that corner solutions emerge and these only change if input parameters vary considerably or additional restrictions are introduced into the model structure [
56]. Although the integration of agents allows the inclusion of additional constraints, corner solutions may still translate into our framework (see for example the scope of extensive land-use under the sensitivity run without animal based payments). In addition, the integration of empirically grounded data that allows for more flexibility (or more constraints) in the modeling framework requires the acquisition of information on farmers’ decision-making. This is very costly and a transfer of the model to other regions demands a new parameterization of the model. This is a disadvantage that our approach shares with other ABM studies. Since our results show, however, that such details are important for model validation, more generic agents [
37,
82,
83] or more flexible model frameworks [
84] should still include context specific agents, especially in mountain regions.
A comparison of our ABM (ALUAM-AB) with a sector supply modeling approach [
16,
48,
49,
50], shows that the inclusion of agents allows for a better representation of the short and medium term developments of farm activity changes in mountain regions. At the same time, the findings from the assessment of elementary effects imply that the simulation results are driven by the same exogenous parameters in both model versions. Opportunity cost,
i.e., the measure of benefits forgone due to alternative uses of labor, is the most influential factor. The importance of this factor is also supported by other empirical studies which show that farming in Swiss mountain regions would be unprofitable with high labor costs [
85,
86]. In addition, we find that production prices (milk and lamb) and input prices (fuel price) have a high impact on modeling results. This is in line with other studies that confirm that profitable agricultural activities in mountain and upland regions are very sensitive to these parameters [
33,
87]. The fact that both simulation approaches are driven by the same exogenous input parameters supports the use of ALUAM-AB to assess short and medium term land-use changes and land abandonment in mountain regions since the economic background of the sector supply model is maintained. On the other hand, it implies that an in-depth sensitivity analysis of opportunity costs is needed when using a comparative static approach to assess forest development in the context of long-term climate change impacts on re-forestation. Such a sensitivity analysis in the aggregated model would allow considering major uncertainties regarding the behavior of the next generation of land-users and the consequences for the provision of forest ecosystem services.
In contrast to Schouten
et al. [
76], we explicitly focus on exogenous parameters which vary over the simulation period and do not present the sensitivity of technical model parameters such as feed required per cow. However, we are aware that the model may be sensitive to these parameters, too. For example, the level of extensive land-use in our model also depends on the percentage of extensive biomass that can be consumed by a cow or sheep without reducing its output
i.e., the amount of milk or meat produced. Thus, additional sensitivity analysis may still be required before using our modeling approach to answer more specific research questions.
The sensitivity analysis of the abolition of animal based direct payments presented here reveals that the extent and the form of the direct payment scheme have an essential impact on land abandonment in our simulations. This is in line with other ABM studies addressing land abandonment in marginal areas [
41,
45,
88]. This finding also does not come as a surprise since Switzerland still provides some of the highest support for the agricultural sector worldwide [
89] and farm structural change has been slow compared to other European alpine regions [
28,
90]. More importantly, however, our sensitivity analysis shows that an increase in opportunity costs leads to different simulation outputs for cattle in the two model versions if animal payments are abolished. The assessment of policy measures is thus sensitive to the chosen modeling approach and parameterization. This supports the importance of testing model sensitivity to different levels of opportunity costs. In addition, the extent of land abandonment in the aggregated model ALUAM was always more pronounced compared to the agent-based model version due to higher flexibility in shifts between production activities. This reflects the constraint development within an agent-based model framework which results in more diversified production patterns compared to a purely normative based optimization (see
Section 3.3). In our sensitivity analysis, we did not show the spatially explicit consequences of land abandonment as presented in other studies [
7,
43,
44]. For the aggregated model, this has been shown in Briner
et al. [
16,
48]. The agent-based model allows for a more realistic spatially explicit representation of land abandonment in the short and medium term, as it better captures the diversity of decision-making in mountain farming. Combined with consistent scenario analysis [
91] mountain-specific future developments of land abandonment, re-forestation and ecosystem services can be simulated and compared to other mountain regions such as the Jura mountains [
45].


