
Shaking Table Test on the Tunnel Dynamic Response under Different Fault Dip Angles


Abstract
:1. Introduction
2. Experimental Equipment
2.1. Shaking Table
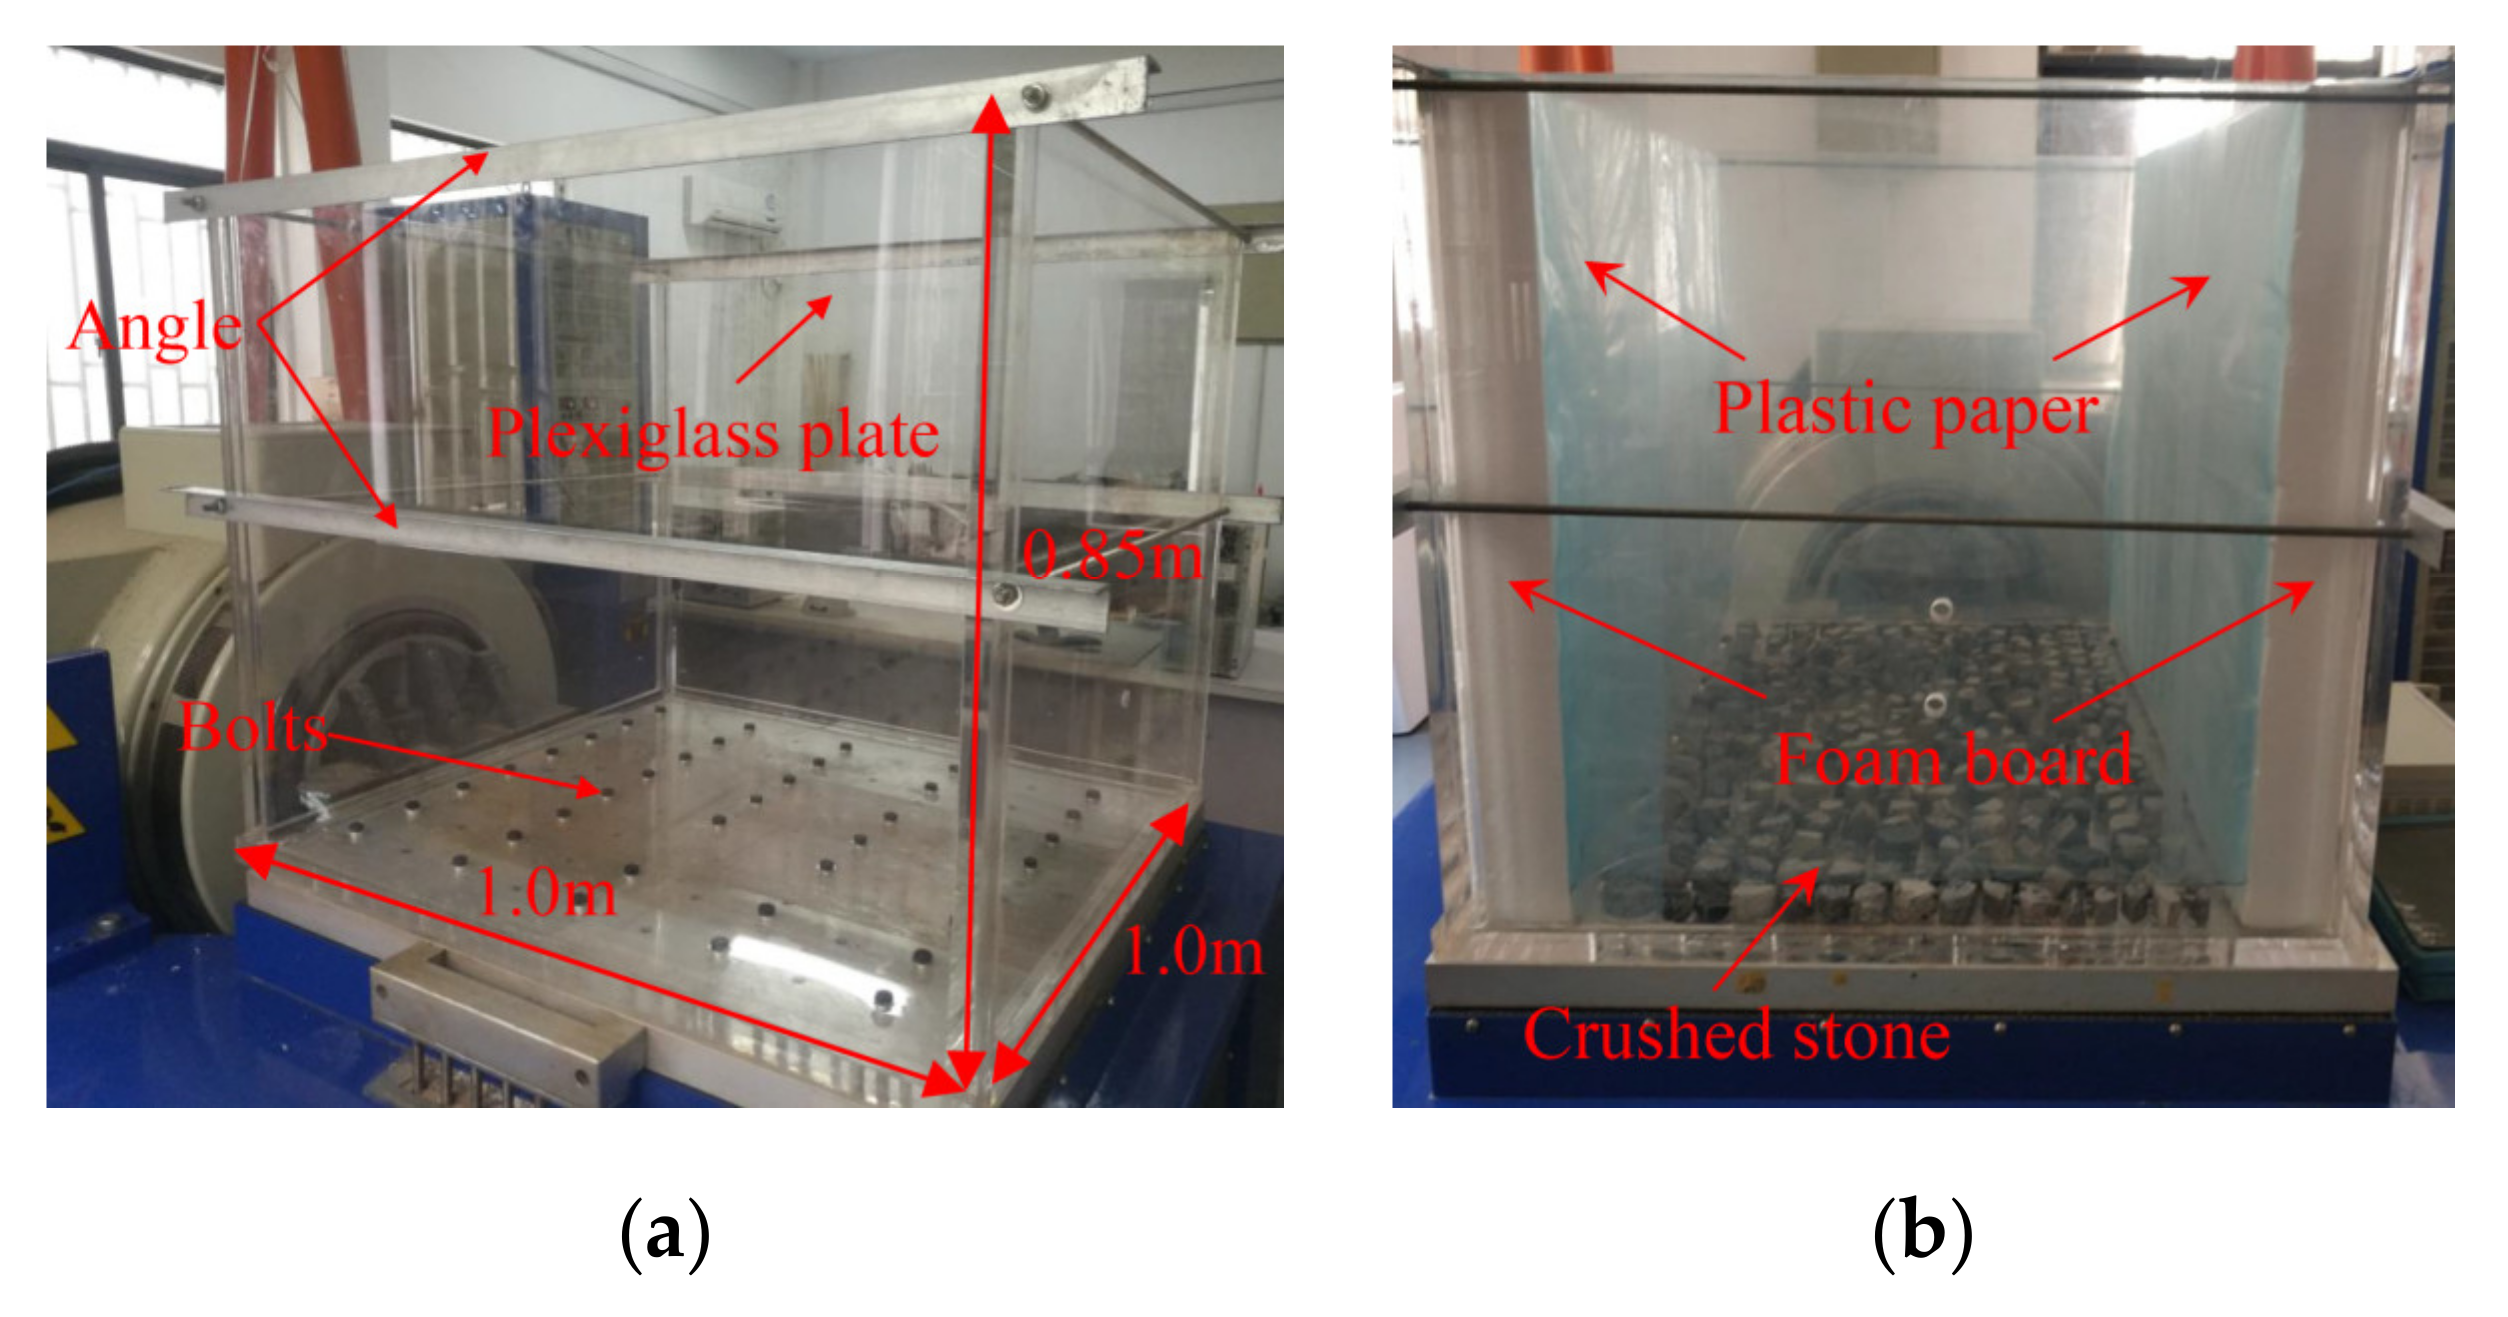
2.2. Model Box
3. Shaking Table Test
3.1. Tunnel Prototype
3.2. Design of the Similitude Relation
3.3. Model Materials
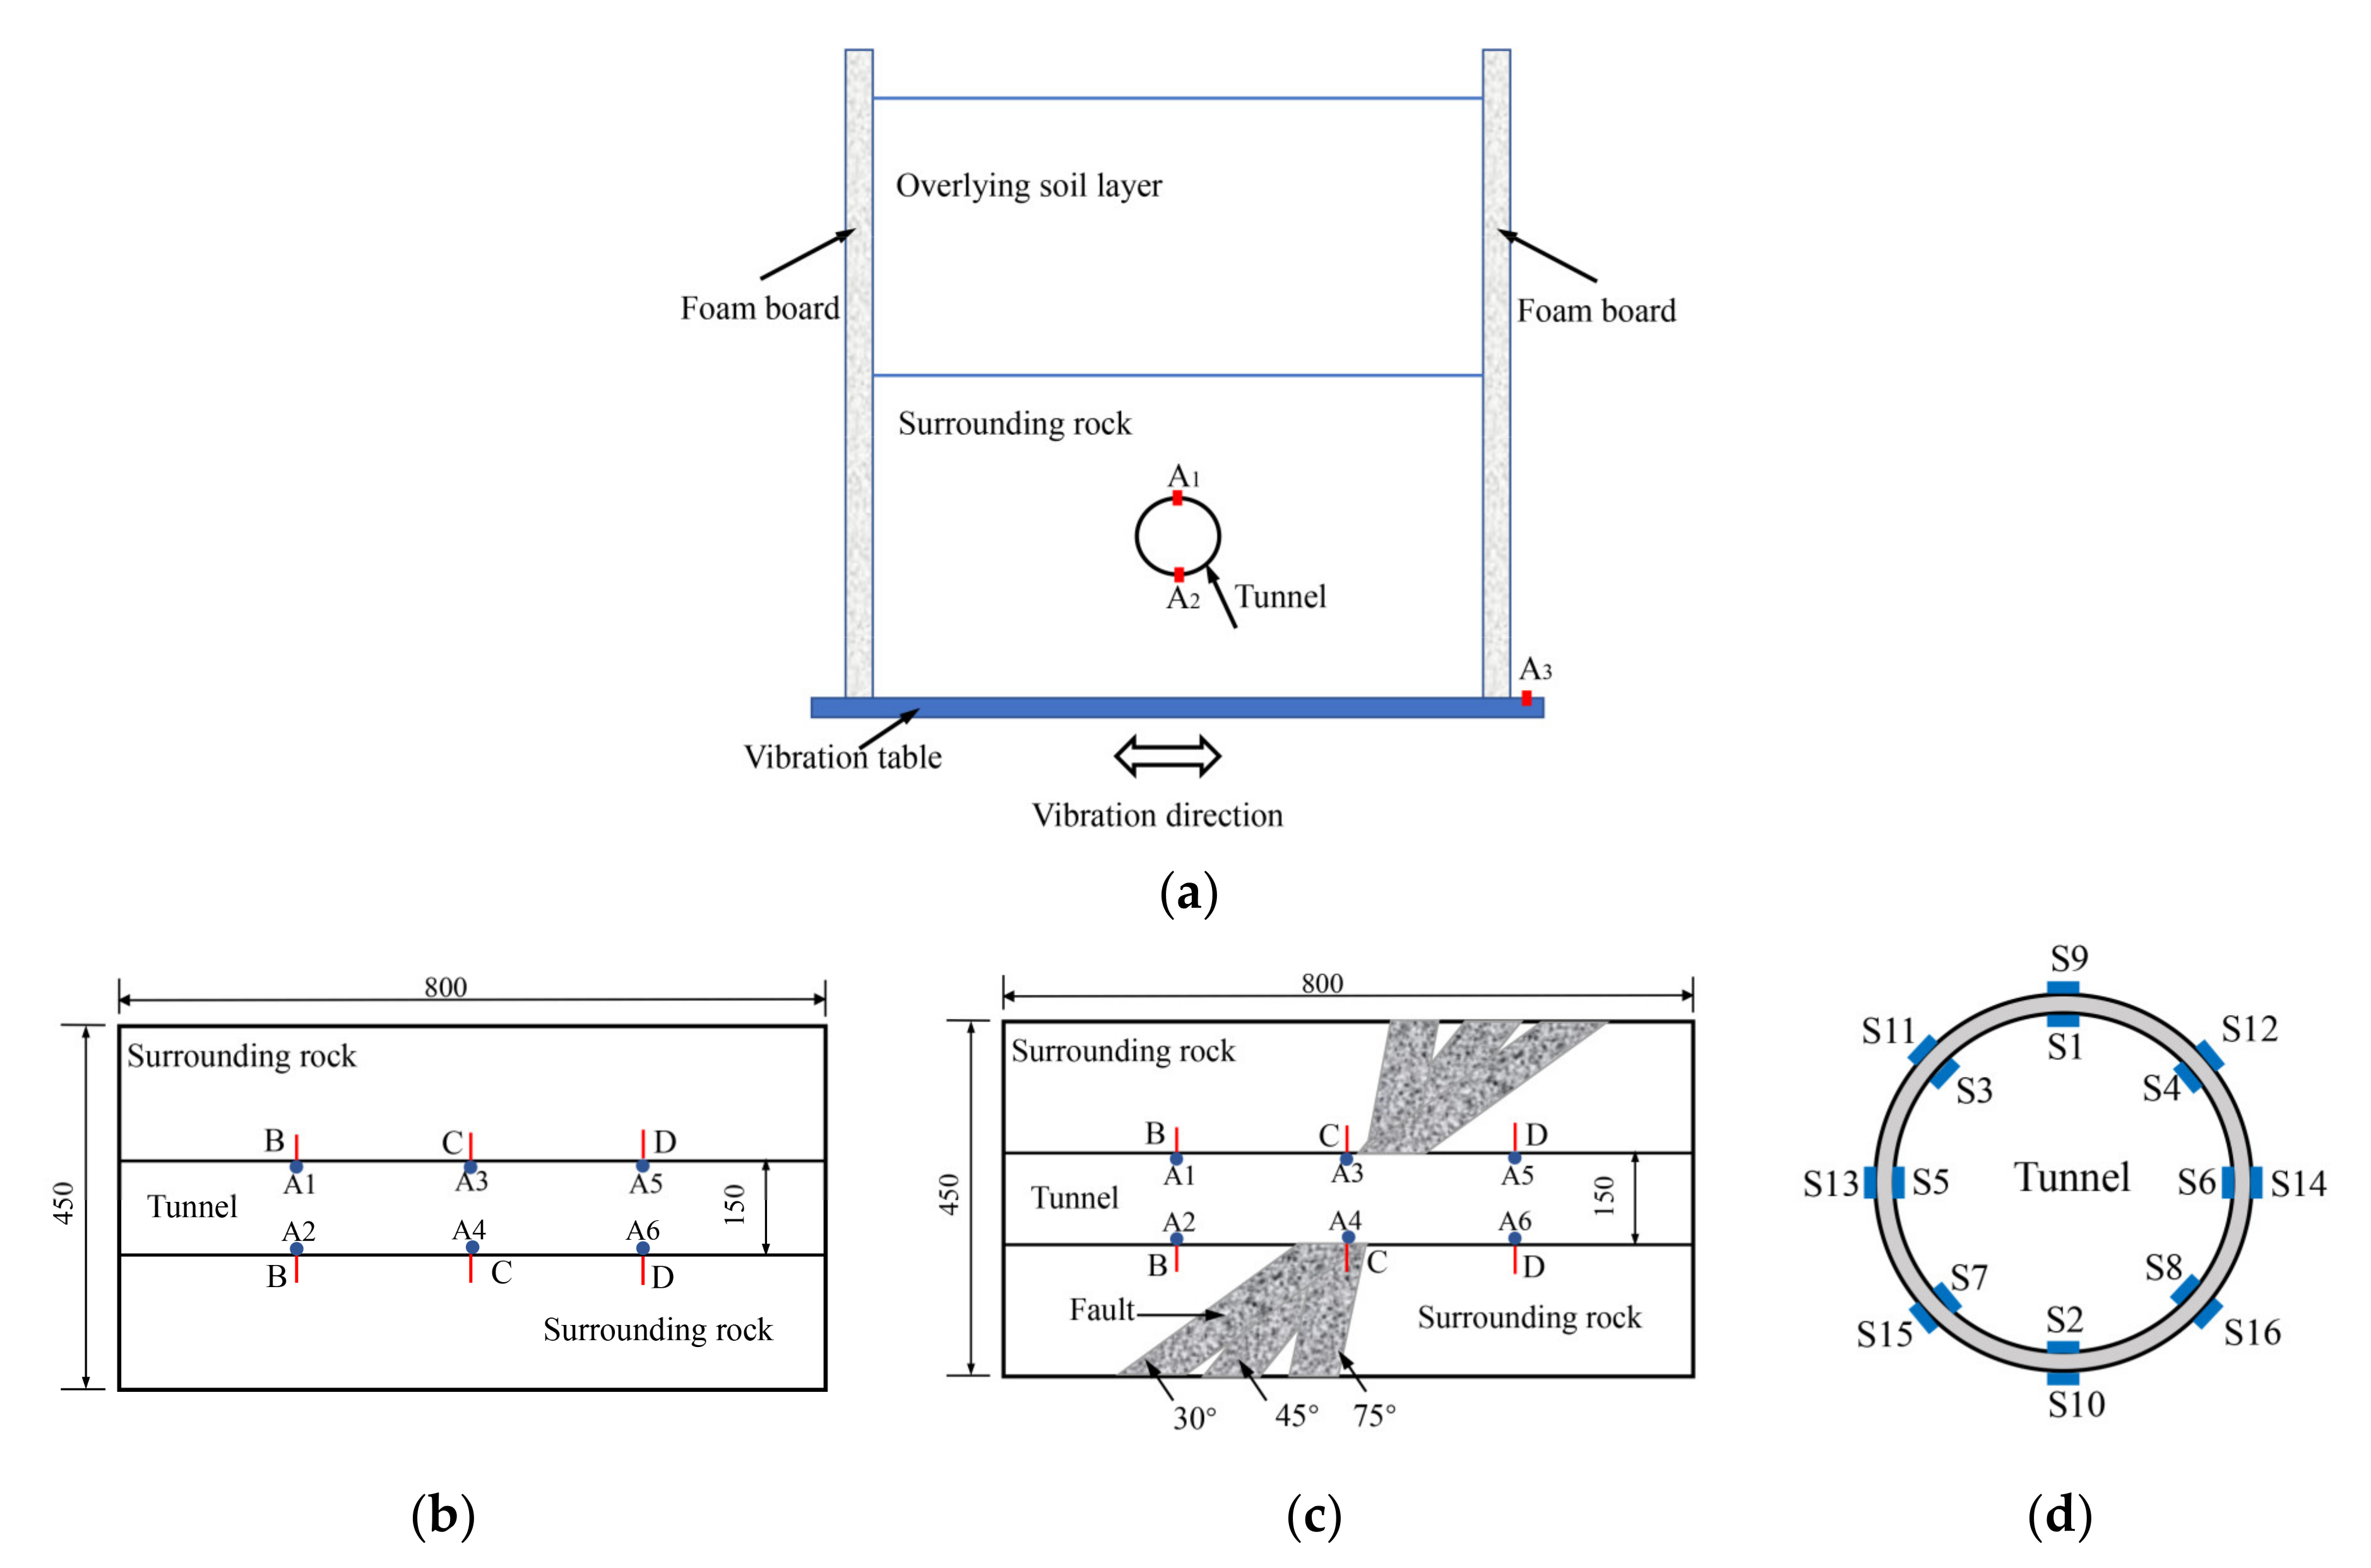
3.4. Sensor Layout
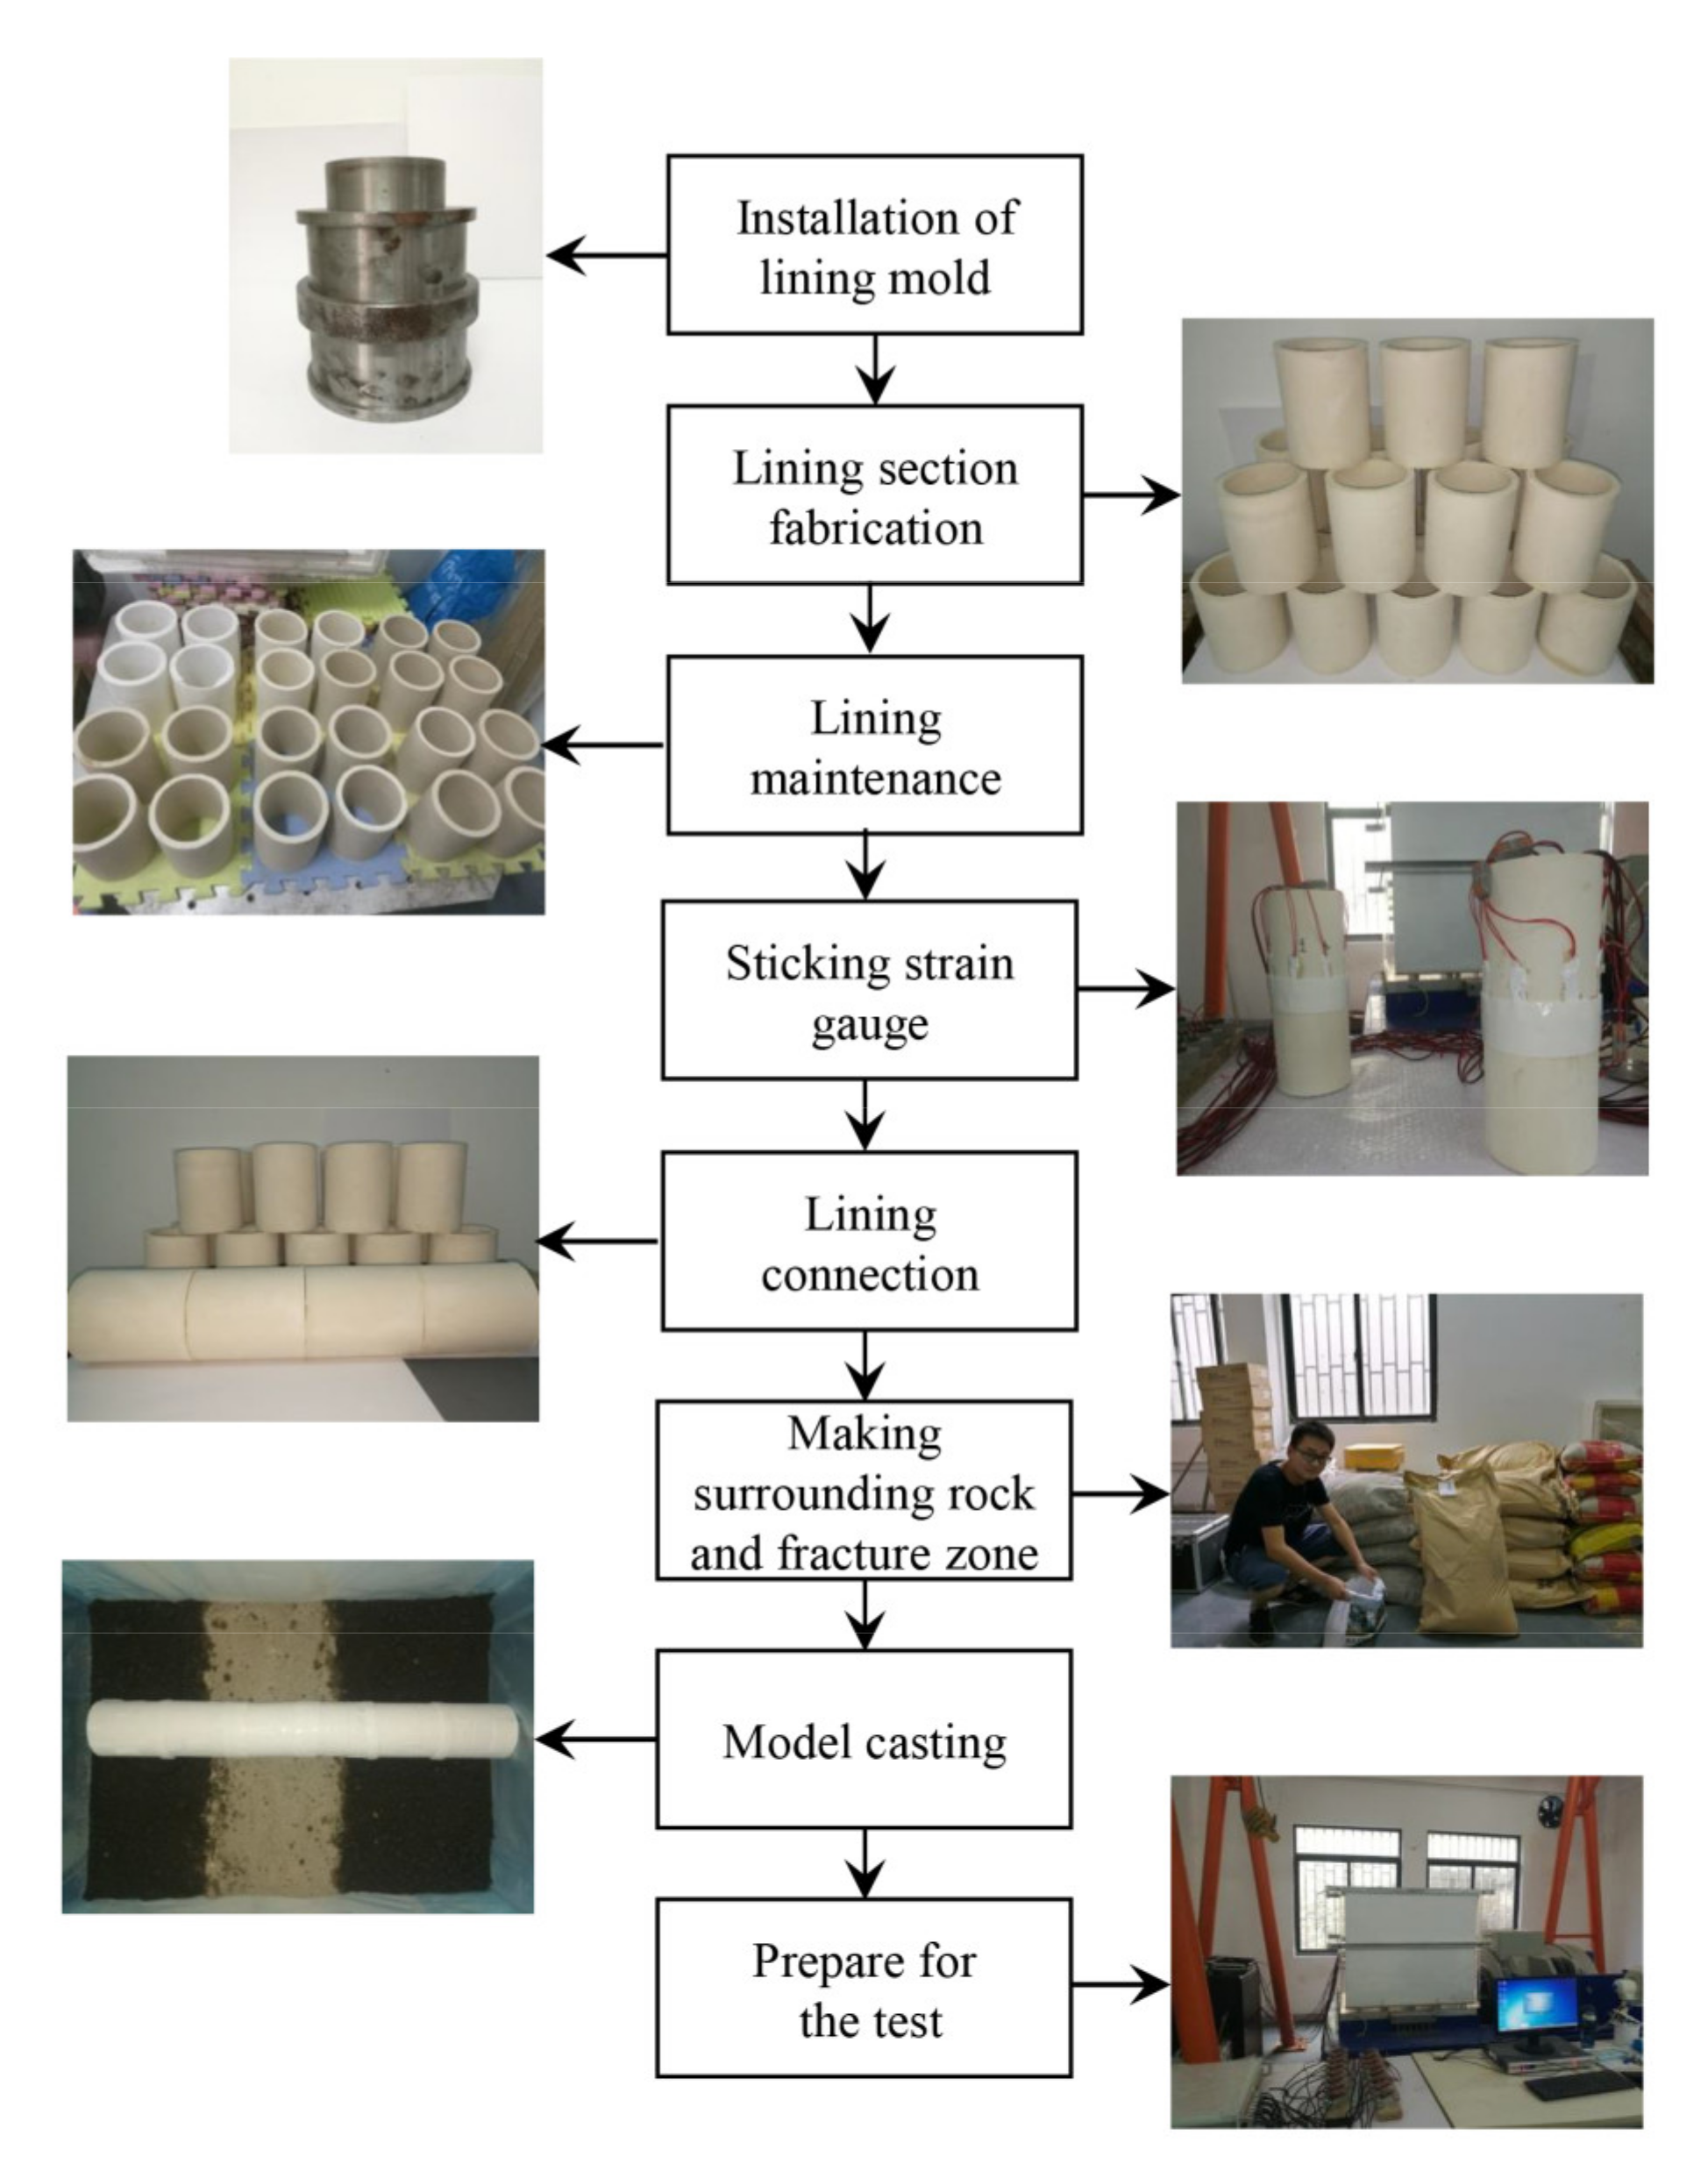
3.5. Model Fabrication
3.6. Test Schemes
4. Test Results
4.1. Boundary Effect
4.2. Acceleration Response
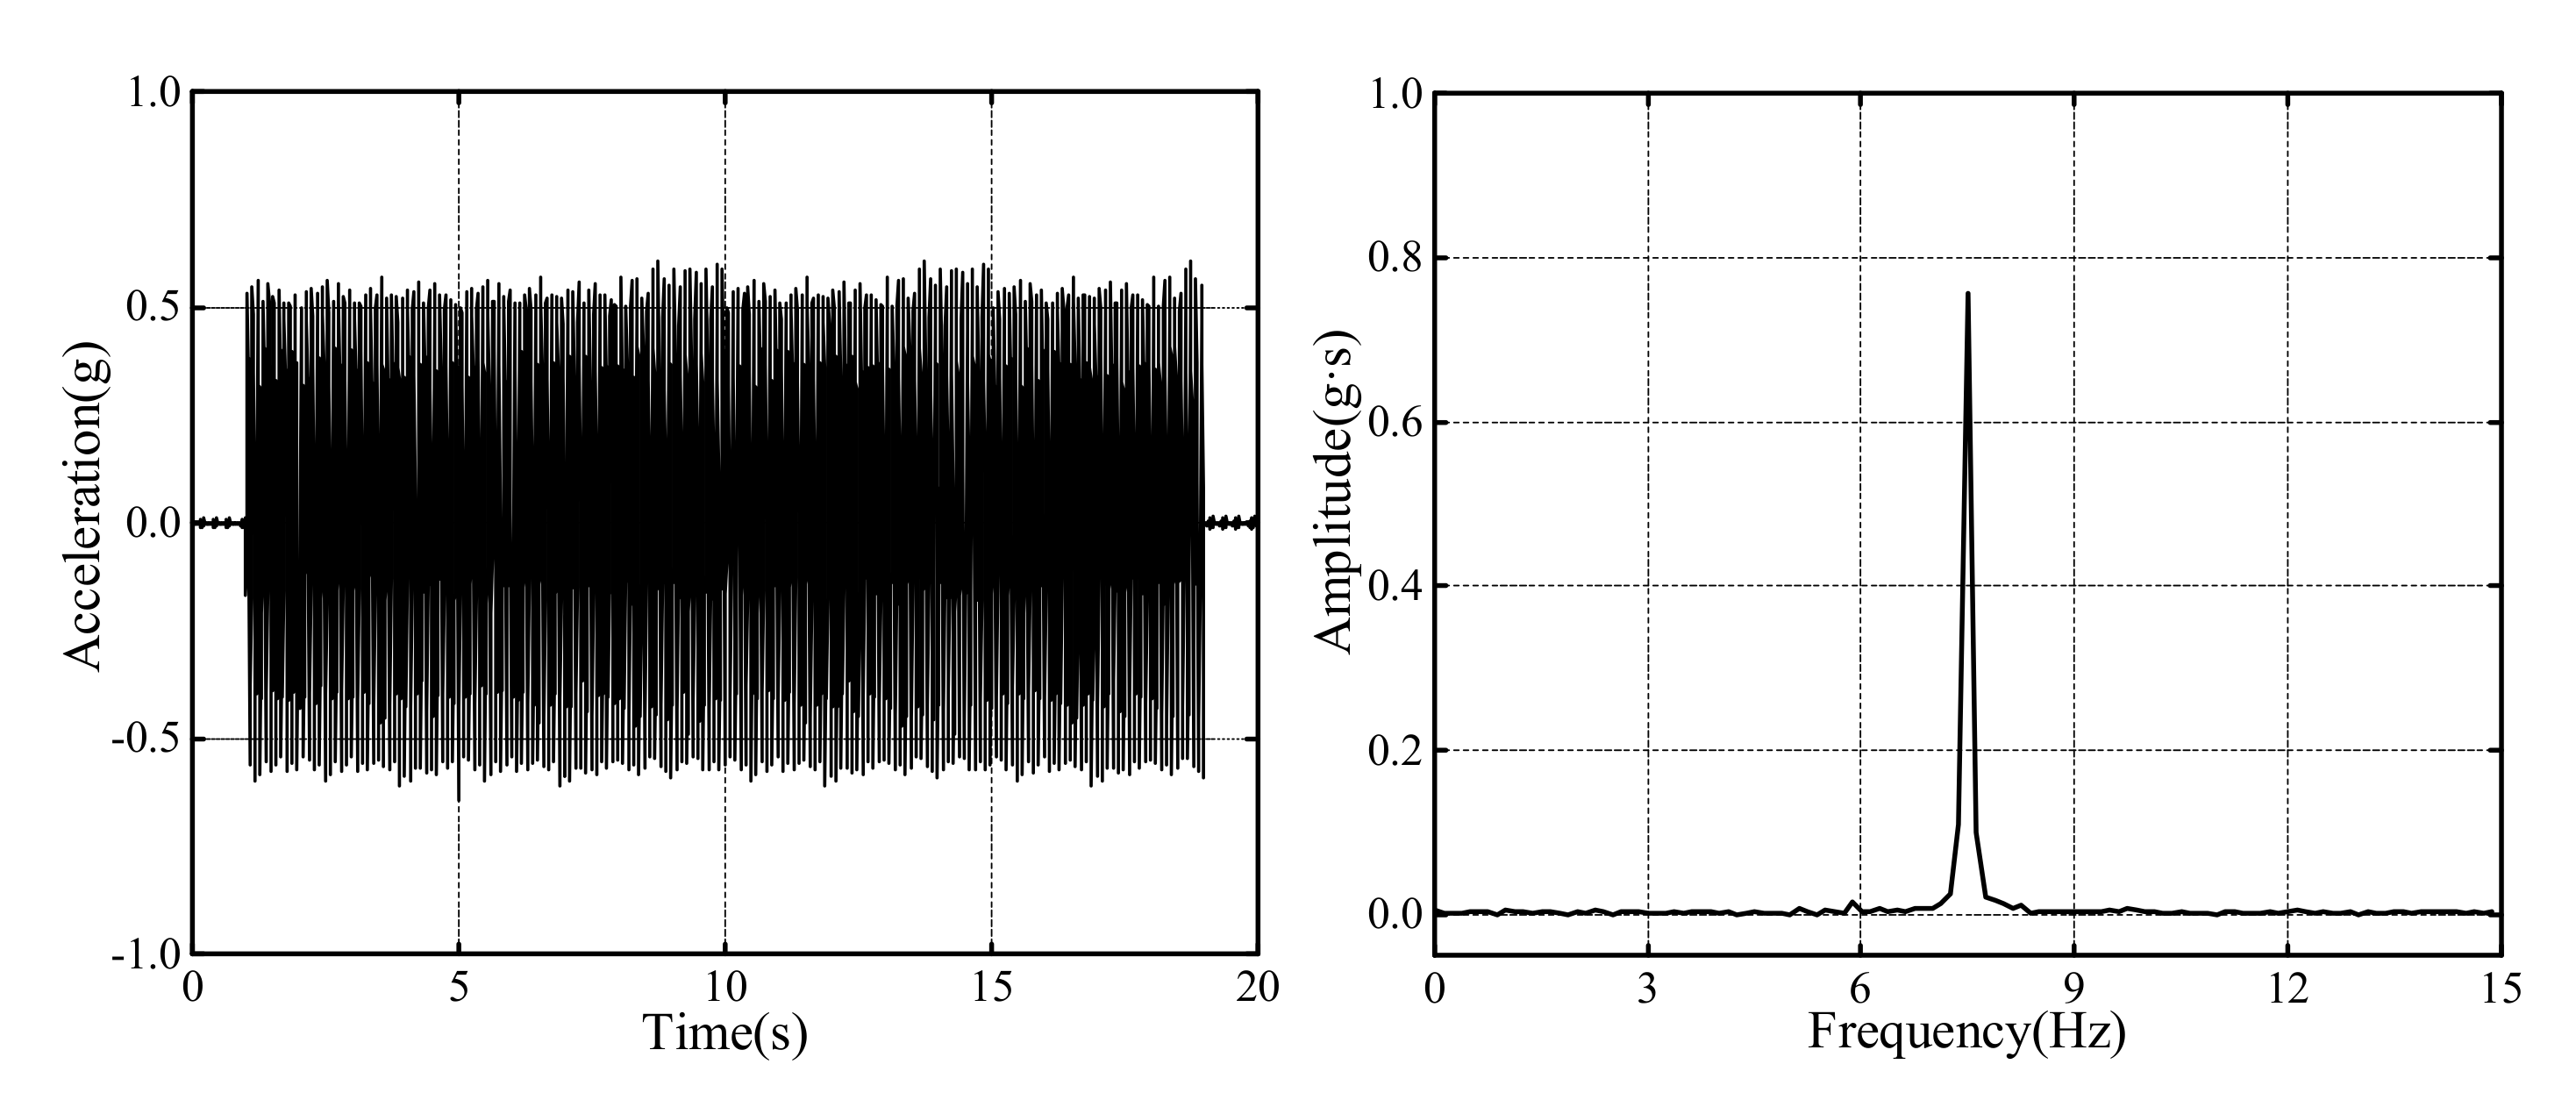
4.2.1. Acceleration Time History
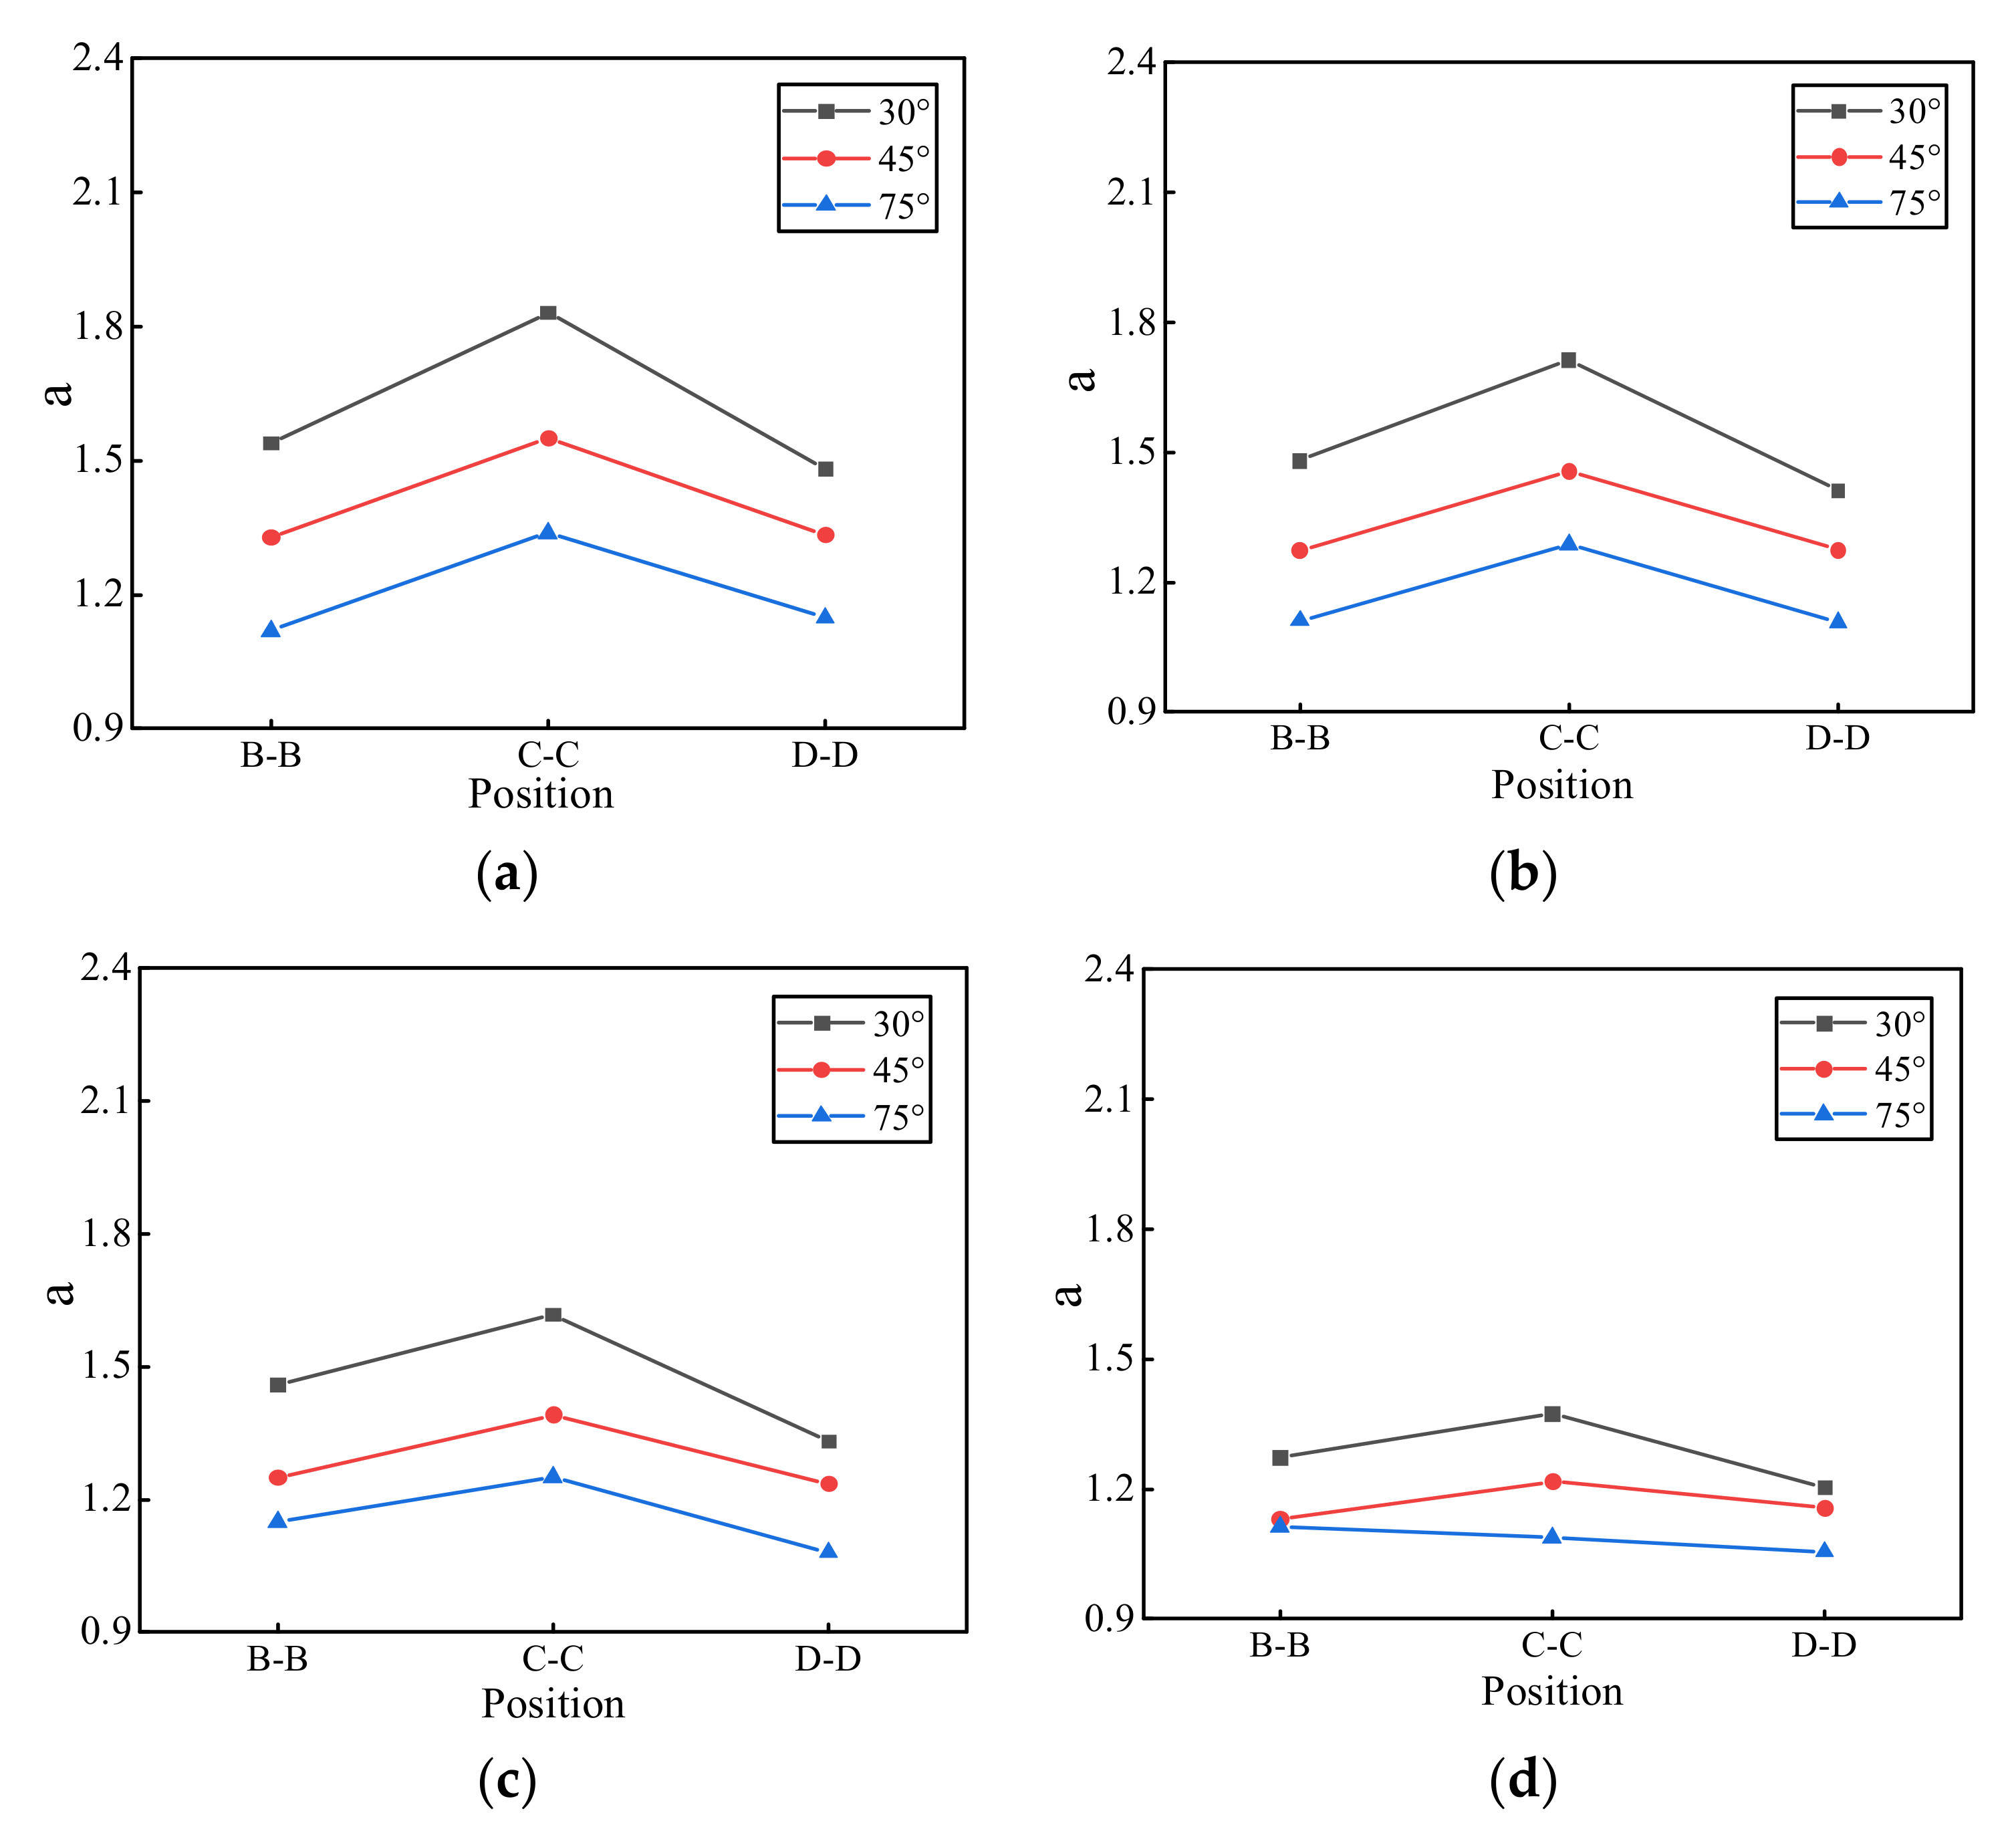
4.2.2. Peak Acceleration
4.3. Strain Response
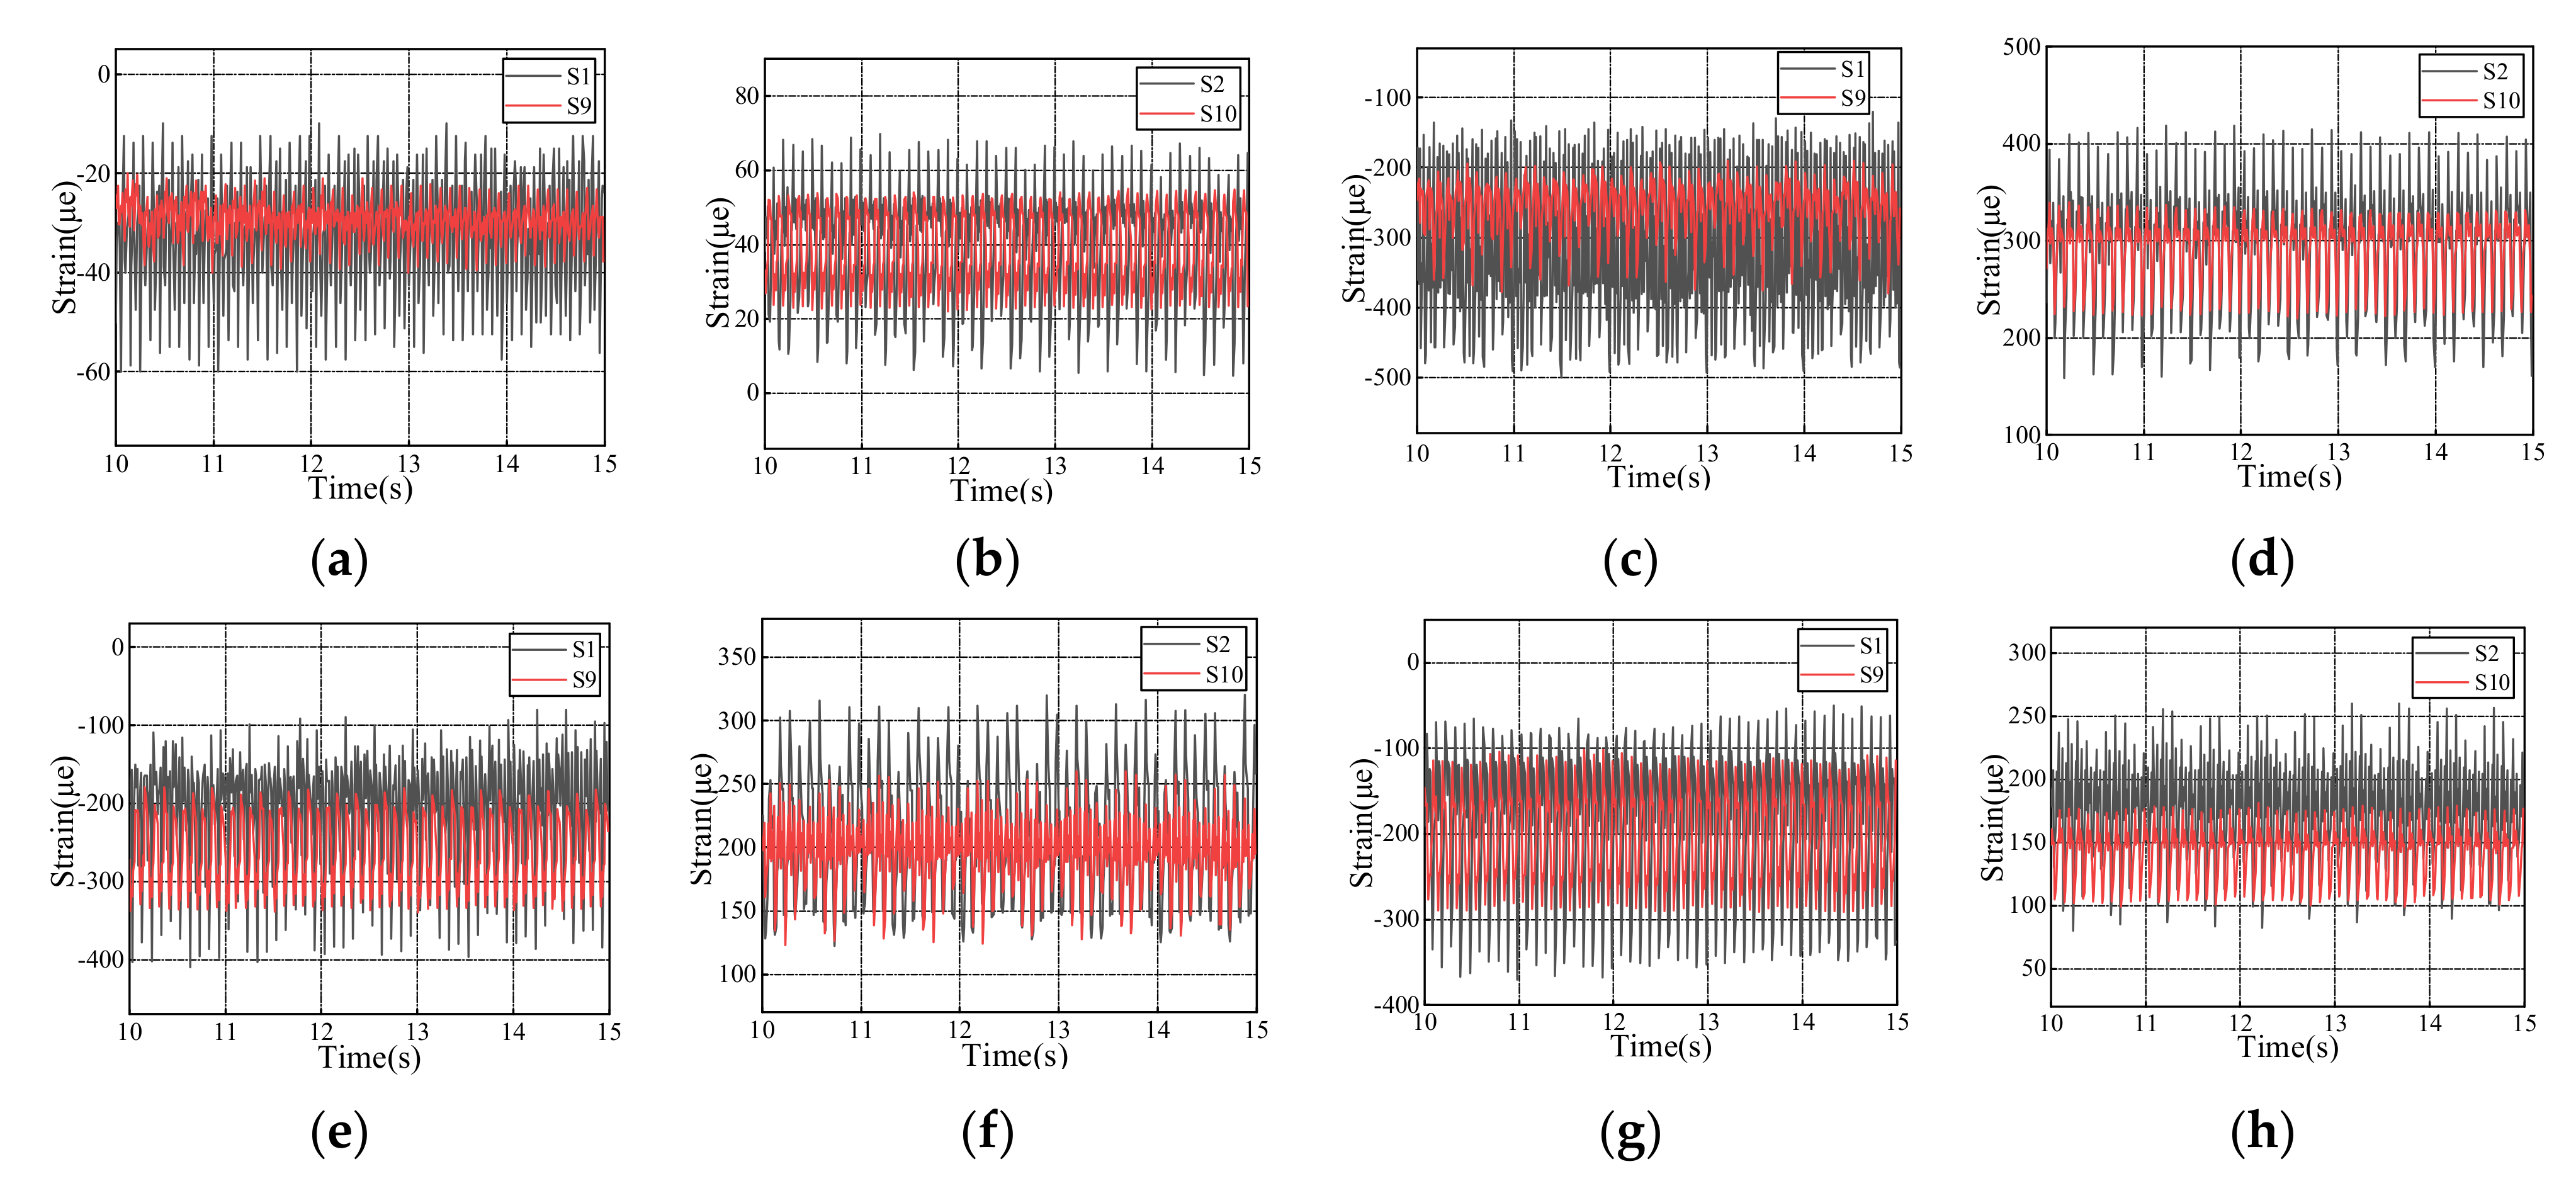
4.3.1. Dynamic Strain
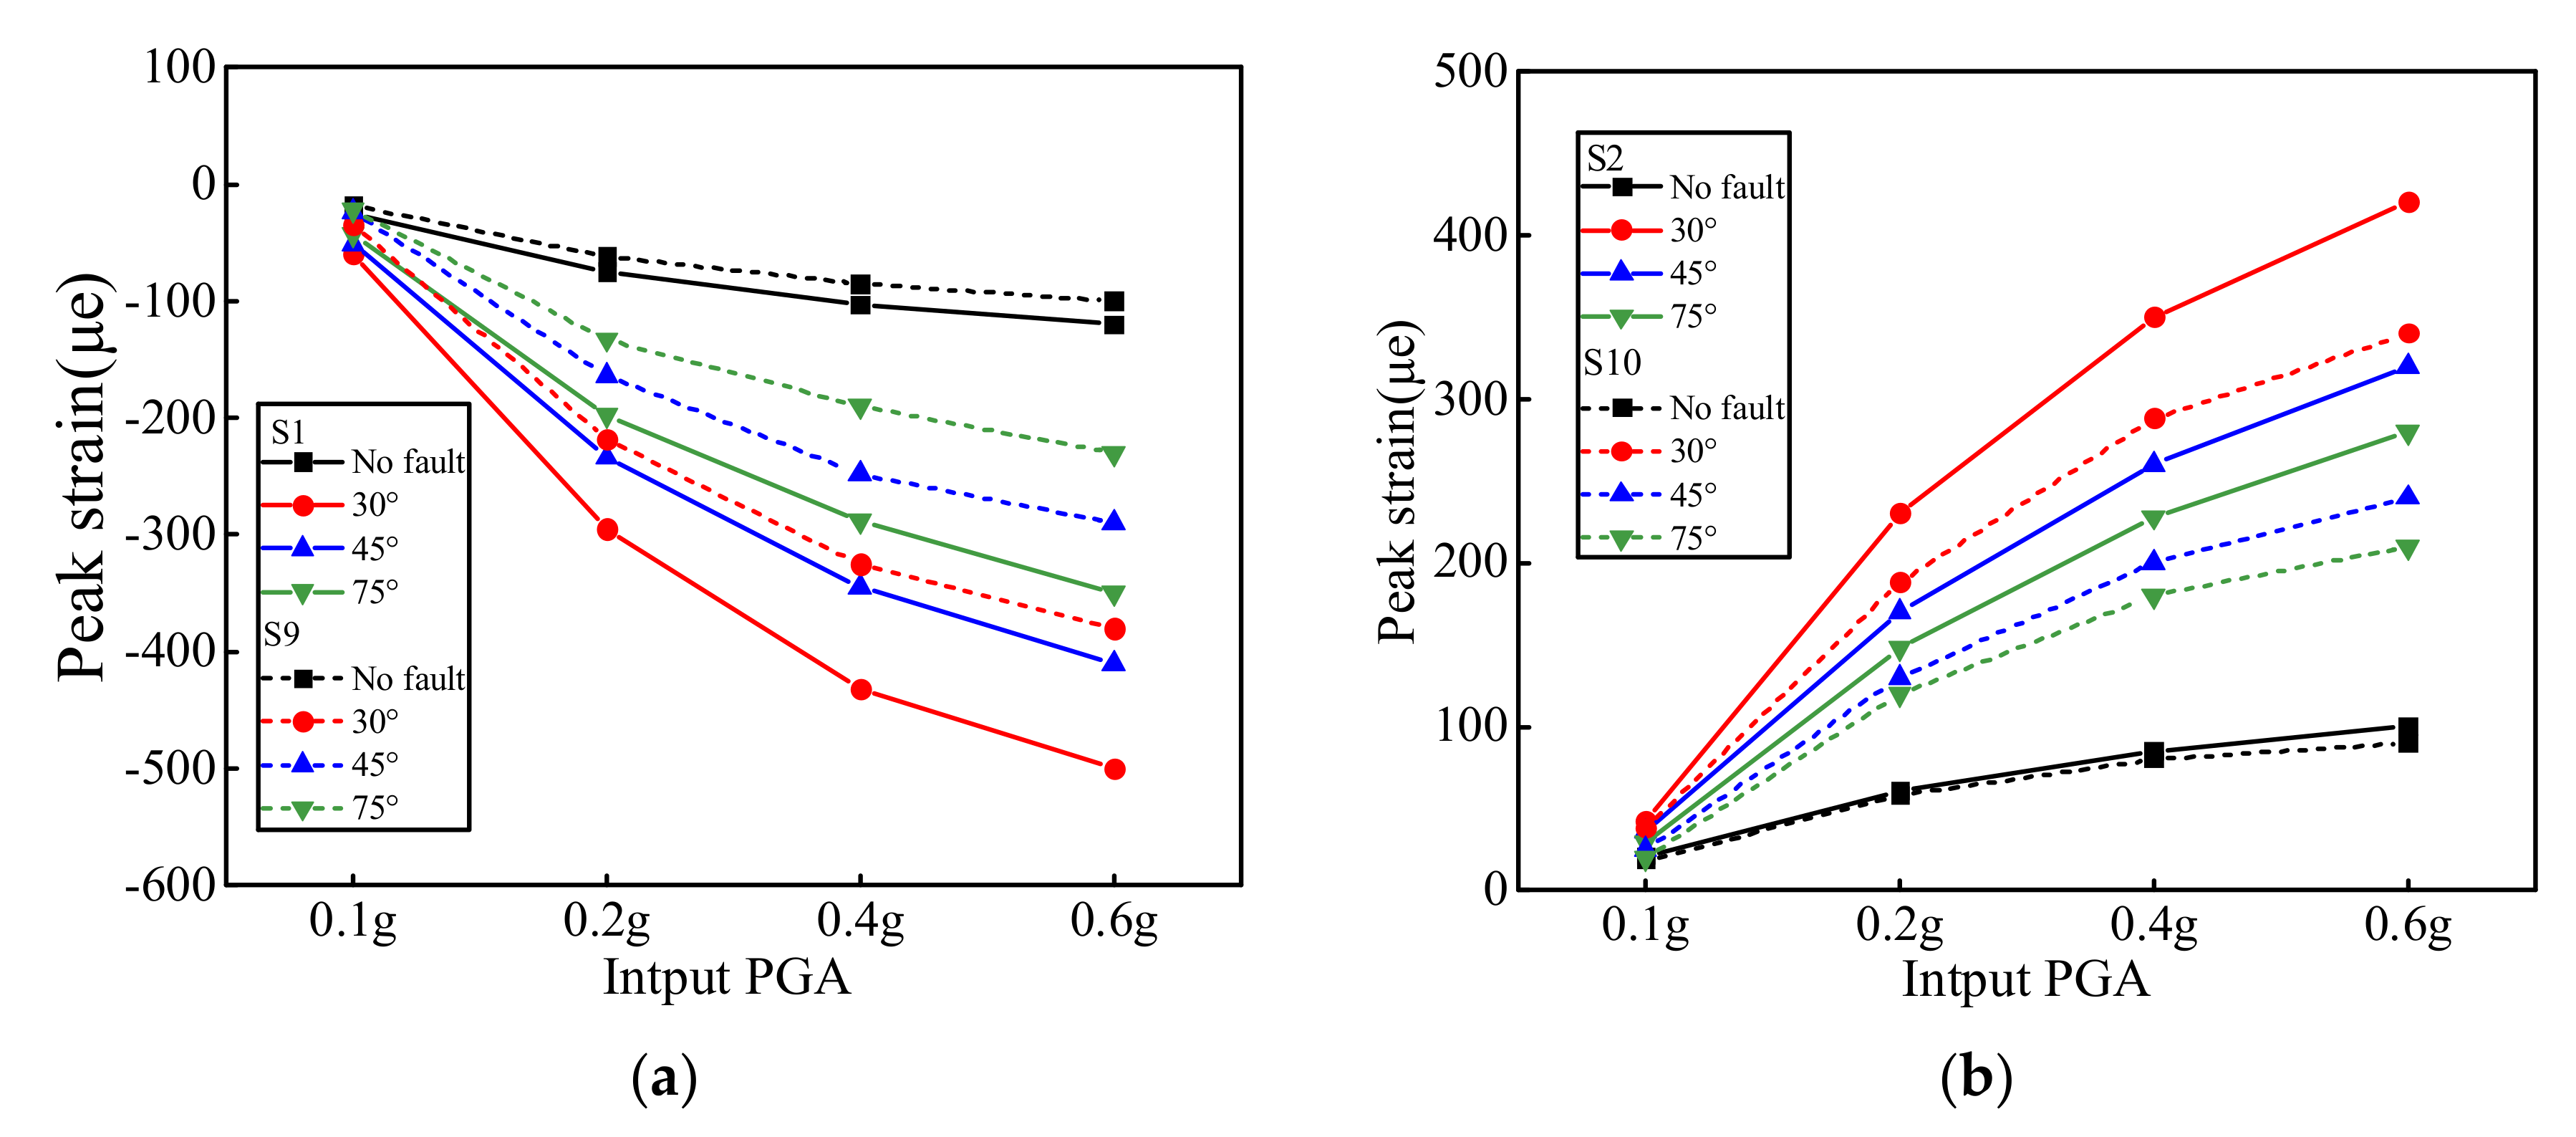
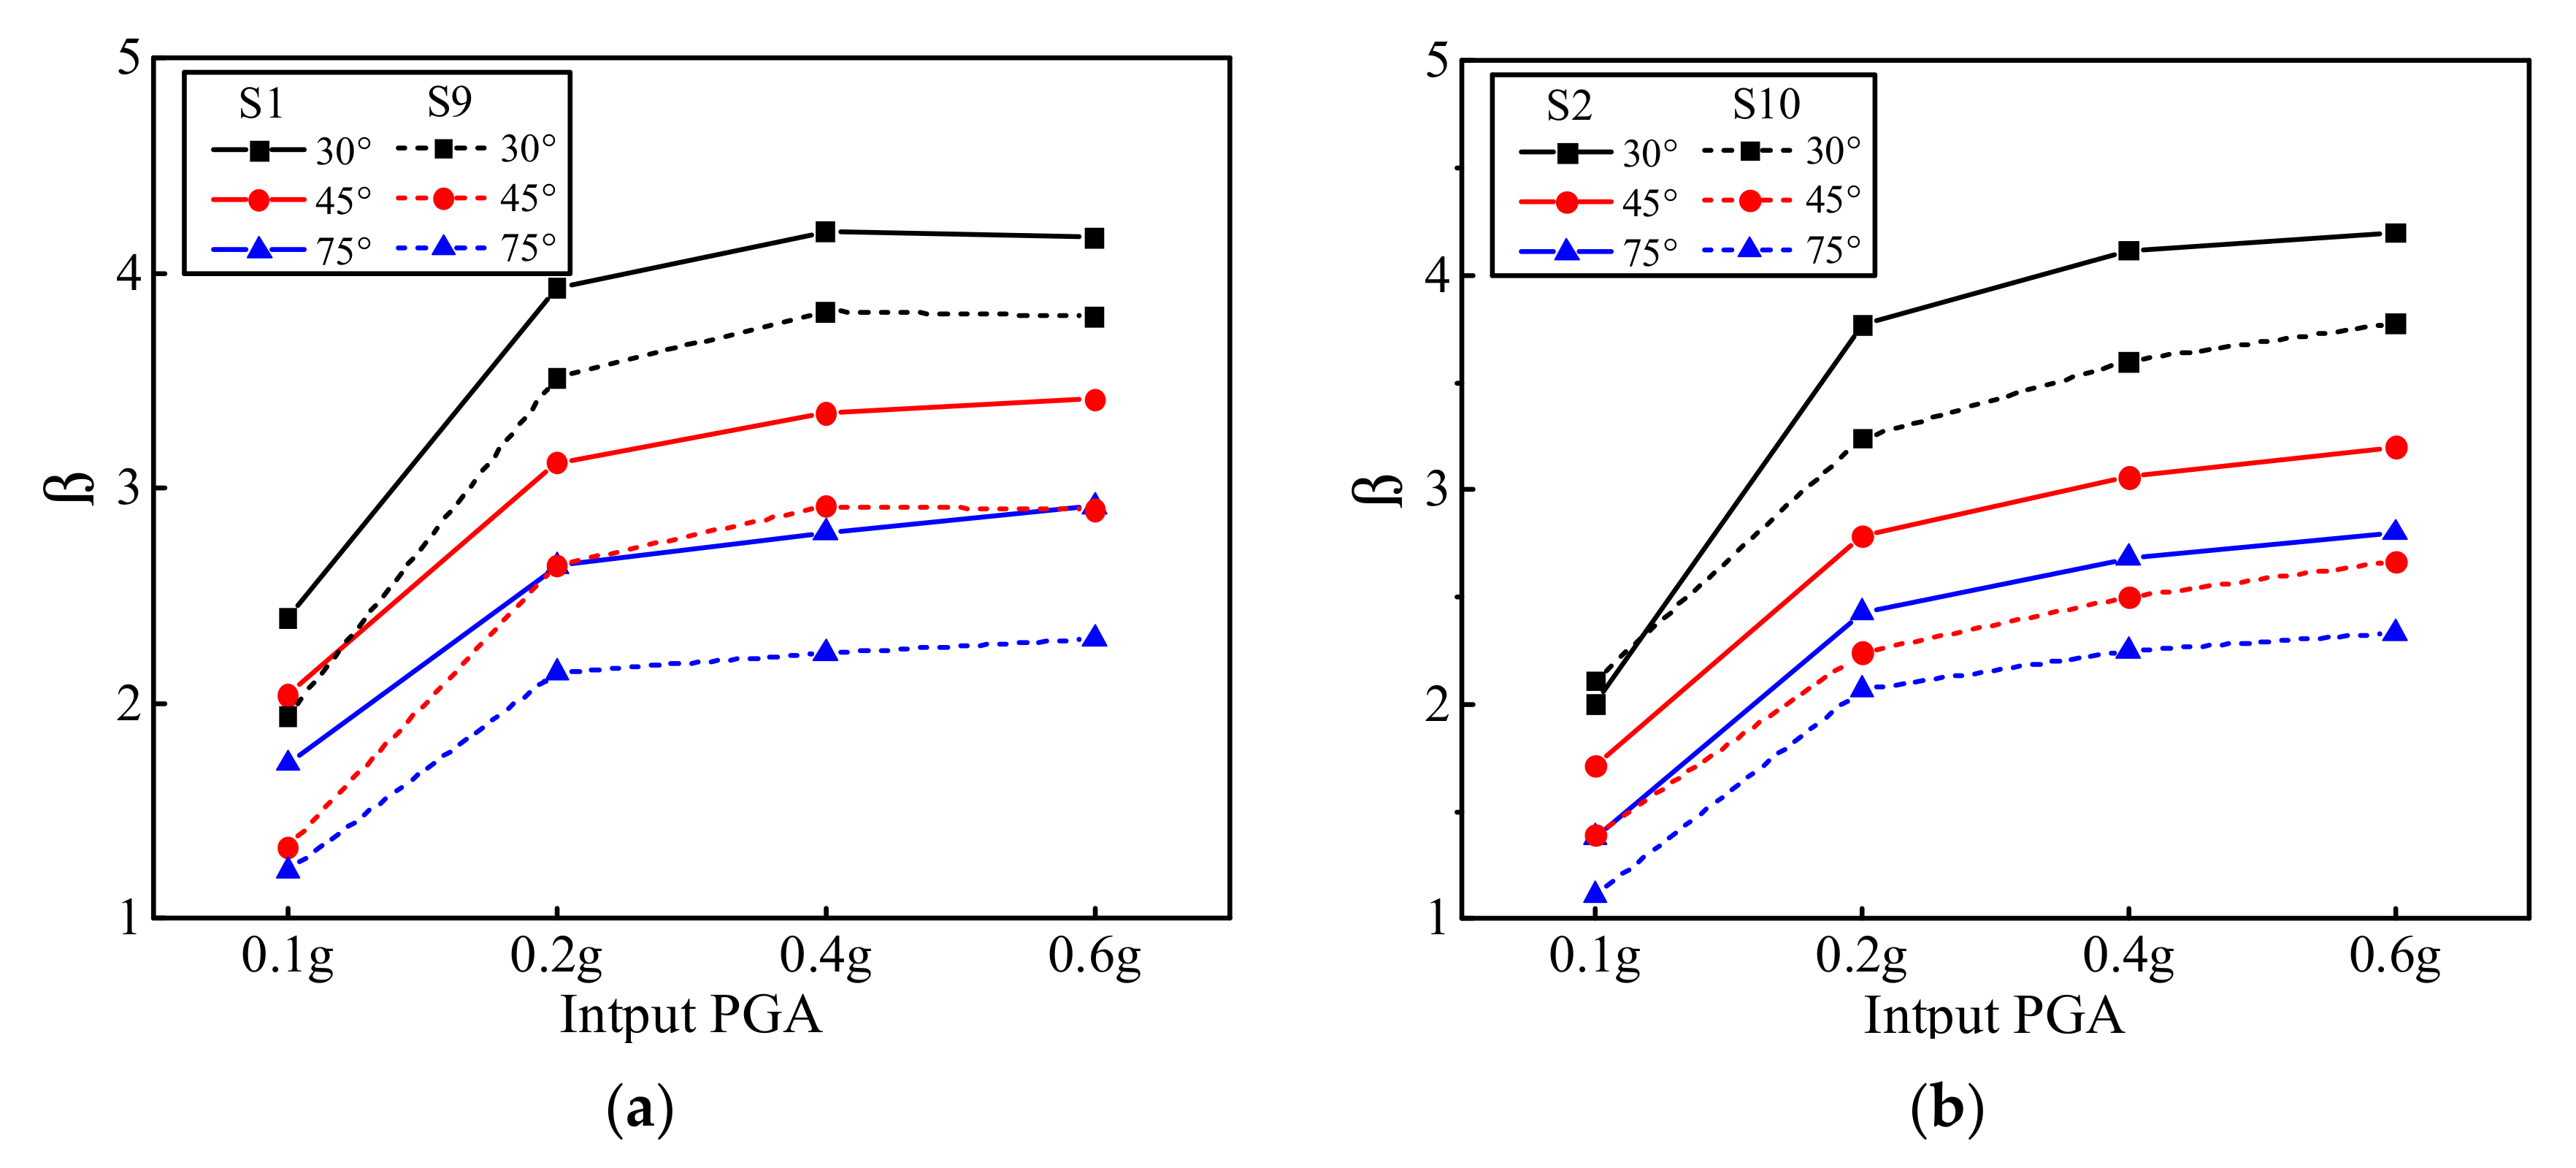
4.3.2. Peak Strain
5. Conclusions
- (1)
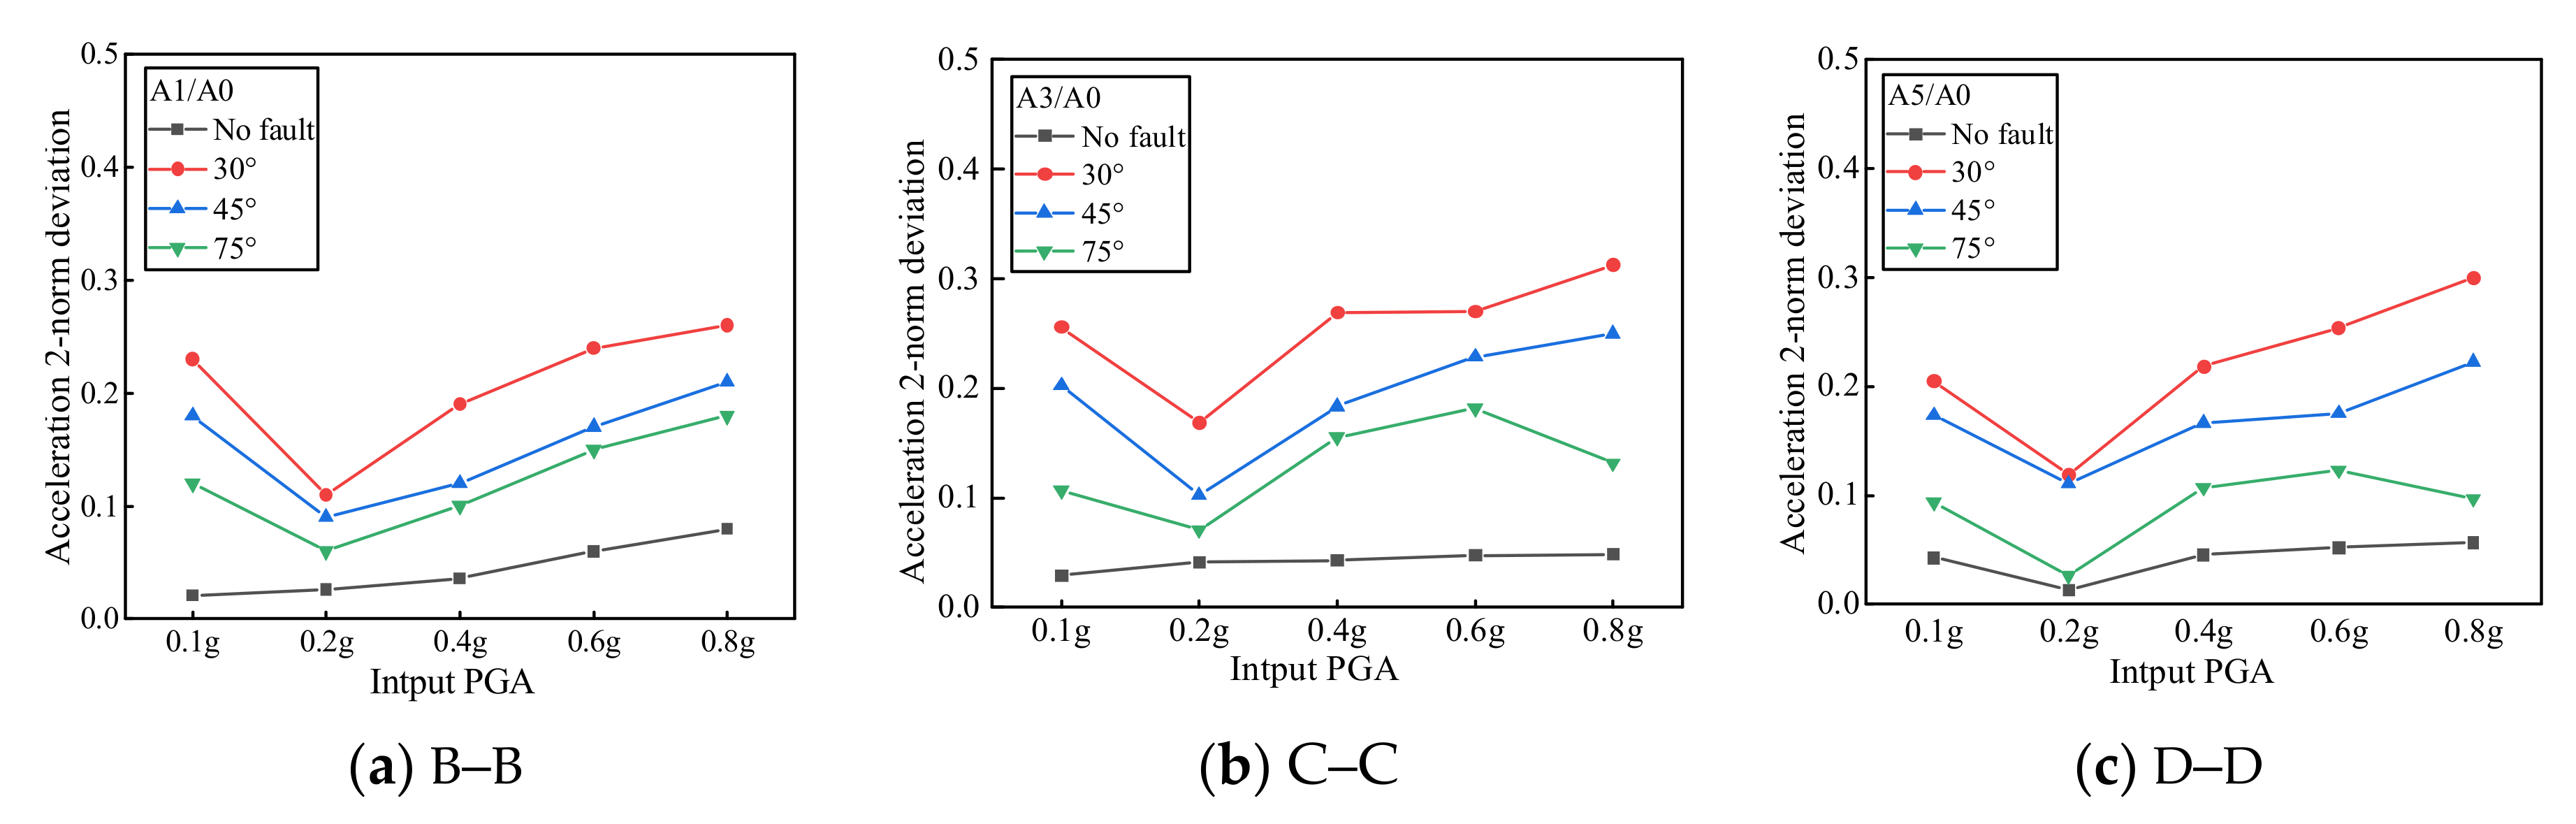
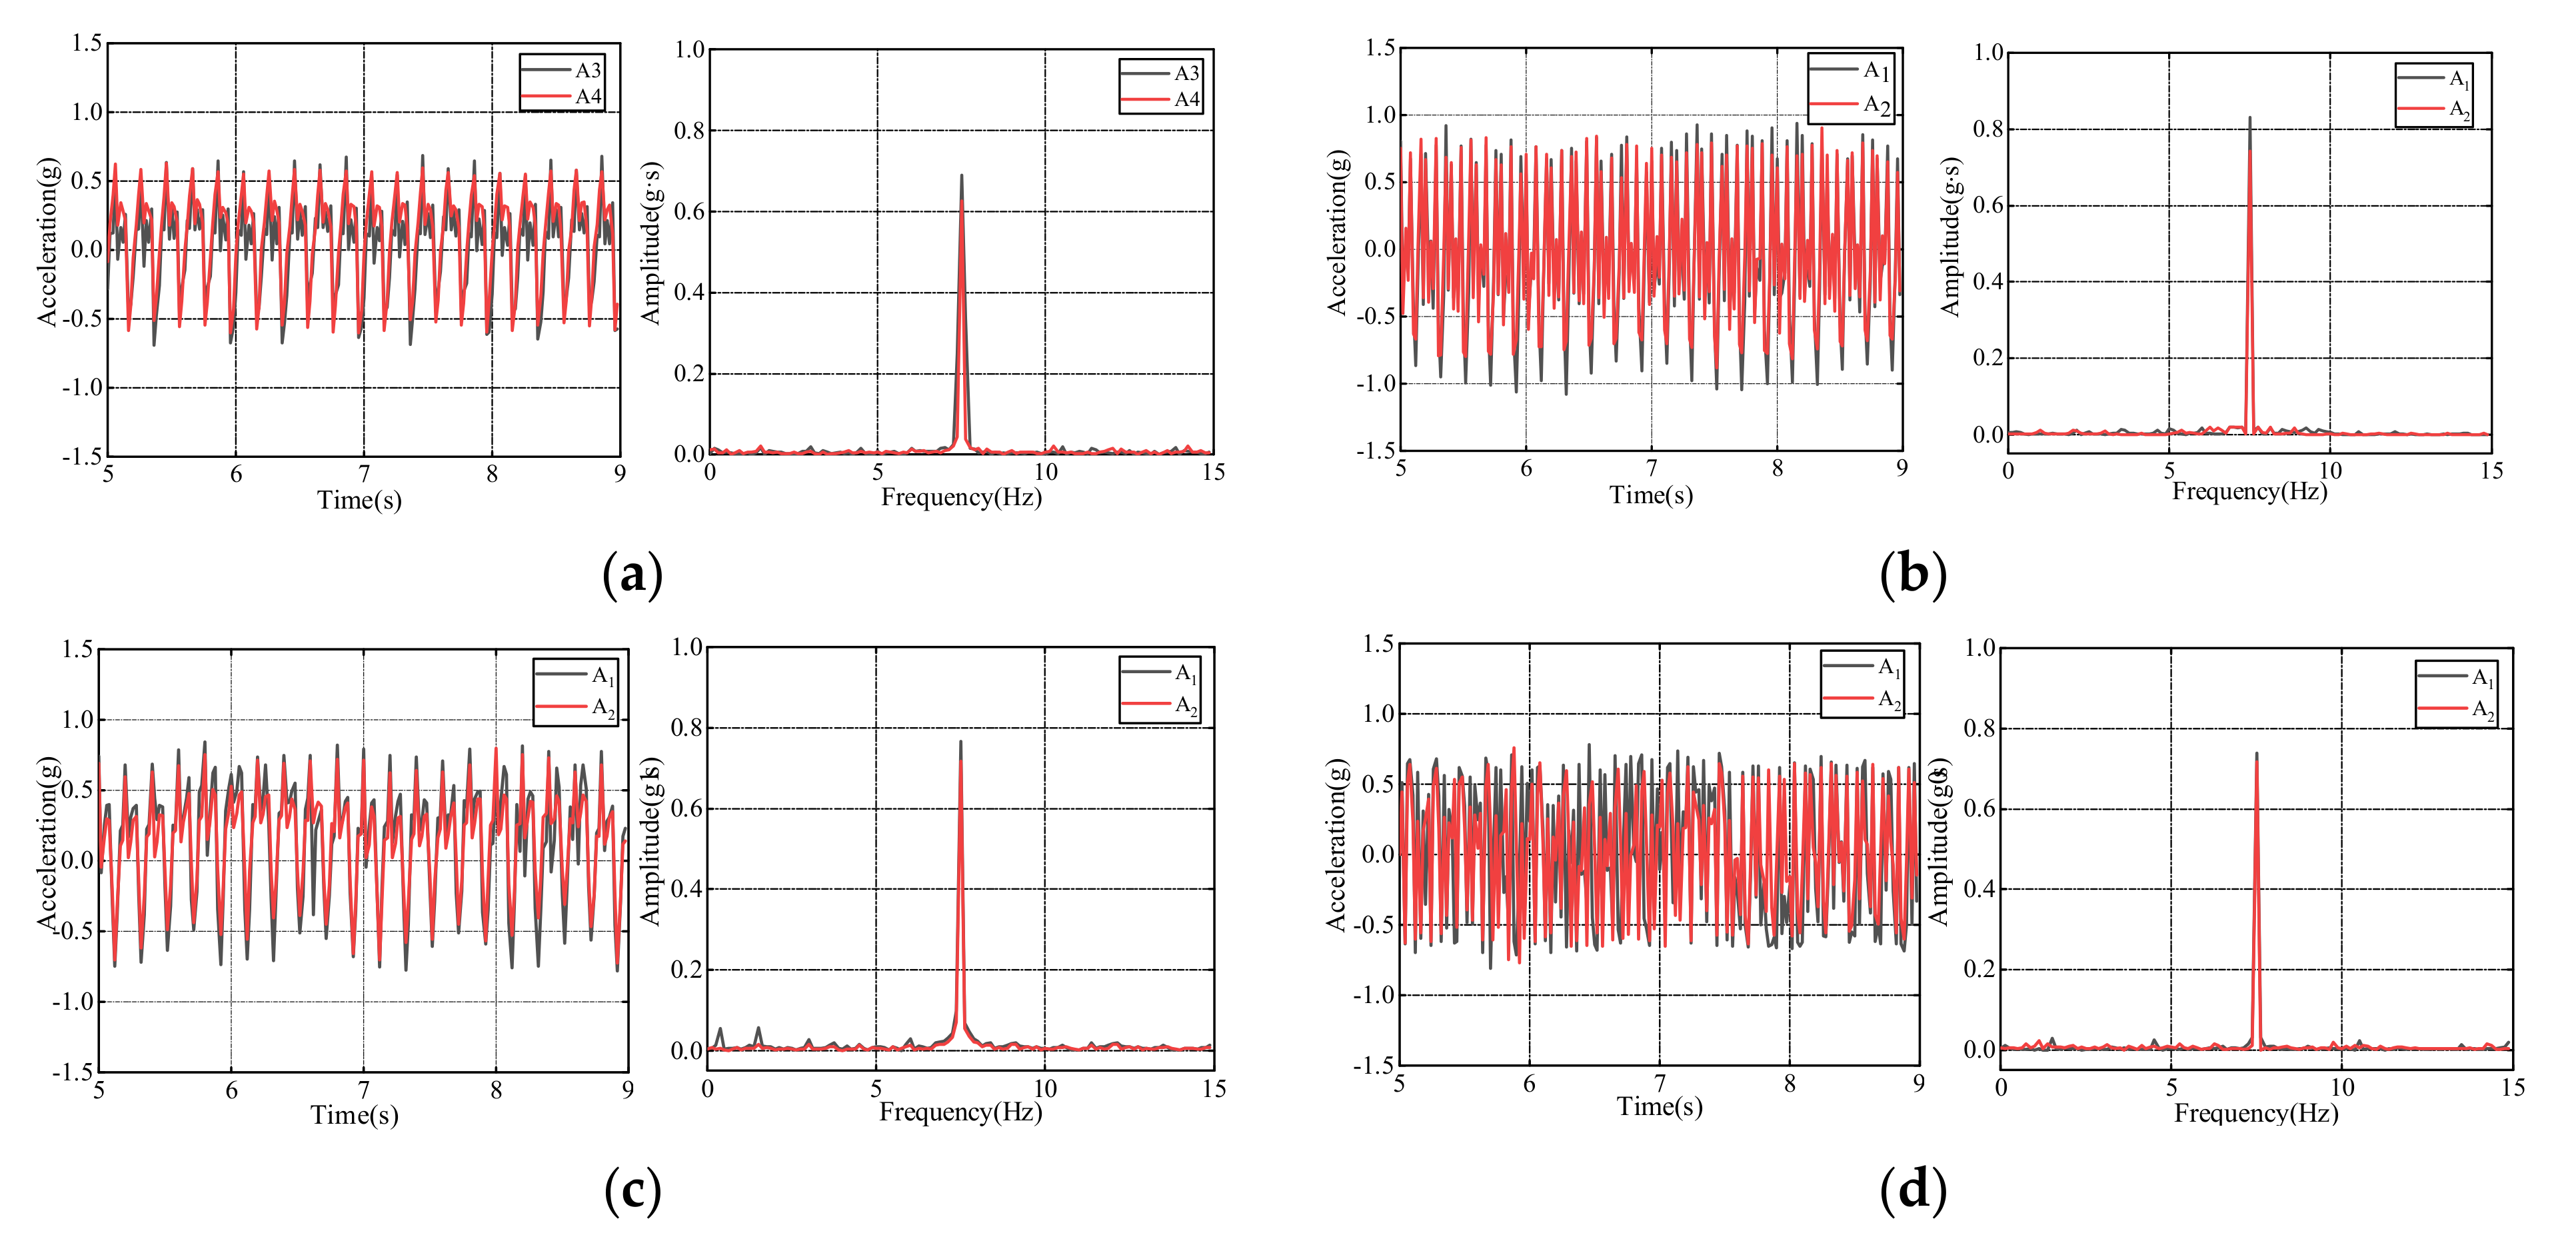
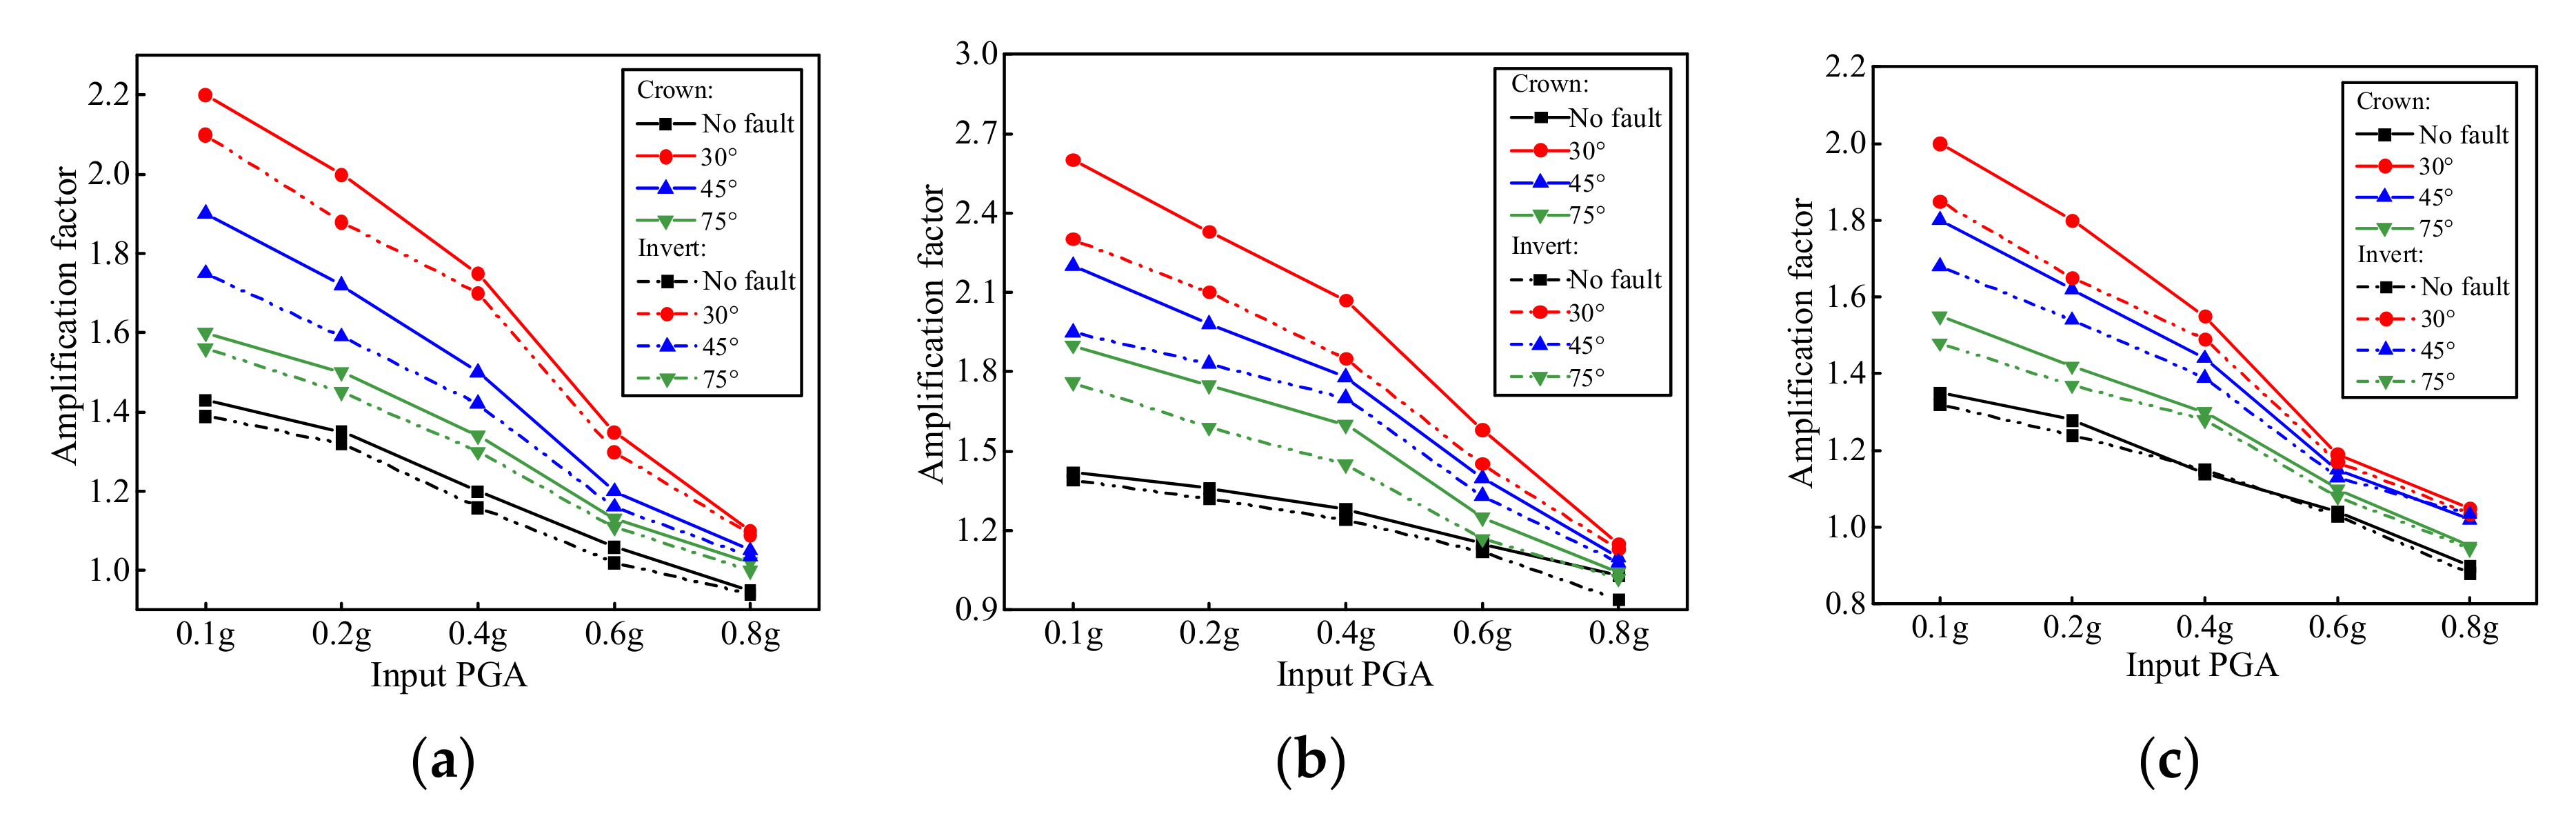
- Compared with the ordinary tunnel, the acceleration fluctuation law of the tunnel under different fault inclination angles was similar, and the main frequency of vibration was the same as the input frequency. However, the fault–crossing tunnels had a significant amplification effect on acceleration, and the dip angle of different faults differed. When the dip angle was 30°, the acceleration amplification factor was the largest, 45° was in the middle, and 75° was the smallest, indicating that the fault intensifies the acceleration amplification: the smaller the fault dip, the more significant the amplification effect.
- (2)
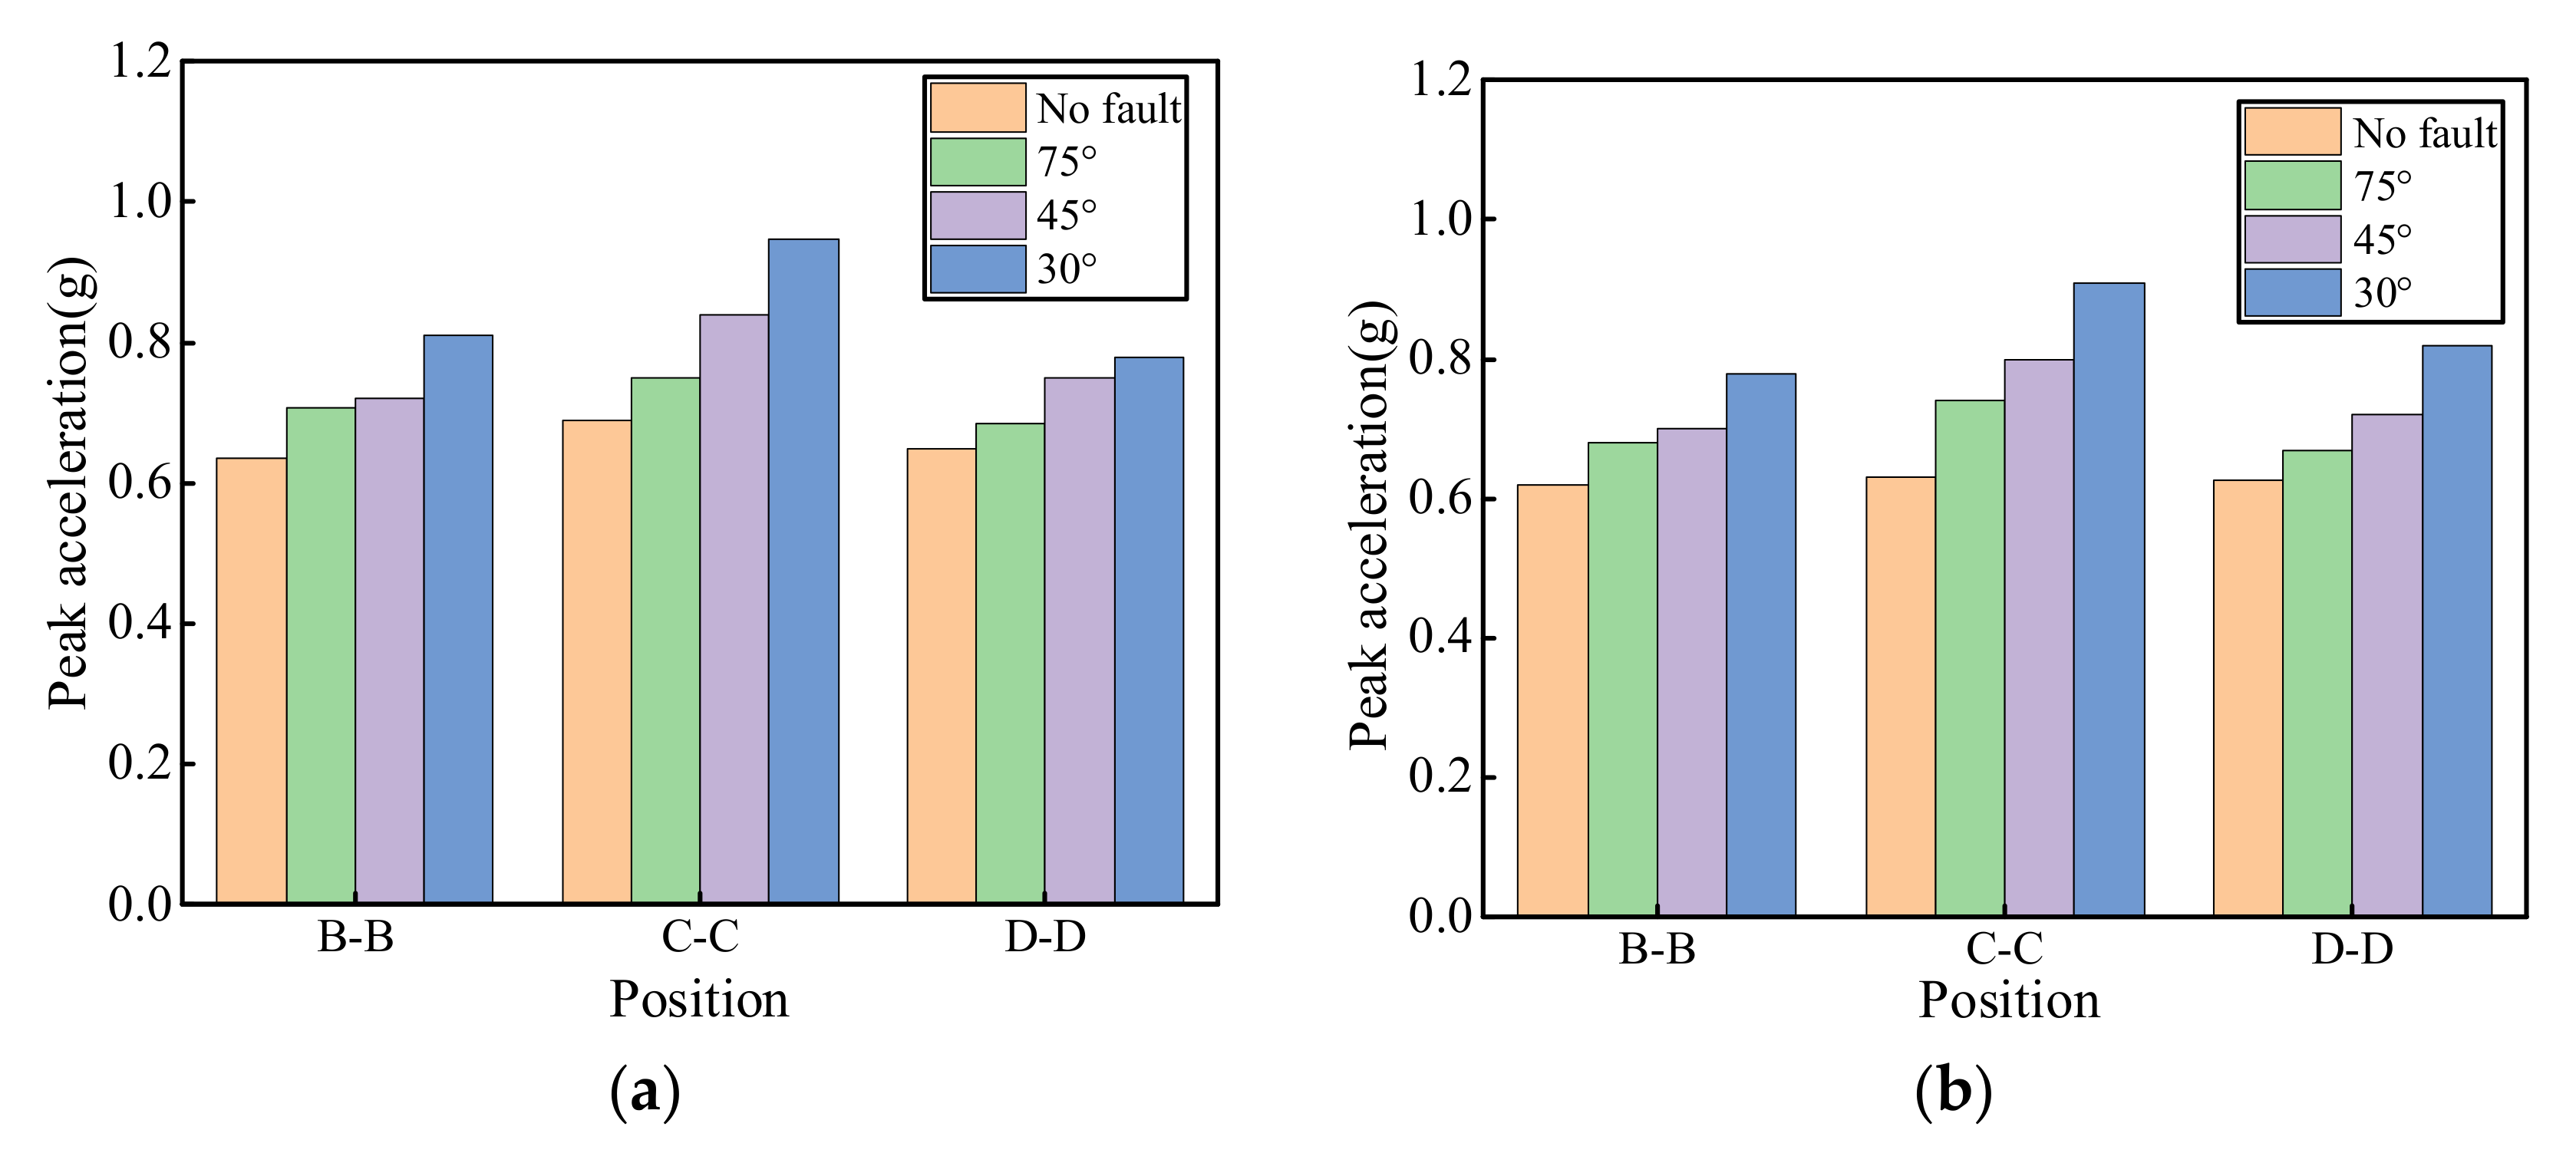
- Compared with the acceleration peaks of different sections in ordinary tunnels, the acceleration response law in the axial direction was changed by the fault. The acceleration peaks of the sections at the fault were significantly larger than the sections on both sides. In addition, when the inclination angle was 75°, the acceleration range was 108%–117%; when the inclination angle was 45°, the increase range was 115%–127%; and when the inclination angle was 30°, the increase range was 126%–144%. As the inclination of the fault decreases, the tunnel acceleration response becomes stronger, indicating that the smaller the fault dip, the stronger the dynamic response of the tunnel lining structure.
- (3)
- Under the four test conditions, the difference in the peak strain of the inner and outer cross-sections was small, even at some monitoring points. Along the tunnel axis, the strain peaks of each test condition were quite different, and the strain peaks at the faults were larger than those of the other sections. Smaller dip angles corresponded to larger strain peaks. From the perspective of tunnel seismic resistance, smaller fault dip angles led to a stronger dynamic response, which was not conducive to tunnel seismic resistance.
- (4)
- Compared with the ordinary tunnel strain response, when the input acceleration was 0.6 g, the strain values of the cross–section at the fault were magnified. When the dip angle was 75°, the peak strain of the crown was magnified by 2.7 times, at 45° by 3.2 times, and at 30° by 4.2 times. This shows that as the dip angle of the fault decreases, the magnification continues to increase. Smaller dip angles led to sharper increases. Because of the limitations of the experimental conditions, only three sets of fault dip angles and one group of ordinary tunnels were examined in this experiment to analyze the dynamic response law of tunnel lining across different fault dip angles. Additional research is needed to identify the change rule under other dip angles. However, the selection of the inclination angle of this experiment and many conclusions of this study are generalizable to other similar tunnel projects.
Author Contributions
Funding
Informed Consent Statement
Data Availability Statement
Conflicts of Interest
References
- Kontoe, S.; Zdravkovic, L.; Potts, D.M.; Menkiti, C.O. Case study on seismic tunnel response. Can. Geotech. J. 2008, 45, 1743–1764. [Google Scholar] [CrossRef] [Green Version]
- Bao, Z.; Yuan, Y.; Yu, H. Multi-scale physical model of shield tunnels applied in shaking table test. Soil Dyn. Earthq. Eng. 2017, 100, 465–479. [Google Scholar] [CrossRef]
- Wang, W.L.; Wang, T.T.; Su, J.J.; Lin, C.H.; Seng, C.R.; Huang, T.H. Assessment of damage in mountain tunnels due to the Taiwan Chi-Chi Earthquake. Tunn. Undergr. Space Technol. 2001, 16, 133–150. [Google Scholar] [CrossRef]
- Yu, H.; Chen, J.; Bobet, A.; Yuan, Y. Damage observation and assessment of the Longxi tunnel during the Wenchuan earthquake. Tunn. Undergr. Space Technol. 2016, 54, 102–116. [Google Scholar] [CrossRef]
- Wang, Z.Z.; Zhang, Z. Seismic damage classification and risk assessment of mountain tunnels with a validation for the 2008 Wenchuan earthquake. Soil Dyn. Earthq. Eng. 2013, 45, 45–55. [Google Scholar] [CrossRef]
- Shen, Y.; Gao, B.; Yang, X.; Tao, S. Seismic damage mechanism and dynamic deformation characteristic analysis of mountain tunnel after Wenchuan earthquake. Eng. Geol. 2014, 180, 85–98. [Google Scholar] [CrossRef]
- Anastasopoulos, I.; Gerolymos, N.; Drosos, V.; Georgarakos, T.; Kourkoulis, R.; Gazetas, G. Behaviour of deep immersed tunnel under combined normal fault rupture deformation and subsequent seismic shaking. Bull. Earthquake Eng. 2008, 6, 213–239. [Google Scholar] [CrossRef]
- Zhen, D.Z.; Cong, Z.; Jun, W.; Peng, Z.; Duan, Z. Cyclic Loading Test for the Small-Strain Shear Modulus of Saturated Soft Clay and Its Failure Mechanis. Geofluids. 2021, 6, 1–13. [Google Scholar]
- Fan, L.; Chen, J.L.; Peng, S.Q.; Qi, B.X.; Zhou, Q.W.; Wang, F. Seismic response of tunnel under normal fault slips by shaking table test technique. J. Cent. South Univ. 2020, 27, 1306–1319. [Google Scholar] [CrossRef]
- Tsinidis, G.; de Silva, F.; Anastasopoulos, I.; Bilotta, E.; Bobet, A.; Hashash, Y.M.A.; He, C.; Kampas, G.; Knappett, J.; Madabhushi, G.; et al. Seismic behaviour of tunnels: From experiments to analysis. Tunn. Undergr. Space Technol. 2020, 99, 10334. [Google Scholar] [CrossRef]
- Kun, M.; Onargan, T. Influence of the fault zone in shallow tunneling: A case study of Izmir Metro Tunnel. Tunn. Undergr. Space Technol. 2013, 33, 34–45. [Google Scholar] [CrossRef]
- Corigliano, M.; Scandella, L.; Lai, C.G.; Paolucci, R. Seismic analysis of deep tunnels in near fault conditions: A case study in Southern Italy. Bull Earthquake Eng. 2011, 9, 975–995. [Google Scholar] [CrossRef]
- Yang, Z.; Lan, H.; Zhang, Y.; Gao, X.; Li, L. Nonlinear dynamic failure process of tunnel-fault system in response to strong seismic event. J. Asian Earth Sci. 2013, 64, 125–135. [Google Scholar] [CrossRef]
- Huang, J.; Zhao, M.; Du, X. Non-linear seismic responses of tunnels within normal fault ground under obliquely incident P waves. Tunn. Undergr. Space Technol. 2017, 61, 26–39. [Google Scholar] [CrossRef]
- Guan, Z.; Zhou, Y.; Gou, X.; Huang, H.; Wu, X. The seismic responses and seismic properties of large section mountain tunnel based on shaking table tests. Tunn. Undergr. Space Technol. 2019, 90, 383–393. [Google Scholar] [CrossRef]
- Baziar, M.H.; Nabizadeh, A.; Lee, C.J.; Hung, W.Y. Centrifuge modeling of interaction between reverse faulting and tunnel. Soil Dyn. Earthq. Eng. 2014, 65, 151–164. [Google Scholar] [CrossRef]
- Shen, Y.S.; Wang, Z.Z.; Yu, J.; Zhang, X.; Gao, B. Shaking table test on flexible joints of mountain tunnels passing through normal fault. Tunn. Undergr. Space Technol. 2019, 98, 103299. [Google Scholar] [CrossRef]
- Yan, G.; Gao, B.; Shen, Y.; Zheng, Q.; Fan, K.; Huang, H. Shaking table test on seismic performances of newly designed joints for mountain tunnels crossing faults. Adv. Struct. Eng. 2020, 23, 248–262. [Google Scholar] [CrossRef]
- Jung-Woo, C.; Seokwon, J.; Sang-Hwa, Y. Optimum spacing of TBM disc cutters: A numerical simulation using the three-dimensional dynamic fracturing method. Tunn. Undergr. Space Technol. 2010, 25, 230–244. [Google Scholar]
- Dohyun, P.; Byungkyu, J.; Seokwon, J. A Numerical Study on the Screening of Blast-Induced Waves for Reducing Ground Vibration. Rock Mech. Rock Eng. 2009, 42, 449–473. [Google Scholar]
- Jeon, S.; Kim, J.; Seo, Y.; Hong, C. Effect of a fault and weak plane on the stability of a tunnel in rock—A scaled model test and numerical analysis. Int. J. Rock Mech. Min. Sci. 2004, 41, 658–663. [Google Scholar] [CrossRef]
- Zhang, Z.; Chen, F.; Li, N.; Swoboda, G.; Liu, N. Influence of fault on the surrounding rock stability of a tunnel: Location and thickness. Tunn. Undergr. Space Technol. 2017, 61, 1–11. [Google Scholar] [CrossRef]
- Ardeshirilajimi, S.; Yazdani, M.; Langroudi, A.A. Control of fault lay-out on seismic design of large underground caverns. Tunn. Undergr. Space Technol. 2015, 50, 305–316. [Google Scholar] [CrossRef]
- Liu, X.; Li, X.; Sang, Y.; Lin, L. Experimental study on normal fault rupture propagation in loose strata and its impact on mountain tunnels. Tunn. Undergr. Space Technol. 2015, 49, 417–425. [Google Scholar] [CrossRef]
- Gaskin, Z.A. Shaking table testing of geofoam seismic buffers. Soil Dyn. Earthq. Eng. 2007, 27, 324–332. [Google Scholar]
- Wang, Z.Z.; Jiang, Y.J.; Zhu, C.A.; Sun, T.C. Shaking table tests of tunnel linings in progressive states of damage. Tunn. Undergr. Space Technol. 2015, 50, 109–117. [Google Scholar] [CrossRef]
- Ciulla, G.; D’Amico, A.; Brano, V.L. Evaluation of building heating loads with dimensional analysis: Application of the Buckingham π theorem. Energy Build. 2017, 154, 479–490. [Google Scholar] [CrossRef]
- Wang, Z.Z.; Jiang, L.; Gao, Y. Shaking table test of seismic response of immersed tunnels under effect of water. Soil Dyn. Earthq. Eng. 2019, 116, 436–445. [Google Scholar] [CrossRef]
- Xin, C.L.; Wang, Z.Z.; Gao, B. Shaking table tests on seismic response and damage mode of tunnel linings in diverse tunnel-void interaction states. Tunn. Undergr. Space Technol. 2018, 77, 295–304. [Google Scholar] [CrossRef]
- Chen, J.; Shi, X.; Li, J. Shaking table test of utility tunnel under non-uniform earthquake wave excitation. Soil Dyn. Earthq. Eng. 2010, 30, 1400–1416. [Google Scholar] [CrossRef]
- Ding, X.; Feng, L.; Wang, C.; Han, L. Shaking table tests of the seismic response of a utility tunnel with a joint connection. Soil Dyn. Earthq. Eng. 2020, 133, 106–133. [Google Scholar] [CrossRef]
- Bazzurro, P.; Cornell, C.A. Nonlinear Soil-Site Effects in Probabilistic Seismic-Hazard Analysis. B. Seismol. Soc. Am. 2004, 94, 2110–2123. [Google Scholar] [CrossRef]
- Zhang, C.; Zhu, Z.D.; Zhu, S.; He, Z.; Zhu, D.; Liu, J.; Meng, S. Nonlinear Creep Damage Constitutive Model of Concrete Based on Fractional Calculus Theory. Materials 2019, 12, 1505. [Google Scholar] [CrossRef] [PubMed] [Green Version]
- Lai, J.; He, S.; Qiu, J.; Chen, J.; Wang, L.; Wang, K.; Wang, J. Characteristics of seismic disasters and aseismic measures of tunnels in Wenchuan earthquake. Environ. Earth Sci. 2017, 76, 94. [Google Scholar] [CrossRef]
- Bahrampouri, M.; Rodriguez-Marek, A.; Bommer, J.J. Mapping the uncertainty in modulus reduction and damping curves onto the uncertainty of site amplification functions. Soil Dyn. Earthq. Eng. 2018, 02, 022. [Google Scholar] [CrossRef]
- Dhulipala, S.L.; Rodriguez-Marek, A.; Bahrampouri, M. Intensity Measure Adequacy Assessment for Nonlinear Site Response using Information Theory. Soil Dyn. Earthq. Eng. 2020, 134, 106144. [Google Scholar] [CrossRef]
- Zhu, Z.D.; Zhang, C.; Meng, S.S.; Zheng, Y.S.; Shan, Z.T.; Duan, Z. A Statistical Damage Constitutive Model Based on the Weibull Distribution for Alkali-Resistant Glass Fiber Reinforced Concrete. Materials 2019, 12, 1908. [Google Scholar] [CrossRef] [Green Version]


| Size (m × m) | Maximum Payload (t) | Frequency Range (Hz) | Maximum Displacement (mm) | Freedom | Peak Acceleration (g) |
|---|---|---|---|---|---|
| 1 × 1 | 1.2 | 0.1–80 | ±76 | 2 | 1.8 |
| Length | Acceleration | Density | Strain | Elastic Modulus | Time | Frequency | |
|---|---|---|---|---|---|---|---|
| similarity relation | 1 | ||||||
| similarity ratio | 100 | 1 | 1 | 1 | 100 | 0.1 | 10 |
| Surrounding Rock | Level | Cohesion (kPa) | Friction Angle (°) | Elastic Modulus (GPa) | Unit Weight (kN/m3) |
|---|---|---|---|---|---|
| prototype | V | 90 | 24 | 2.5 | 17 |
| model | 0.91 | 24 | 0.026 | 16.7 |
| Lining | Elastic Modulus (GPa) | Poisson Ratio | Unit Weight (kN/m3) | Compress Strength (MPa) |
|---|---|---|---|---|
| prototype | 29.500 | 0.200 | 23.000 | 16.700 |
| model | 0.298 | 0.200 | 23.000 | 0.35 |
| No. | Excitation Waves | PGA of Input | Frequency (Hz) | Vibration Direction | Time (s) |
|---|---|---|---|---|---|
| 1, 2, 3 | sine | 0.1 g | 5, 7.5, 10 | transversal | 20 |
| 4, 5, 6 | sine | 0.2 g | 5, 7.5, 10 | transversal | 20 |
| 7, 8, 9 | sine | 0.4 g | 5, 7.5, 10 | transversal | 20 |
| 10, 11, 12 | sine | 0.6 g | 5, 7.5, 10 | transversal | 20 |
| 13, 14, 15 | sine | 0.8 g | 5, 7.5, 10 | transversal | 20 |
| 16, 17, 18 | sine | 1.0 g | 5,7.5,10 | transversal | 20 |
| Section Position | No Fault | 75° | 45° | 30° |
|---|---|---|---|---|
| B–B | 100% | 112% | 114% | 126% |
| C–C | 100% | 117% | 127% | 144% |
| D–D | 100% | 108% | 115% | 131% |
| Section Position | No Fault | 75° | 45° | 30° |
|---|---|---|---|---|
| B–B | 100% | 111% | 113% | 127% |
| C–C | 100% | 109% | 122% | 137% |
| D–D | 100% | 106% | 116% | 120% |
| Section Position | No Fault | 75° | 45° | 30° |
|---|---|---|---|---|
| B–B | 100% | 191% | 236% | 300% |
| C–C | 100% | 270% | 320% | 420% |
| D–D | 100% | 196% | 228% | 304% |
| Section Position | No Fault | 75° | 45° | 30° |
|---|---|---|---|---|
| B–B | 100% | 241% | 313% | 366% |
| C–C | 100% | 292% | 342% | 417% |
| D–D | 100% | 212% | 283% | 327% |
Publisher’s Note: MDPI stays neutral with regard to jurisdictional claims in published maps and institutional affiliations. |
© 2021 by the authors. Licensee MDPI, Basel, Switzerland. This article is an open access article distributed under the terms and conditions of the Creative Commons Attribution (CC BY) license (https://creativecommons.org/licenses/by/4.0/).
Share and Cite
Zhu, D.; Zhu, Z.; Zhang, C.; Xie, X. Shaking Table Test on the Tunnel Dynamic Response under Different Fault Dip Angles. Symmetry 2021, 13, 1375. https://doi.org/10.3390/sym13081375
Zhu D, Zhu Z, Zhang C, Xie X. Shaking Table Test on the Tunnel Dynamic Response under Different Fault Dip Angles. Symmetry. 2021; 13(8):1375. https://doi.org/10.3390/sym13081375
Chicago/Turabian StyleZhu, Duan, Zhende Zhu, Cong Zhang, and Xinghua Xie. 2021. "Shaking Table Test on the Tunnel Dynamic Response under Different Fault Dip Angles" Symmetry 13, no. 8: 1375. https://doi.org/10.3390/sym13081375