3.1. Surface Coverage-Dependent Luminescence Properties
All data presented in this subsection were measured at
λex = 266 nm and a laser pulse energy of 0.1 mJ. Before measuring the Γ-dependent luminescence properties, pH-dependent luminescence spectra were measured from the high SSA sample No. 1 at [U(VI)] = 3.4 μM and
m/
v = 1.0 g/L as a function of pH. Nearly 100% adsorption of U(VI) was observed above pH 5.0, as shown in
Figure S1a. The adsorbed quantity of U(VI) was approximately 70% at pH 4.0, and the rest existed in the form of aqueous species. For the luminescence measurement of U(VI) surface species at pH 4.0, the aqueous U(VI) species were removed by centrifugation, after which the separated SiO
2 particles were resuspended in a fresh background NaClO
4 solution with a pH and an ionic strength identical to the original ones but without U(VI). The data in
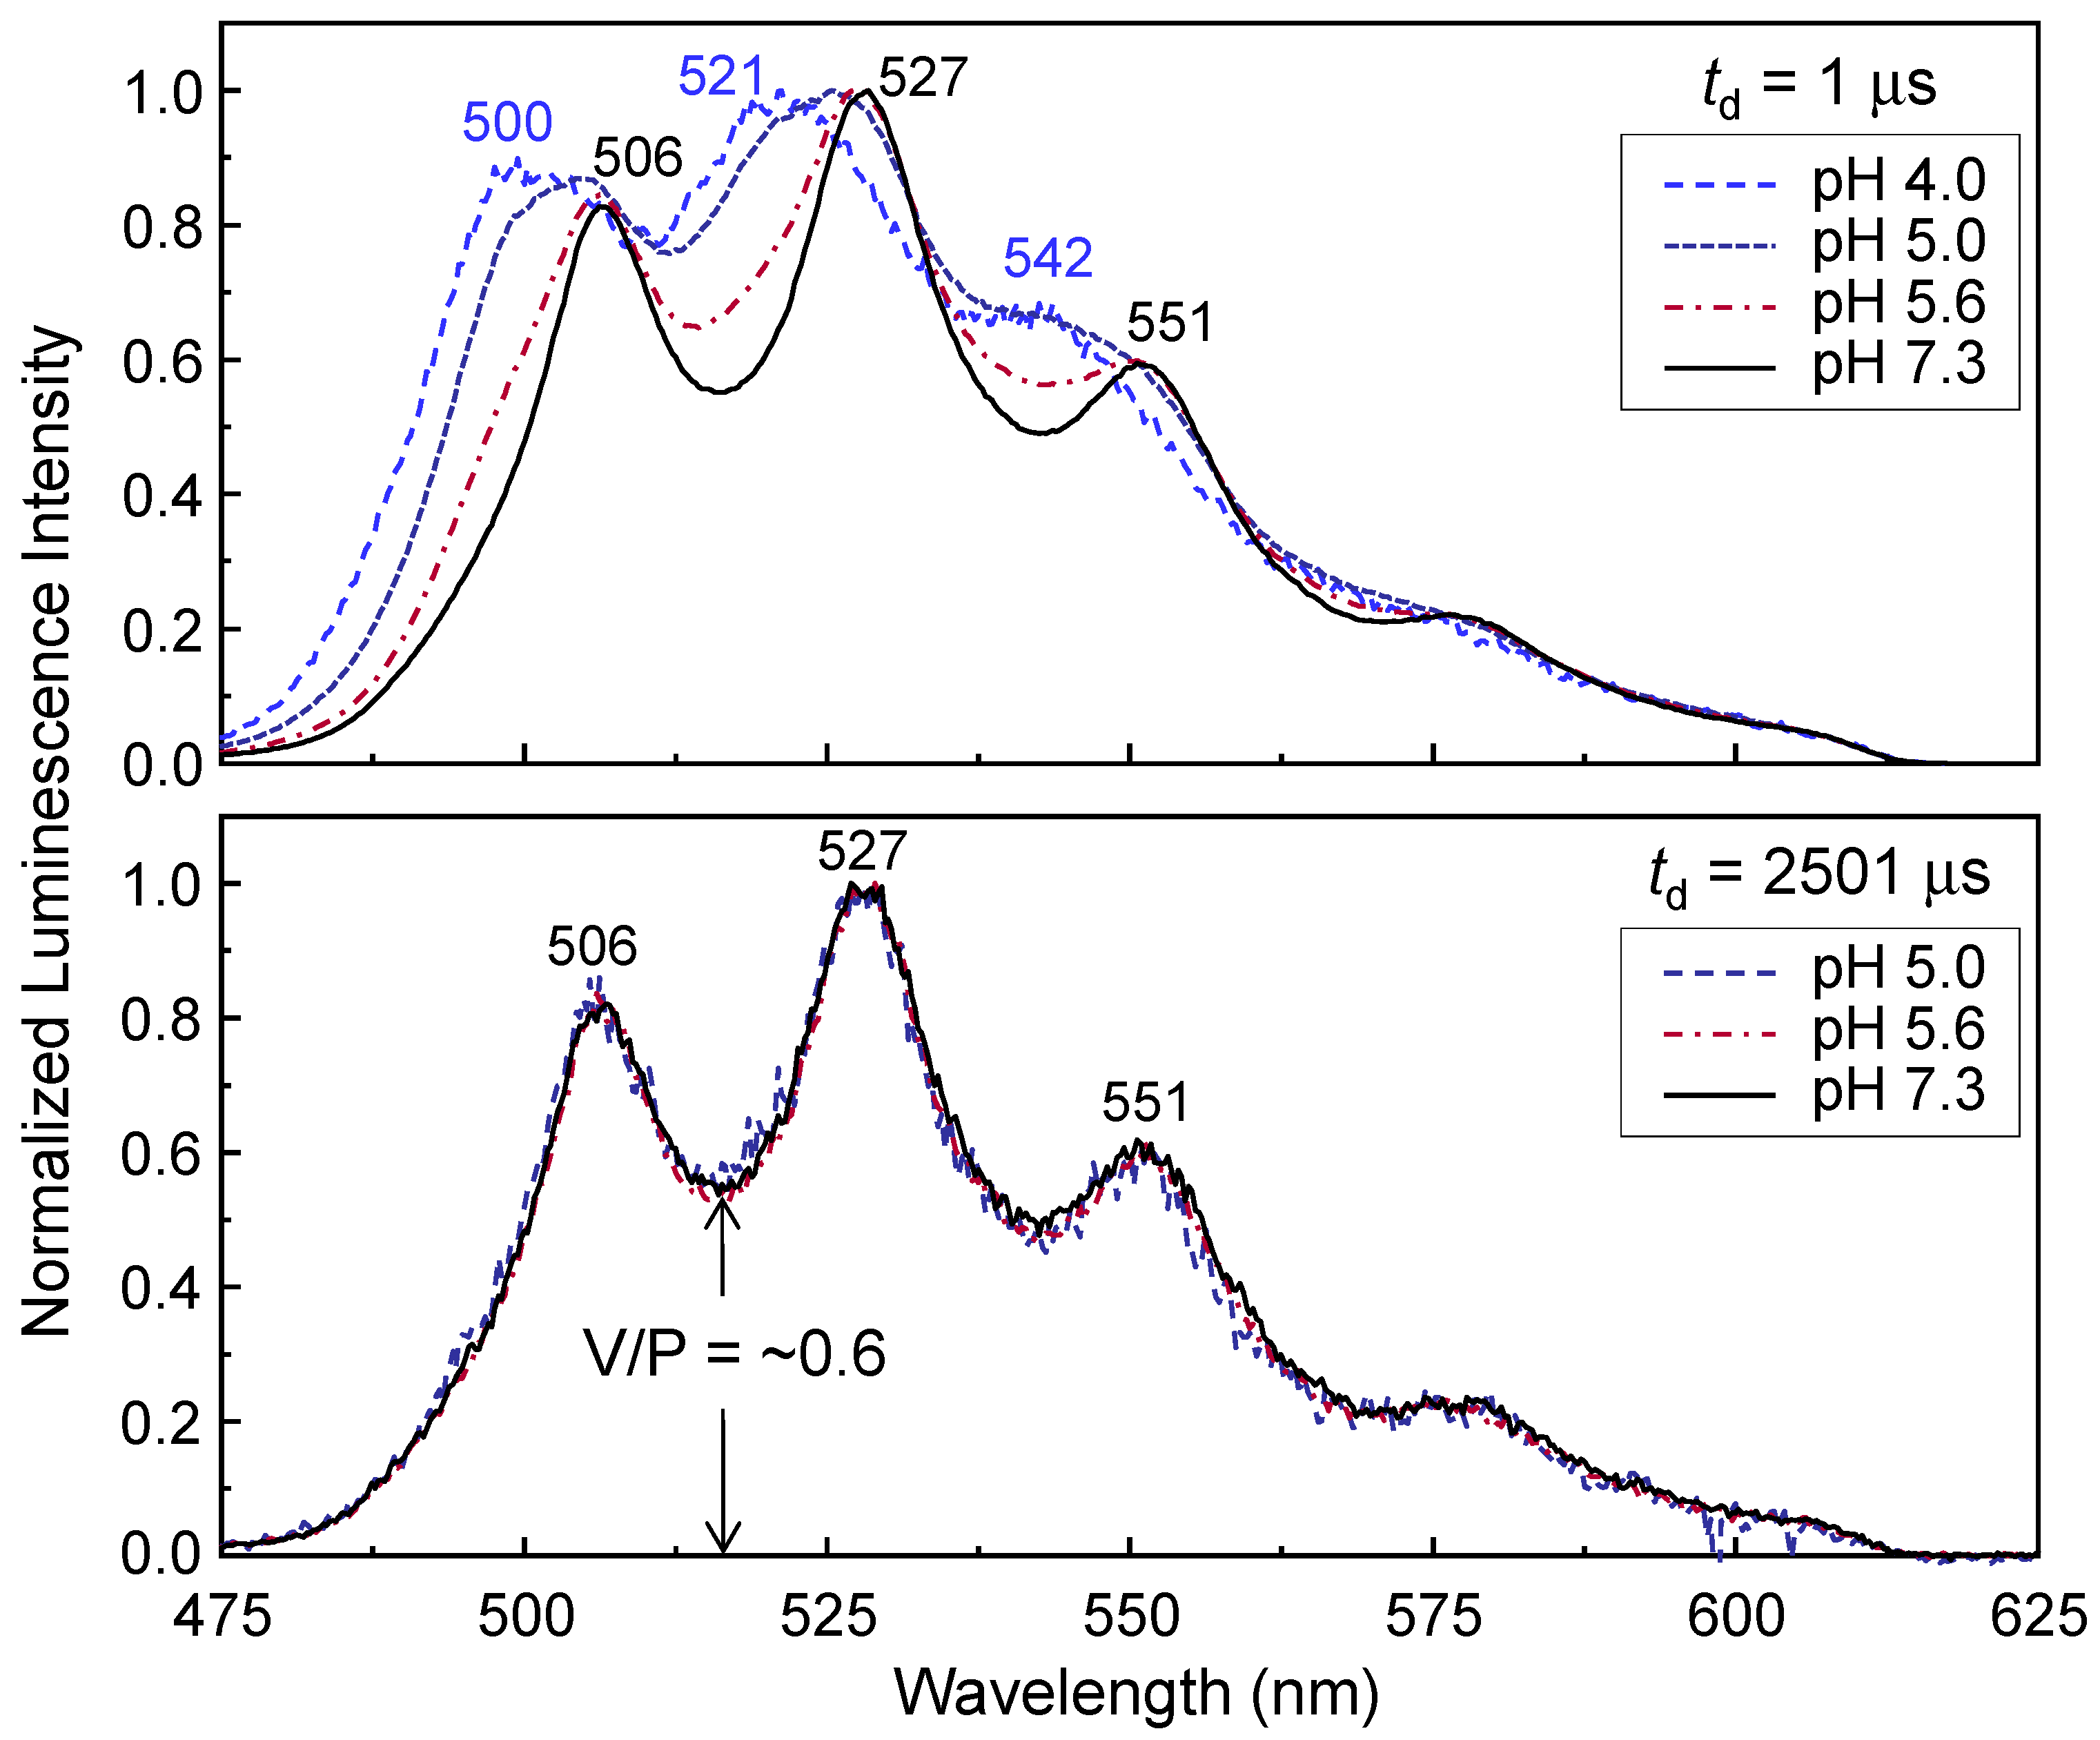
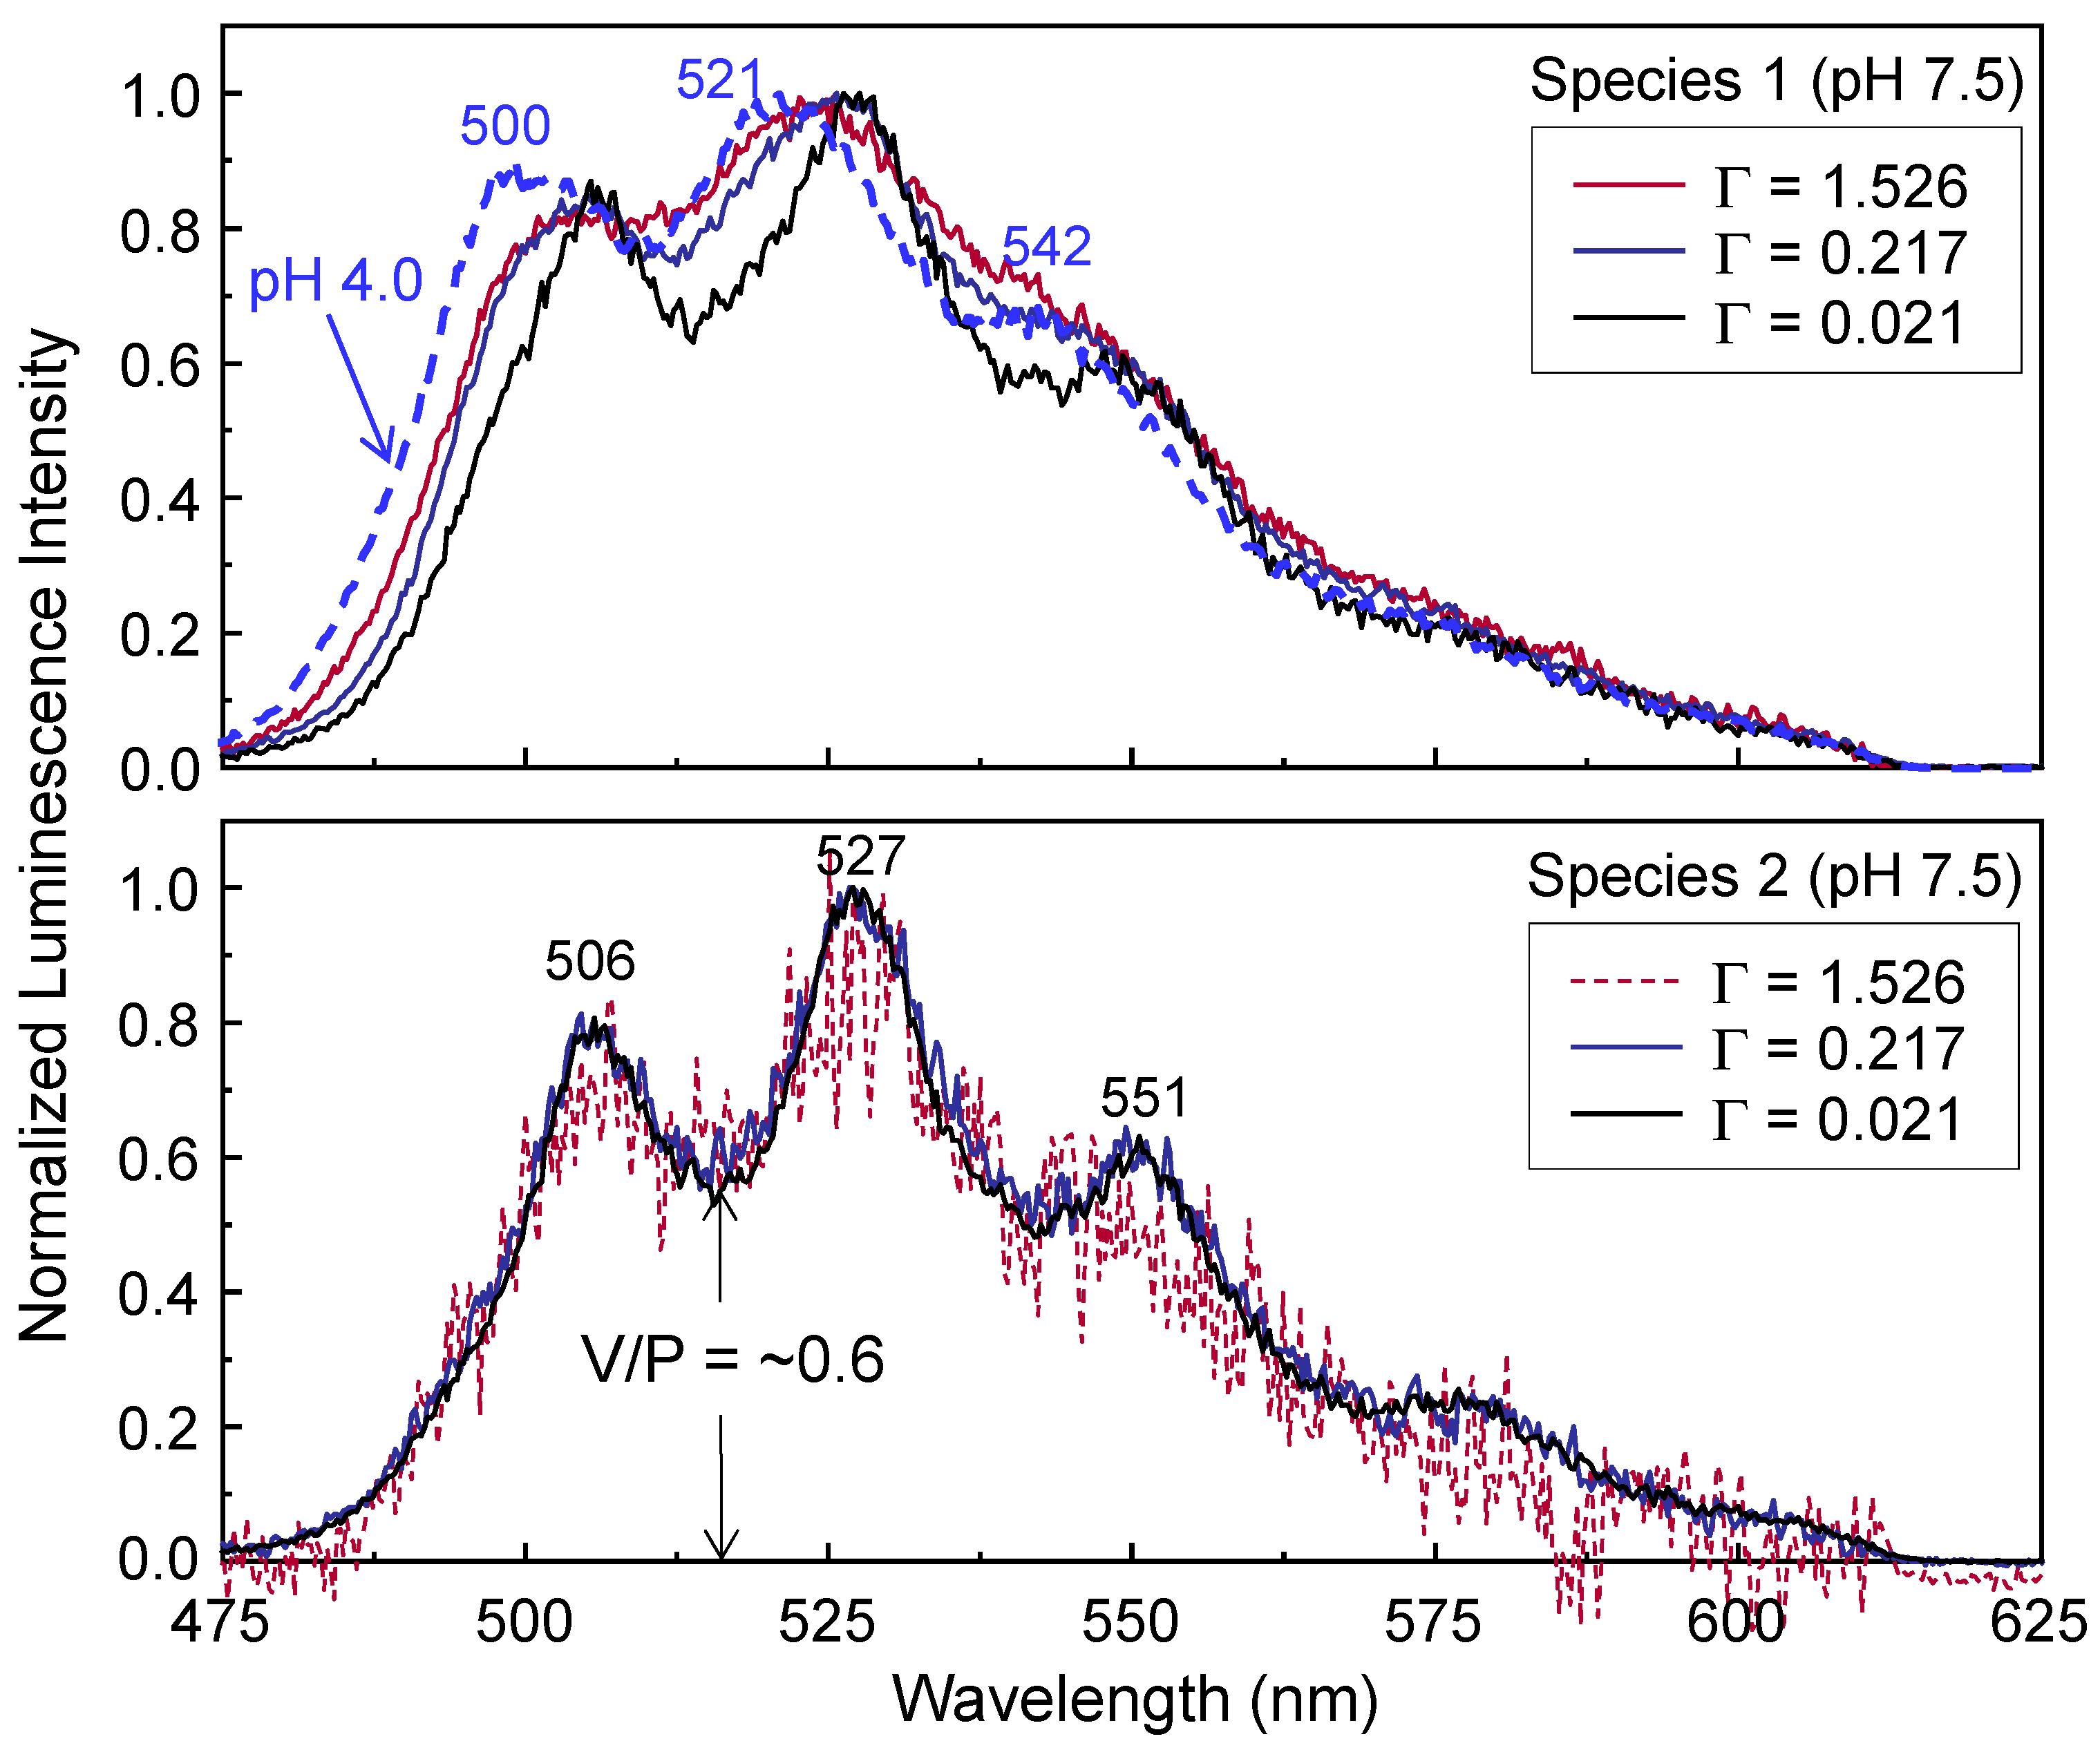
Figure 1 show the luminescence spectra, which were normalized by the intensity of the strongest peak.
The peak wavelength values are expressed in Arabic numerals in
Figure 1. Two U(VI) surface species, ≡SiO
2UO
2 and ≡SiO
2(UO
2)OH
−, were distinguished based on the representative results obtained from the SiO
2 samples at similar conditions of [U(VI)] = 1.0 μM and
m/
v = 1.0 g/L [
17]. In the upper panel, the spectrum acquired at pH 4.0 is completely controlled by ≡SiO
2UO
2 and the luminescence peaks are located at approximately 500, 521, and 542 nm. The peak maxima are shifted to 506, 527, and 551 nm at pH 7.3. The shift of peak maxima represents the existence of the U(VI)-hydroxo surface species [
13,
17,
18,
21,
22,
23]. The spectra measured under different pH values (pH 5.0 and 5.6) in the upper panel demonstrate the transition of the dominant species from acidic to near-neutral pH conditions.
In the lower panel of
Figure 1, the spectra acquired at
td = 2501 μs can be considered the luminescence of the U(VI)-hydroxo surface species alone because the spectral overlap between these species is eliminated because of the much shorter luminescence lifetime of ≡SiO
2UO
2, as discussed later in association with spectral decomposition using the luminescence lifetime. To compare the luminescence spectral shapes in more detail, we defined the valley-to-peak (V/P) intensity ratio as the luminescence intensity of the first valley versus the intensity of the strongest peak, designated by an arrow in
Figure 1. In the lower panel, there are no significant differences between the V/P intensity ratios measured at various pH values. In addition, the peak wavelengths and spectral shapes remain unchanged for
td in the range of 2001–3001 μs. Thus, the spectra measured under the long-
td condition were generated by a unique U(VI)-hydroxo surface species. The change in the V/P intensity ratio at various pH values results from the overlap of the luminescence spectra generated by multiple U(VI) species, as shown in the upper panel of
Figure 1. An increase in pH leads to a lower V/P intensity ratio. This result is ascribed to the increase in the relative quantity of U(VI)-hydroxo surface species with pH, which shows a highly resolved spectrum at neutral pH values. In
Figure S2 of the Supplementary Materials, the luminescence spectra measured for the other high SSA SiO
2 (sample No. 2, [U(VI)] = 3.4 μM,
m/
v = 1.0 g/L) at various pH values show very similar shapes to those displayed in
Figure 1.
The spectral shape with a V/P intensity ratio close to 0.6 at the near-neutral pH in
Figure 1 is significantly different from those observed in other studies [
18,
23]. For example, Chisholm-Brause et al. [
18] reported a V/P intensity ratio of approximately 0.9 (judging by
Figure 1 in Chisholm-Brause et al.; the V/P intensity ratio was not given specifically) in the luminescence spectrum under the conditions of pH 8 and Γ = 3.846 μmol U/m
2 (initial [U(VI)] = 9 μM,
m/
v = 0.013 g/L, and SSA = 180 m
2/g) for the same SiO
2 sample (Aerosil 200) used in this study. They predicted that the overall distribution consisted of about 20% ≡SiO
2UO
2 and 80% ≡SiO
2(UO
2)
3(OH)
5− based on the thermodynamic model predictions depicted in Figure 3 of McKinley et al. [
1]. On the other hand, Gabriel et al. [
17] observed a V/P intensity ratio of approximately 0.7 (judging by Figure 5 in Gabriel et al.; the V/P intensity ratio was not given specifically) under the conditions of pH 7.7 and Γ = 0.006 μmol U/m
2 (initial [U(VI)] = 1 μM,
m/
v = 1.0 g/L, and SSA = 169 m
2/g) for the same SiO
2 sample. They observed that the overall distribution consisted entirely of ≡SiO
2(UO
2)OH
− under the high
m/
v condition. Considering the [U(VI)] and
m/
v values used in these studies [
17,
18], it seems plausible that an increase in Γ leads to a higher V/P intensity ratio under near-neutral pH conditions.
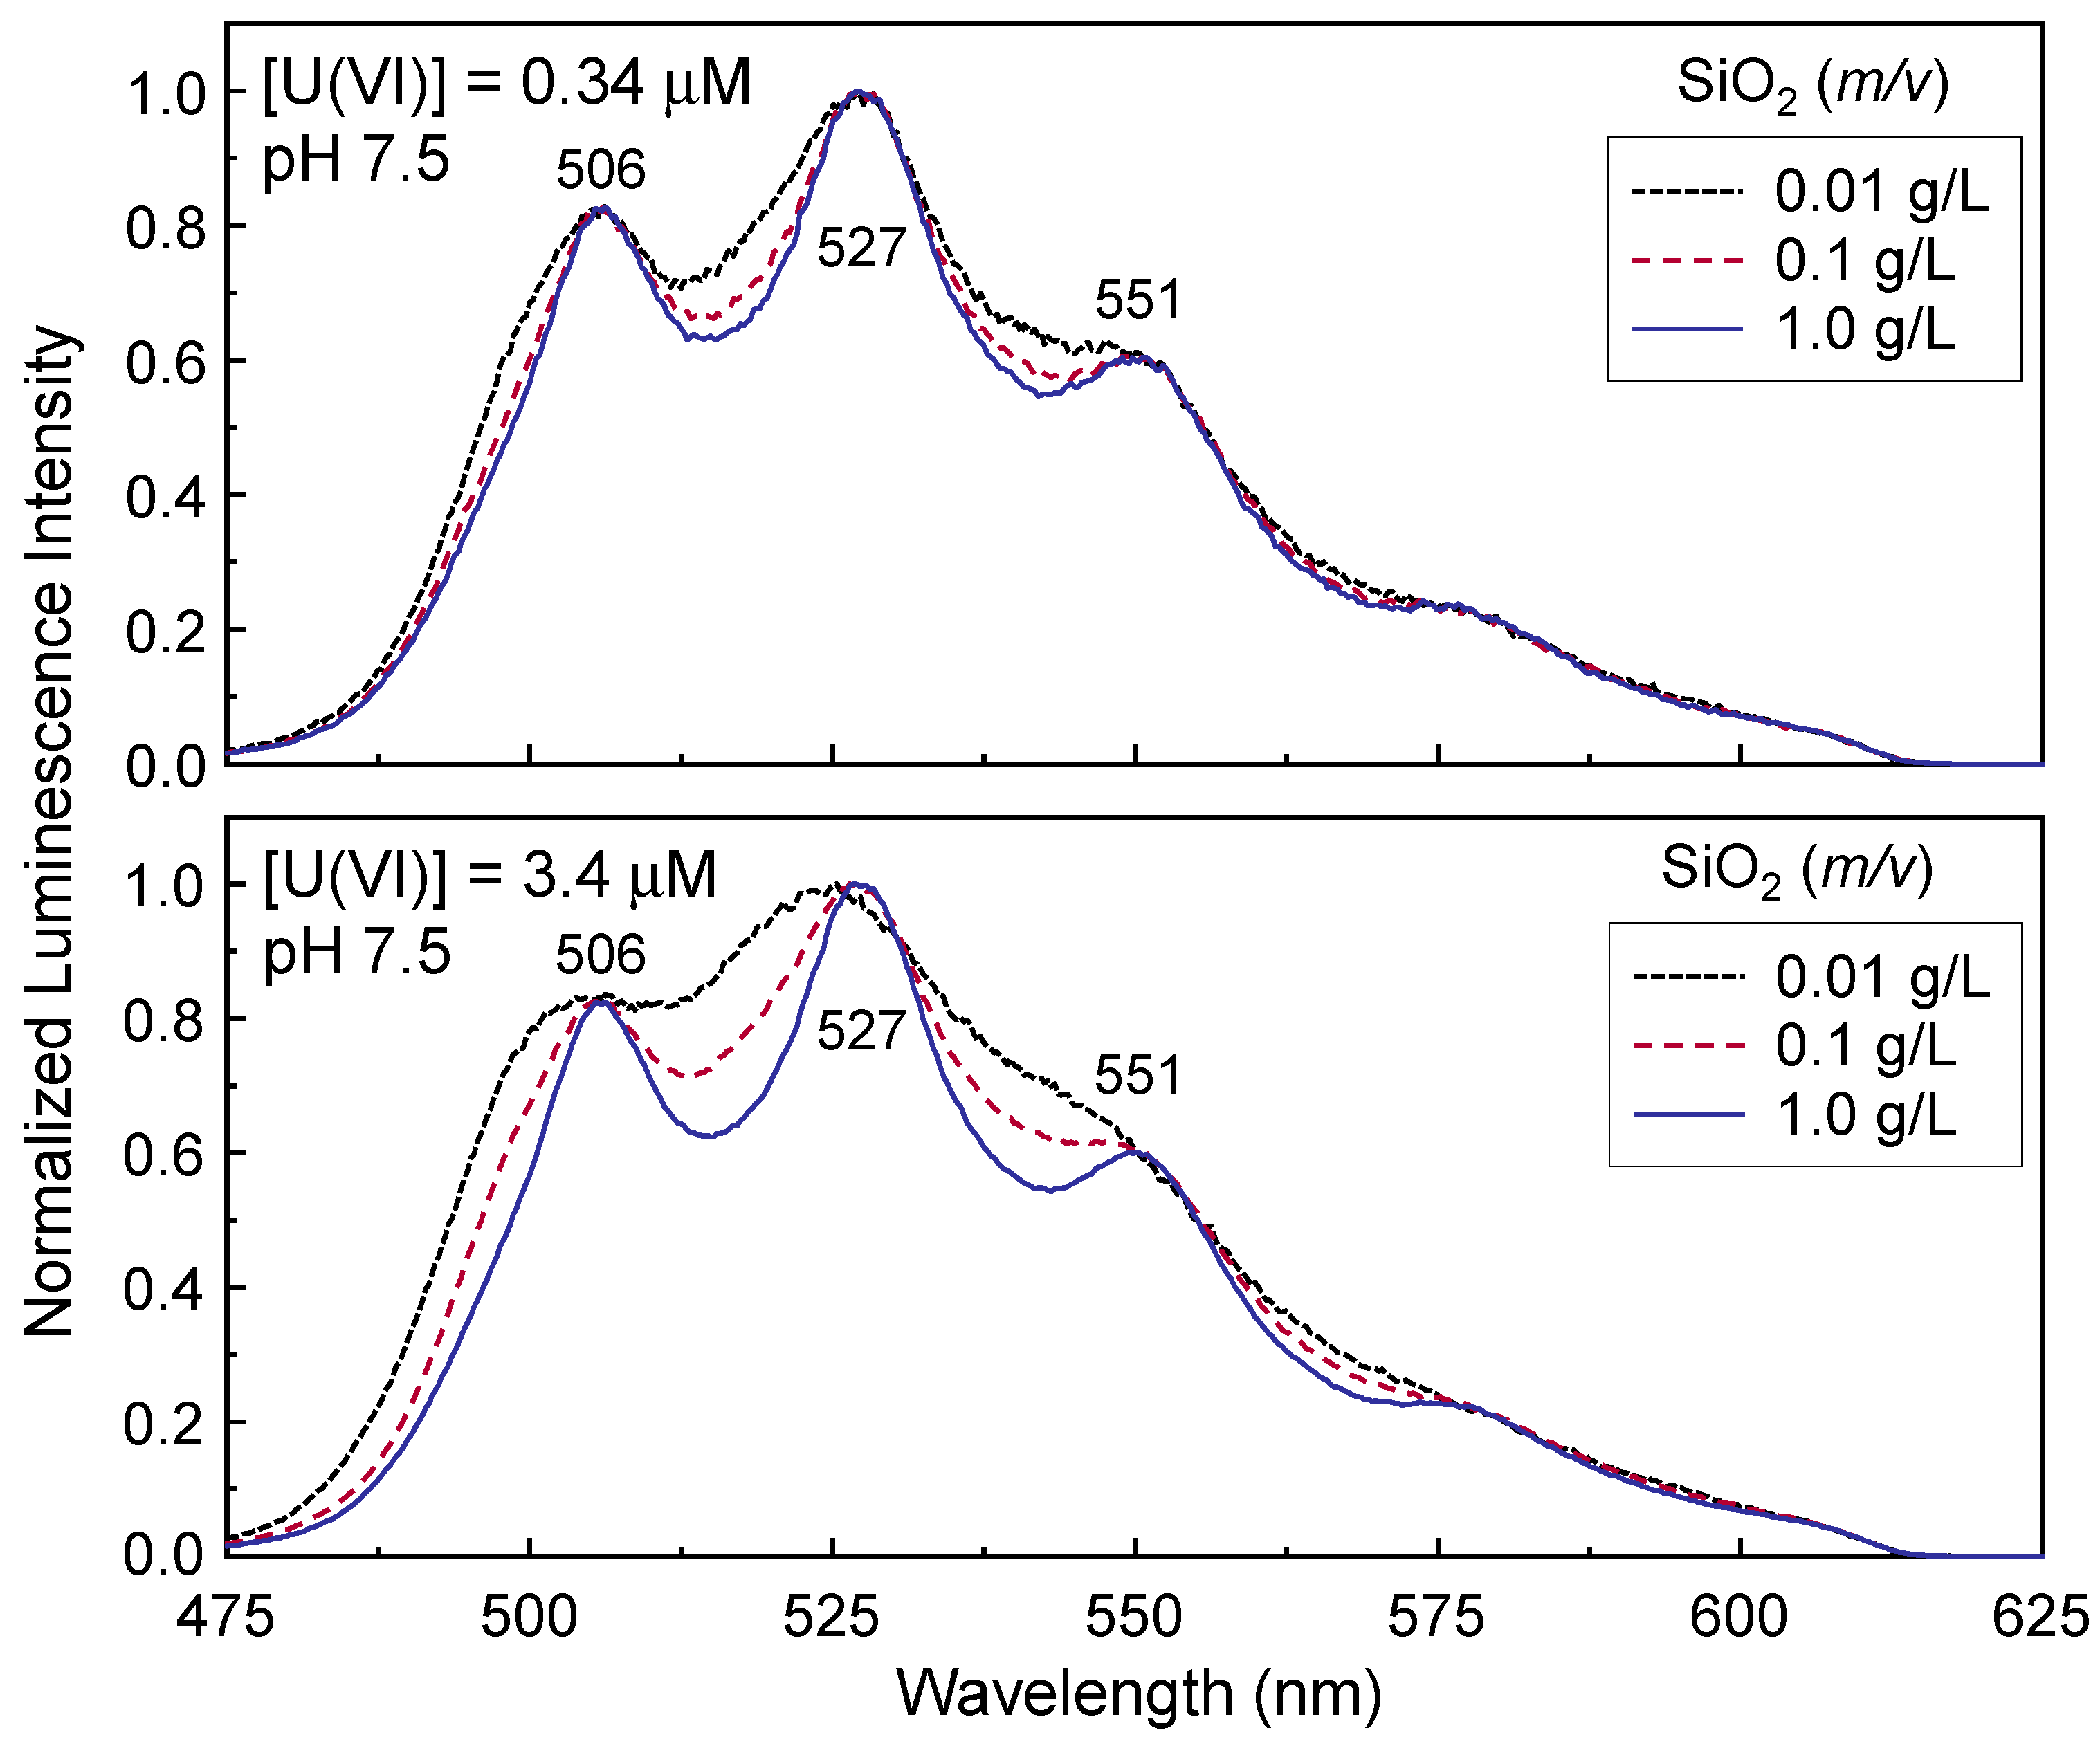
The Γ-dependent luminescence spectra were measured from the high SSA sample No. 1 at pH 7.5. Six samples with different [U(VI)] and
m/
v conditions were prepared, as shown in the legends of
Figure 2. Among these samples, the adsorbed U(VI) amount of the sample with the highest Γ ([U(VI)] = 3.4 μM,
m/
v = 0.01 g/L) was about 70%, and all other samples showed an adsorbed U(VI) amount of 98% or more. The data in
Figure 2 represent the normalized luminescence spectra measured at pH 7.5, and all spectra were acquired at
td = 1 μs. The upper and lower panels in
Figure 2 were measured at [U(VI)] = 0.34 and 3.4 μM, respectively. The normalized luminescence spectra obviously change in shape as
m/
v changes, even when [U(VI)] remains the same. An increase in
m/
v leads to a lower V/P intensity ratio in
Figure 2, as expected based on comparison with previous studies [
17,
18]. The change in the V/P intensity ratio becomes more pronounced at higher [U(VI)], as shown in the lower panel of
Figure 2.
Figure S3 in the Supplementary Materials presents the normalized luminescence spectra derived from the data in
Figure 2. Lower V/P intensity ratios with narrower spectral widths are observed as [U(VI)] decreases from 3.4 to 0.34 μM under the same
m/
v value in
Figure S3a,b. In the case of a sufficiently high
m/
v condition in
Figure S3c, the normalized luminescence spectra show identical spectral shapes with the same V/P intensity ratio when [U(VI)] = 0.34 and 3.4 μM. Similarly, Gabriel et al. observed identical spectral shapes with [U(VI)] = 0.1 and 1.0 μM at
m/
v = 1.0 g/L [
17]. The data in
Figure 2 and
Figure S3 indicate that the existence of different U(VI) surface species at pH 7.5, and their respective proportions depend on Γ.
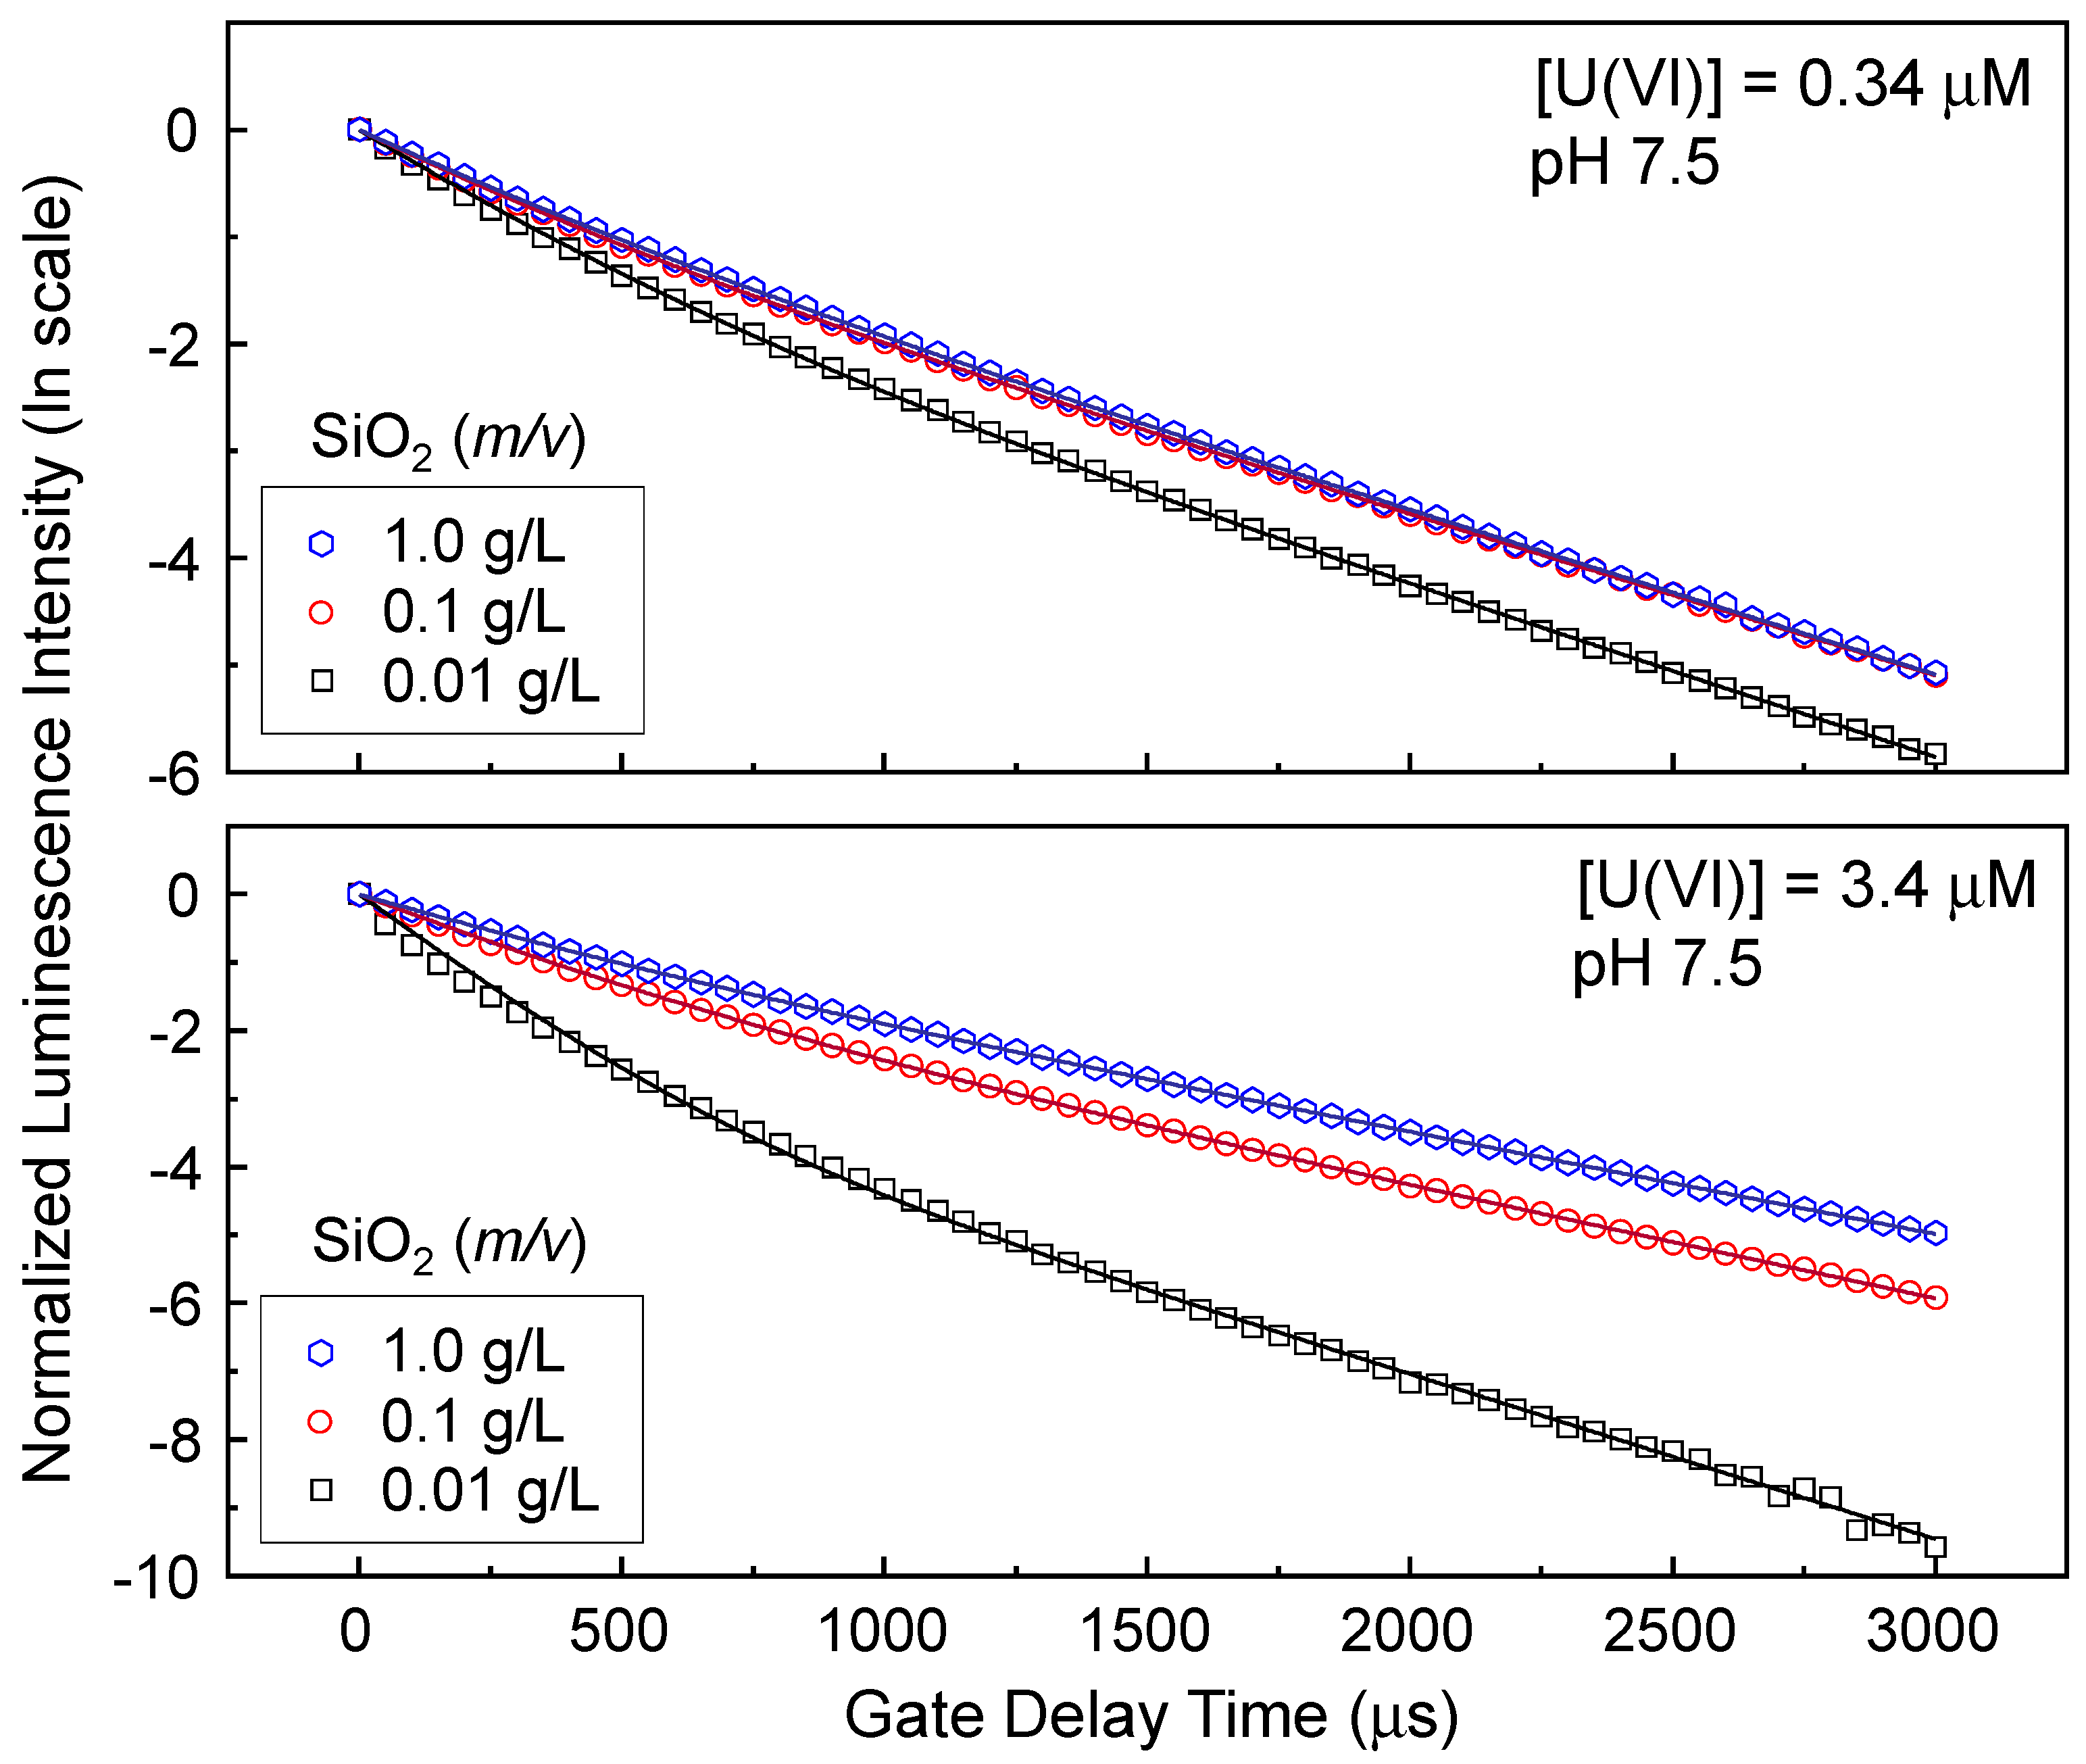
The luminescence lifetimes were also used to obtain information about the adsorbed U(VI) species on SiO
2. Assuming that two U(VI) surface species contribute to the luminescence spectra, the following double exponential decay equation was used [
31]:
where
is the normalized luminescence intensity integrated from 475 to 600 nm, and
and
are the relative quantities of short- and long-lived components (called ‘species 1’ and ‘species 2’) with luminescence lifetimes of τ
1 and τ
2, respectively.
Figure 3 shows the fitting results measured from the samples at pH 7.5 used in
Figure 2.
td varies from 1 to 3001 μs with a gate delay step of 50 μs. The symbols and lines in
Figure 3 represent the normalized luminescence intensities on the natural logarithmic scale and the results of fitting the data to Equation (1) using Origin 9.5, respectively.
Table 2 summarises the luminescence lifetimes and relative quantities of species 1 and 2. The coefficients of determination (R
2) and the residual sum of squares (RSS) are also listed for all fits. τ
2 was provided as a ‘known’ value and was determined as shown in
Figure S4 in the Supplementary Materials. The normalized luminescence spectra remain unchanged for
td in the range of 2001–3001 μs, as shown in
Figure S4a. This result means that τ
2 can be determined by fitting the luminescence intensities measured at
td = 2001–3001 μs to the linear regression, depicted as the solid line in
Figure S4b.
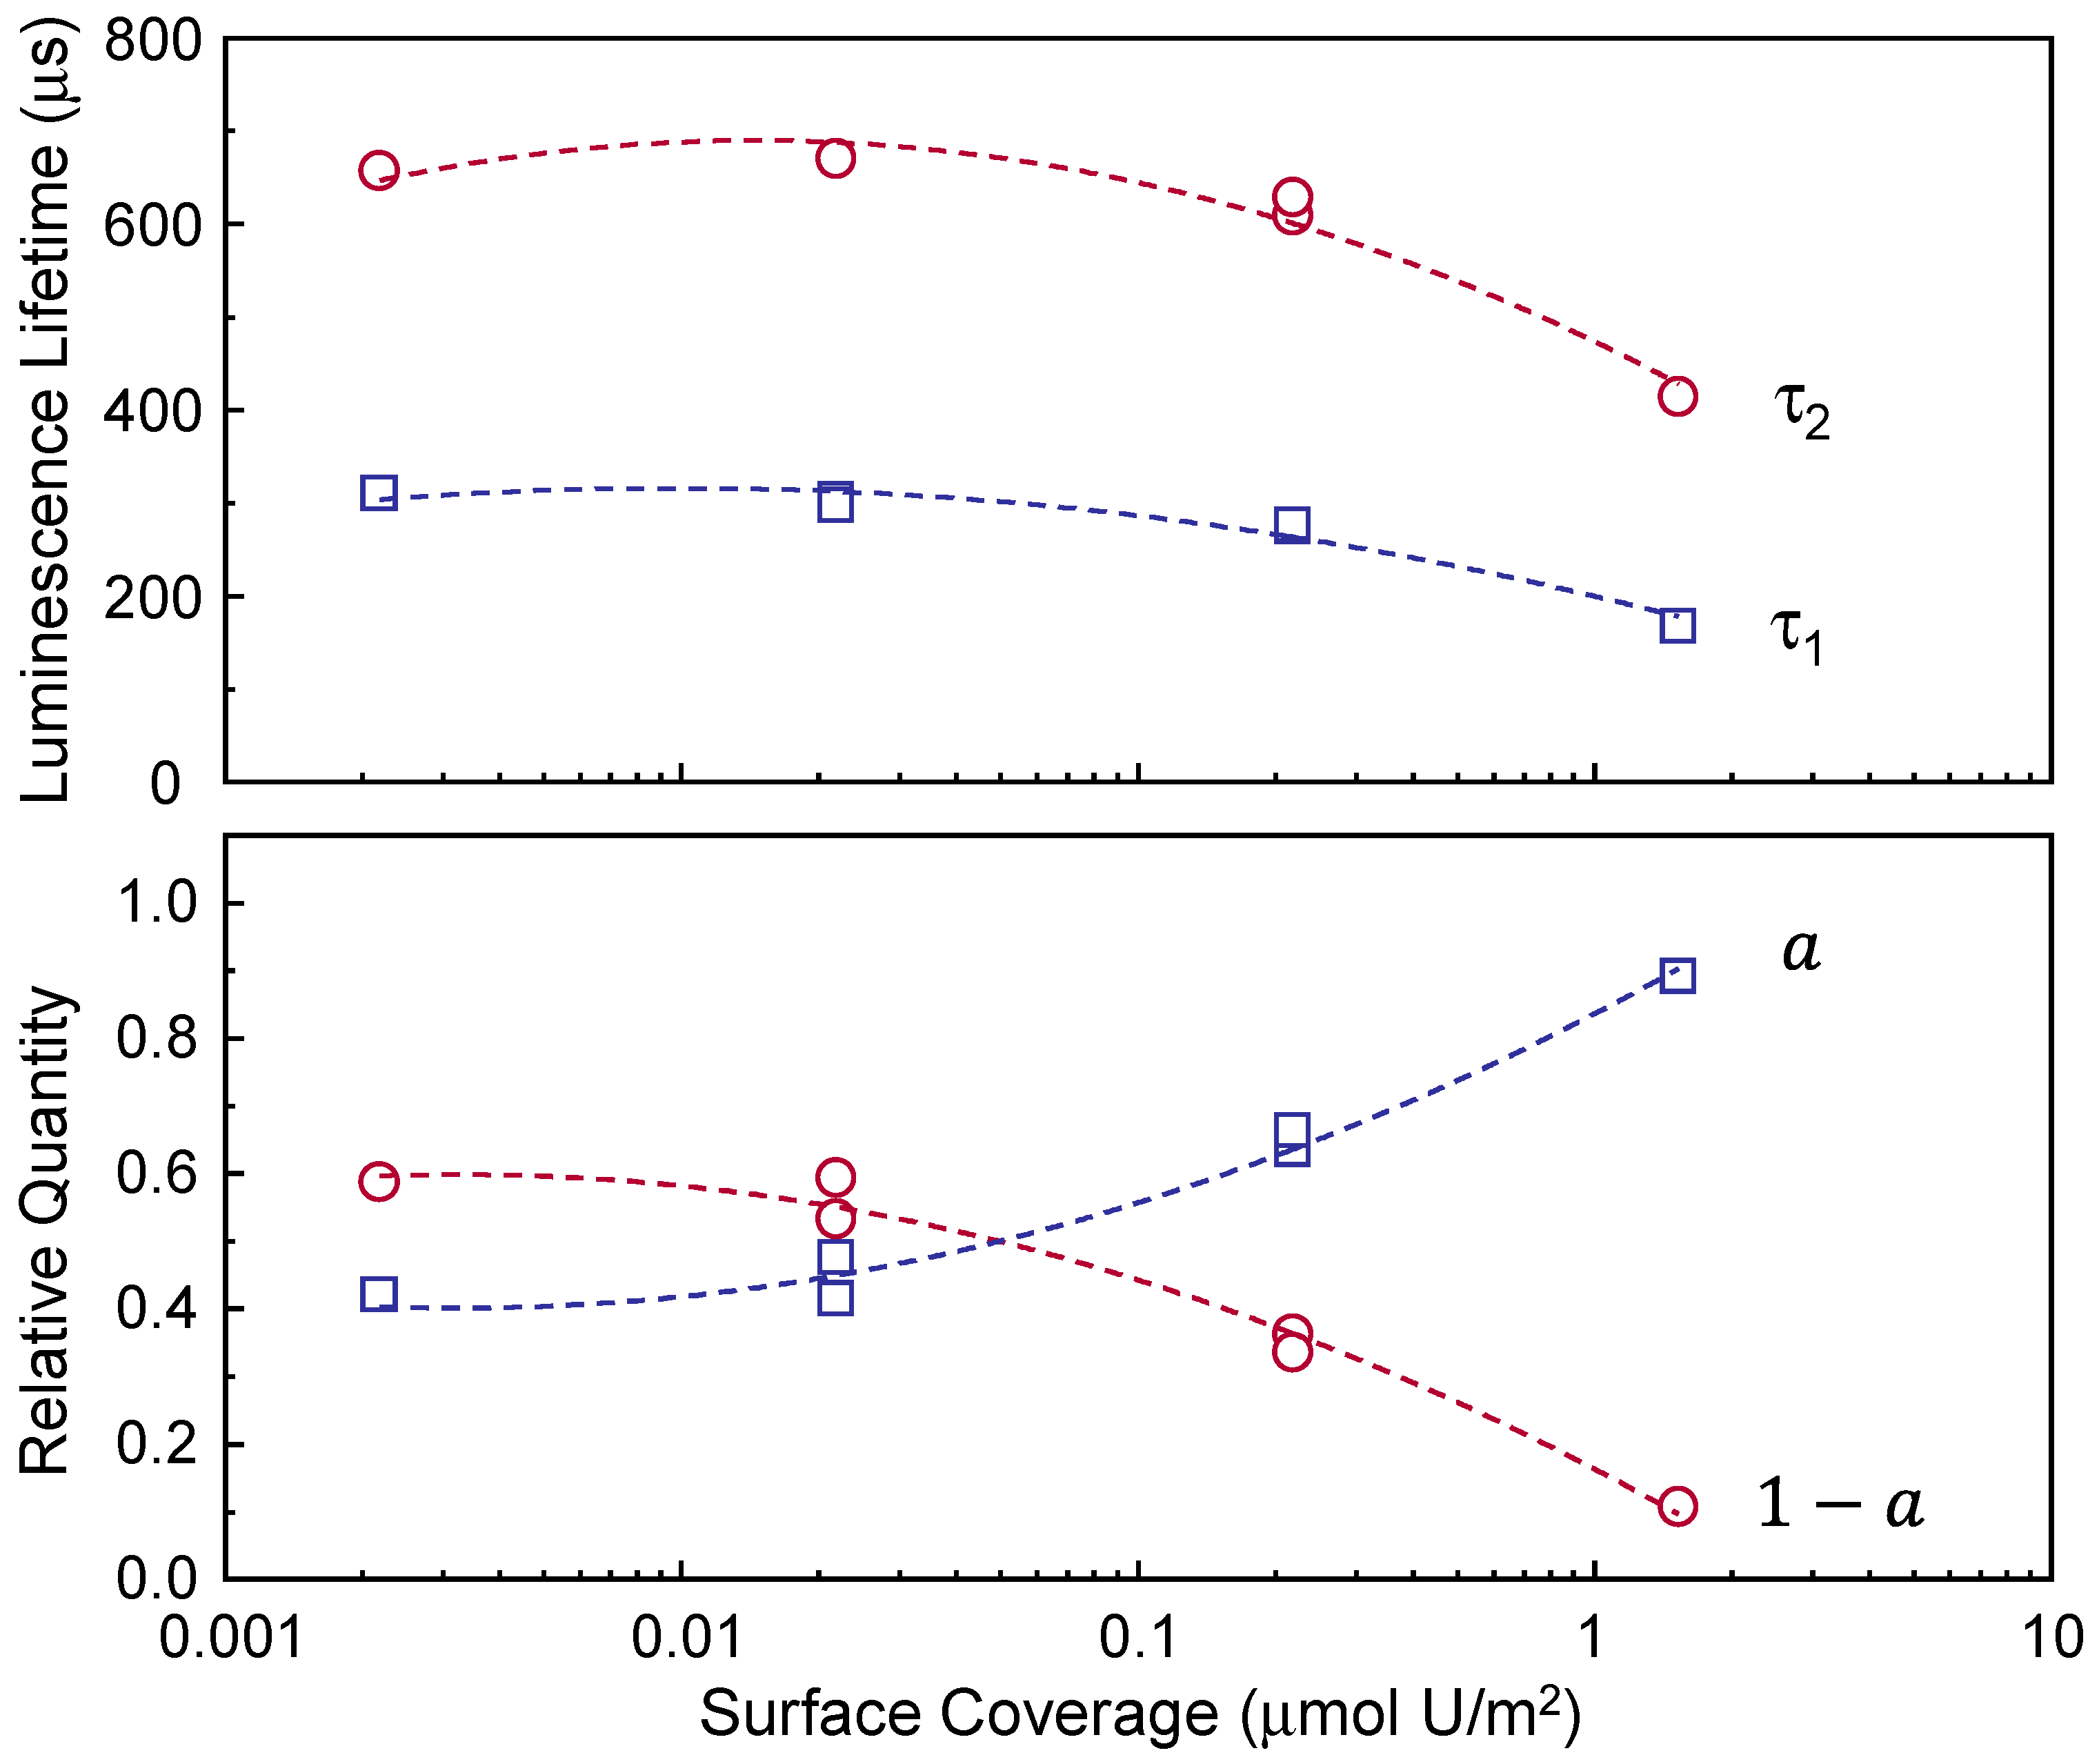
The data listed in
Table 2 are plotted as a function of Γ in
Figure 4. Interestingly, a change in luminescence lifetime is observed as Γ changes, as shown in the upper panel of
Figure 4. τ
1 and τ
2 change from approximately 170 and 400 μs, respectively, and converge at approximately 310 and 670 μs in the Γ region below 0.01 μmol U/m
2. The lower panel of
Figure 4 shows the relative quantities of species 1 and 2. The quantity of species 1 (
in Equation (1)) increases with increasing Γ, and vice versa for species 2 (
in Equation (1)).
The decomposition results from the three spectra in the lower panel of
Figure 2 are presented in
Figure 5. The luminescence spectra of species 1 were resolved by subtracting the corrected spectra of species 2 from the corresponding luminescence spectra taken at
td = 1 μs [
22,
41,
42]. The corrected spectra of species 2 at
td = 1 μs were obtained from the luminescence spectra acquired at
td = 2501 μs by compensating for the exponential decay of the luminescence intensity with a lifetime τ
2, as listed in
Table 2. Different luminescence peak positions in the luminescence spectra of species 1 are observed with changing Γ, depicted as solid lines in the upper panel of
Figure 5. The peak positions of species 1 measured at Γ ≈ 1.526 μmol U/m
2 are blue-shifted compared to those measured at lower Γ values (Γ ≈ 0.217 and 0.021 μmol U/m
2).
The spectral shapes of species 2 taken at
td = 2501 μs in the lower panel of
Figure 5 are almost identical for all samples with different Γ values. Thus, species 2 may have a similar nature for all samples. The peak positions of species 2 in the lower panel imply that species 2 is the U(VI)-hydroxo surface species. Considering the [U(VI)] level of 0.34–3.4 μM used in this study, species 2 likely represents ≡SiO
2(UO
2)OH
− [
17].
The question is whether the short-lived species 1 represents ≡SiO
2UO
2, which is known to be the predominant species in the acidic pH range, or another species existing in the near-neutral pH range. The upper panel of
Figure 5 compares the spectra of species 1 with the spectrum of ≡SiO
2UO
2 (dashed line) measured from the SiO
2 sample at pH 4.0 (the same spectrum shown in
Figure 1). It is clearly observed that the luminescence peak positions of species 1 measured at pH 7.5 do not exactly coincide with those of ≡SiO
2UO
2 measured at pH 4.0.
PARAFAC analysis was also applied to decompose the spectra in
Figure 2. The decomposition with two spectral components converges well with high core-consistency value of 99.8%. However, analysis using the three spectral components resulted in a lack of core-consistency.
Figure S5 shows the results of PARAFAC analysis obtained from the six spectra in
Figure 2. Similar to the results in
Figure 5, species 1 shows the peak maxima shifted in the longer wavelength direction compared to those of ≡SiO
2UO
2. In the lower panel of
Figure S5, the luminescence lifetimes of the decomposed spectra were determined to be τ
1 = 219 and τ
2 = 617 μs, respectively. However, these values obtained from the five datasets, excluding the highest Γ, changed to τ
1 = 306 and τ
2 = 641 μs, respectively (data not shown). This result also suggests that the luminescence characteristics of the U(VI) surface species depend on the Γ values, as described in
Table 2 and
Figure 4. In order to directly present Γ-dependent luminescence characteristics, it is preferred to explain the decomposition results extracted by the manual subtraction method rather than the PARAFAC analysis.
In addition, species 1 shows unstable complexation properties. For example, the luminescence spectrum measured at
td = 1 μs in
Figure S6a reveals a V/P intensity ratio of approximately 0.64 immediately after sample preparation (in the so-called ‘fresh sample’). After 16 months of reaction time, the V/P intensity ratio changes to approximately 0.55, as shown by the dotted line in
Figure S6a, because species 1 (relative quantity of approximately 41% in the fresh sample, as shown in the first row of
Table 2) almost disappears for the aged sample, which was stored in an Ar-filled glove box. In contrast, the quantity of species 2 (relative quantity of approximately 59% in the fresh sample, as shown in the first row of
Table 2) increases with increasing ageing time at the expense of species 1. Consequently, the luminescence lifetime of the aged sample was determined using a single exponential decay equation (τ
2 only) instead of Equation (1), as shown in
Figure S6b. These results imply that species 2 is more strongly bonded to the surface than species 1. A very similar ageing effect was observed in the previous TRLFS study on the U(VI) surface species adsorbed on the low SSA quartz powders (US Silica, Katy, TX, USA, Min-U-Sil 30, SSA of 1.63 ± 0.02 m
2/g) by Ilton et al. [
22]. They reported that the long-term contact of U(VI) with SiO
2 under neutral pH conditions resulted in a change in the species distribution and proposed a monodentate U(VI) surface complex as unstable species 1 because of the weak bonding nature to the surface. The increase in the relative quantity of species 2 was attributed to the formation of multidentate U(VI) surface complexes [
22] based on the molecular dynamic modelling of hydroxylated-U(VI) adsorption to low-index quartz surfaces [
43].
At present, the TRLFS results alone do not provide sufficient information for the chemical speciation of species 1 observed at pH 7.5. A more in-depth study is needed to elucidate whether different peak positions of species 1 compared with those of ≡SiO2UO2 indicate another different U(VI) surface species existing in the near-neutral pH range or a Γ-dependent drift of the luminescence properties of ≡SiO2UO2.
The identical spectral shapes in the lower panel of
Figure 5 with the Γ-dependent luminescence lifetimes of the species 2 listed in
Table 2 indicate that the luminescence properties are significantly influenced by the surface parameters of SiO
2. Multidentate U(VI)-SiO
2 surface complexes are most likely formed under low Γ conditions due to the presence of high affinity sites, which are significant when smaller ratios of U(VI) loading to surface sites are involved. Similarly, a bridging bidentate configuration with U(VI) binding to the two surface sites was suggested as the surface species under low U(VI) loading conditions [
9,
10,
44].
In this regard, it is of interest to examine the pH-dependent luminescence lifetimes of U(VI) surface species with a fixed [U(VI)]/(
m/
v] ratio because the probability of having two or more deprotonated adjacent sites increases with increasing pH [
22].
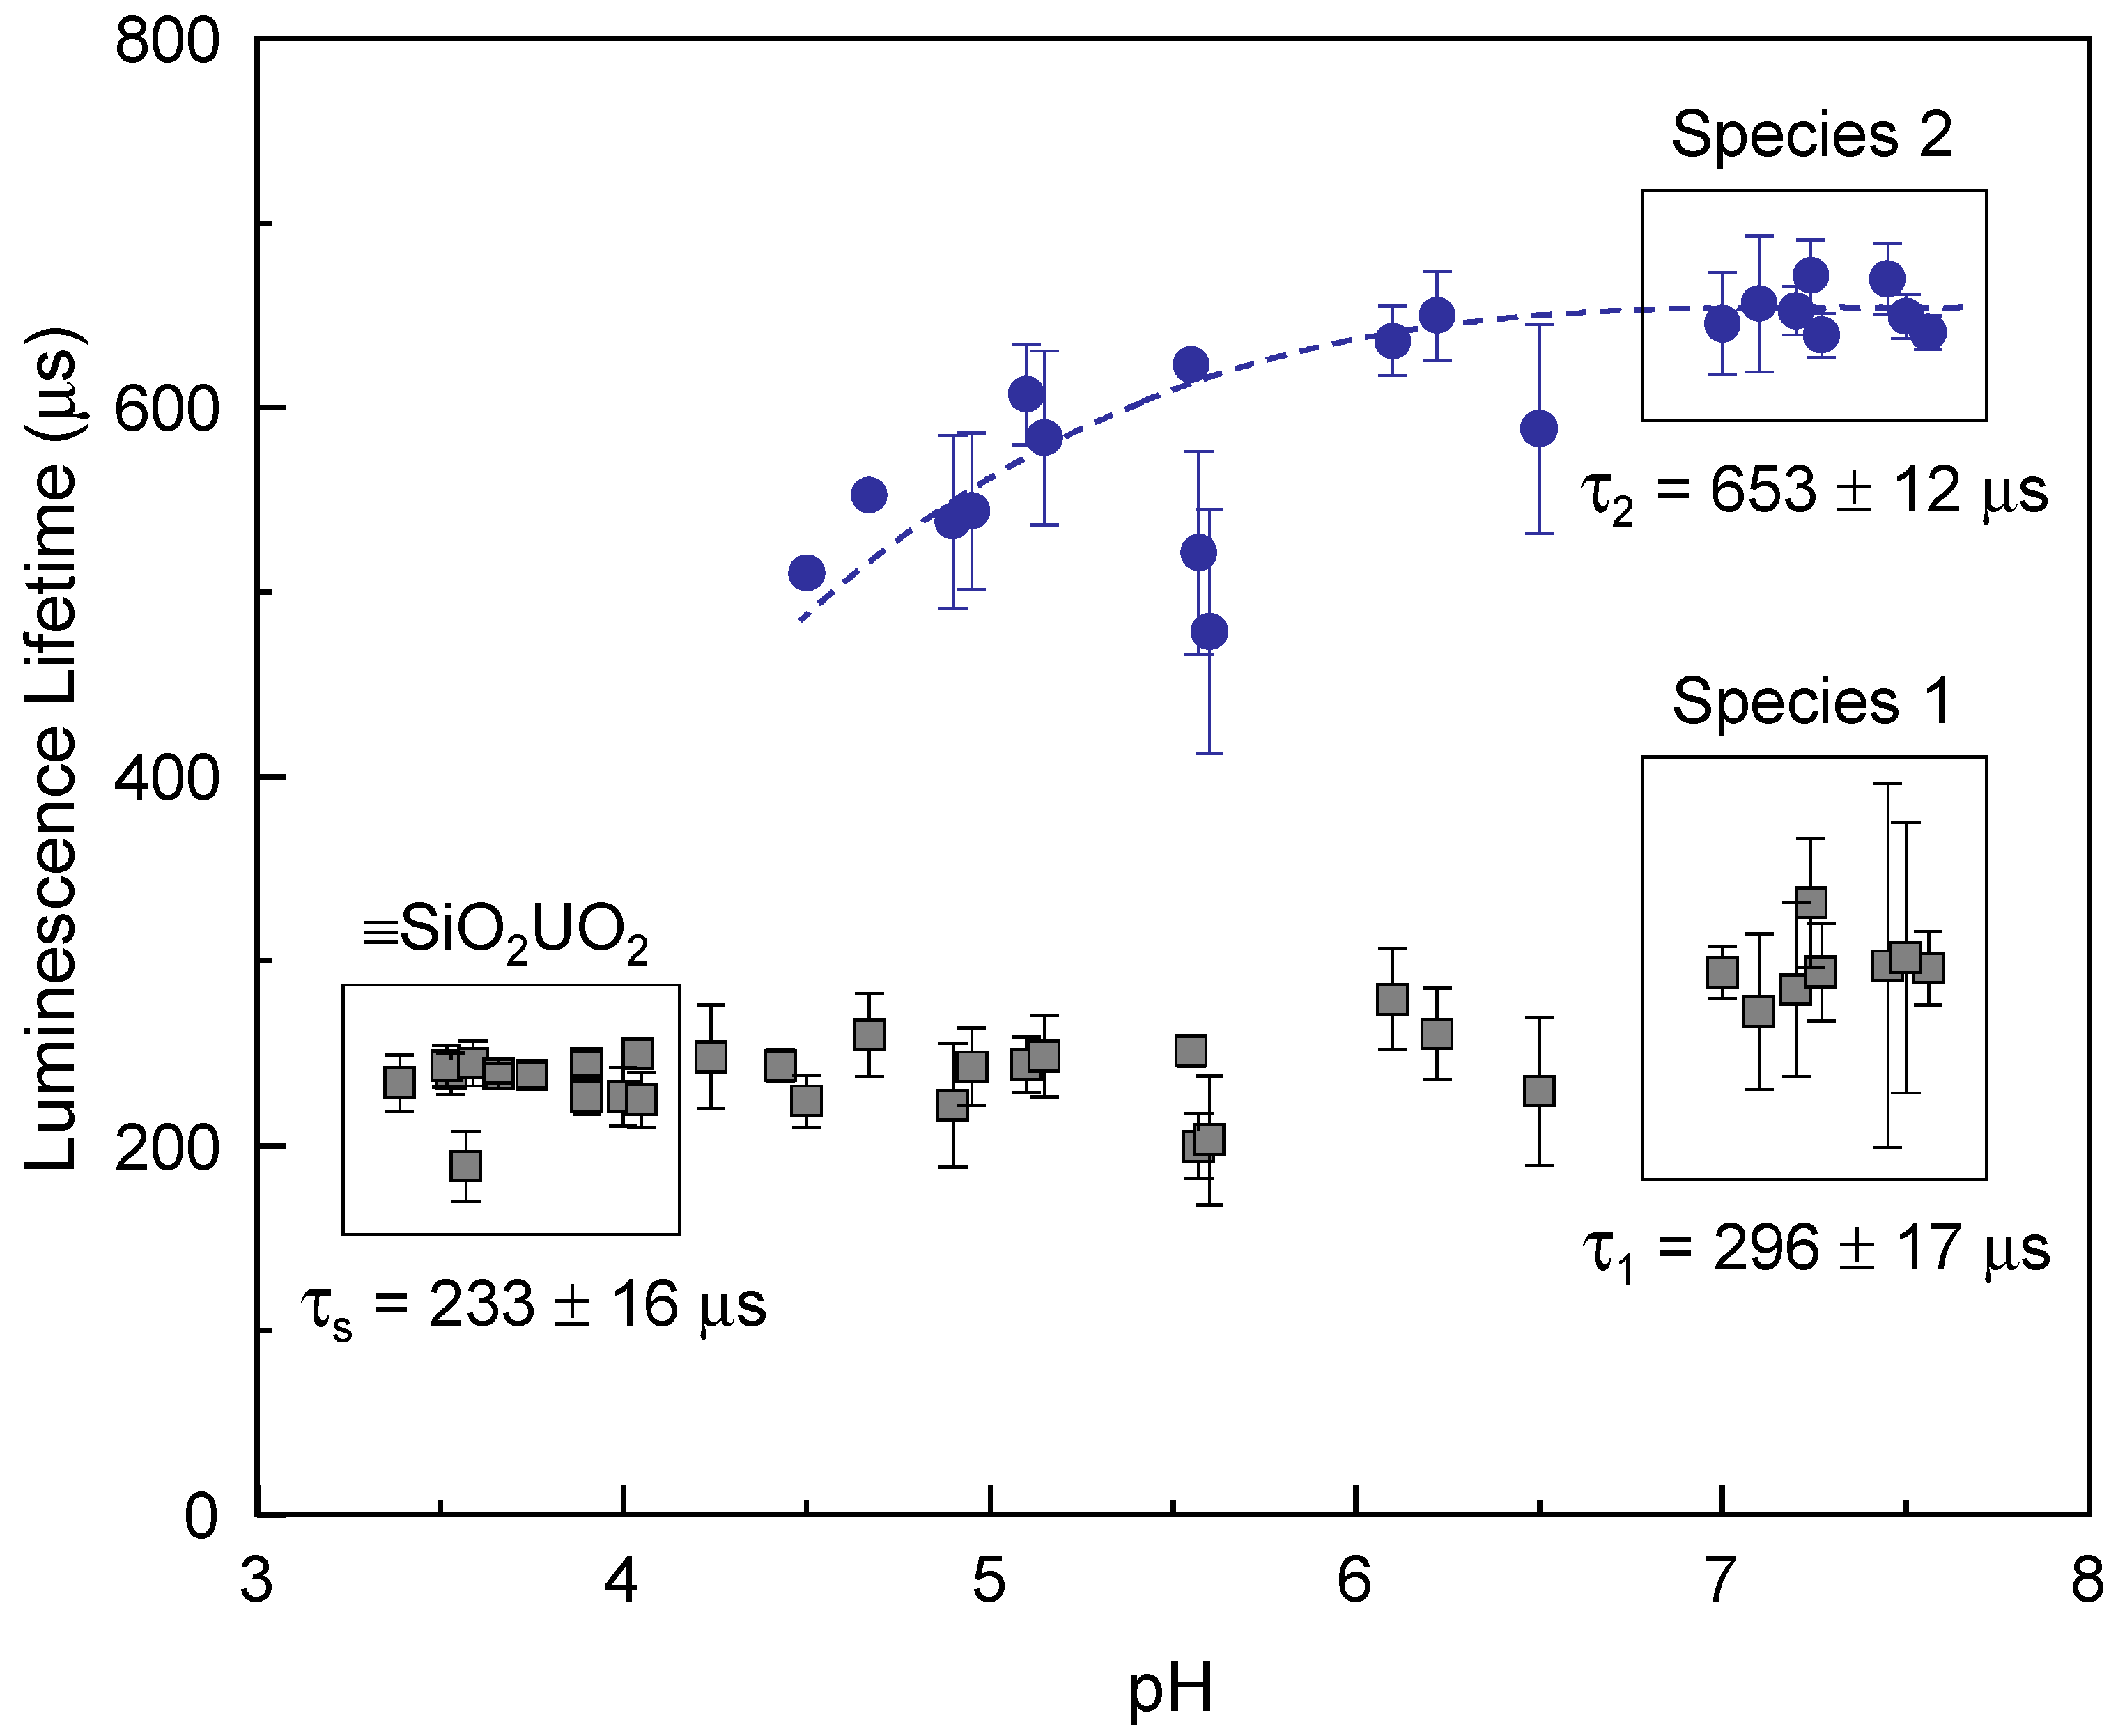
Figure 6 summarizes the luminescence lifetimes determined from 34 fresh samples (sample No. 1, [
m/
v] = 1.0 g/L, [U(VI)] = 3.4 μM) under various pH conditions in the range of 3.4–7.6. The luminescence lifetime was determined to be τ
s = 233 ± 16 μs for the samples in the pH range of 3.4–4.1, where only the luminescence spectra of the ≡SiO
2UO
2 species appear. The lifetimes of species 1 and 2 were determined to be τ
1 = 296 ± 17 μs and τ
2 = 653 ± 12 μs, respectively, in the pH range of 7.0–7.6. Although the spectral shapes of species 2 are almost identical, as shown in the lower panel of
Figure 1, the luminescence lifetimes vary in the pH range of 4.5–7.6, as depicted by the dashed line in
Figure 6, which can be seen even with the naked eye. The lifetime increases from approximately 500 μs near pH 4.5 and converges to a constant value at near-neutral pH. The pH-dependent luminescence lifetimes of U(VI) surface species at a fixed [U]/[
m/
v] ratio in
Figure 6 are in accordance with the Γ-dependent luminescence lifetimes at fixed pH in
Figure 4. These observations are major experimental results that can explain the cause of the inconsistent luminescence lifetimes reported in previous studies, irrespective of whether species 2 represents ≡SiO
2(UO
2)OH
− or ≡SiO
2(UO
2)
3(OH)
5−. The luminescence lifetimes determined in this study are listed in the last row of
Table S1.
The Γ-dependent luminescence properties were examined for the other high SSA SiO
2 samples (sample No. 2, pH 7.5), and the results are shown in
Figures S7–S9 and Table S2. Although there was a large difference in particle size between SiO
2 samples No. 1 and No. 2 (
Table 1), very similar trends in the luminescence properties were identified. These results demonstrate that the luminescence properties of the U(VI) surface species on amorphous SiO
2 are independent of the particle size.
Figures S10 and S11 and Table S3 show the luminescence characteristics measured from the low SSA SiO
2 samples (sample No. 3, pH 7.5). The Γ-dependent luminescence properties are also clearly observed.
The upper panel in
Figure 7 compares the luminescence spectral shapes measured from the high- and low-SSA samples listed in
Table 1. Despite the significantly different
m/
v values (0.01 g/L for sample No. 1 and 1.0 g/L for sample No. 3), the luminescence spectra resemble each other in a similar Γ range (approximately Γ = 1.5 μmol U/m
2 for fresh sample No. 1 and Γ = 1.7 μmol U/m
2 for fresh sample No. 3 at [U(VI)] = 3.4 μM). The luminescence spectrum measured from fresh sample No. 3 shows a V/P intensity ratio of approximately 0.8. This ratio changes to approximately 0.65 after one year of reaction time, as indicated by the dashed line because the relative quantity of species 2 increases with time. It is observed that the ageing effect changes the luminescence lifetime as well as the spectral shape. As shown in the lower panel of
Figure 7, the luminescence lifetimes of both species 1 and 2 increase with increasing ageing time. As a year passed, the relative amount of species 1 decreased from 93% to 49%, and that of species 2 increased from 7% to 51%. In a previous study on the ageing effect, Ilton et al. performed TRLFS experiments at liquid He temperature and did not report the lifetime information of the U(VI) surface species; thus, direct comparison of their results with those obtained in this study is not possible [
22]. Nevertheless, the data displayed in
Figure 7 suggest that the ageing time-dependent luminescence properties result from surface complexes, which evolved toward higher coordination with surface sites.
3.2. Excitation Wavelength- and Pulse Energy-Dependent Luminescence Properties
In this subsection, the term ‘laser-induced reaction’ refers to changes in the luminescence intensity and/or spectral shape that occur during laser irradiation.
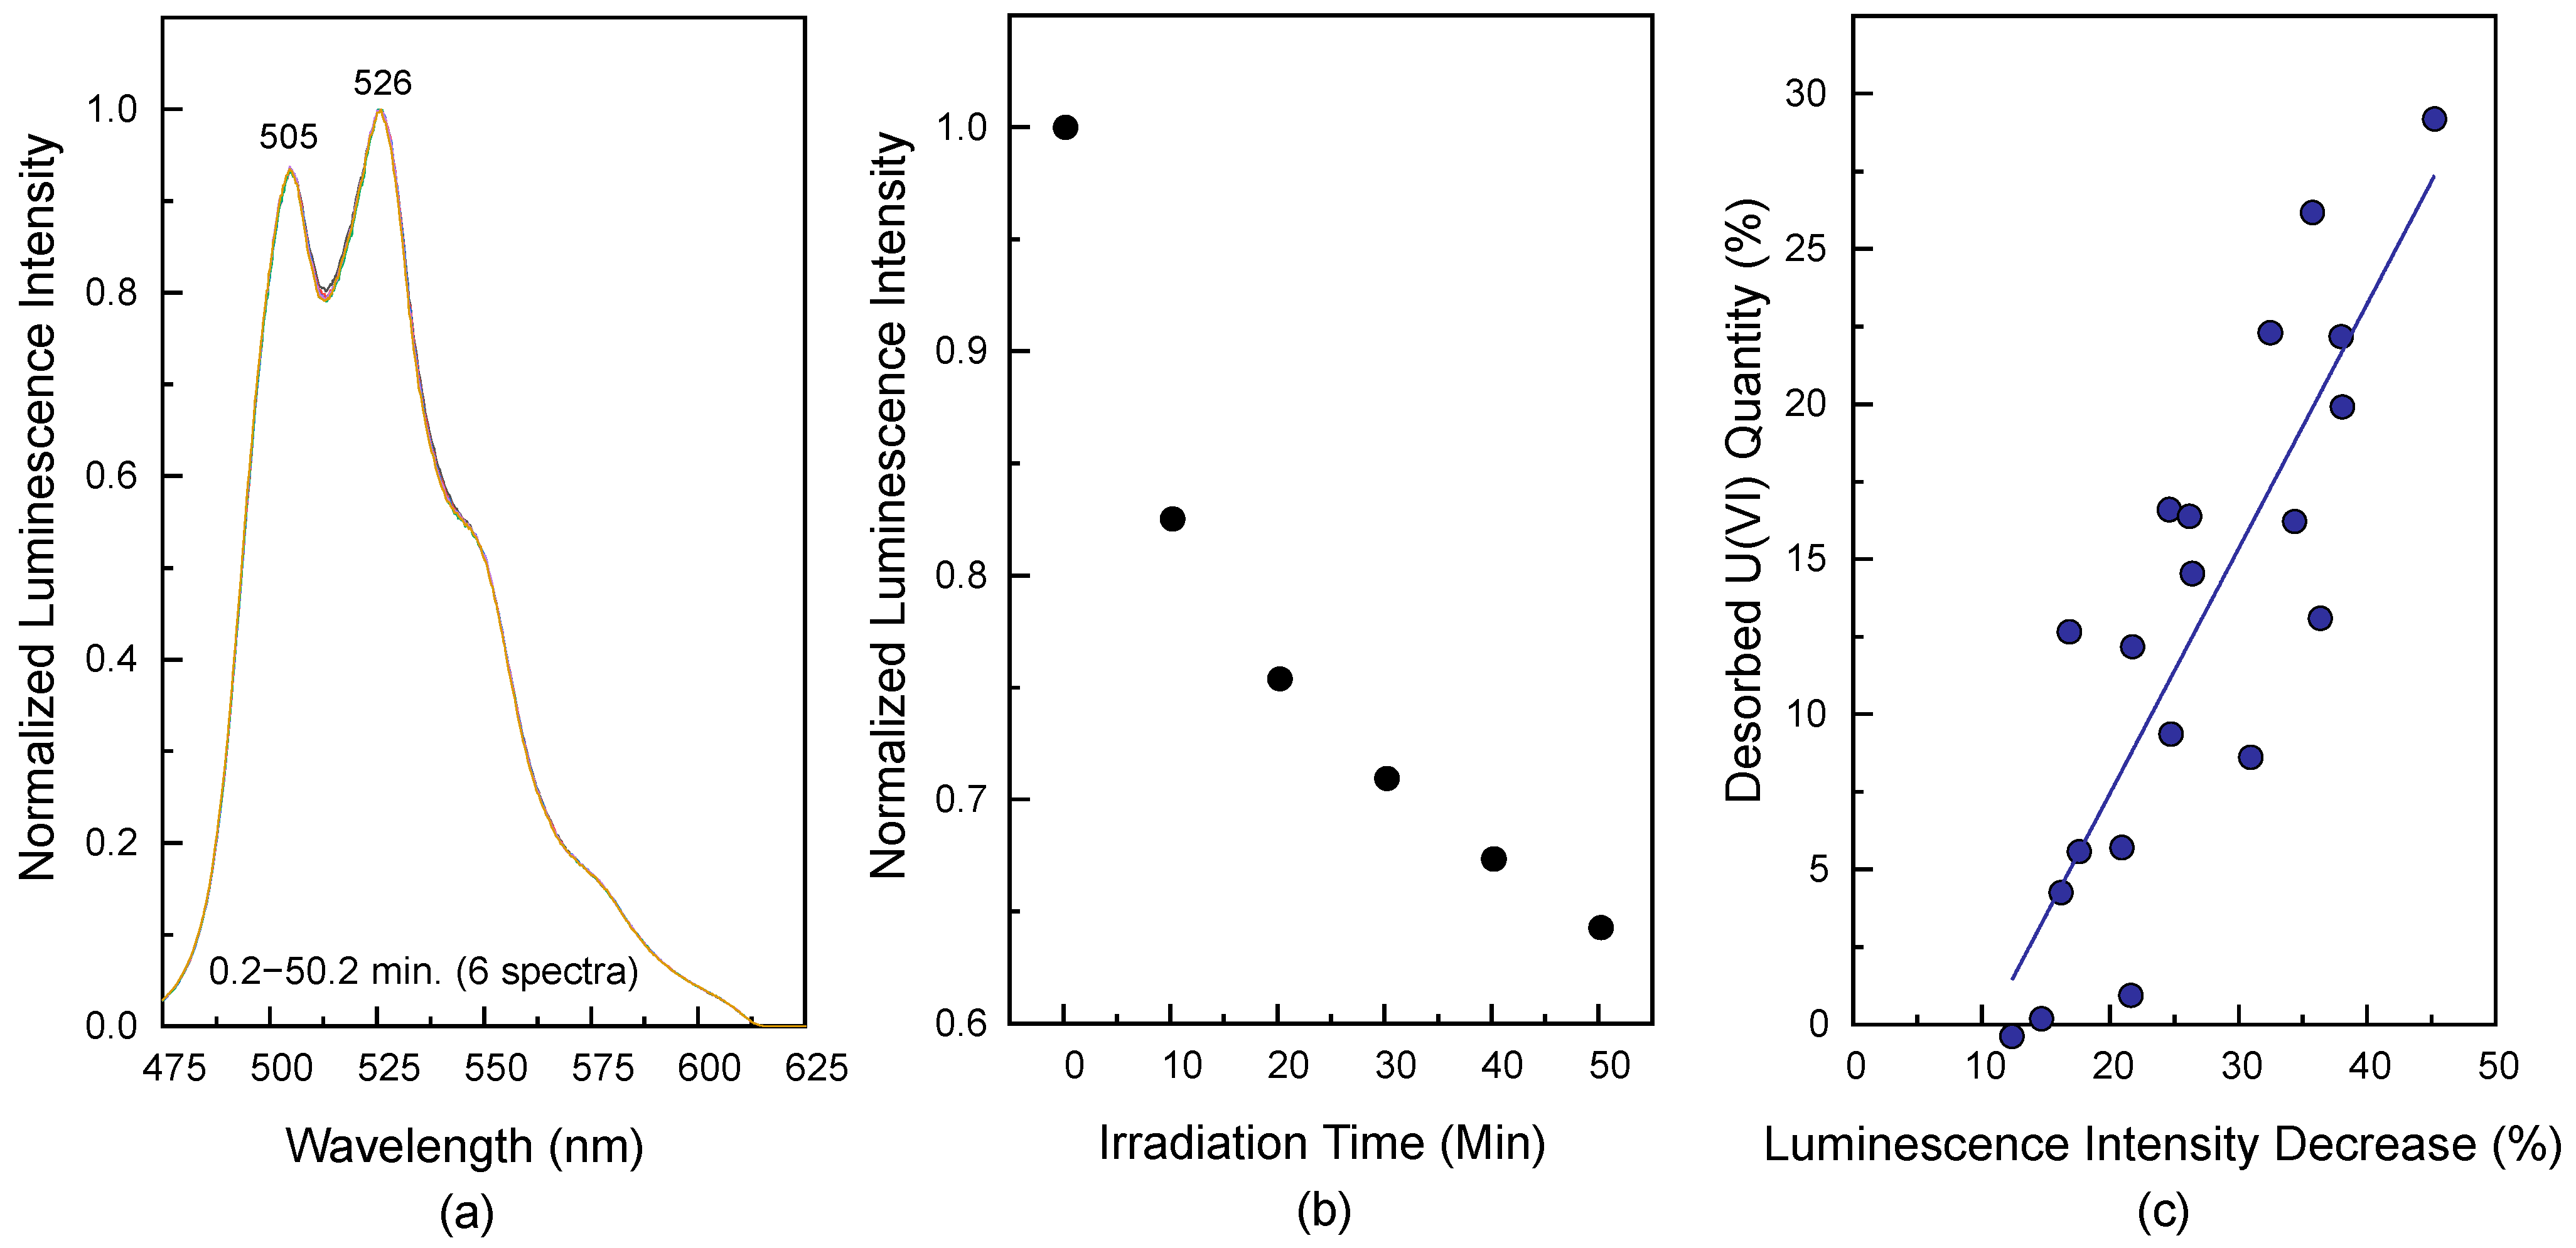
Figure 8 depicts the laser-induced reaction effect generated by irradiating a laser beam with a pulse energy of 2.4 mJ at
λex = 266 nm on the luminescence intensity of U(VI) surface species measured from the low SSA sample (sample No. 3, [U(VI)] = 3.4 μM, and
m/
v = 1.0 g/L) at pH 7.5. The luminescence spectra were measured at
td = 1 μs as a function of the laser irradiation time. The normalized luminescence spectra maintain their shapes as the irradiation time increases, as shown in
Figure 8a. The luminescence intensities in
Figure 8b were obtained by integrating the signal from 475 to 600 nm in the luminescence spectrum and were normalized by the strongest value measured at an irradiation time of 0.2 min.
Figure 8b reveals that the luminescence intensity decreases by approximately 38% after approximately 50 min of laser irradiation. This result can be understood in terms of the LITD of U(VI) surface species by the following processes: (1) when a portion of the laser pulse energy is absorbed into the surface, the localised surface heating induces thermal desorption of adsorbed species; and (2) the desorption of adsorbed U(VI) surface species results in an immediate decrease in the luminescence intensity [
45,
46,
47,
48].
The suitability of LITD as a cause of the laser-induced reaction was demonstrated by monitoring the desorbed U(VI) from the surface.
Figure 8c represents the quantities of desorbed U(VI) in the filtrates obtained from the same SiO
2 samples used in
Figure 8a,b at pH values of 6.2–7.2 irradiated under the same laser conditions. The X-axis in
Figure 8c denotes the change in the luminescence intensity resulting from the laser-induced reaction, which was controlled by varying the irradiation time of the laser beam. Consequently, the luminescence intensities decreased by approximately 15–45%. As soon as the laser-induced reaction was complete after laser irradiation, the samples were centrifuged and filtered for quantitative analysis of the desorbed U(VI). The Y-axis in
Figure 8c denotes the quantities of desorbed U(VI) in the filtrates determined using ICP-AES. A large amount of U(VI) (up to nearly 30% of the adsorbed U(VI)) was desorbed in the filtrates. The solid line in
Figure 8c was obtained by fitting the data to a linear regression. The quantity of desorbed U(VI) is linearly dependent on the change in the luminescence intensity. This result provides direct evidence of LITD as the origin of the laser-induced reaction of the U(VI) surface species. Although the quantities of desorbed U(VI) correlate well with the changes in the luminescence intensities, the solid line with a slope of approximately 0.78 and an intercept of approximately −8.3 in
Figure 8c indicates that the quantities of desorbed U(VI) are smaller than the changes in the luminescence intensities. The reason for this phenomenon is presumed to be that a small amount of U(VI) desorbed from the SiO
2 surface is adsorbed on a quartz cell, and this was not used for quantitative analysis. Under the same measurement conditions, the luminescence intensity of the desorbed U(VI) species in the filtrate (approximately 20% desorbed U(VI) sample) was about 680 times weaker than that of the adsorbed U(VI) species. Therefore, it does not significantly affect the luminescence spectral shapes of adsorbed U(VI) species, as shown in
Figure 8a.
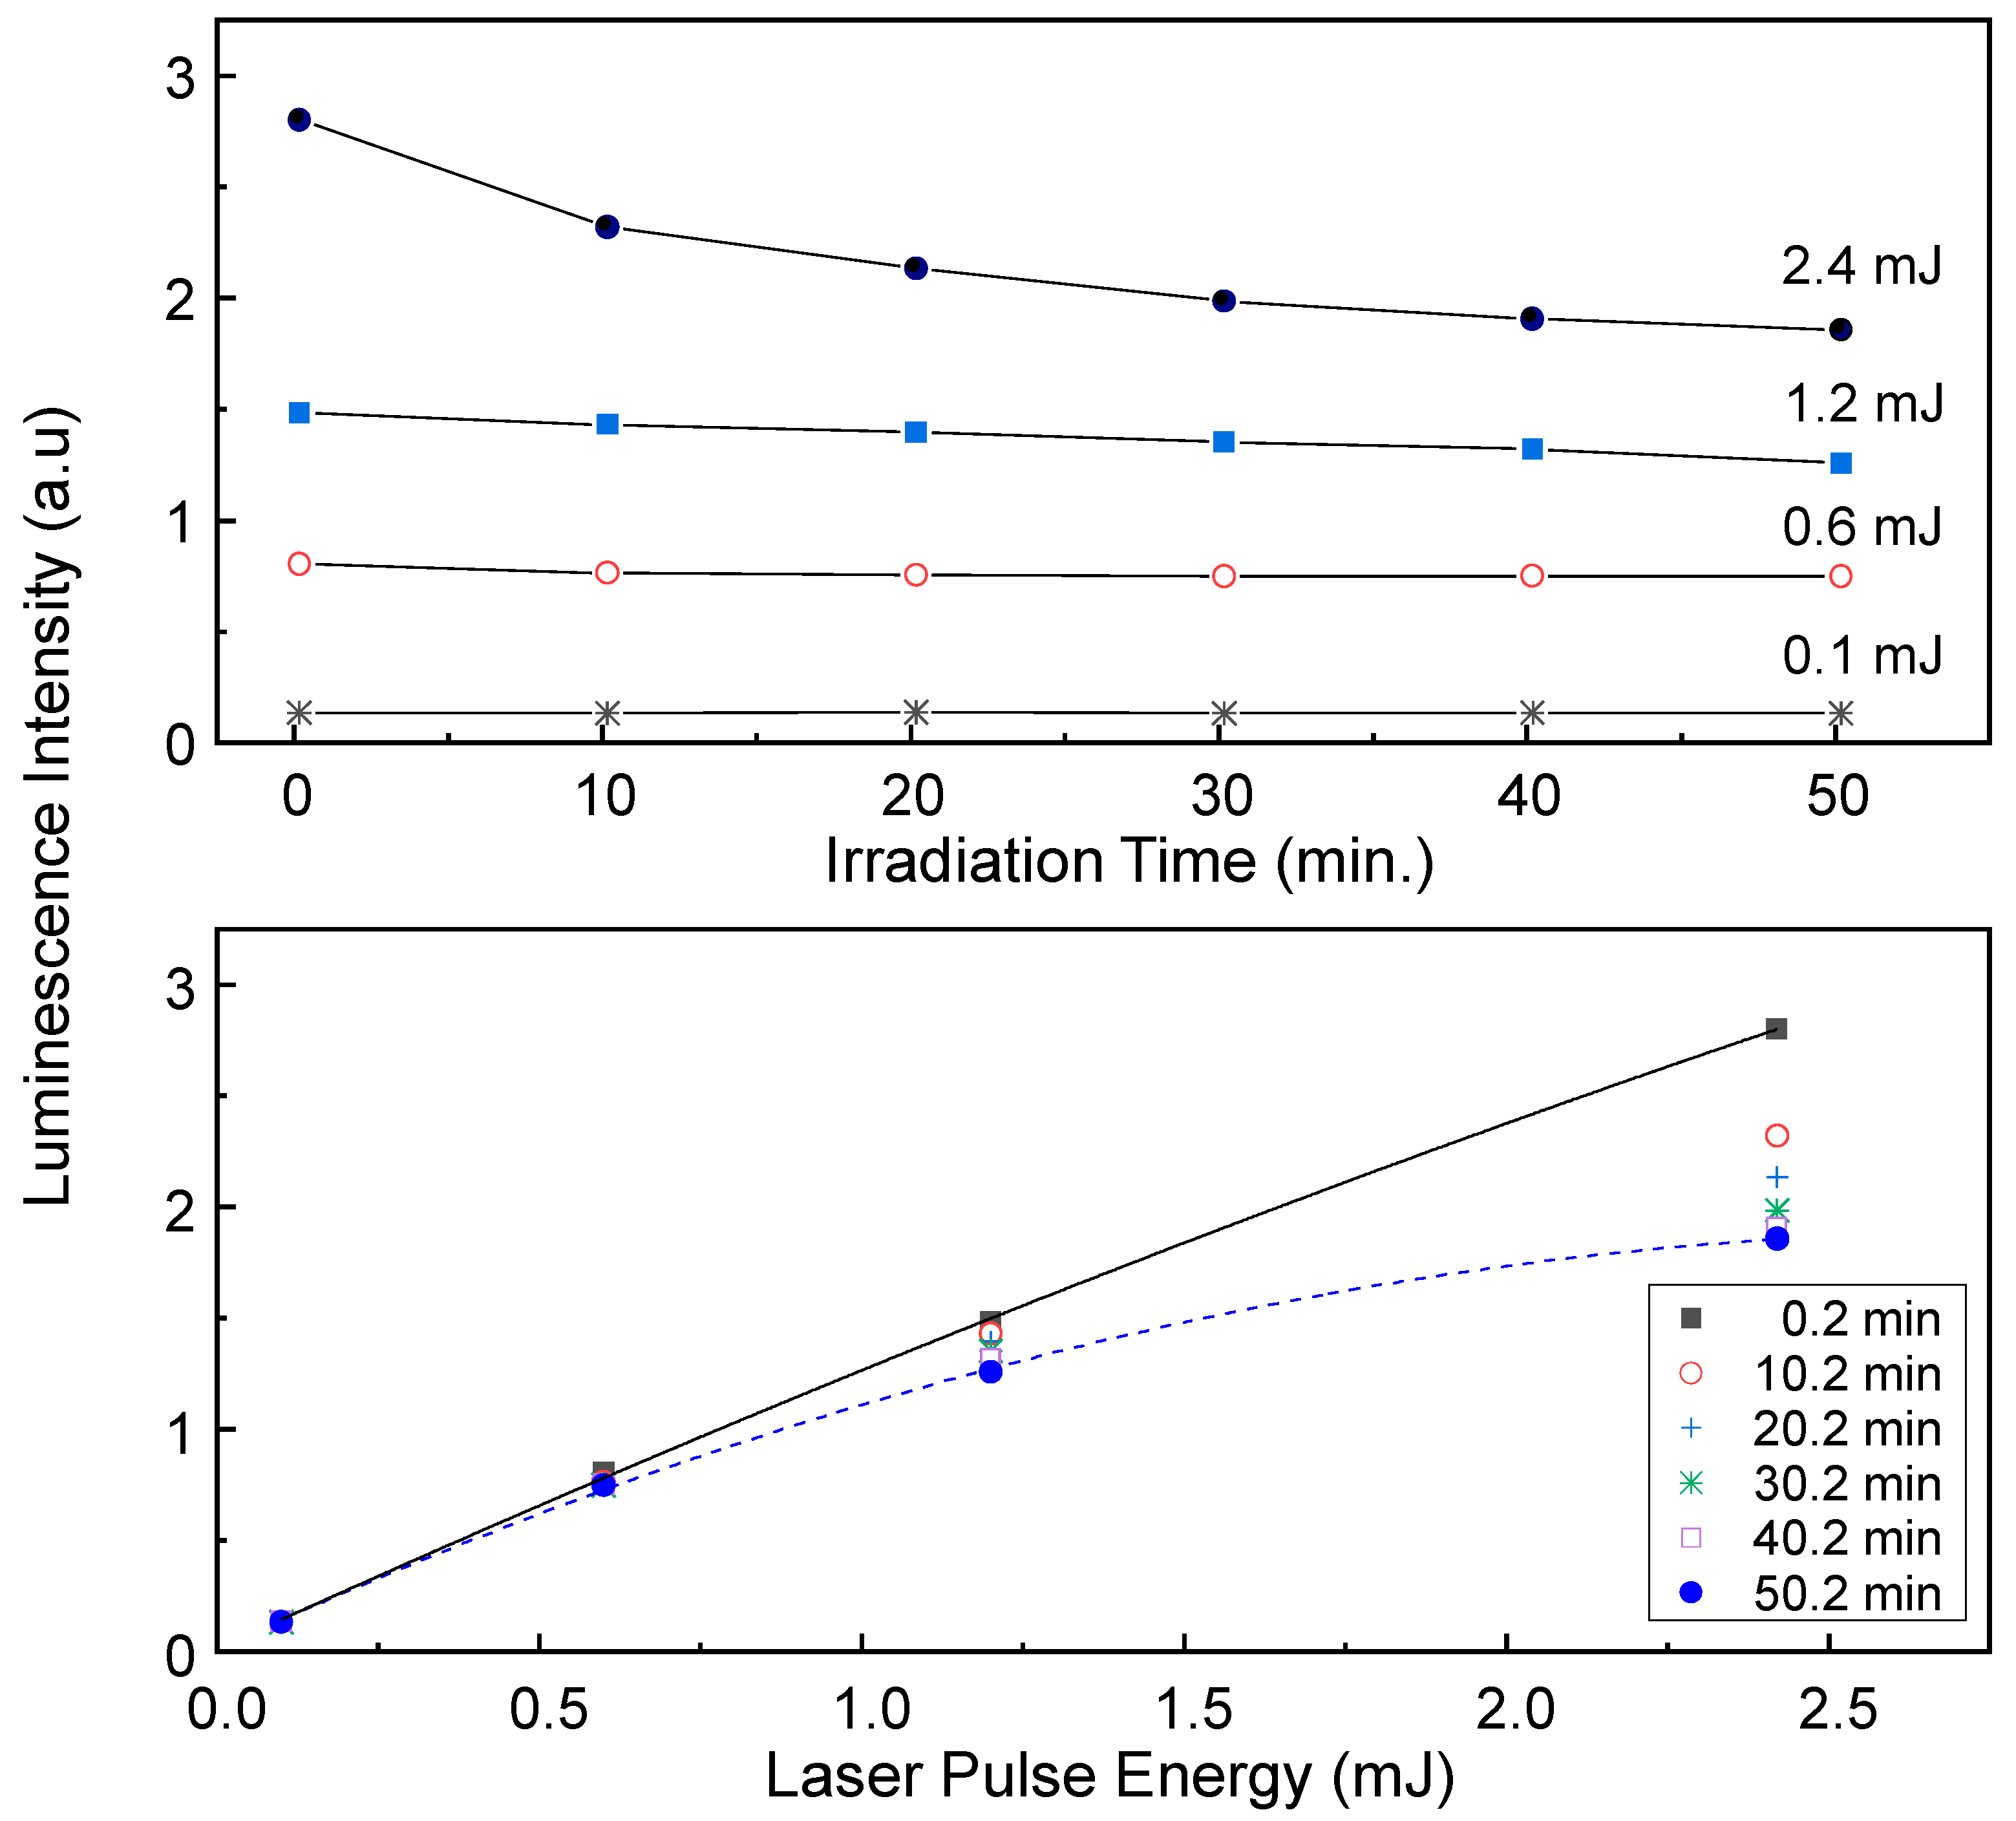
Because the absorbed laser energy is a prerequisite for localised surface heating, the dependence of the incident pulse energy on the laser-induced reaction extent was examined at
λex = 266 nm.
Figure 9 shows the effect of the incident laser pulse energy on the luminescence intensity of the U(VI) surface species measured from the high SSA sample (sample No. 2) at pH 7.5, [U(VI)] = 0.34 μM, and
m/
v = 1.0 g/L. The spectra were measured at
td = 1 μs as a function of the laser irradiation time. The luminescence intensities shown in the graphs were obtained by integrating the signal from 475 to 600 nm in the luminescence spectrum. The luminescence intensity decreases more rapidly as the laser pulse energy increases. The luminescence intensities in the upper panel of
Figure 9 are reduced by approximately 34%, 15%, and 7% after approximately 50 min of irradiation by incident laser pulse energies of 2.4, 1.2, and 0.6 mJ, respectively. There are no considerable changes in the luminescence intensities measured at the laser pulse energy of 0.1 mJ. Under the same measurement conditions at the laser pulse energy of 0.1 mJ, the luminescence intensity generated from pure SiO
2 suspension without U(VI) was about 0.1–0.3% of the luminescence intensity measured in adsorbed U(VI) species. Accordingly, the offset value generated from the background signal in
Figure 9 may be ignored. The lower panel of
Figure 9 shows the replotted luminescence intensities of the upper panel of
Figure 9 as a function of the incident laser pulse energy. Nonlinear growth of the luminescence intensities is observed with increasing laser pulse energy. The laser pulse energy-dependent nonlinear property becomes more severe as the irradiation time passes, as indicated by the dashed line in
Figure 9.
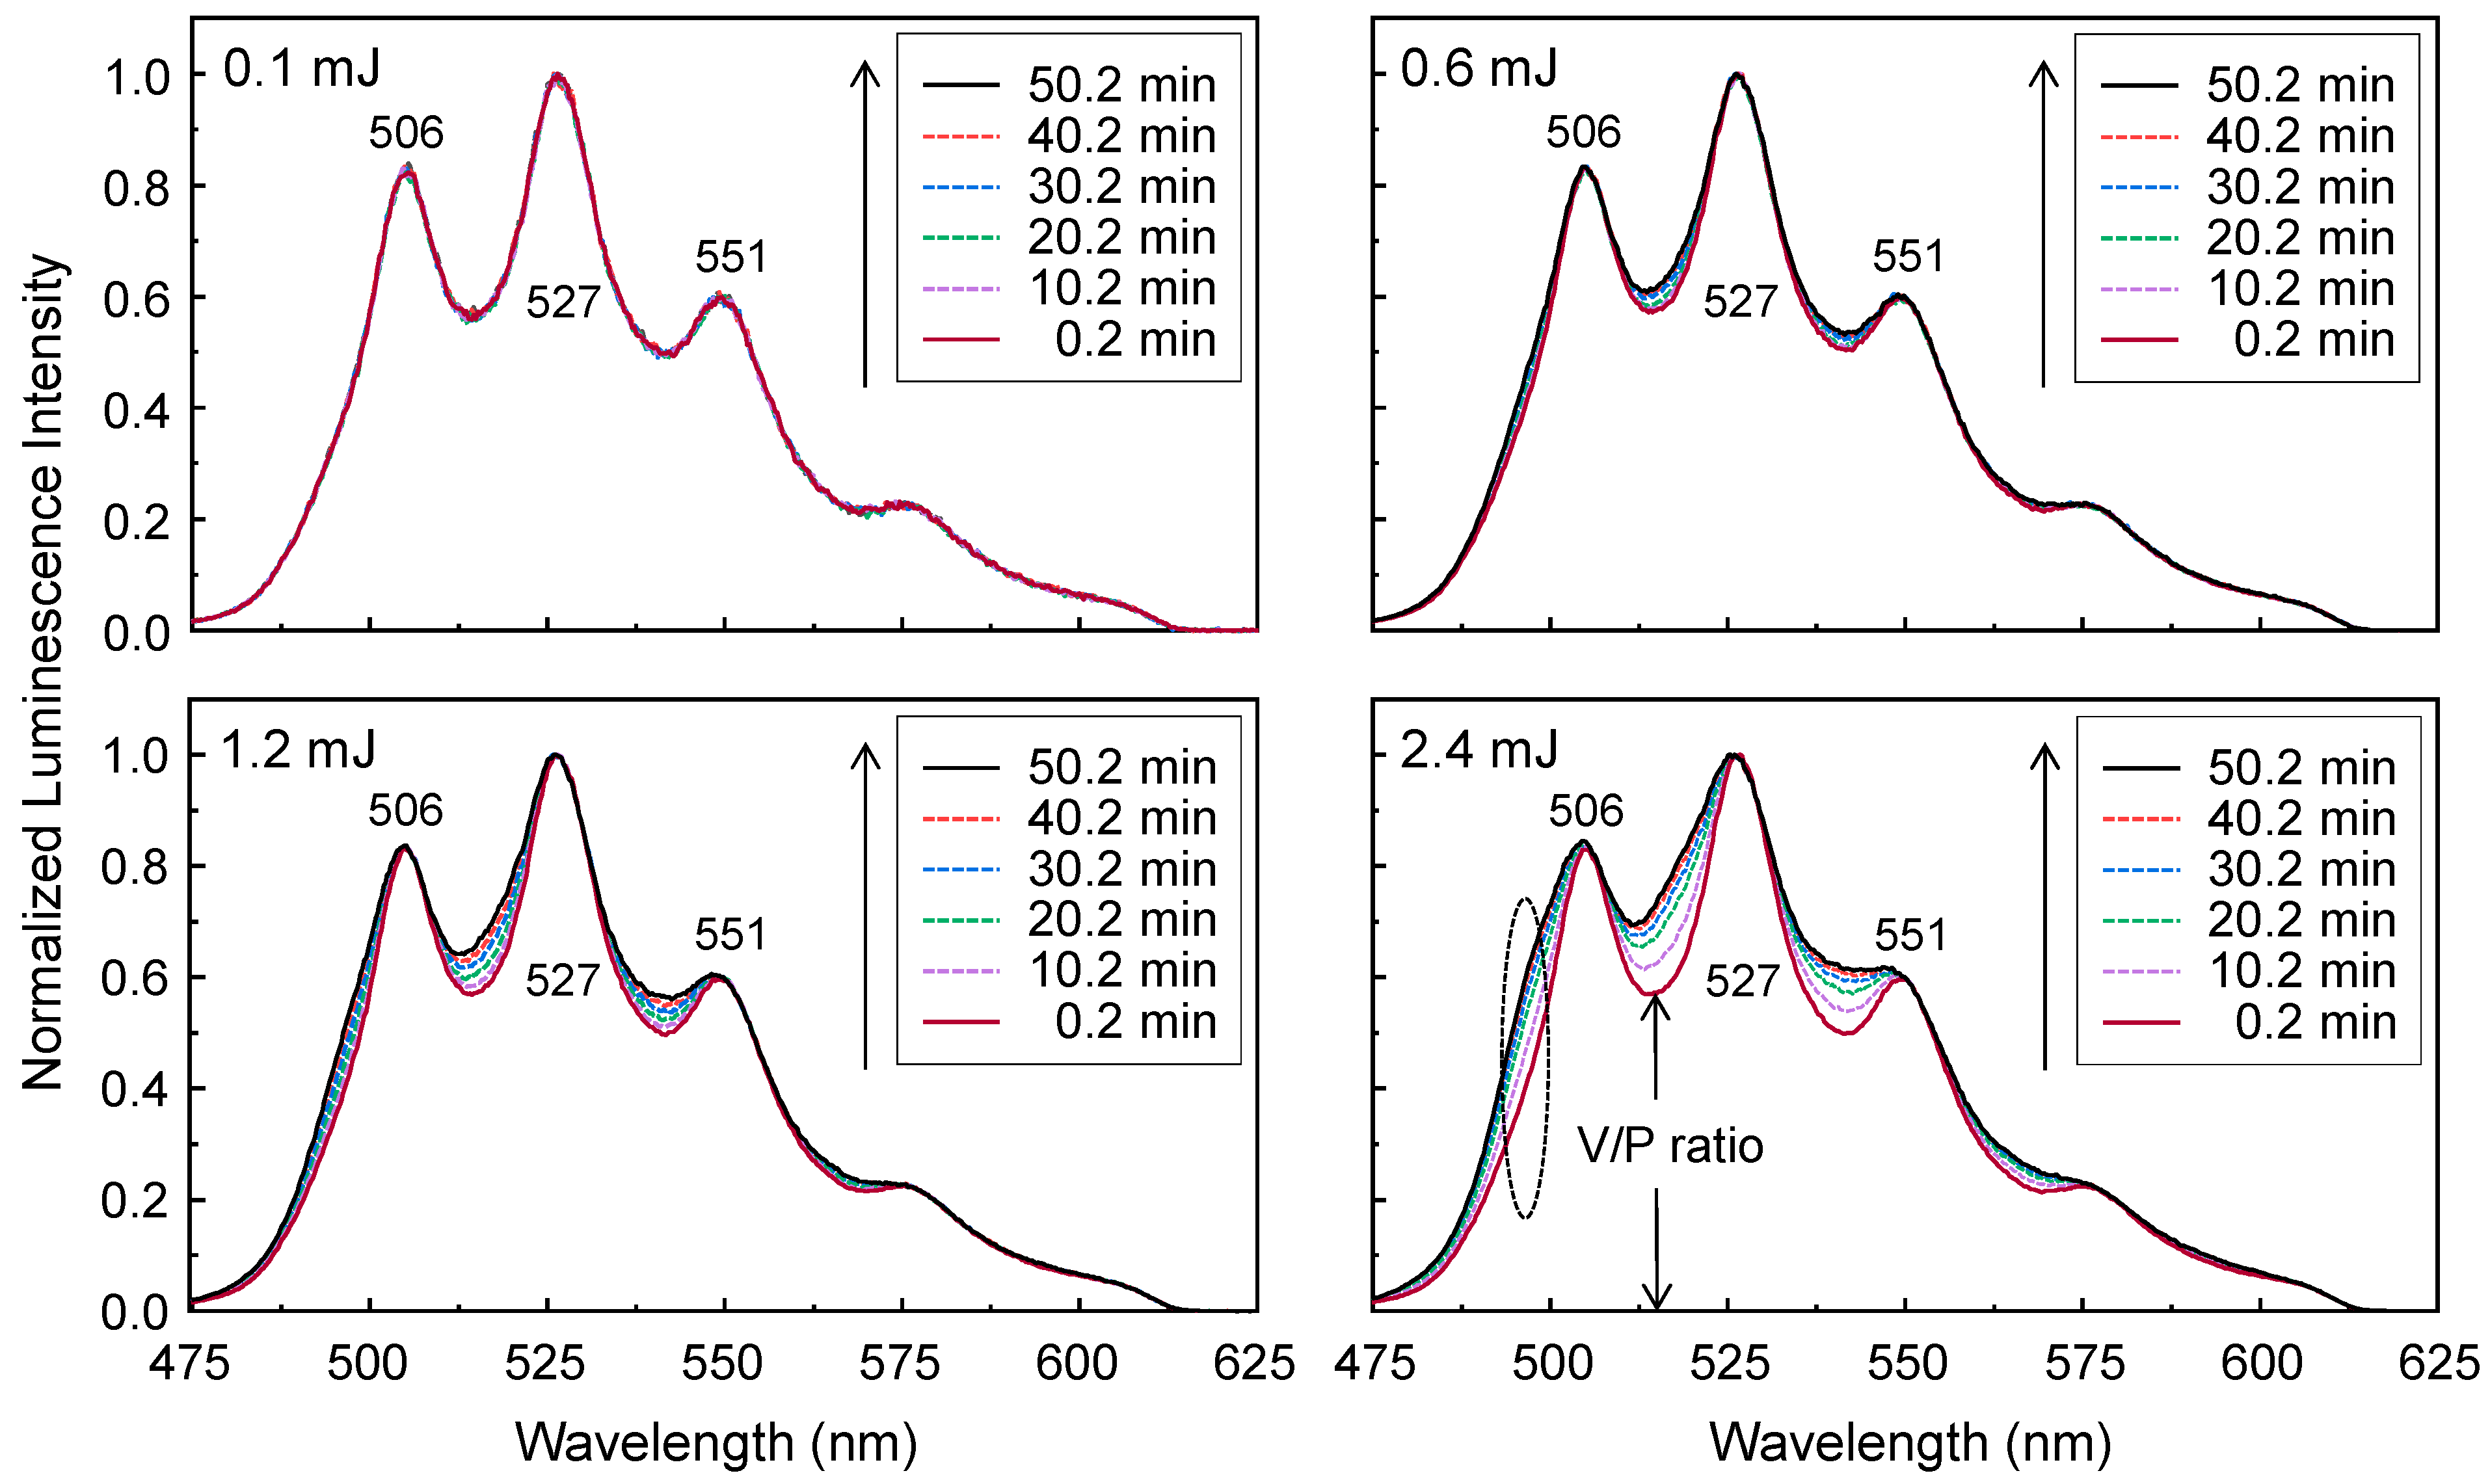
The luminescence spectra of the U(VI) surface species used to derive the data presented in
Figure 9 were normalized to the maximum intensity in
Figure 10. The initial luminescence spectra, which were measured immediately at 0.2 min after laser irradiation, show almost identical shapes as the same V/P intensity ratio under different laser pulse energies of 0.1–2.4 mJ in
Figure 10. The spectral shapes of the U(VI) surface species measured at a laser pulse energy of 0.1 mJ in the left upper panel of
Figure 10 do not change with increasing laser irradiation time. Because the measurements were performed for SiO
2 samples, which were stored in a globe box for nearly four months, species 2 seems to exist predominantly due to the ageing effect as explained in the previous subsection. Interestingly, the normalized luminescence spectra measured under laser pulse energies of 0.6–2.4 mJ change shapes during laser irradiation. An increase in the laser pulse energy leads to a higher V/P intensity ratio as the irradiation time passes, with the appearance of a shoulder at approximately 497 nm, designated by an ellipse in the right lower panel of
Figure 10. The fraction of the shoulder also increases with increasing laser pulse energy. The changes in the luminescence spectral shapes resulting from the laser-induced reaction under laser pulse energies of 0.6–2.4 mJ were ascribed to the appearance of the additional U(VI) species (called ‘species 3’) showing luminescence peaks located at shorter wavelengths. The change in the luminescence intensities of the U(VI) surface species displayed in the upper panel of
Figure 9 is very similar to the results observed for the U(VI)-TiO
2 system, wherein the photoreduction of U(VI) dominates the laser-induced reaction [
34,
35]. The formation of non-luminescent U(IV) results in immediate decreases in the luminescence intensities of the U(VI)-TiO
2 system. However, the changes in the spectral shapes illustrated in
Figure 10 constitute a newly observed phenomenon that has not been reported for the U(VI)-TiO
2 system in previous studies [
34,
35]. This observation indicates that the photoreduction of U(VI) to U(IV) is not the major mechanism of the laser-induced reaction observed for this U(VI)-SiO
2 system.
The upper panel of
Figure 11 shows the luminescence spectra of the same SiO
2 sample used to obtain
Figure 9 and
Figure 10, measured at
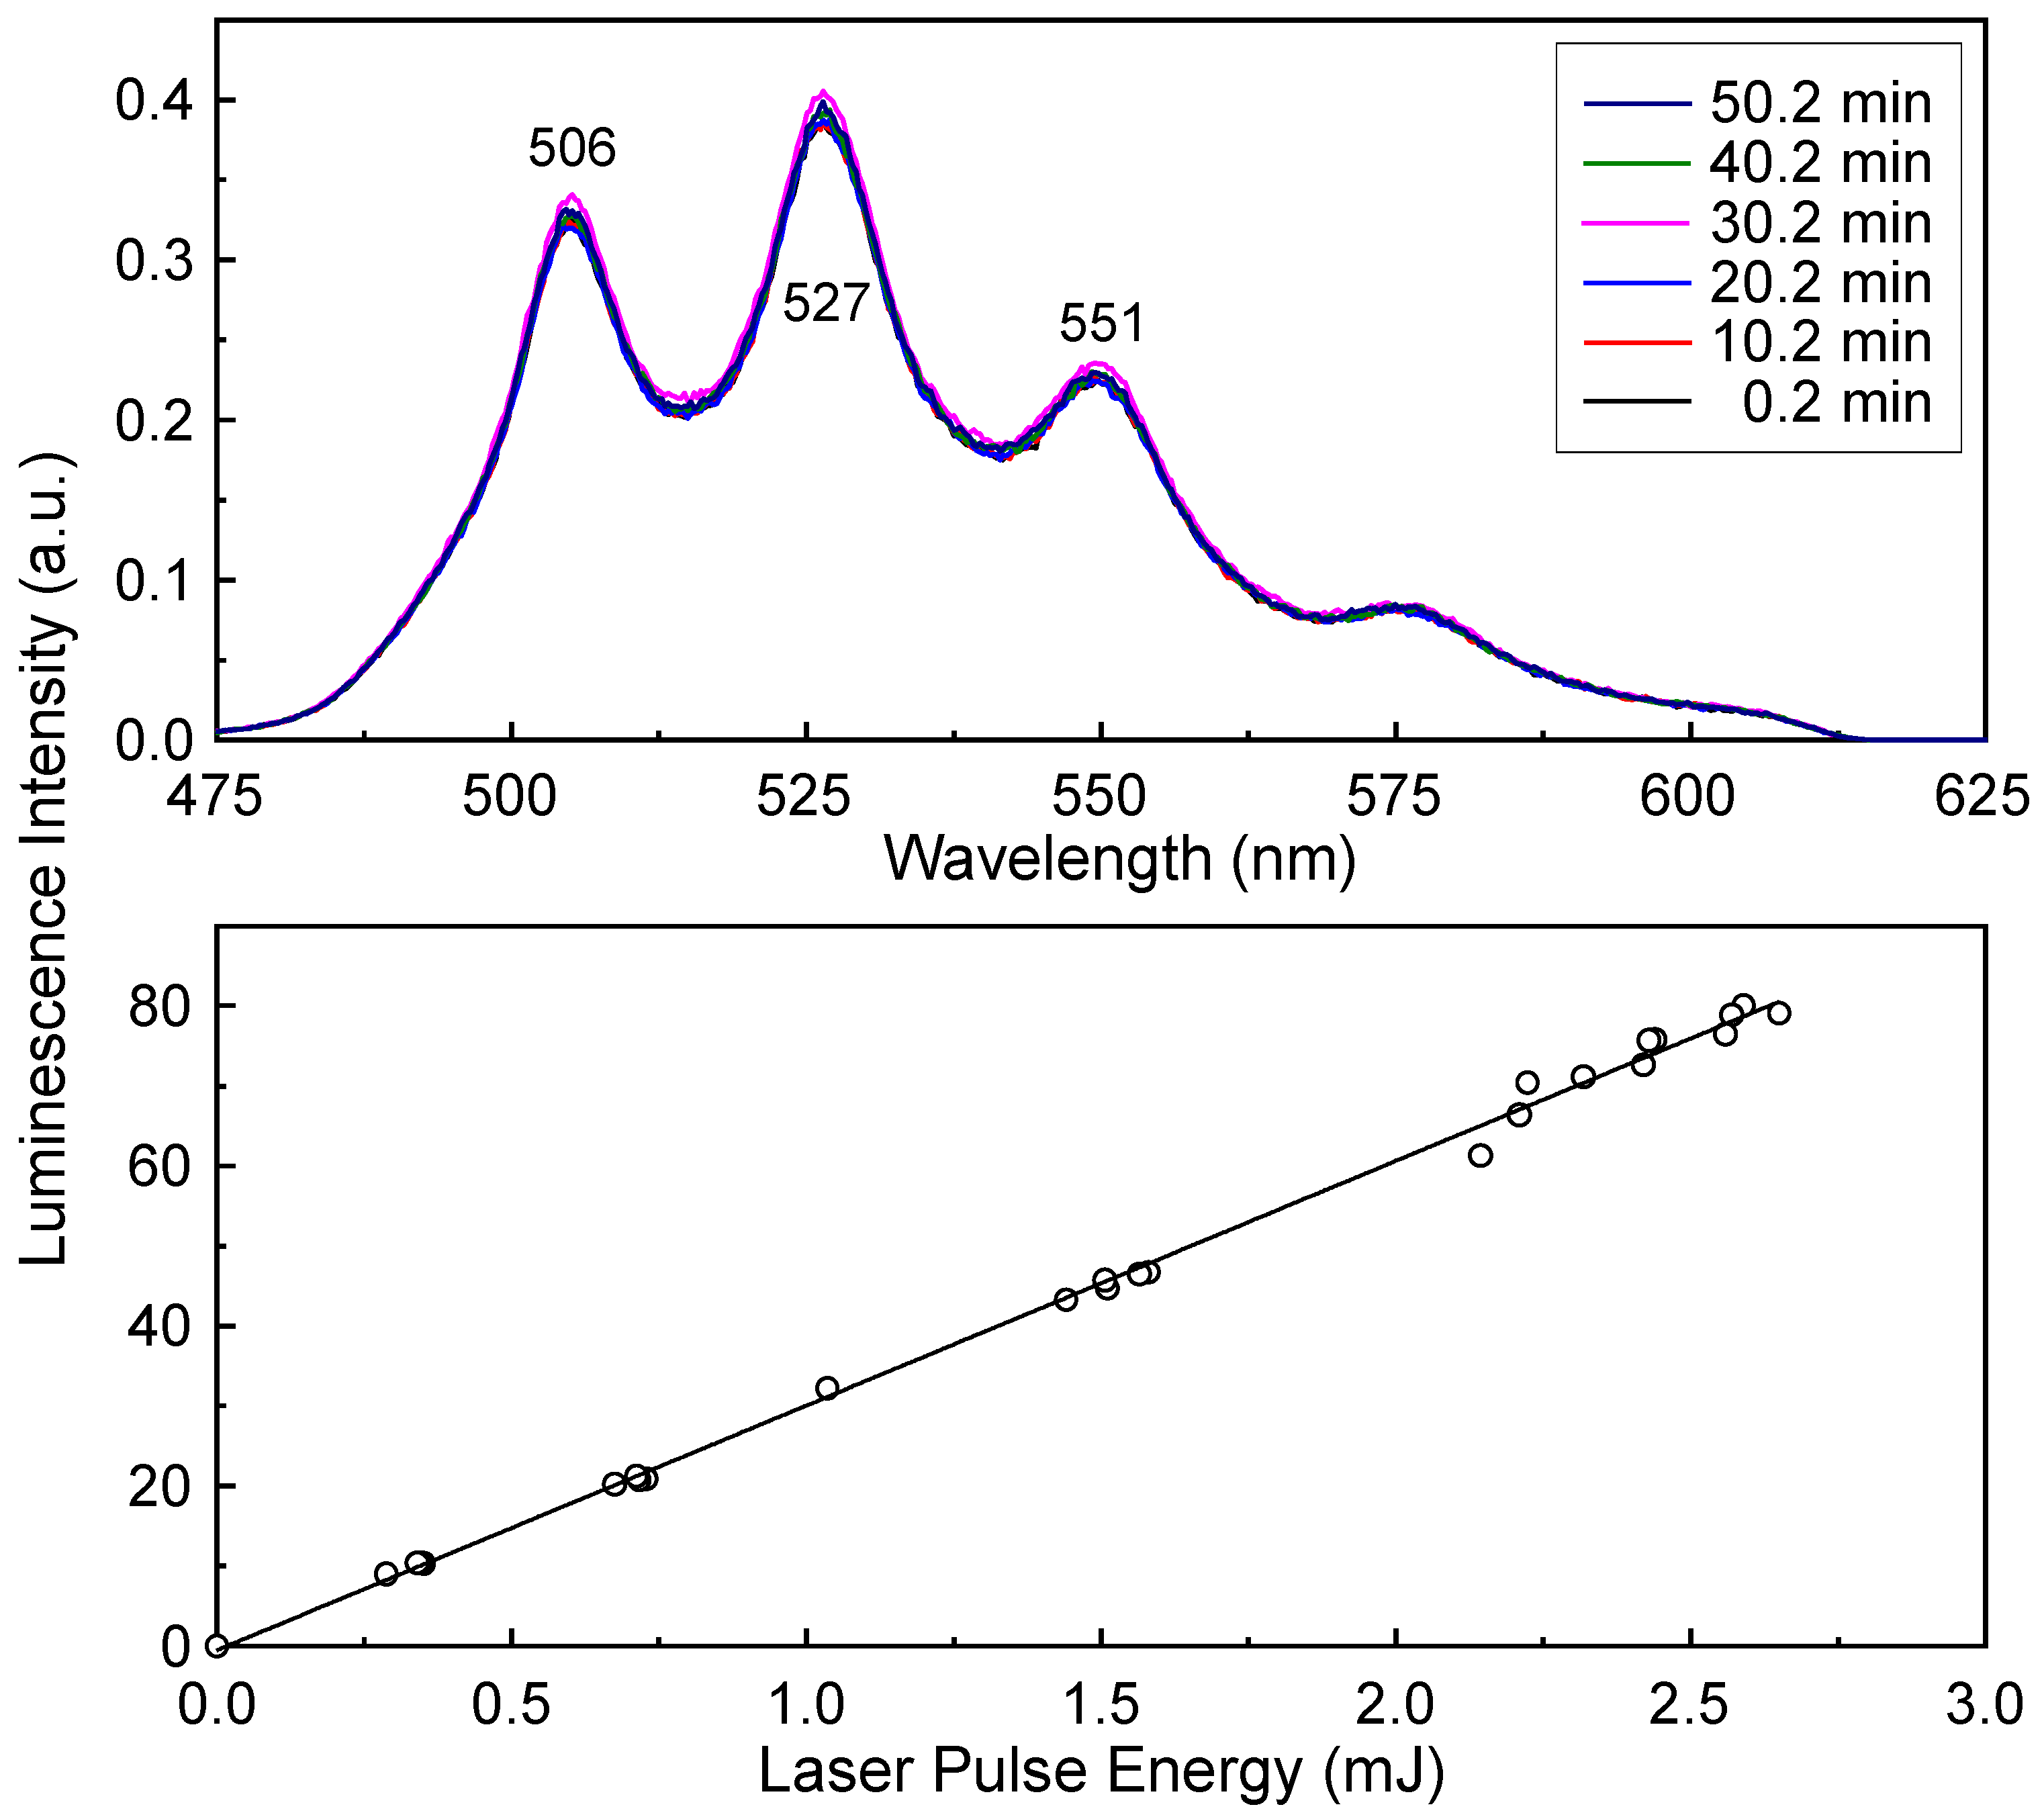
λex = 355 nm. The luminescence intensities of these spectra were not normalized. There are no significant changes in either the luminescence intensities or spectral shapes during the laser irradiation even at a laser pulse energy of 2.4 mJ. The lower panel of
Figure 11 presents the luminescence intensities as a function of the incident laser pulse energy. Unlike the intensities in
Figure 9 measured at
λex = 266 nm, the luminescence intensities at
λex = 355 nm increase linearly with increasing laser pulse energy. The solid line represents the results of fitting the data to a linear equation.
A comparison of the results in
Figure 11 with those in
Figure 9 and
Figure 10 suggests that the laser-induced reaction does not occur at
λex = 355 nm. The luminescence spectra of the same SiO
2 sample shown in
Figure 9 and
Figure 10 measured at
λex = 422 nm, corresponding to the absorption band of the surface U(VI) species [
31], suggest that the laser-induced reaction also does not occur at
λex = 422 nm with a laser pulse energy of 2.4 mJ, as shown in
Figure S12a. In a previous study, the excitation spectrum measured at
λex = 266 nm showed a much higher intensity than those measured at
λex = 355 and 422 nm [
31]. This finding means that a much larger laser energy is absorbed by the surface at 266 nm than at other wavelengths. Consequently, the luminescence intensity at
λex = 266 nm is approximately 40 times stronger than the intensities measured at
λex = 355 and 422 nm at the same laser pulse energy of 2.4 mJ, as shown in
Figure S12b.
PARAFAC analysis was applied for decomposition of the luminescence spectra displayed in
Figure 10,
Figure 11 and
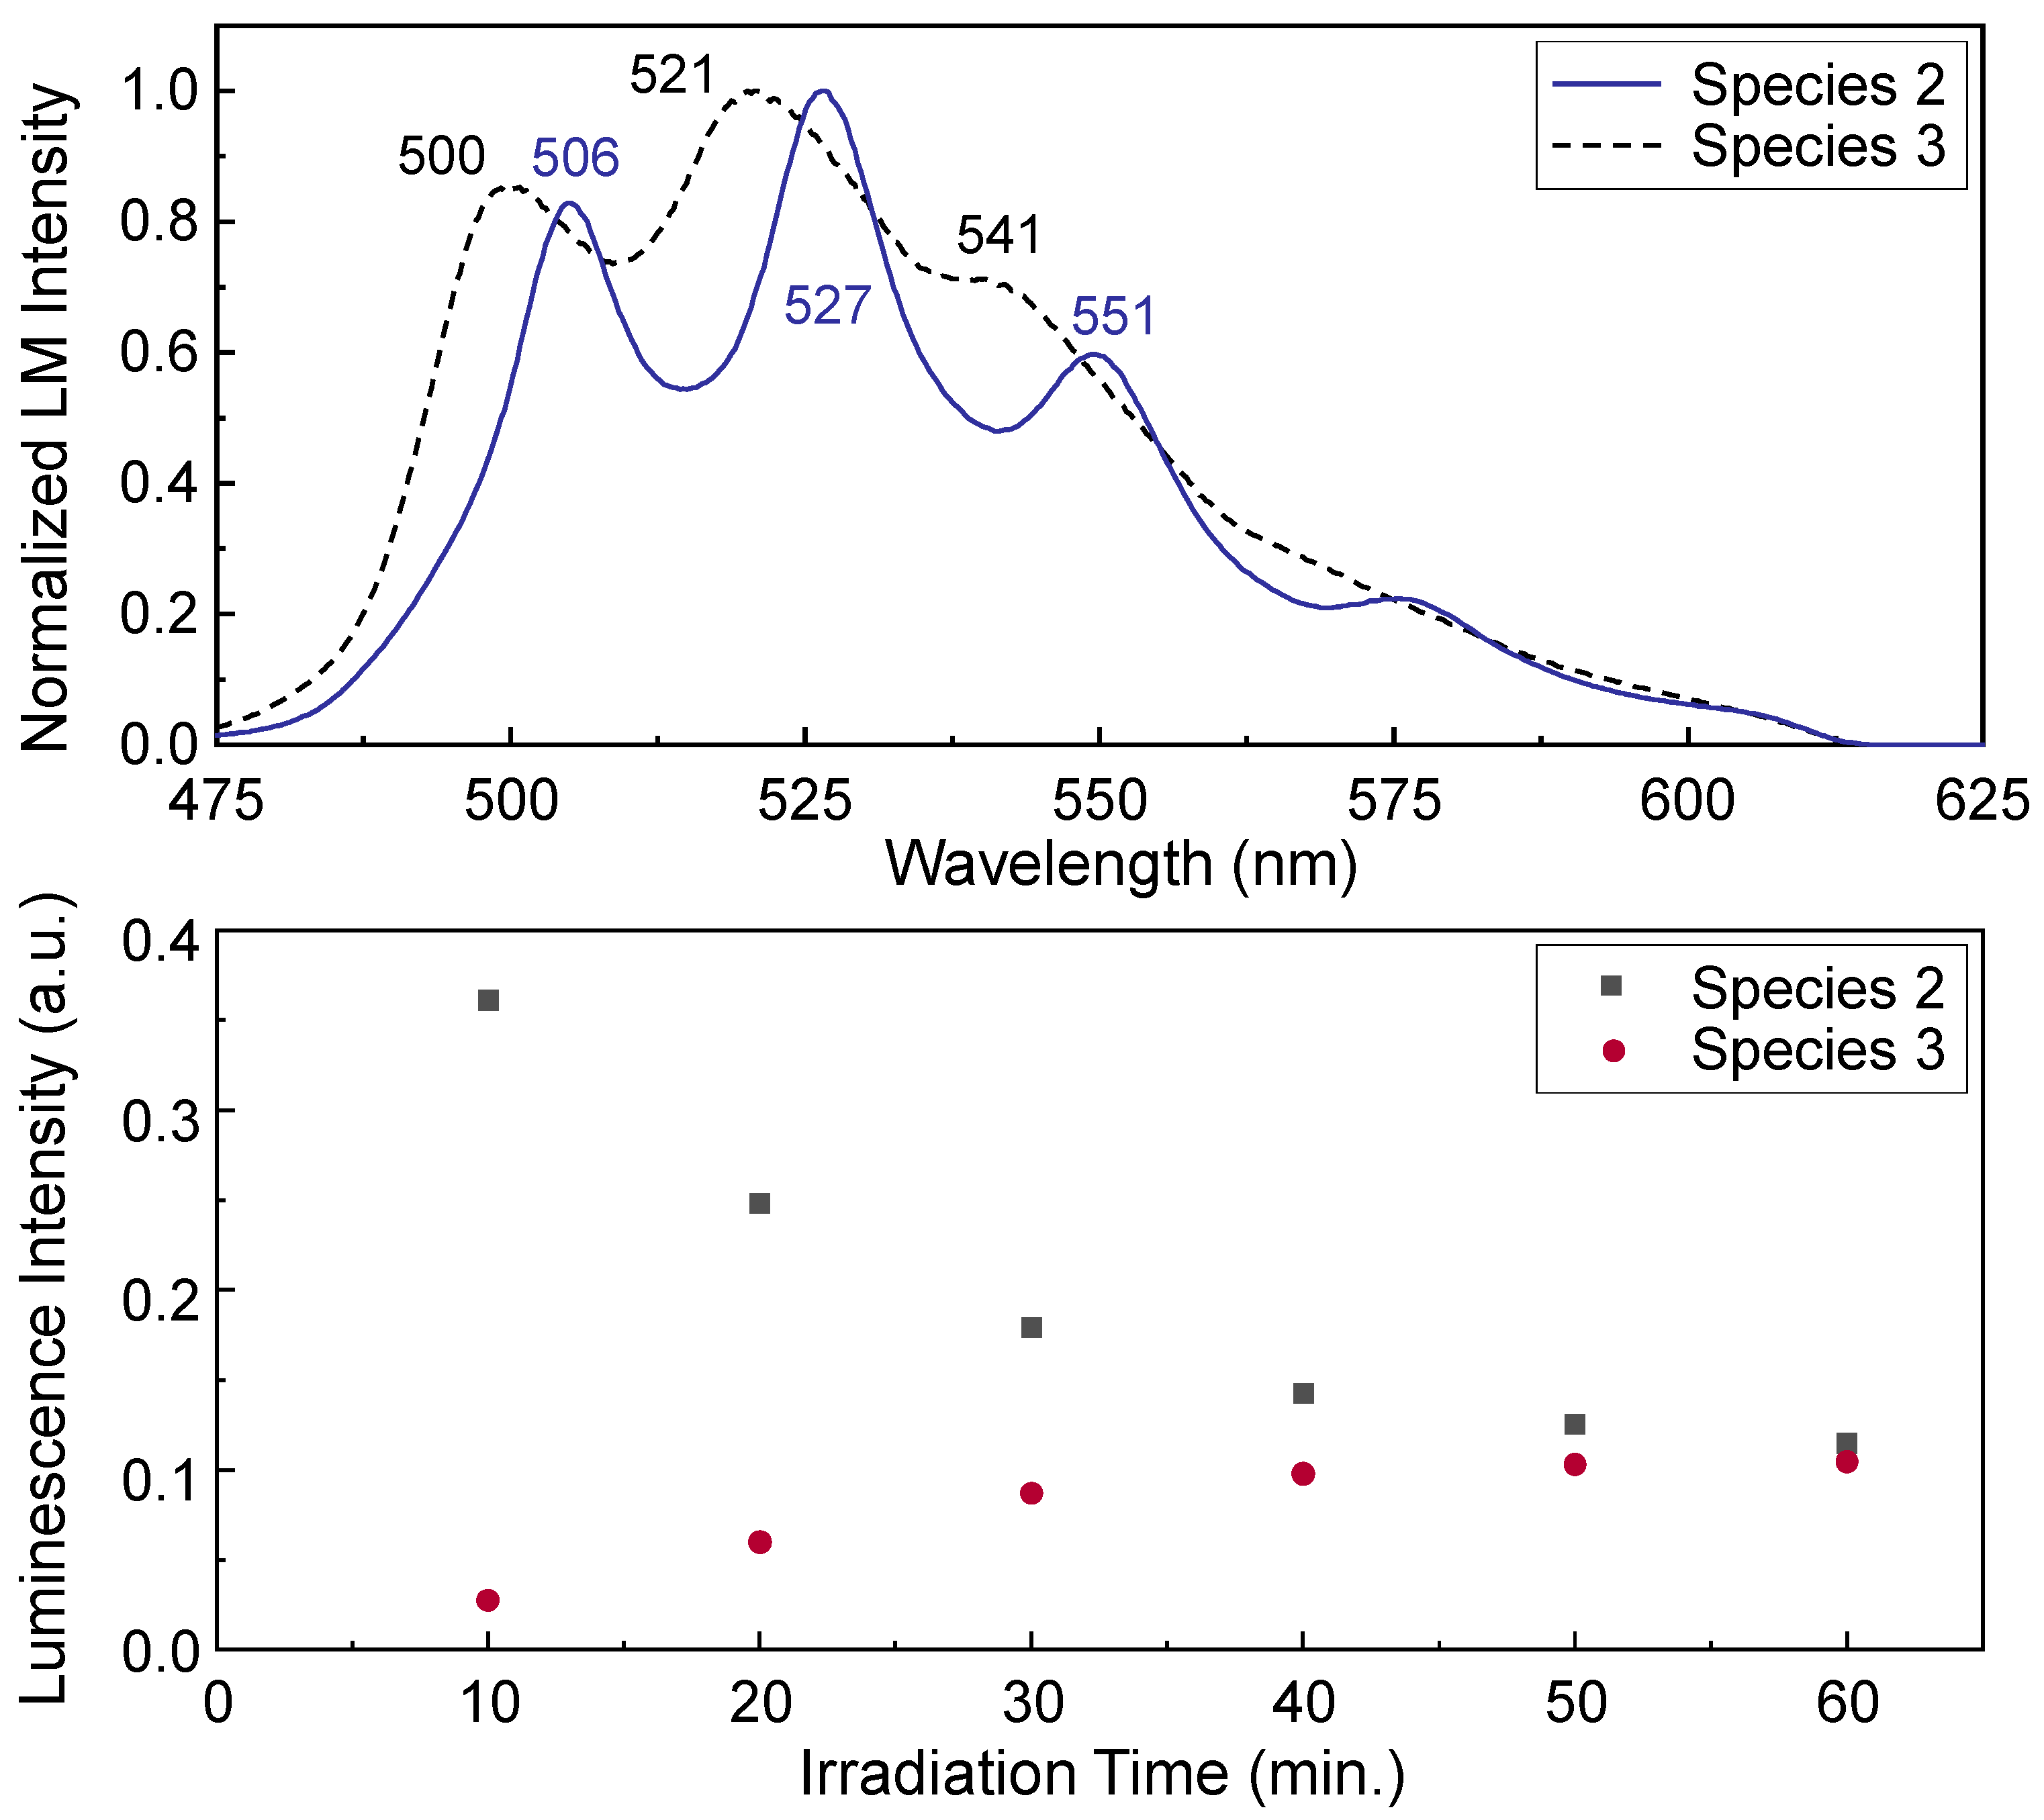
Figure S12. For those in the process of the laser-induced reaction, the decomposition with two spectral components (species 2 and 3) converges well with high core-consistency values (99.7–100%). As representative PARAFAC analysis results, the results of decomposition from the spectra in the right lower panel of
Figure 10 are presented in
Figure 12. When the laser-induced reaction does not occur, such as in the spectra in
Figure 10 (left upper panel),
Figure 11, and
Figure S12, a unique component corresponding to species 2 exists. The average luminescence lifetimes at three different wavelengths were determined to be τ
2 = 649 ± 28 μs, as listed in
Table 3. This value corresponds to the value determined in
Figure 6 (τ
2 = 653 ± 12 μs). The luminescence spectral shape of species 3 in
Figure 12 and its lifetime in
Table 3 resemble those of species 1 (τ
1 = 296 ± 17 μs), as explained in the previous subsection.
Under the conditions wherein the laser-induced reaction occurs at
λex = 266 nm, the lifetimes of species 2 listed in
Table 3 decrease gradually to approximately 575 μs with increasing laser pulse energy. Considering the nonlinear increase in the luminescence intensity as a function of the incident laser pulse energy observed in
Figure 9, the transfer of a portion of the absorbed laser energy into the thermal heating of the surface presumably promotes the nonradiative decay process. Thus, the excited-state lifetimes determined with high laser energy absorption at
λex = 266 nm become shorter owing to the increases in the relevant processes (radiative and nonradiative) that relax the electronic excited states back to the ground state. The lower panel of
Figure 12 shows the change in the species distribution determined using PARAFAC analysis. The luminescence intensities of species 3 gradually increase with increasing irradiation time, whereas those of species 2 decrease.
As soon as the laser-induced reaction was complete after 1 h of laser irradiation at
λex = 266 nm, sample No. 2 ([U(VI)] = 0.34 μM,
m/
v = 1.0 g/L, and pH 7.5) was irradiated at
λex = 422 nm with a laser pulse energy of 1.7 mJ to monitor the evolution of the luminescence spectrum with time. The luminescence spectral shapes measured at
td = 1 μs recover over a long period of time, as shown in the upper panel of
Figure 13. The luminescence intensity of species 3 gradually decreases with time; thus, the V/P intensity ratio and the fraction of the shoulder decrease, as indicated by the arrow in
Figure 13. These observations demonstrate that the newly appeared species, species 3, resulting from the laser-induced reaction for the high SSA sample, continuously disappears with time. Meanwhile, the luminescence intensity of species 2 increases with time. The lower panel of
Figure 13 shows the change in the species distribution as a function of the signal recovery time. PARAFAC analysis was applied for decomposition of the luminescence spectra displayed in the upper panel of
Figure 13. The decomposition with two spectral components converges well with a high core-consistency value of 99.8%. The origin of the X-coordinate in the lower panel denotes the time at which the UV laser irradiation ends. The luminescence intensities of species 2 are recovered fast over the first two days with decreasing luminescence intensity of species 3.
As described in the previous subsection, the increase in species 2 at the expense of species 3 with time suggests that species 3 is unstable. Thus, a reasonable hypothesis is that species 3, which appears during the laser-induced reaction, is analogous to species 1 under near-neutral pH conditions. The appearance and disappearance of species 3 shown in
Figure 12 and
Figure 13, respectively, were easily observed in SiO
2 samples with high SSA, but difficult to observe in samples with low SSA. If these phenomena are due to a result of a change in the equilibrium of U(VI)-hydroxo species by the thermal heating of the surface, these phenomena should be observed even in SiO
2 samples with low SSA. From the photoreduction perspective, U reoxidation cannot contribute to the luminescence signal recovery because of the formation of a non-luminescent end product, such as an oxide with a structure intermediate between UO
2 and UO
3, possibly U
3O
8 [
34,
49].
Figure 14 shows the luminescence properties measured for the dissolved U(VI) species by laser irradiation. As soon as the laser-induced reaction was complete with a net decrease of approximately 28% in the luminescence intensity after 1 h of laser irradiation at
λex = 266 nm with a laser pulse energy of 2.4 mJ, the suspension (high SSA sample No. 2 at pH 7.5, [U(VI)] = 3.4 μM, and
m/
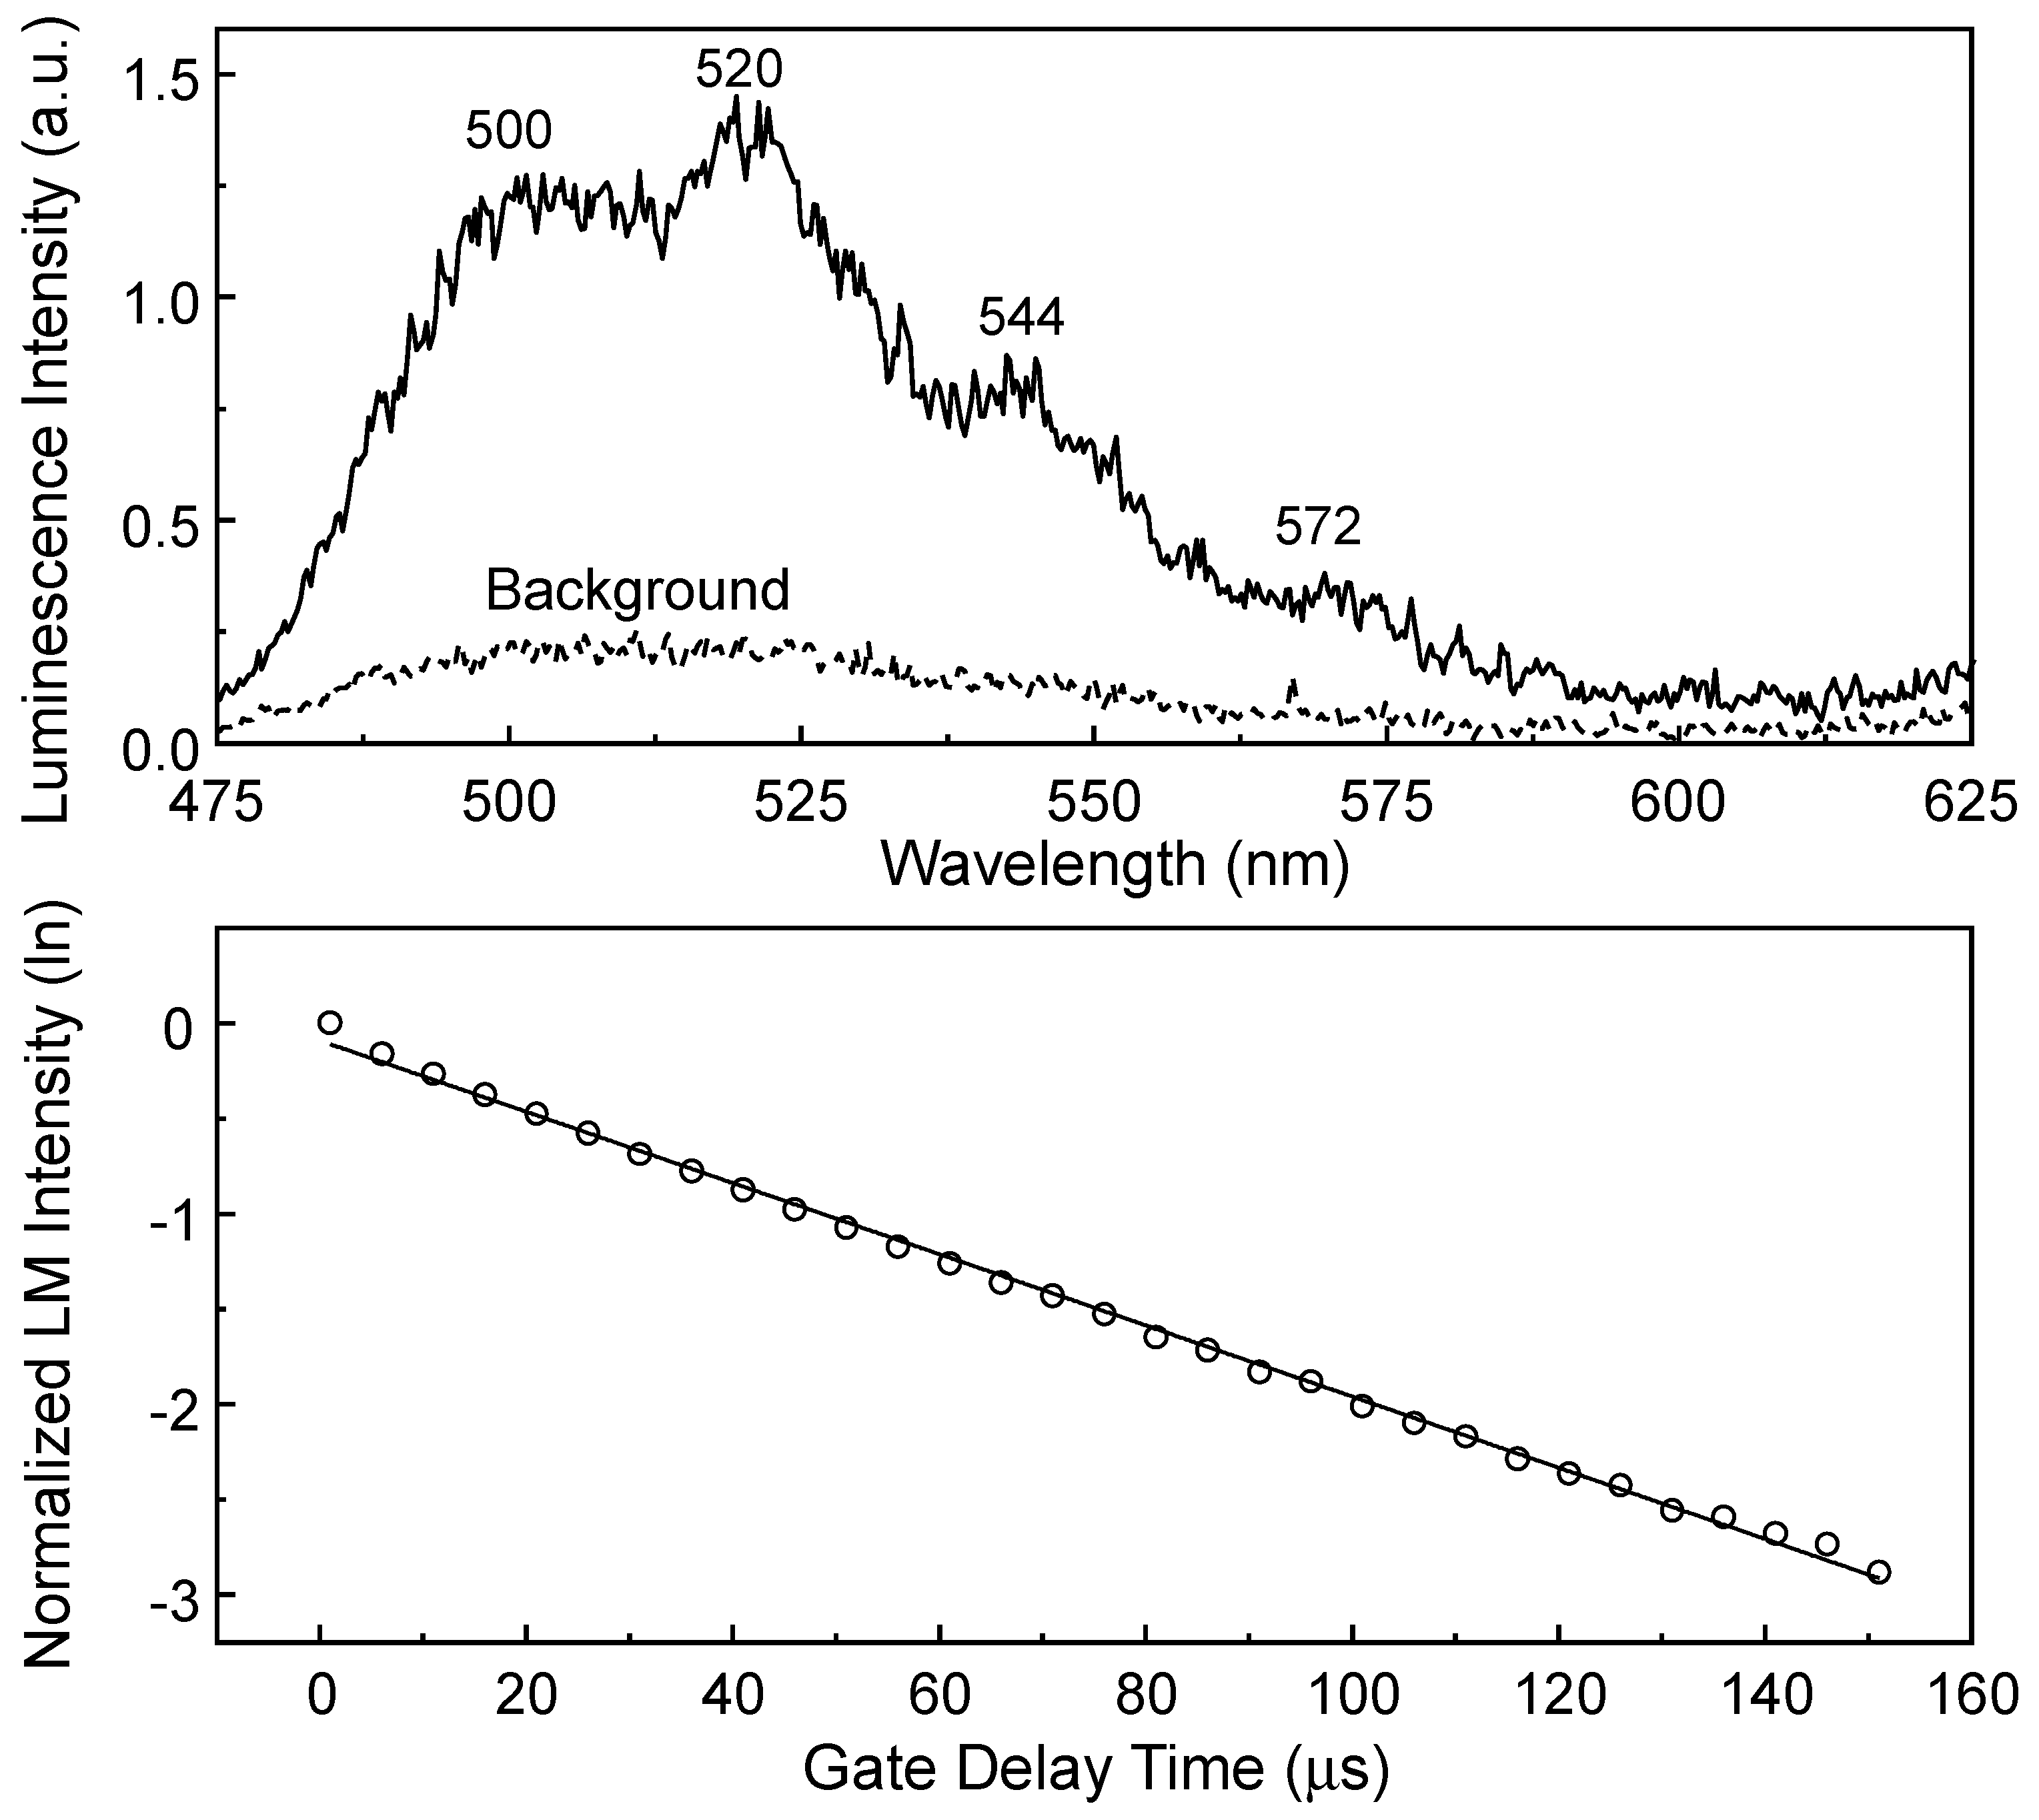
v = 1.0 g/L) was centrifuged and filtered for quantitative analysis of the dissolved U(VI). The luminescence spectrum of the dissolved U(VI) species in the filtrate illustrated as a solid line in the upper panel of
Figure 14 shows peak positions at approximately 500, 520, 544, and 572 nm. The dotted line represents the background luminescence spectrum of the species existing in the filtrate of the same batch of the SiO
2 sample, but without laser irradiation. The observation of much stronger luminescence after 1 h of laser irradiation than that of the background spectrum indicates that the increase in the dissolved U(VI) species results from the desorption of U(VI) from the SiO
2 surface.
The lower panel of
Figure 14 shows the luminescence lifetime measured from the dissolved U(VI) species in the upper panel of
Figure 14. The luminescence intensities depicted as symbols were obtained from a series of luminescence spectra measured using the kinetic mode of the ICCD with
tw = 10 μs and a
td between 1 μs and 151 μs (step size of 5 μs). The symbols and solid lines in the lower panel denote the normalized luminescence intensities on the natural logarithmic scale and the results of fitting the data to a linear regression, respectively. For several filtrates, the luminescence lifetime of the dissolved U(VI) species was determined to be τ = 52 ± 17 μs. The peak wavelengths and luminescence lifetime of the U(VI) species in
Figure 14 are comparable to previously reported values (peak wavelengths of 500, 521, 544, and 570 nm and a lifetime of 19 ± 4 μs) at pH 3.9 for the complex in the U(VI)-silicate system, such as the UO
2OSi(OH)
3+ species [
16].
In
Figure 14, the quantity of desorbed U(VI) in the filtrate determined using ICP-MS is 0.1 μM, which corresponds to approximately 3% of the adsorbed quantity of 3.4 μM. The quantity of background U(VI) species before laser irradiation was smaller than the detection limit of the analytical instrument. The amount of desorbed U(VI) in the filtrate is quite small compared to the desorbed quantities of approximately 30% for the low SSA samples, as shown in
Figure 8c. This phenomenon is attributed to the readsorption of the dissolved U(VI) species, which is responsible for the newly appearing species, species 3, as illustrated in the right lower panel of
Figure 10. Considering that the lower adsorption sites of the low SSA samples prevent the desorbed U(VI) from readsorption during the laser irradiation, a large quantity of desorbed U(VI) is expected in filtrates obtained from the low SSA samples. A comparison of the spectra in
Figure 8 with those in the right lower panel of
Figure 10 reveals that there are no additional U(VI) species in the low SSA sample.


 ,
, 


