Article

Parametrization of Geopolymer Compressive Strength Obtained from Metakaolin Properties

by
Madeleing Taborda-Barraza
1,
Luis U. D. Tambara, Jr.
2,
Carlos M. Vieira
2,
Afonso R. Garcez de Azevedo
2,* and
Philippe J. P. Gleize
1
1
NANOTEC—Laboratory of Applications of Nanotechnology in Civil Construction, UFSC—Federal University of Santa Catarina, Rua João Pio Duarte Silva, 205, Florianópolis 88037-001, Brazil
2
LAMAV—Advanced Materials Laboratory, UENF—State University of the Northern Rio de Janeiro, Av. Alberto Lamego, 2000, Campos dos Goytacazes 28013-602, Brazil
*
Author to whom correspondence should be addressed.
Minerals 2024, 14(10), 974; https://doi.org/10.3390/min14100974
Submission received: 28 July 2024 / Revised: 17 September 2024 / Accepted: 24 September 2024 / Published: 27 September 2024
(This article belongs to the Special Issue Geopolymers: Synthesis, Characterization and Application)

Abstract

:
In the search for alternative cementitious materials, the alkali activation of aluminosilicates has been found to be a mechanically effective binder. Among precursors, metakaolin is most frequently used, with a primary source, kaolin, distributed globally in varying compositions. This variability may indicate potential compositional limitations for the large-scale production of such binders. Thus, four types of commercial calcined clays, activated under identical conditions, were evaluated, and their physicochemical characteristics were correlated with the mechanical properties of the resulting binder. Different characterization methods were used for the raw material and for each alkali-activated system. Anhydrous metakaolin was assessed through particle size distribution, specific surface area, zeta potential, vitreous phases, Fourier transform infrared spectroscopy (FTIR), X-ray diffraction (XRD), amorphism, and pozzolanic activity. The pastes were evaluated in the fresh state through apparent activation energy progression and isothermal conduction calorimetry, and in the hardened state through compressive strength and dilatometry. Compressive strength values ranged from 7 to 42 MPa. From these results, a mathematical model was developed to estimate mechanical performance based on key variables, specifically amorphism, the pozzolanic index, and the silica-to-alumina ratio. This model allows for performance predictions without the need to prepare additional pastes. Interestingly, it was found that while some systems displayed low initial reactivity, their relative reactivity over time increased more significantly than those with higher early-stage reactivity, suggesting their potential for reconsideration in long-term applications.

1. Introduction

Geopolymer is a cementitious material composed of a precursor material, rich in aluminosilicates, and an alkaline solution. The contact between these components promotes a new arrangement of the three-dimensional structure based on tetrahedrons of silica and alumina [1,2]. Geopolymer materials are considered promising binders for sustainable development in the civil construction sector. Some of their advantages include high mechanical properties, good durability, low energy demand, and low emission of harmful gases to the environment [3]. Due to these properties, geopolymers have a wide field of applications as a construction material in the aerospace and chemical industries, as well as great potential for use in 3D printing, refractory materials, and fiber-reinforced composites [4].
The formation of geopolymeric products occurs through a series of chemical reactions. The process begins with the dissolution of aluminosilicates when the precursor comes into contact with the alkaline solution. This is followed by the formation of an initial gel composed of free aluminum tetrahedral (AlO4) and silicon tetrahedral (SiO4) units. Subsequently, a second and more stable gel is formed, producing a hardened product similar to zeolites [5].
The reactivity of materials used as precursors for alkali activations is influenced by specific physical and chemical factors, such as silica and alumina content, particle size, surface area, morphology, and vitreous phase [6,7]. These parameters directly affect reaction kinetics, which are temperature-dependent and require minimum conditions to overcome physical–chemical barriers, allowing the formation of reaction products over time—referred to as activation energy [8].
In cementitious systems, the term “apparent” is used in this context because activation energy is originally based on the Arrhenius law, which applies to homogeneous systems. In contrast, cementitious materials contain various components contributing to their reaction products [9]. Similarly, this concept can be applied to geopolymers, where each system possesses a unique identity based on the specific precursor requiring activation and its sensitivity to temperature conditions [10]. To initiate the chemical reaction, the precursor must quickly acquire sufficient energy from the activator, enabling the anhydrous and partially activated precursor molecules to release more energy and sustain the internal reactions.
Metakaolin (MK), a pozzolanic material, is produced by calcining kaolin clay at temperatures between 500 and 800 °C [6]. The calcination temperature is crucial for promoting the vitreous phase, which can be observed by the amorphous halo in X-ray diffraction. Kaolin is an abundant mineral in the Earth’s crust, with large reserves worldwide. It has a wide range of applications, including in paper production, ceramics, coatings, and adsorbents [11,12,13], and, more recently, in thermal energy storage systems [14]. Compared to other materials rich in aluminosilicates, MK has several advantages as a precursor for geopolymeric materials, including accelerated setting time, high reactivity, and a high surface area [8]. Furthermore, it is produced industrially in Brazil and is legally regulated as a supplementary cementitious material. However, its local nature can modify its composition, which is common in any large country like Brazil [15].
The main reaction product resulting from the alkali activation of metakaolin is sodium aluminosilicate gel (N-A-S-H), which contributes to the mechanical strength of the system [2,16]. Zeolitic phases can also form depending on the type of raw clay, the curing temperature, and the composition conditions. However, many authors justify mechanical performance using molar ratios as terminology, ignoring that not all oxides are in the active condition to participate in reactions. Precursor characterization is crucial for the comprehension of the mechanical and microstructural outcomes. At the same time, certain forms of metakaolin may be deemed unsuitable for activation due to a higher iron oxide content or a lower total oxide composition than what is recommended in the literature. These metakaolins often originate from lower-quality kaolin and are considered less effective in contributing to cementitious systems [11]. However, in the case of alkaline activation, these limitations can be mitigated by adjusting the proportion of activators, optimizing curing temperatures, or incorporating local additives [17,18].
Parameterizing the variables that affect compressive strength can be complex due to the numerous factors involved. Many studies focus on the chemical interaction with the activator solution when a single precursor is evaluated, but fewer studies provide a detailed characterization of the raw material. Authors [19,20,21] demonstrate the wide range of available analytical methods, including linear and non-linear regression models, response surface methods, experimental designs, machine learning models, Taguchi methods, regression algorithms, and artificial neural networks. As the number of variables increases, so does the level of interaction between them. Nevertheless, the correlation coefficient (R2) remains a valuable indicator of the relationship between dependent and independent variables, and simple models with specific conditions should not be dismissed too quickly.
This study aims to characterize four different types of metakaolin used in Brazil and assess how the variation in their physical and chemical properties affects the mechanical strength of geopolymers with low CaO content produced under the same conditions. A mathematical model was developed to predict the compressive strength of this family of metakaolin, identifying which parameters significantly affect this property. Chemical composition analysis was employed to determine the concentration of available aluminosilicates; mineralogical analysis was conducted using X-ray diffraction (DRX); distribution particle size was utilized to compare the effect of particle size on geopolymerization reactivity and formation kinetics; and calorimetry was carried out to evaluate the material’s reactivity over time. Mechanical strength tests were performed at 7 and 28 days.
This research helps explain how the nature of the raw material impacts geopolymer strength properties and demonstrates how the model can be used by industry to predict mechanical performance based on the key parameters of their treated material. Ultimately, these specifications can be associated with the applicability of any raw material.

2. Materials and Methods

Four commercial metakaolin (MK) types were compared: MK1, MK2, MK3, and MK4. The authors conducted all the characterizations. Table 1 presents the chemical composition via X-ray fluorescence and the surface area measured using Blaine‘s method. One notable difference among these materials is the progressive increase in iron oxide content and the variability in alumina content.

2.1. Sample Preparation

The alkaline solution (A.S.) was gradually added to MK to prepare geopolymer composites, keeping a relation solid/activator (s/a) of 1:1.2 and mixing manually for 1 min. After that, a mechanical mixer (600 rpm) was used for four minutes. Subsequently, all samples were molded, sealed with a plastic cover, and cured at 24 ± 2 °C until testing. The molar ratios for each system are registered in Table 2.

2.2. Sample Characterisation

The mineral phase precursors were obtained through a Miniflex II (Rigaku, Tokyo, Japan) X-ray diffractometer at 30 kV/15 mA and CuK radiation (λ = 1.5418 Å), with a diffraction angle from 8° to 60°. Fourier transform infrared spectroscopy (FTIR) was used to identify the main functional groups using a spectrophotometer (Jasco 4000 Series, Indaiatuba, Brazil) in transmittance mode at a wavenumber from 400 to 4000 cm−1 and 16 cm−1 resolution. A laser granulometer (Microtrac S3500, York, PA, USA) was used for dry measurements to determine the particle size of the fine powder. Chemical composition was analyzed using X-ray fluorescence (EDX-7000, Shimadzu, Tokyo, Japan), while dilatometry measurement was conducted using a DIL 402 PC (Netzsch, Germany) from 25 °C until 800 °C at 10 °C/min. Zeta potential and electrical conductivity were measured using a Zetasizer nano ZS (Malvern), registered at 25 °C, and using a scan pH from 7 to 12 to determine physical properties. The quantification of vitreous phases was determined using a 1:20 HCl chemical attack [22]. The material was stirred for 3 h in the solution, filtered, and washed with deionized water until it achieved a neutral pH. The percentage of the reacted material corresponds to the weight loss after calcination at 800 °C. The pozzolanic test was conducted following the methodology of [23], by preparing a saturated Ca(OH)2 solution at 40 °C and adding 5 g of material. The shift in electrical conductivity after two minutes was indirectly measured using a conductivity meter (Simpla EC150, São Leopoldo, Brazil). The specific area surface was determined using Blaine permeability equipment (NBR 16372/2015). The kinetics reaction was measured using the calorimetry conduction isothermal in an I-CAL2000 calorimeter (Calmetrix, Rio de Janeiro, Brazil). Finally, the compressive strength of the samples was measured using a universal machine (Instron, Chicago, IL, USA) at a rate of 4000 N/min, 6 samples per group, at 7 and 28 days.

3. Results and Discussion

3.1. XRD and FTIR Characterisation

Figure 1 presents the XRD patterns and FTIR spectra of the MK samples. The XRD patterns in Figure 1a reveal that the main phases present in all MK samples are quartz (Q), kaolinite (K), and hematite (H). However, the muscovite (M) phase was identified only in MK1. For MK2 and MK3 spectra show more intense peaks for Q and K, indicating a higher abundance of crystalline phases in these two precursors. Additionally, MK2 and MK3 exhibit a less pronounced amorphous halo compared to MK1 and MK4. This observation was supported by integral calculations of the spectra curves using the Fstart program, with average area (measured as “points” by the program) values for each sample as follows: MK1 = 8.879, MK2 = 0.959, MK3 = 1.336, and MK4 = 21.586. For MK2 and MK3, the incomplete transformation of kaolinite into metakaolin during calcination could potentially affect the system’s reactions [24]. Complementary FTIR analysis (Figure 1b) highlighted differences in the Si/Al-O-Si band around 1000 cm−1, as well as smaller regions representing Si-Al-O-Si bands (800–440 cm−1) and Fe-O bands (532 cm−1) [25,26]. The results show that the asymmetric band peak in this region shifts to the left for MK1 and MK4, suggesting a higher presence of Si-O-Al bridges. Conversely, MK2 and MK3, which have a higher silica content, show a shift of their bands to the right regions [27].

3.2. Particle Size Distribution

The physical appearance of the precursors is compared in Figure 2a–d, indicating a visible change in raw material color with increasing Fe2O3 content. The granulometric curves for each MK are summarized in Figure 2e, indicating the average particle sizes as 9.25 µm for MK1, 14.50 µm for MK2, 13.08 µm for MK3, and 11 µm for MK4. These particle sizes correlate with the specific surface area measurements, suggesting that MK2 and MK3 have larger particle sizes compared to the others. This is significant for calorimetry results, as smaller particles generally dissolve more quickly. However, the reactivity of the particles also depends on their specific conditions over time [28].

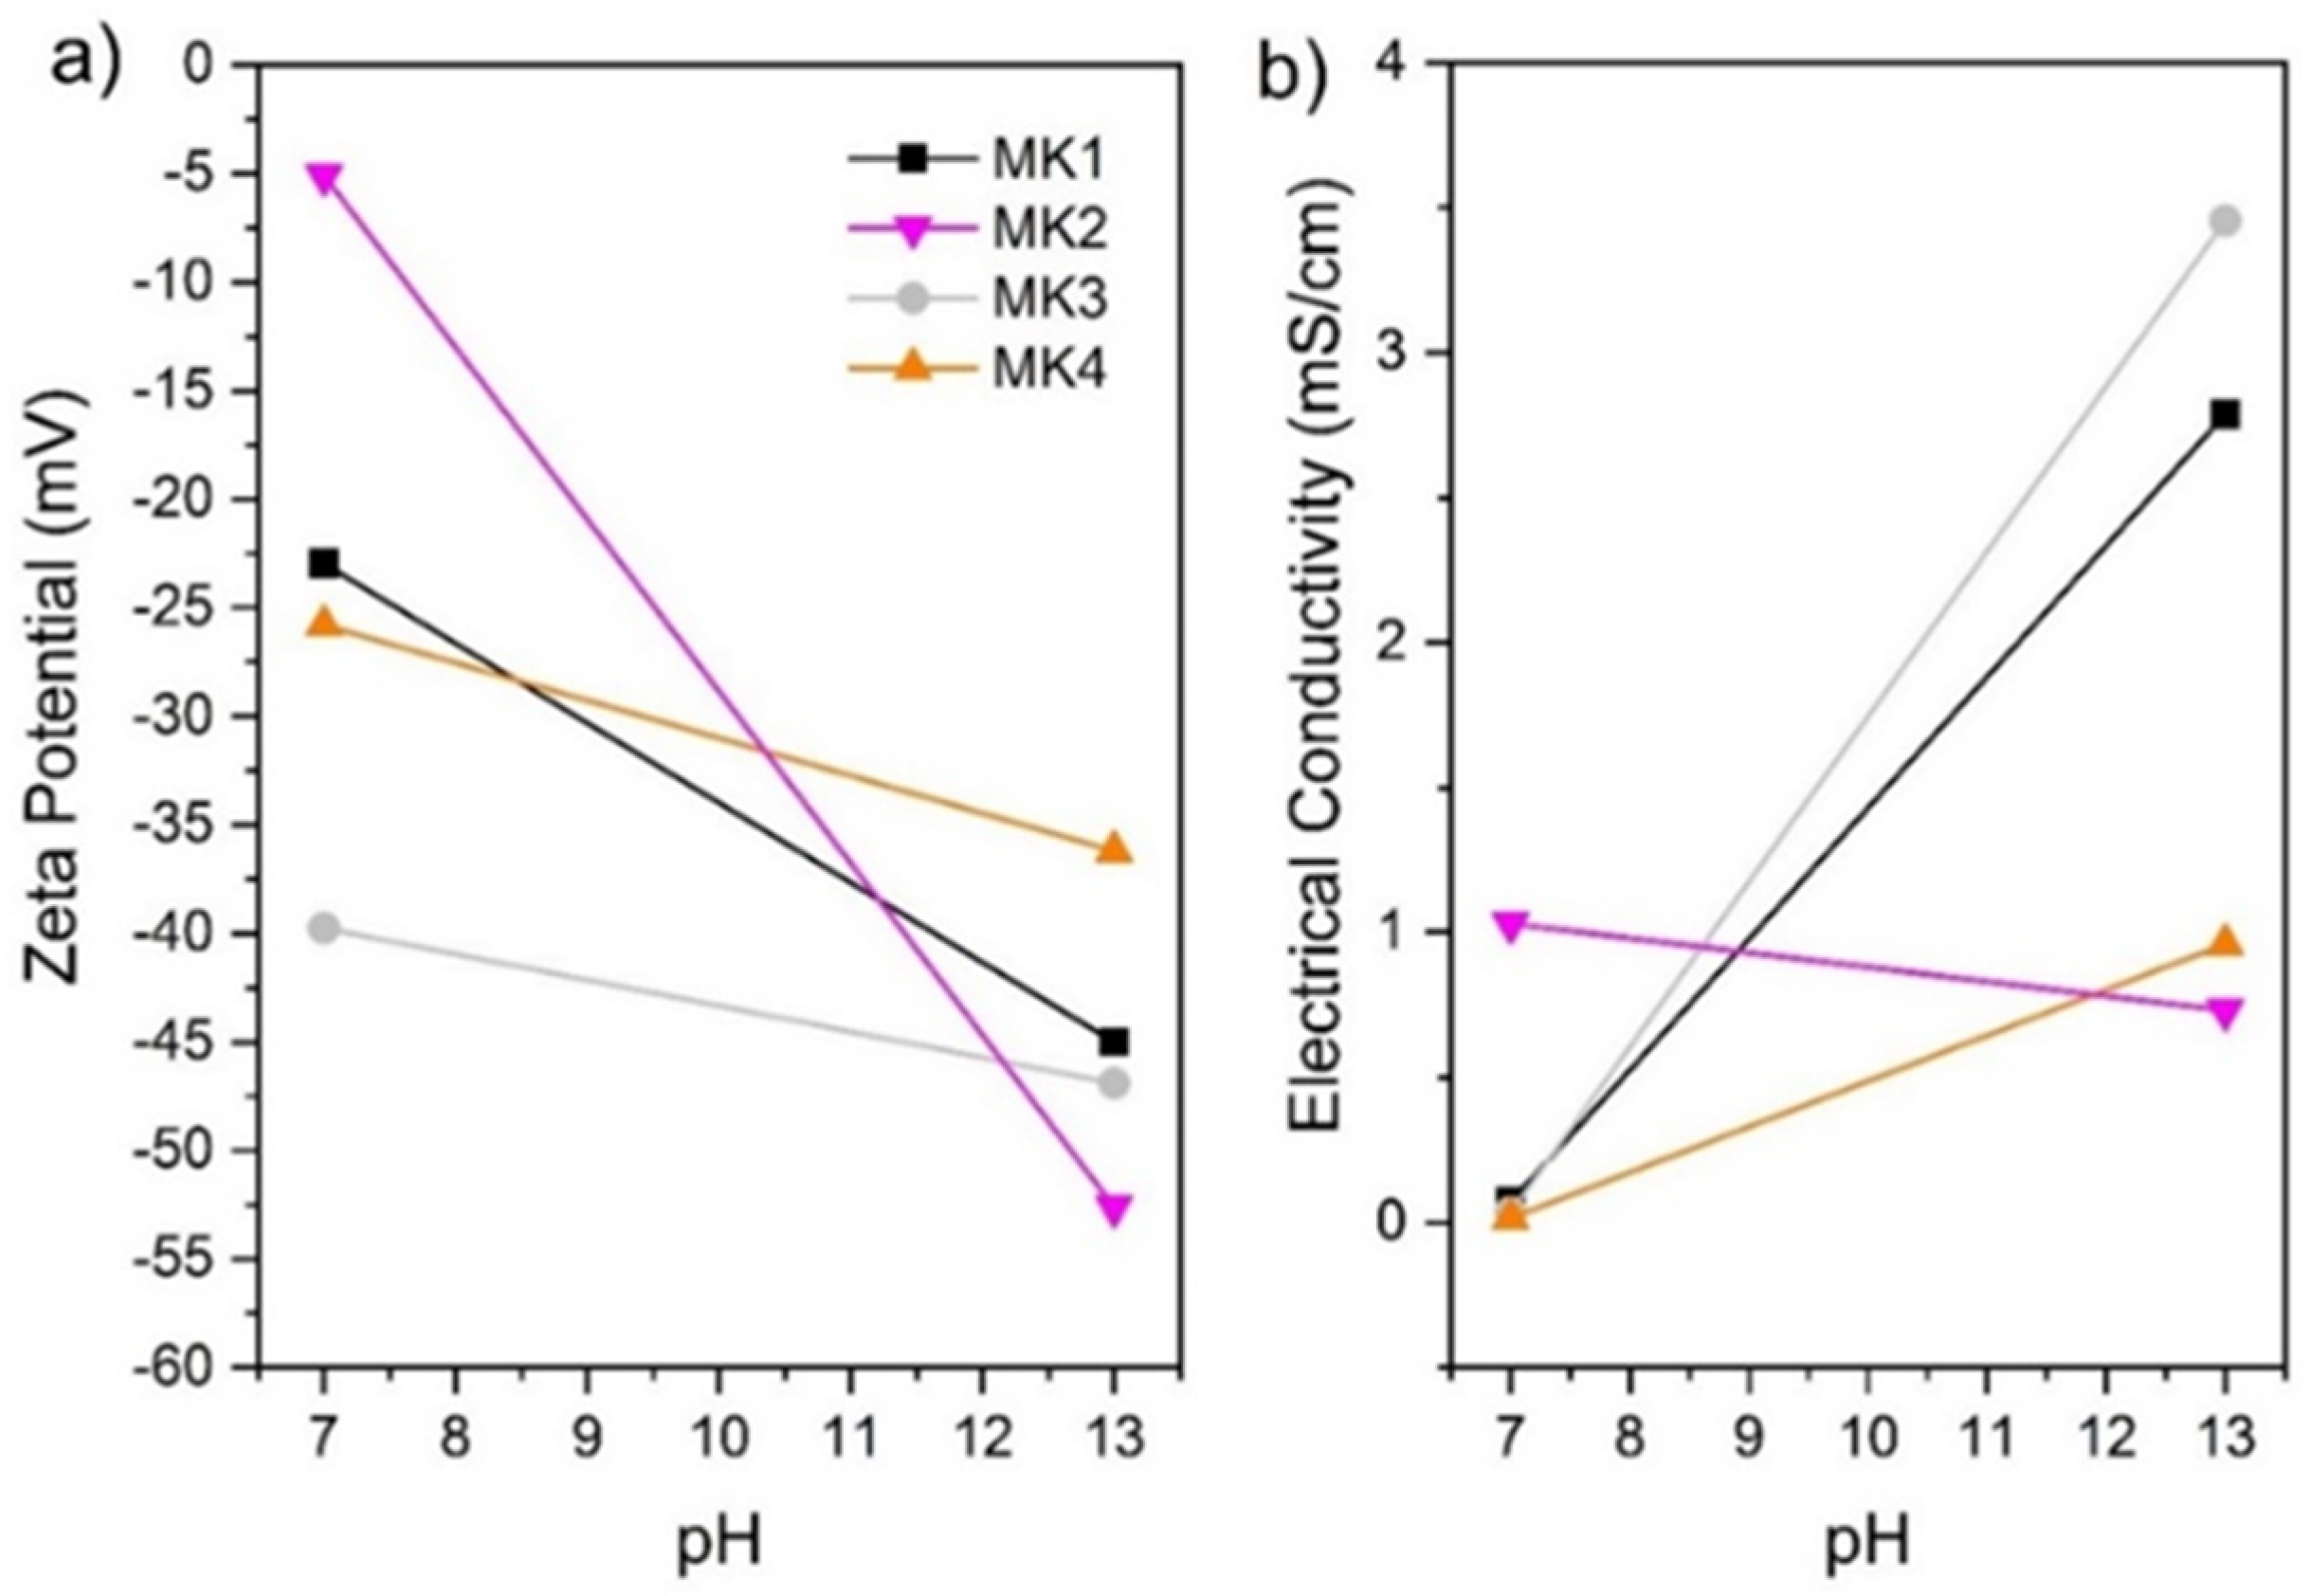
3.3. Zeta Potential (ZP) and Electrical Conductivity

Zeta potential and electrical conductivity were also characterized as physical properties. Figure 3a shows the zeta potential of particles at different pH (7 and 13). Under aqueous conditions, the particles exhibit repulsive behavior towards each other. Nevertheless, MK2 showed a higher tendency to agglomerate at pH values below 7, a behavior that correlates with its particle size. When the pH was increased to 13, the particles became more negatively charged due to the addition of alkaline ions in the medium. This increased negative charge resulted in greater repulsion between particles, reducing the likelihood of agglomeration [29,30]. The particle electrical conductivity increased proportionally with decreased zeta potential [30], as shown in Figure 3b.
These results raise a hypothesis regarding the effects of each precursor. Thermal treatment appears to induce different effects on the precursors, with particle agglomeration occurring due to the stacking structure [31]. Inadequate grinding following low-temperature calcination can also lead to increased particle precipitation or reduced dissolution rates in the medium [32]. In this context, MK2 exhibited signs of having experienced one or both of these issues compared to the other metakaolin, resulting in lower reactivity and larger particle size.

3.4. Vitreous Phases Determination

After the chemical attack, the vitreous phase content was quantified as follows: MK1 = 37.02%, MK2 = 80.05%, MK3 = 60.07%, and MK4 = 61.04%. It is important to note that the vitreous phase content is closely tied to the silica or alumina composition. When correlating these values with the XRF results, although MK1 has a high content of key oxides, the reactivity of its alumina and silica may be lower than that of the other samples due to the presence of muscovite in its structure. In MK1, much of the alumina content is locked within the crystalline structure, while silica’s activity depends on surface chemistry [33]. If silica groups are the first to interact with the medium, they can either act as reactive sites or behave like impurities, controlling the reaction rate. Higher oxide content can initially enhance dissolution rates, but this effect may diminish over time.

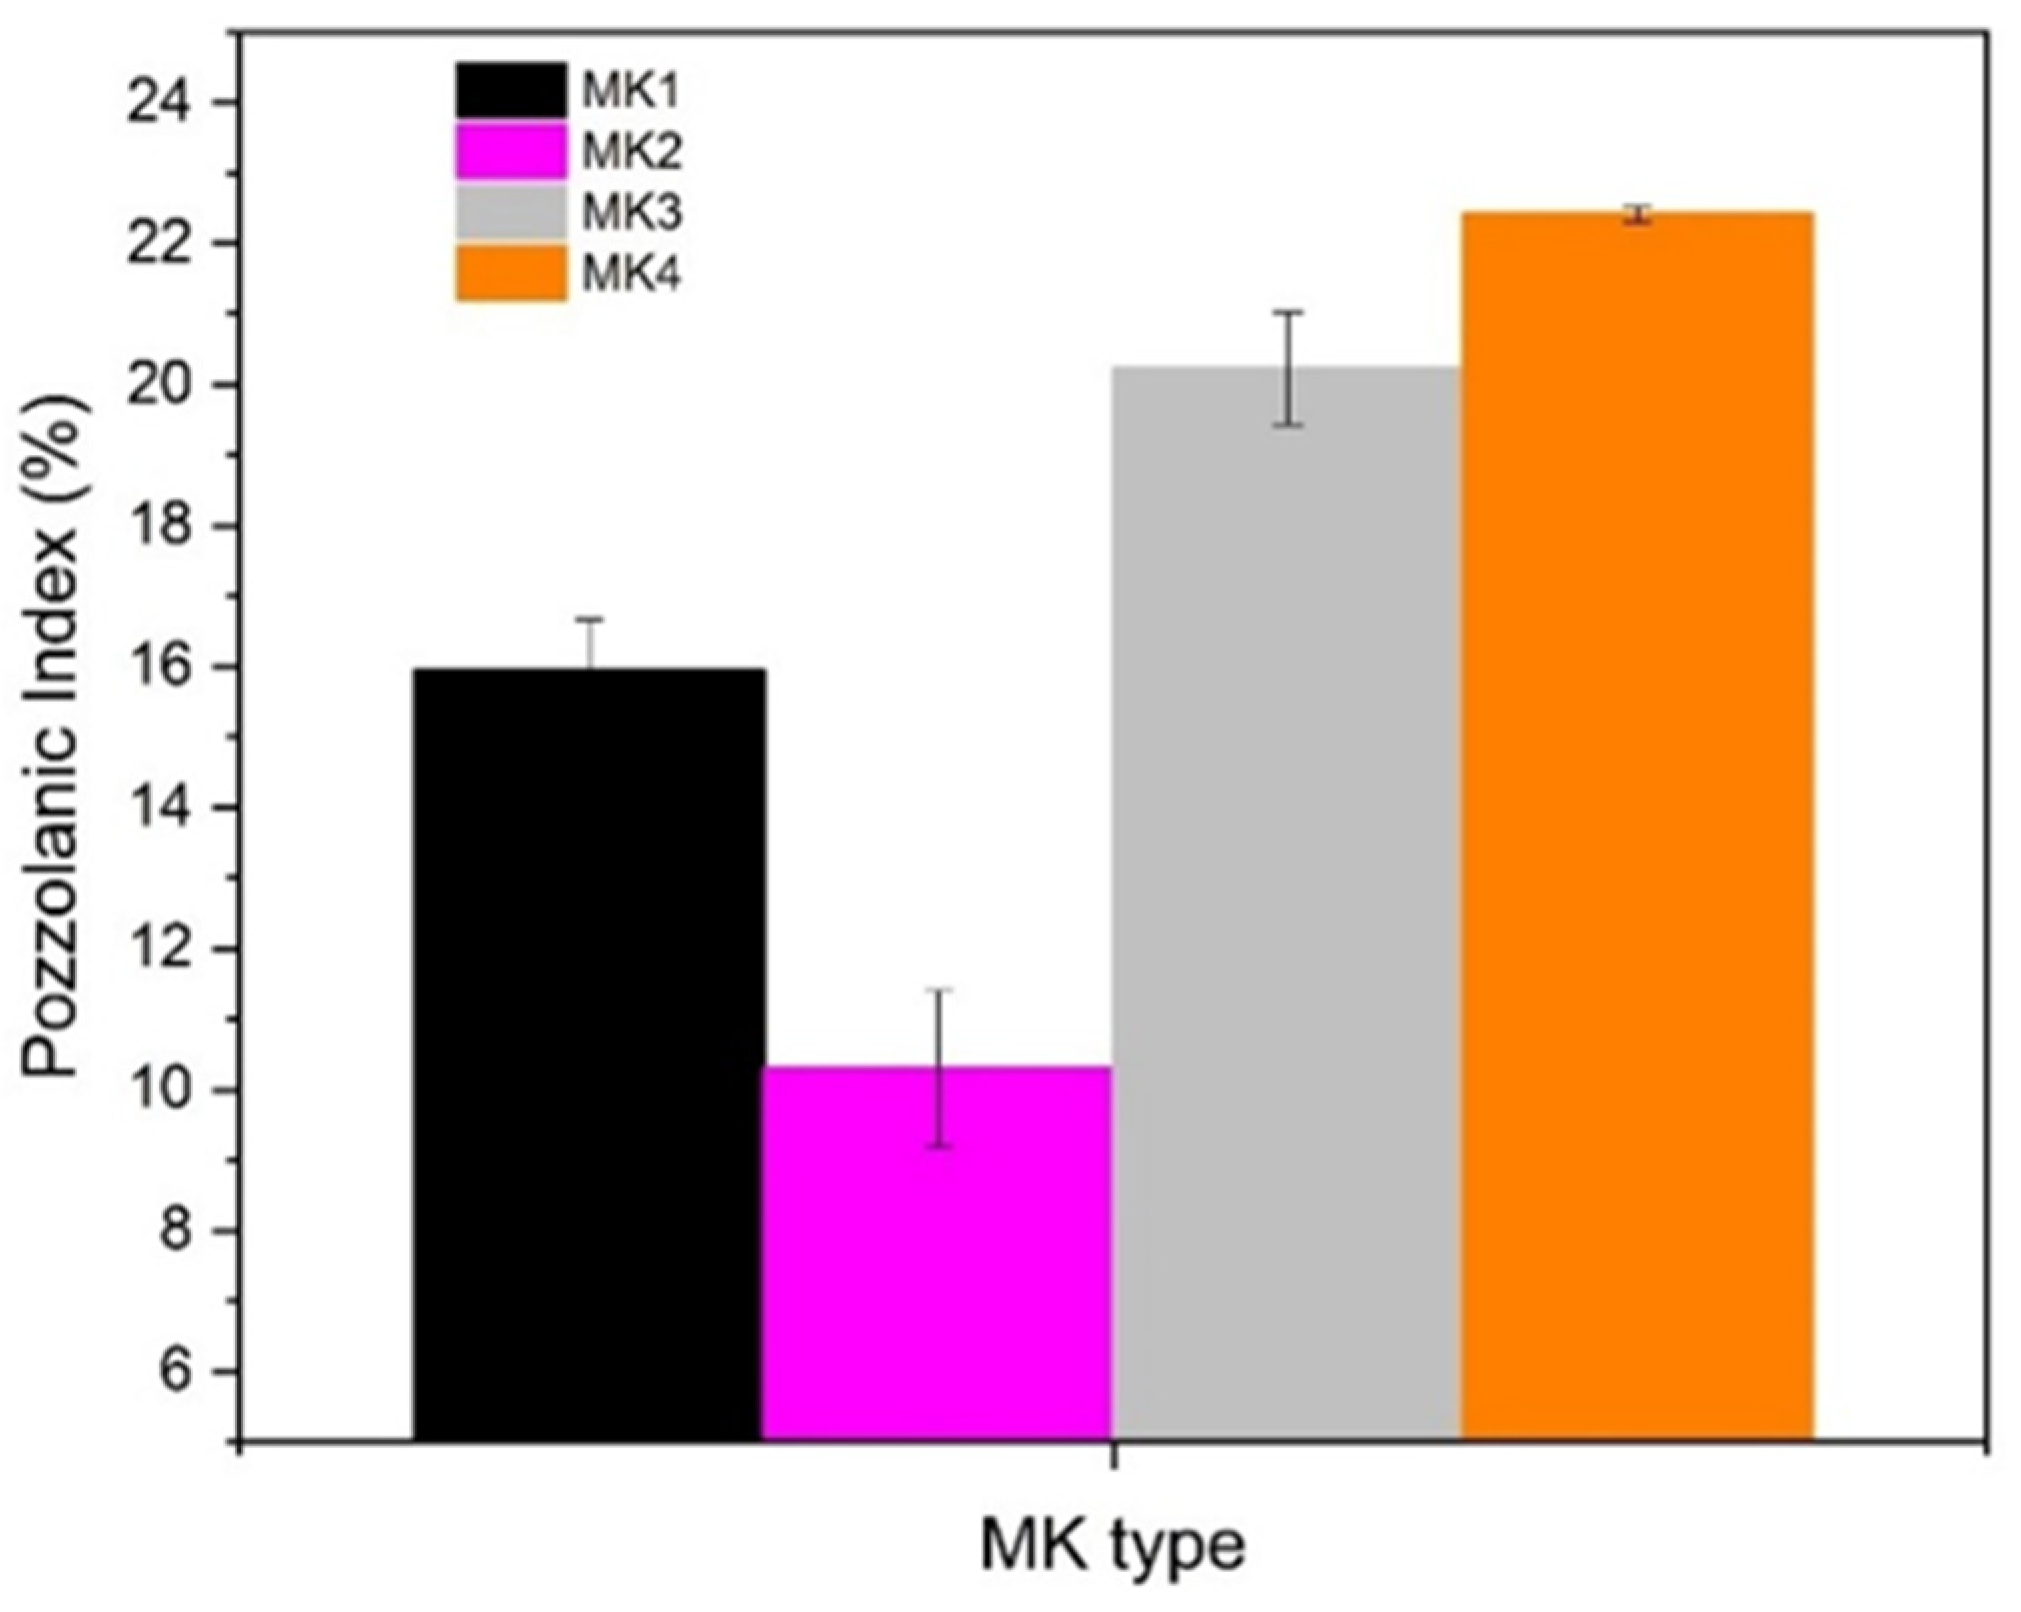
3.5. Pozzolanic Activity (PA)

PA was determined by measuring the electrical conductivity of a Ca(OH)2 solution at 40 °C, simulating the porous environment in cement systems. This method indirectly assessed the activity of a pozzolanic material, and the results are used to calculate the pozzolanic index, as shown in Equation (1). Figure 4 presents the PA results for all precursors. By comparing these values, it can be inferred that the material can fix calcium hydroxide on its surface and progress to form a new phase in cement systems [34], making it suitable for alkaline activation. These values tend to be higher in calcined clays with significant vitreous phases [35]. The results also indicate that MK2 did not undergo sufficient heat treatment compared to the other MKs, as calcined clays with a pozzolanic index above 13.3% are considered to exhibit good pozzolanic activity. Values below 5.2% suggest variable pozzolanic activity, although such materials may still be suitable for use in alkaline solutions.
Pozzolanic   index   % = L 0 L i L o × 100
where L 0 —measured at zero time into solution; L 1 —measured at two minutes after the addition of the sample.

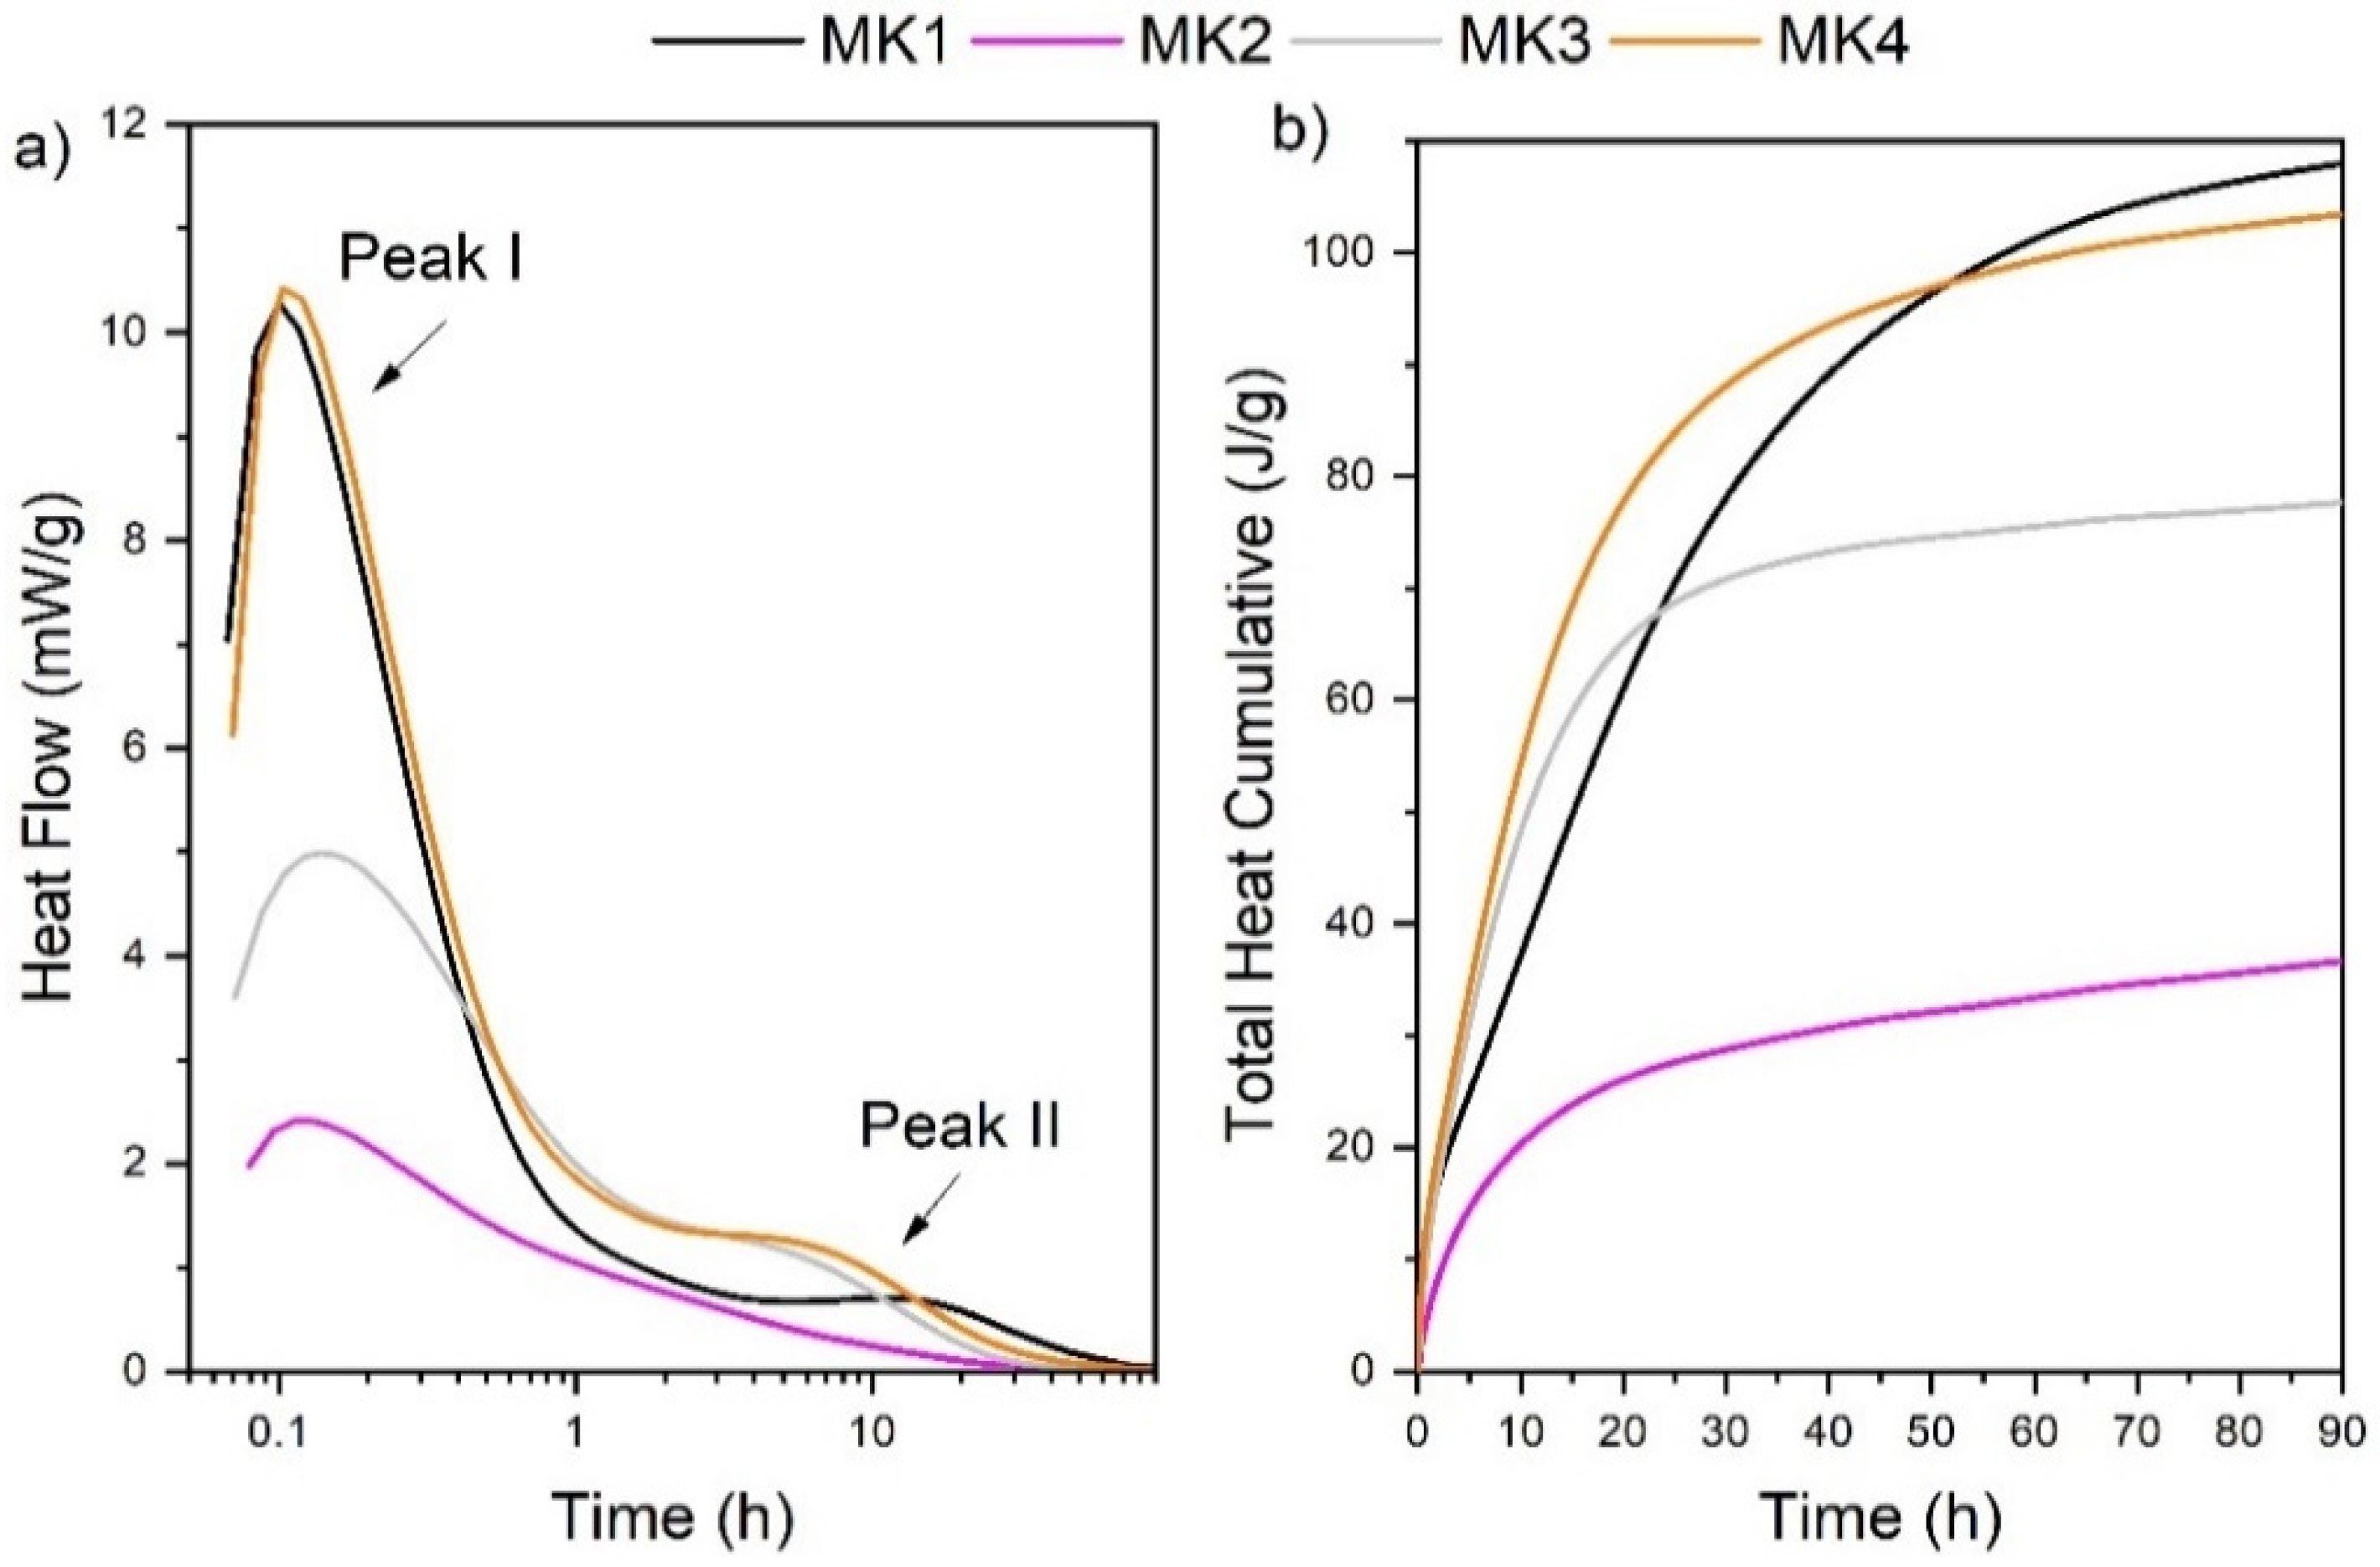
3.6. Isothermal Conduction Calorimetry (ICC)

Isothermal conduction calorimetry was employed to analyze the heat flow and total accumulated heat of the activated system. As illustrated in Figure 5a,b, all groups exhibited an initial peak of intense heat release within the first hour, corresponding to the dissolution of particles, with MK3 and MK4 showing the highest intensity, and MK2 the lowest. Following this, MK3 and MK4 registered an inflexion point, succeeded by a second peak (peak II) at 1.50 h and 1.55 h, respectively, associated with the acceleration of polymer chain formation [36]. In contrast, MK1 showed a delayed second peak at 3.55 h, and this peak was absent in MK2.
The total accumulated heat values aligned with the heat flux results, with MK1 and MK4 recording higher values, while MK2 and MK3 were 66% and 28% lower than MK4, respectively. The particle size distribution and XRD spectra of MK1 and MK4 significantly impacted the dissolution stage, with the finer particles of MK1 providing greater surface contact with the activator solution. However, the delayed second peak in MK1 indicates slower reactivity, likely due to the presence of the muscovite phase, which remains crystalline at high temperatures, unlike kaolinite, which is fully dehydroxylated at 850 °C [37]. The larger particle sizes of MK2 and MK3 resulted in slower reactivity due to their lower dissolution rates [38], with a broader peak I. The reduced or absent peak intensities, along with the lower total accumulated heat for these precursors, were attributed to their lower amorphous content. Furthermore, the specific surface area results are consistent with this reactivity behavior.

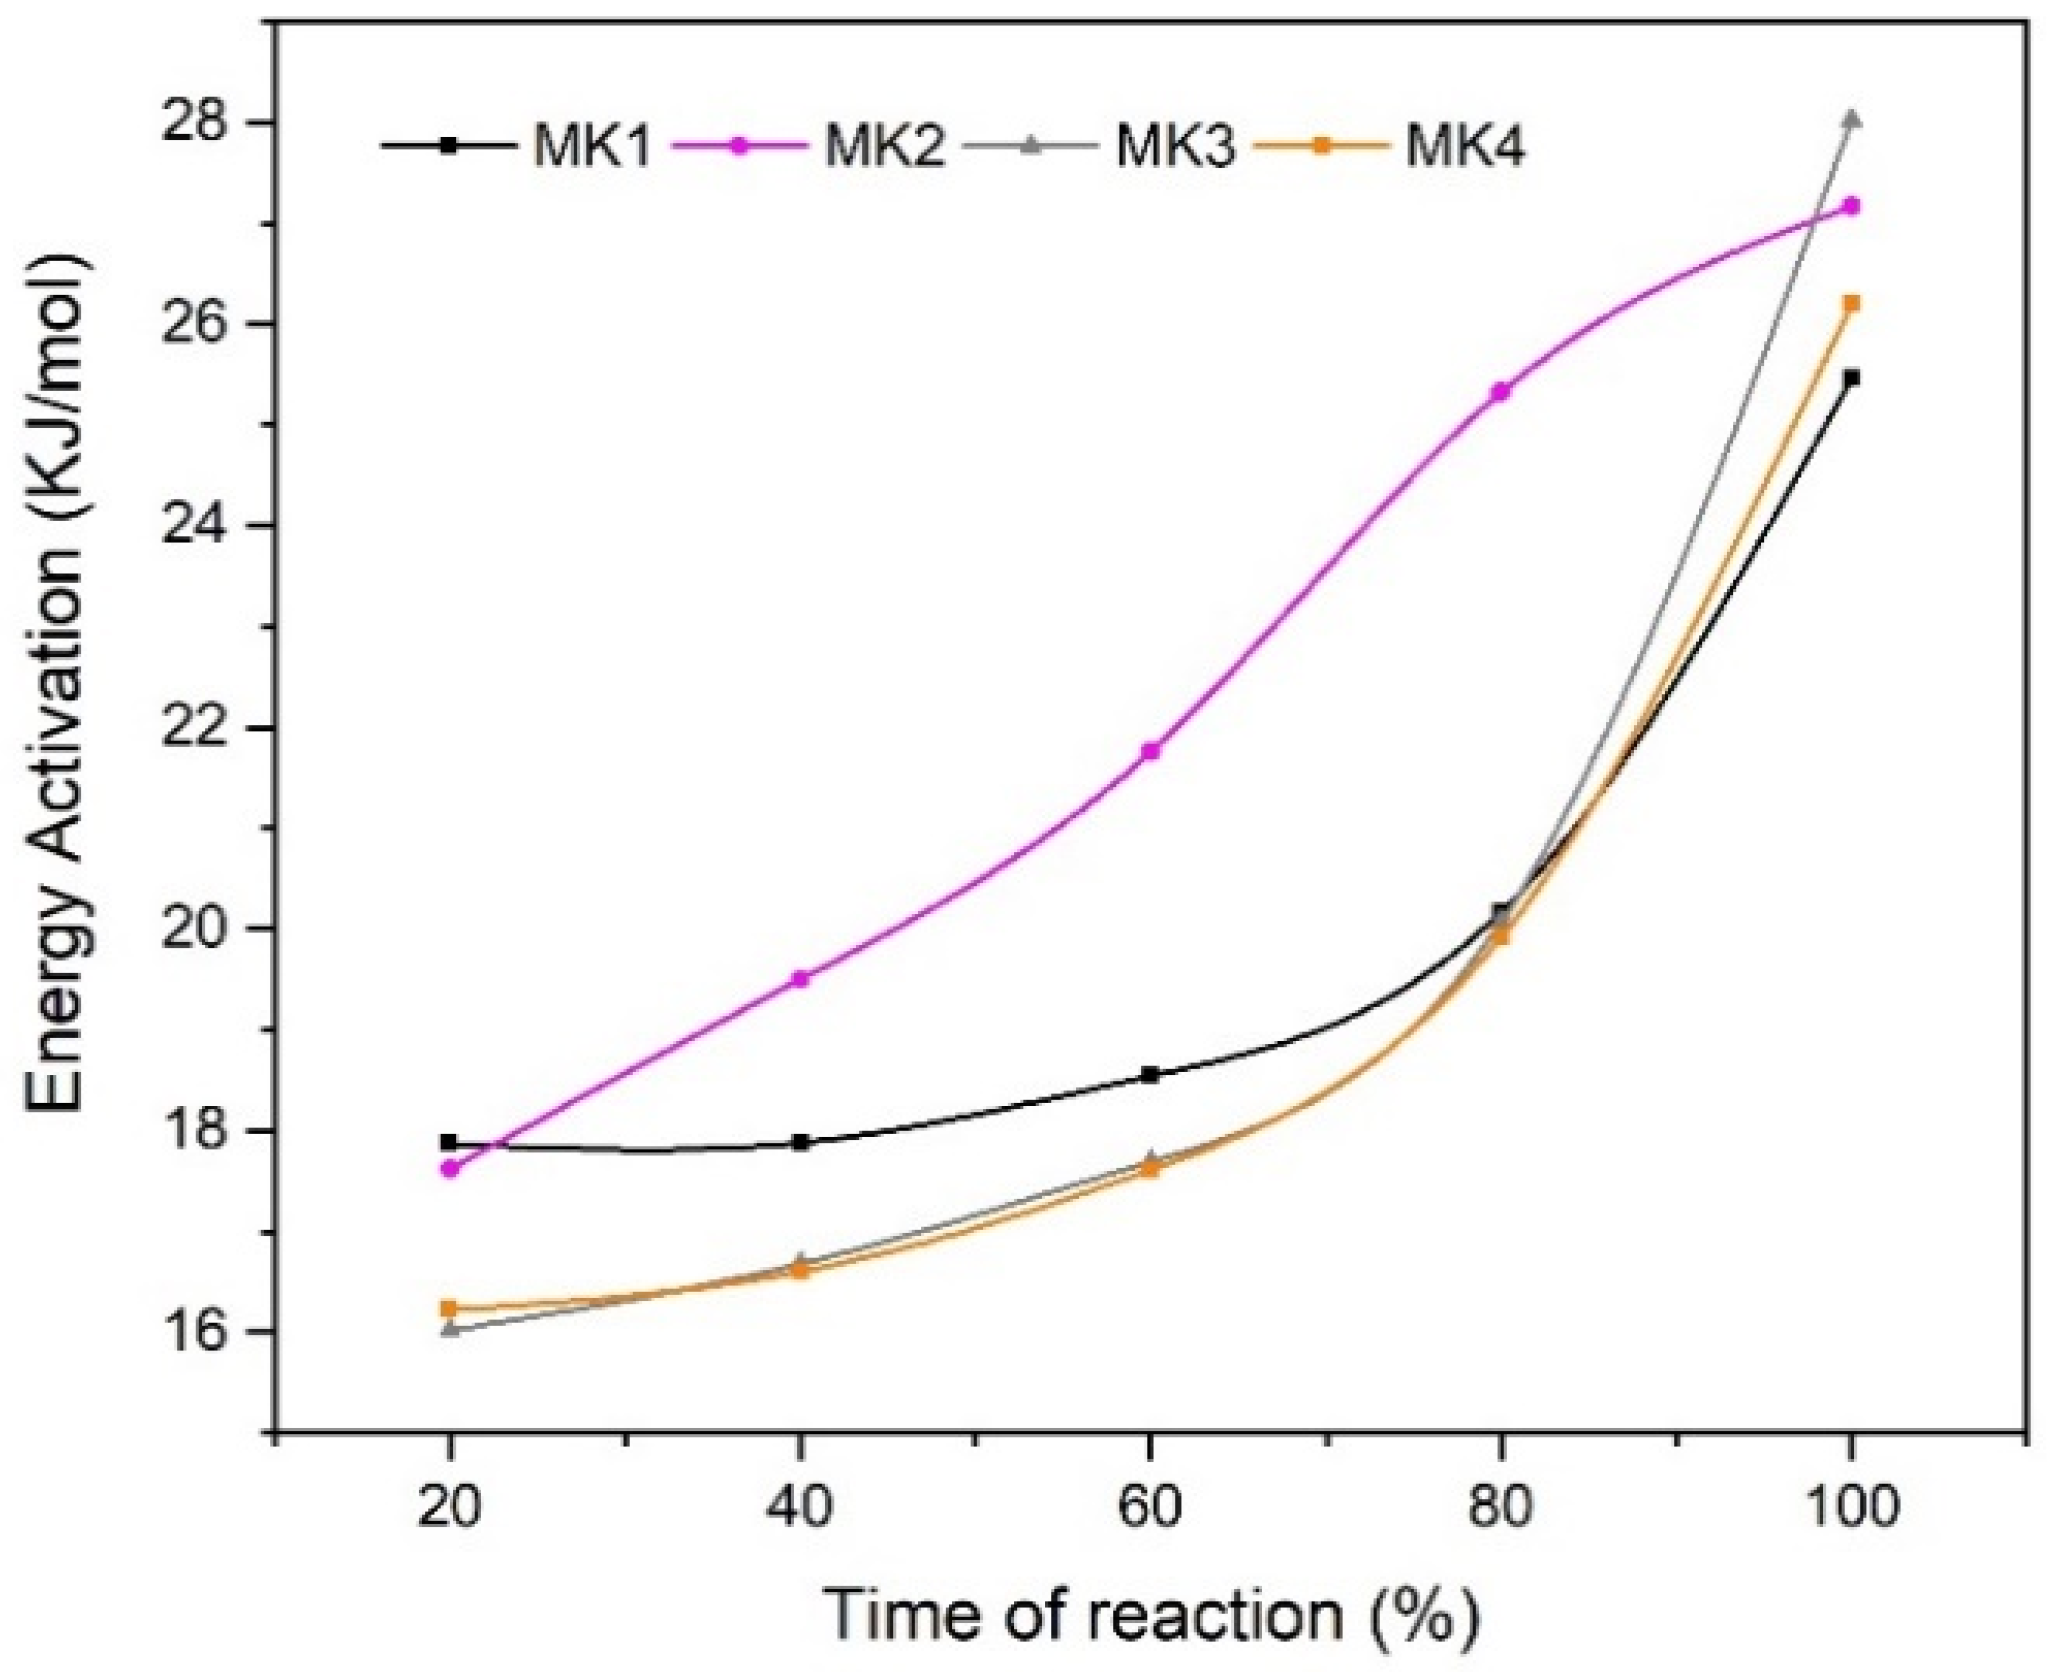
3.7. Apparent Activation Energy (EA)

The activation energy was calculated using Calmetrix software (version 2.21), applying the Arrhenius law and linear method [8]. This approach connects the concepts of temperature, frequency factor (related to molecular collisions that facilitate reactions), and the chemical constant. Figure 6 shows the trend in activation energy. The method involved plotting the reaction progression time (in this case, 90 h) against the potential energy values. The comparison revealed that even after the designated time, the reactions within the systems did not lead to the complete formation of products. According to the expected trend [8], the potential energy should have decreased over time and reached a plateau. However, no such plateau was observed in any groups, indicating the ongoing reactions. Notably, MK2 appeared to be approaching the onset of its reactions, as it tended to reduce energy potential after 80% of the reaction had been completed, suggesting it may be in the early stages of final product formation.
This analysis provides information about the minimum energy conditions in which the reactions occur. Initially, the values were similar among all groups, with MK2 and MK1 being slightly higher. This can be attributed to the presence of a higher crystalline phase and muscovite phase, respectively, with barriers on their surface requiring more energy to promote internal reactions [39]. MK1 develops the same trend as MK3 and MK4, while MK2 exhibits higher values, indicating a poorer reactivity condition that consumes more energy. The averages of the energy values are summarized in Table 3.

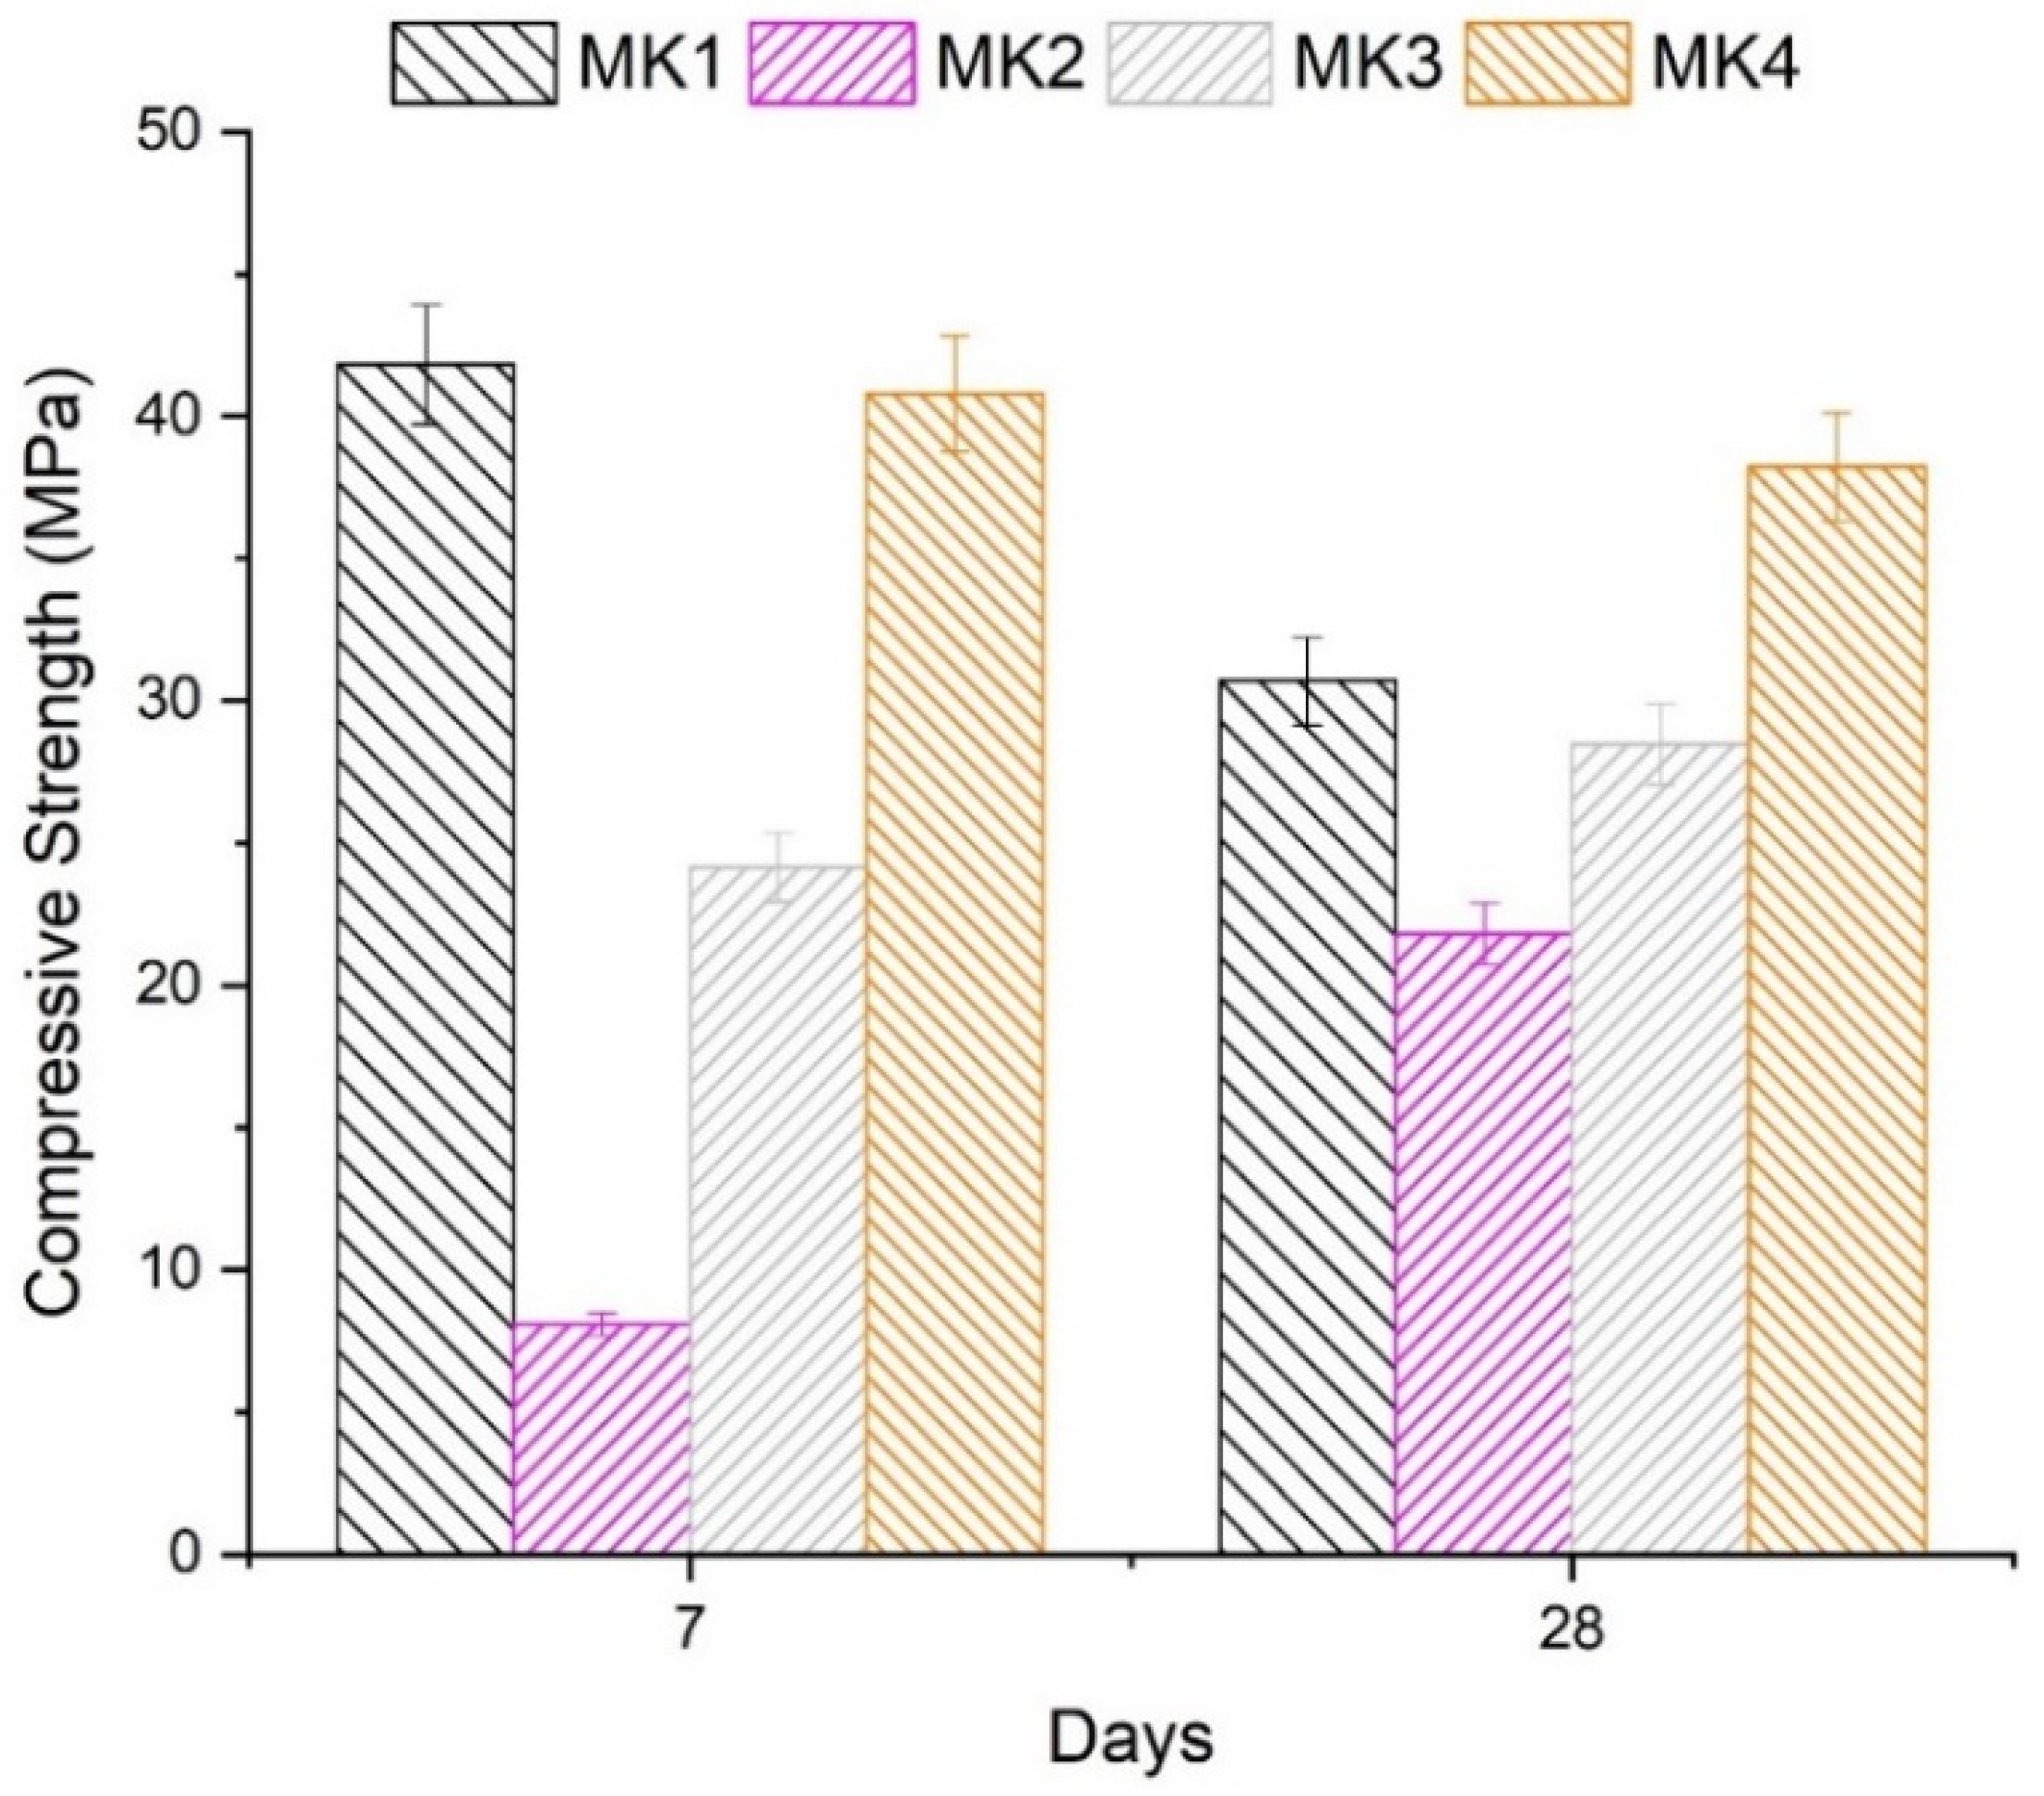
3.8. Compressive Strength

According to Figure 7, the MK1 and MK4 groups showed the highest compressive strength, reaching 40 MPa within 7 days. However, after 28 days, MK1 recorded a drop of 25%, while MK4 recorded a drop of 8.60%. Despite this, both remained higher than MK2 and MK3. This drop in strength may be linked to the beginning of transformation mechanisms, such as the formation of zeolite groups, that lead to microstructural adjustments, which are common in these materials at this time [40], or drying shrinkage, which is common on metakaolin systems. On the other hand, MK2 and MK3 recorded values close to 10 MPa and 25 MPa, respectively, with a tendency to increase. This suggests that they continue developing reactions over time, which contributed to forming a denser structure, directly impacting their final mechanical properties and possible long-term durability.
The results at 7 days are congruent with the cumulative total heat results, which are influenced by the materials’ reactivity. Even defining MK1 and MK2 as less reactive materials, they can increase their degree of polymerization and stiffness over time. This is a crucial factor when evaluating compressive strength, as any remaining anhydrous parts in the system can negatively impact it [39].
The SiO2/Al2O3 (molar) ratio varied among the groups, with MK2 and MK3 presenting higher values. However, this did not result in higher compressive strength values. This can be associated with the fact that the SiO2 and Al2O3 content of some precursors is not in a reactive form to contribute to the microstructure of geopolymer synthesis activations. Furthermore, the Na2O/ Al2O3 ratio follows this premise, significantly contributing to the resultant compressive strength using higher SiO2/Al2O3 (until an optimum point) and lower Na2O/Al2O3 [27,41].
Compared to previous studies that used metakaolin as precursors, these compressive strength results obtained in this study fall within reasonable ranges. Similar works achieved a compressive strength of 30.3 MPa in systems with a concentration of 6 M after 28 days of room curing at 24 °C [42] and obtained strength close to 10 MPa for 7 and 28 days of ambient curing [43]. These results suggest a potentially superior quality of the precursors employed in the present study.

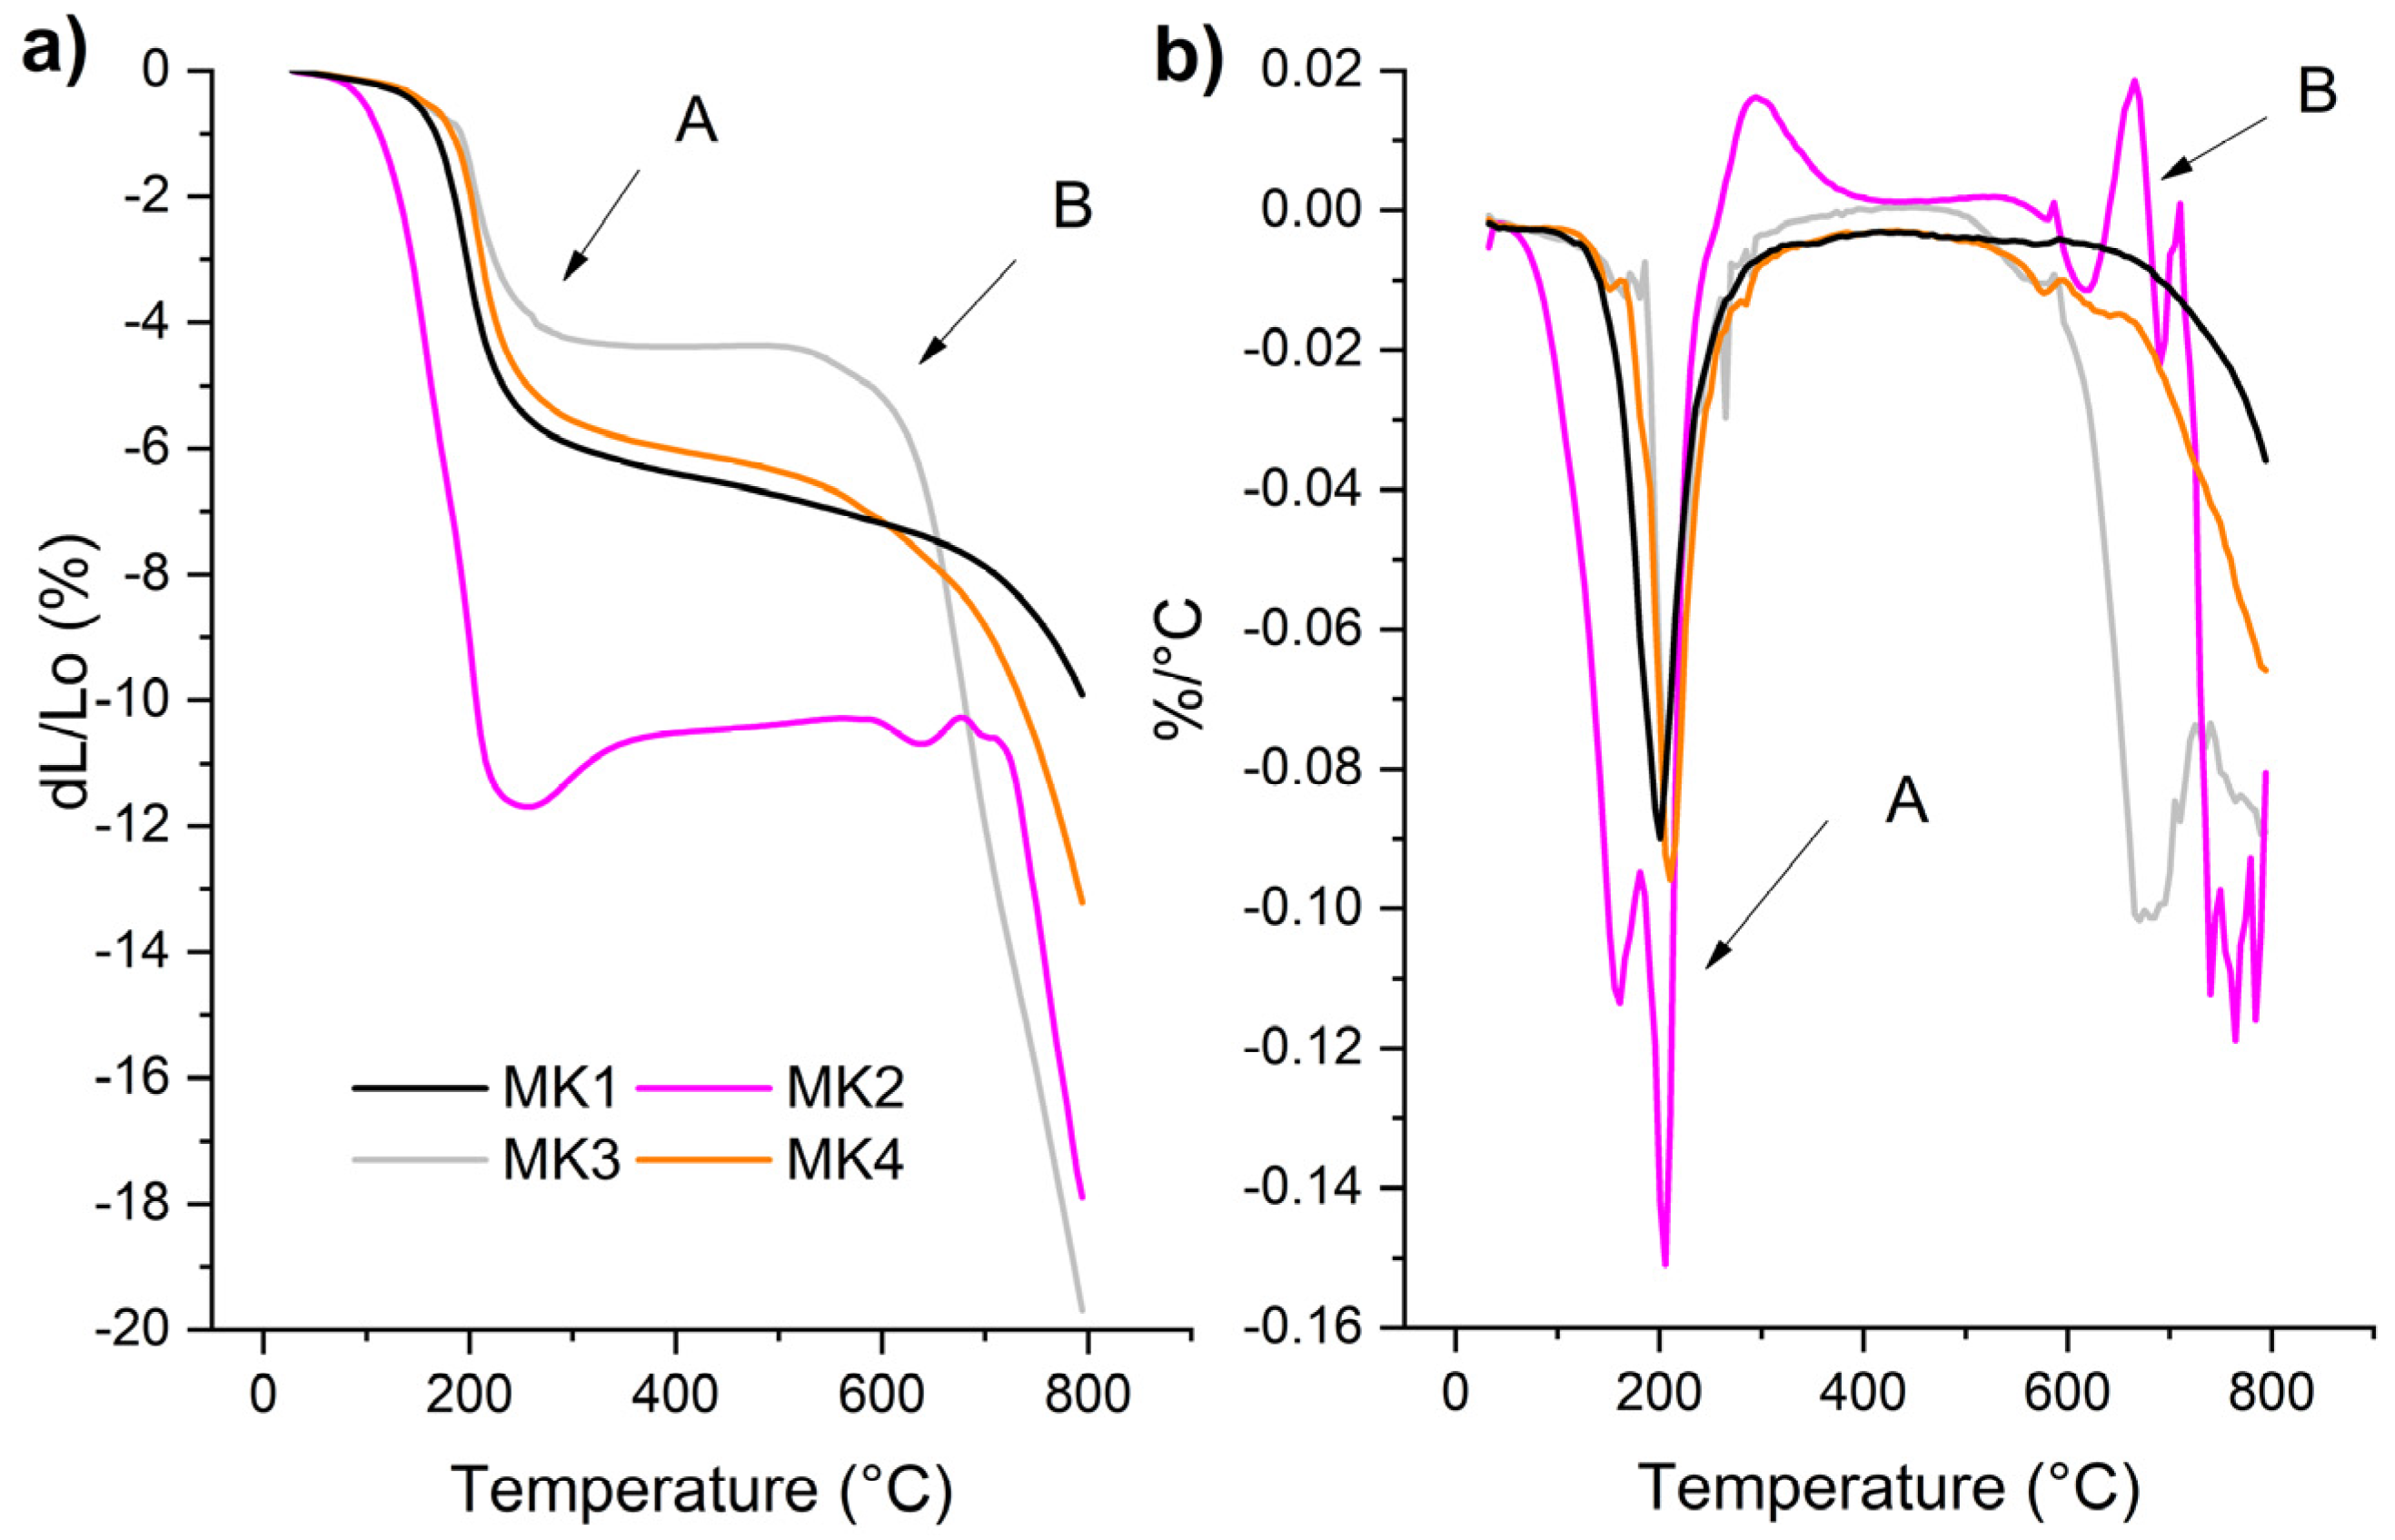
3.9. Dilatometry Analysis

The dilatometry analysis presented a similar behavior to the results reported in the literature [1,44]. The chemical transformations that occur with temperature increase are registered in Figure 8a by measuring sample contraction or expansion. Some researchers suggest that the sharp decrease up to 200 °C corresponds to the loss of free water [45], likely due to either evaporation or pore collapse, causing a slight contraction [46]. In the MK2-based system, dimensional stability was more compromised, as indicated by the significant contraction observed until the inflexion point at A. With further temperature increases, MK2 and MK3 reached plateaus at 520 °C and 720 °C, respectively, followed by progressive dimensional shrinkage until the end of the tested temperature range. This behavior is associated with slow dihydroxylation [46], which, theoretically, should be similar in all systems due to the alkaline solution. However, the initial raw material conditions and its reactivity differed: MK1 and MK4 demonstrated good interaction with the medium and reacted well; MK1 showed even better interaction with the alkaline solution than MK3 and MK4; while MK2 struggled to react and displayed significant deformations in the system.
When examining the derivative of the dimensional variation (Figure 8b), it becomes clear that MK1 and MK4 exhibited no substantial structural changes after 600 °C, whereas MK2 displayed multiple significant peaks. MK3 showed a single peak at point B, which likely represents mass loss due to silanol dihydroxylation [9,47] or condensation, leading to accelerated thermal shrinkage.

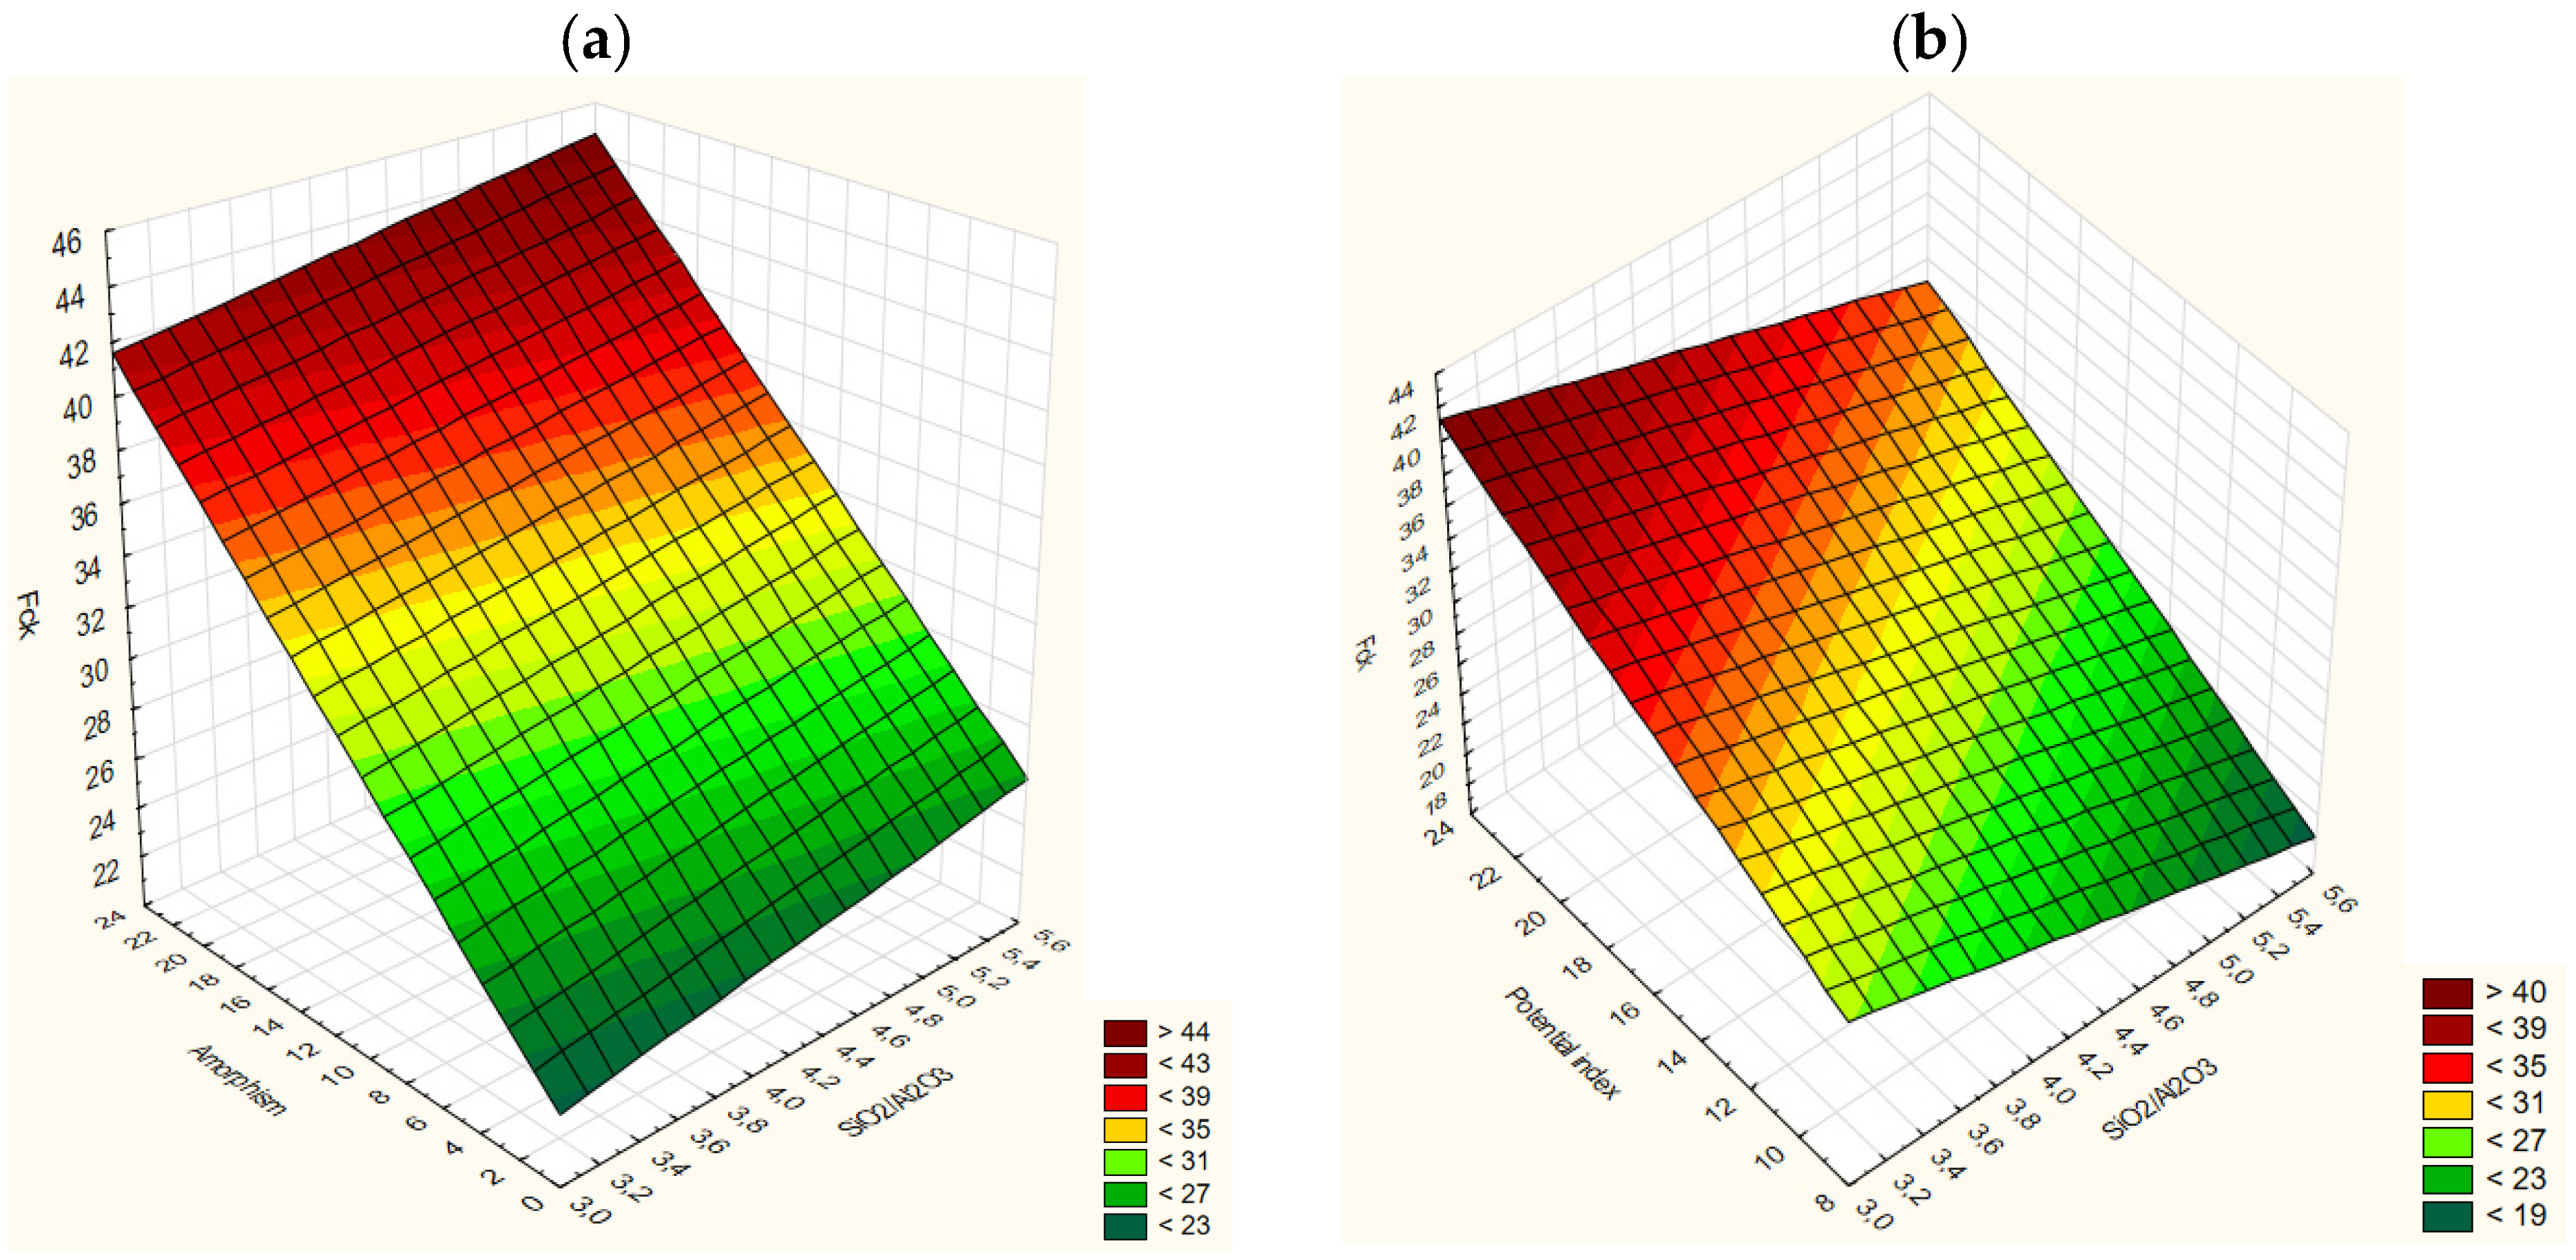
3.10. Mathematical Model

The mathematical model was developed using Statistica software (version: 13.5), which identified the contribution coefficients of each parameter. These coefficients are summarized in Table 4 for each scenario. The values obtained for specific surface area, pozzolanic index, and amorphism are the result of three measurements taken according to the defined technique. However, the SiO2/Al2O3 ratio and apparent activation energy remained constant across all evaluations. This led to the creation of a multiple regression model, previously expressed as an equation. Although all the parameters are intrinsic to the precursor material, they are not exclusive to it. Therefore, only one factor was available for the analysis of variance (ANOVA) to determine whether the unique characteristics of each precursor significantly impacted compressive strength (Fck).
The representative model of this MK’s family is specified in Equation (2). By developing a linear behavior, each parameter contributes to the coefficient in any variable. However, for the SiO2/Al2O3 ratio, the apparent activation energy and the amorphism area have the most important contribution:
F c k = 65.350 + 9.380 A + 0.007 B 1.036 C 3.777 D + 1.308 E ;   R 2 = 0.9543
where F c k is the compressive strength in MPa, A is SiO2/Al2O3 from the system, B is specific area in m2/Kg, C is pozzolanic index in %, D is Average Apparent Activation Energy in kJ/mol and, finally, E correspond to amorphism, obtained as the area under the curve of the XRD spectra, measured as points.
In this case, the surface response can only be chosen from two parameters, which are defined as those that are independent or do not have any direct correlation in the same precursor, such as SiO2/Al2O3 and pozzolanic index or SiO2/Al2O3 and amorphism, as there is no strictly proportional connection, as can be seen on Figure 9. Thus, the scheme that summarizes this interaction is represented in b under two different situations: considering an interaction between amorphism and the SiO2/Al2O3 ratio, Fck had the higher values on amorphism and the SiO2/Al2O3 ratio. However, when this modified the amorphism of the pozzolanic index, the higher Fck was dislocated to the minor SiO2/Al2O3 and higher pozzolanic index. The hypothesis justifies that, in both situations, a higher reactive material will probably record a higher SiO2/Al2O3 ratio. As an indicator of reactivity in an alkaline medium, the pozzolanic index allows, in a qualitative way, the formation of products in the same medium between types of materials.
Muracchioli et al. [48] had a higher coefficient when the SiO2/Al2O3 variable was applied in the model. Much of the unitary effect was caused by curing time, aging time, and temperature. Using the surface response, the study group of [49] stated that the conformation with SiO2/Al2O3 increased the decrease in compressive strength. Comparing the characteristics of the material used in this study probably developed a greater mechanical response in their model.
Other authors determined that the liquid/solid ratio was significant based on the applied formulation. However, this conclusion was obtained using different types of models [19,20], which means that even using a complex model, the significance variable will probably be the same. One of the most important clarifications made by [19,48] is that each model has limitations associated with sample preparation conditions, but, considering the process, validation can define the performance level of the analysis used.

4. Conclusions

This study characterized four different types of metakaolin to assess their reactivity and suitability as precursor materials for geopolymer synthesis. The findings demonstrated that metakaolin with higher alumina content, smaller particle sizes, and a greater degree of amorphism, coupled with fewer crystalline contaminants, led to enhanced geopolymerization and greater reactivity. The mechanical tests confirmed this, with MK1 and MK4 showing superior compressive strength.
Calorimetry results further validated the amorphous content observed through X-ray diffraction, with MK1 and MK4 exhibiting significantly higher dissolution rates compared to MK2 and MK3. Despite being marketed under similar specifications, notable differences in the metakaolin properties were identified.
Thus, MK1 and MK4, with their favorable properties, are considered high-quality precursors for geopolymer production, although their long-term chemical and mechanical stability warrants further evaluation. Although MK2 displayed lower initial reactivity, it showed the potential for strength development over time, attributed to continued reactions within the system. Additionally, the variations in vitreous phase behavior suggest that, despite MK2’s slower initial response, its mechanical performance improves significantly with time.
The key factors differentiating the compressive strength among these precursors appear to be the silica/alumina ratio, degree of amorphism, and pozzolanic index. These parameters provide valuable insights into the performance of metakaolin in geopolymer systems and serve as important indicators for future material selection.

Author Contributions

M.T.-B.: conceptualization, formal analysis, methodology, writing, data curation; L.U.D.T.J.: formal analysis, methodology, writing; A.R.G.d.A., C.M.V.: methodology, funding acquisition, P.J.P.G.: methodology, software, supervision, writing. All authors have read and agreed to the published version of the manuscript.

Funding

This research received no external funding.

Data Availability Statement

Dataset available on request from the authors.

Acknowledgments

The authors thank the Brazilian agencies: CAPES, CNPq, and FAPERJ, PDJ-151351/2022-8) and FAPERJ (PDR10–204.171/2021, E-26/211.194/2021, E-26/200.086/2024).

Conflicts of Interest

The authors declare no conflicts of interest.

References

  1. Provis, J.L.; van Deventer, J.S.J. Geopolymerisation kinetics. 2. Reaction kinetic modeling. Chem. Eng. Sci. 2007, 62, 2318–2329. [Google Scholar] [CrossRef]
  2. Yang, K.; White, C.E. Modeling the Formation of Alkali Aluminosilicate Gels at the Mesoscale Using Coarse-Grained Monte Carlo. Langmuir 2016, 32, 11580–11590. [Google Scholar] [CrossRef] [PubMed]
  3. Pacheco-Torgal, F.; Jalali, S. Ligantes Geopoliméricos. Uma Alternativa ao Cimento Portland? Ingenium 2010, 2, 66–68. [Google Scholar]
  4. Li, W.; Shumuye, E.D.; Shiying, T.; Wang, Z.; Zerfu, K. Eco-friendly fiber reinforced geopolymer concrete: A critical review on the microstructure and long-term durability properties. Case Stud. Constr. Mater. 2022, 16, e00894. [Google Scholar]
  5. Hildebrando, E.A.; Angélica, R.S.; Neves, R.F.; Valenzuela-Diaz, F.R. Síntese de zeólita do tipo faujasita a partir de um rejeito de caulim. Ceramica 2012, 58, 453–458. [Google Scholar] [CrossRef]
  6. Ruiz-Santaquiteria, C.; Fernández-Jiménez, A.; Skibsted, J.; Palomo, A. Clay reactivity: Production of alkali-activated cements. Appl. Clay Sci. 2013, 73, 11–16. [Google Scholar] [CrossRef]
  7. Fernández-Jiménez, A.; Palomo, A.; Sobrados, I.; Sanz, J. The role played by the reactive alumina content in the alkaline activation of fly ashes. Microporous Mesoporous Mater. 2006, 91, 111–119. [Google Scholar] [CrossRef]
  8. Brown, T.L. Chemistry. The Central Science; Pearson: Glenview, IL, USA, 2012; Volume 12. [Google Scholar]
  9. Li, L.; Sun, W.; Feng, Z.; Li, Y.; Feng, T.; Liu, Z. Hydration kinetics and apparent activation energy of cement pastes containing high silica fume content at lower curing temperature. Constr. Build. Mater. 2024, 435, 136881. [Google Scholar] [CrossRef]
  10. Joseph, S.; Uppalapati, S.; Cizer, Ö. Instantaneous activation energy of alkali-activated materials. RILEM Tech. Lett. 2018, 3, 121–123. [Google Scholar] [CrossRef]
  11. Alujas, A.; Fernández, R.; Quintana, R.; Scrivener, K.L.; Martirena, F. Pozzolanic reactivity of low grade kaolinitic clays: Influence of calcination temperature and impact of calcination products on OPC hydration. Appl. Clay Sci. 2015, 108, 94–101. [Google Scholar] [CrossRef]
  12. Pelisser, F.; Bernardin, A.M.; Michel, M.D.; da Luz, C.A. Compressive strength, modulus of elasticity and hardness of geopolymeric cement synthetized from non-calcined natural kaolin. J. Clean. Prod. 2021, 280, 124293. [Google Scholar] [CrossRef]
  13. Du, X.; Pang, D.; Zhao, Y.; Hou, Z.; Wang, H.; Cheng, Y. Investigation into the adsorption of CO2, N2 and CH4 on kaolinite clay. Arab. J. Chem. 2022, 15, 103665. [Google Scholar] [CrossRef]
  14. Cheng, H.; Zhou, Y.; Xu, P.; Zhang, M.; Sun, L. Kaolinite-based form-stable phase change materials for thermal energy storage. J. Energy Storage 2024, 87, 111349. [Google Scholar] [CrossRef]
  15. Rosin, N.A.; Demattê, J.A.M.; Poppiel, R.R.; Silvero, N.E.Q.; Rodriguez-Albarracin, H.S.; Rosas, J.T.F.; Greschuk, L.T.; Bellinaso, H.; Minasny, B.; Gomez, C.; et al. Mapping Brazilian soil mineralogy using proximal and remote sensing data. Geoderma 2023, 432, 116413. [Google Scholar] [CrossRef]
  16. Júnior, L.U.D.T.; Taborda-Barraza, M.; Cheriaf, M.; Gleize, P.J.P.; Rocha, J.C. Effect of bottom ash waste on the rheology and durability of alkali activation pastes. Case Stud. Constr. Mater. 2022, 16, e00790. [Google Scholar]
  17. Rocha, T.S.; Dias, D.P.; França, F.C.C.; Guerra, R.R.S.; Marques, L.R.C.O. Metakaolin-based geopolymer mortars with different alkaline activators (Na+ and K+). Constr. Build. Mater. 2018, 178, 453–461. [Google Scholar] [CrossRef]
  18. Neto, J.A.S.; Marçal, N.A.; Nóbrega, A.F.; Nóbrega, A.C.V.; Souza, J.J.N.; Malheiro, R. Use of metakaolin with a low surface area and rich in quartz and iron as a precursor in the production of structural alkali-activated concrete. Constr. Build. Mater. 2024, 430, 136418. [Google Scholar] [CrossRef]
  19. Ahmed, H.U.; Mohammed, A.S.; Faraj, R.H.; Qaidi, S.M.A.; Mohammed, A.A. Compressive strength of geopolymer concrete modified with nano-silica: Experimental and modeling investigations. Case Stud. Constr. Mater. 2022, 16, e01036. [Google Scholar] [CrossRef]
  20. Aouan, B.; Alehyen, S.; Fadil, M.; Alouani, M.E.L.; Khabbazi, A.; Atbir, A.; Taibi, M. Compressive strength optimization of metakaolin-based geopolymer by central composite design. Chem. Data Collect. 2021, 31, 100636. [Google Scholar] [CrossRef]
  21. Toufigh, V.; Jafari, A. Developing a comprehensive prediction model for compressive strength of fly ash-based geopolymer concrete (FAGC). Constr. Build. Mater. 2021, 277, 122241. [Google Scholar] [CrossRef]
  22. Criado, M.; Fernández-Jiménez, A.; Palomo, A. Alkali activation of fly ash. Part III: Effect of curing conditions on reaction and its graphical description. Fuel 2010, 89, 3185–3192. [Google Scholar] [CrossRef]
  23. Luxan, M.P.; Madruga, F.; Saavedra, J. Rapid Evaluation of Pozzolanic Activity of Natural Products. Cem. Concr. Res. 1989, 19, 63–68. [Google Scholar] [CrossRef]
  24. Kosmidi, D.; Panagiotopoulou, C.; Angelopoulos, P.; Taxiarchou, M. Thermal Activation of Kaolin: Effect of Kaolin Mineralogy on the Activation Process. Mater. Proc. 2021, 5, 18. [Google Scholar] [CrossRef]
  25. Medri, V.; Papa, E.; Lizion, J.; Landi, E. Metakaolin-based geopolymer beads: Production methods and characterization. J. Clean. Prod. 2020, 244, 118844. [Google Scholar] [CrossRef]
  26. Nadia, N.F.J.; Gharzouni, A.; Nait-Ali, B.; Ouamara, L.; Ndassa, I.M.; Bebga, G.; Elie, K.; Rossignol, S. Comparative study of laterite and metakaolin/hematite-based geopolymers: Effect of iron source and alkalization. Appl. Clay Sci. 2023, 233, 106824. [Google Scholar] [CrossRef]
  27. Juengsuwattananon, K.; Winnefeld, F.; Chindaprasirt, P.; Pimraksa, K. Correlation between initial SiO2/Al2O3, Na2O/Al2O3, Na2O/SiO2, and H2O/Na2O ratios on phase and microstructure of reaction products of metakaolin-rice husk ash geopolymer. Constr. Build. Mater. 2019, 226, 406–417. [Google Scholar] [CrossRef]
  28. Taborda-Barraza, M.; Padilha, F.; Silvestro, L.; Azevedo, A.R.G.; Gleize, P.J.P. Evaluation of CNTs and SiC Whiskers Effect on the Rheology and Mechanical Performance of Metakaolin-Based Geopolymers. Materials 2022, 15, 6099. [Google Scholar] [CrossRef]
  29. Sposito, R.; Maier, M.; Beuntner, N.; Thienel, K.C. Evaluation of zeta potential of calcined clays and time-dependent flowability of blended cements with customized polycarboxylate-based superplasticizers. Constr. Build. Mater. 2021, 308, 125061. [Google Scholar] [CrossRef]
  30. Peng, L.; Chen, B. Mechanical behavior, durability, thermal performances and microstructure of GGBFS—Modified MPC solidified dredged sludge. Constr. Build. Mater. 2021, 303, 124557. [Google Scholar] [CrossRef]
  31. Zentar, R.; Wang, H.; Wang, D. Comparative study of stabilization/solidification of dredged sediments with ordinary Portland cement and calcium sulfo-aluminate cement in the framework of valorization in road construction material. Constr. Build. Mater. 2012, 279, 122447. [Google Scholar] [CrossRef]
  32. Korolev, V.A.; Nesterov, D.S. Regulation of clay particles charge for design of protective electrokinetic barriers. J. Hazard. Mater. 2018, 358, 165–170. [Google Scholar] [CrossRef] [PubMed]
  33. Yan, J.; Zhu, Z.; Liu, R.; Chen, M.; Shao, C.; Zhang, C.; Li, X. A multi-perspective study on the influence of physical and chemical properties of 5 types of fly ash on the performance of high-volume blended fly ash cementitious slurry. Constr. Build. Mater. 2024, 411, 134301. [Google Scholar] [CrossRef]
  34. Siline, M.; Mehsas, B. Effect of increasing the Blaine fineness of Metakaolin on its chemical reactivity. J. Build. Eng. 2022, 56, 104778. [Google Scholar] [CrossRef]
  35. Tole, I.; Delogu, F.; Qoku, E.; Habermehl-Cwirzen, K.; Cwirzen, A. Enhancement of the pozzolanic activity of natural clays by mechanochemical activation. Constr. Build. Mater. 2022, 352, 128739. [Google Scholar] [CrossRef]
  36. Zhang, Z.; Wang, H.; Provis, J.L.; Bullen, F.; Reid, A.; Zhu, Y. Quantitative kinetic and structural analysis of geopolymers. Part 1. The activation of metakaolin with sodium hydroxide. Thermochim. Acta. 2012, 539, 23–33. [Google Scholar] [CrossRef]
  37. Guggenheim, S.; Chang, Y.H.; Van Groos, A.F.K. Muscovite dehydroxylation: High-temperature studies. Am. Mineral. 1987, 72, 537–550. [Google Scholar]
  38. Chithiraputhiran, S.; Neithalath, N. Isothermal reaction kinetics and temperature dependence of alkali activation of slag, fly ash, and their blends. Constr. Build. Mater. 2013, 45, 233–242. [Google Scholar] [CrossRef]
  39. Wang, X.; Zhang, C.; Zhu, H.; Wu, Q. Reaction kinetics and mechanical properties of a mineral-micropowder/metakaolin-based geopolymer. Ceram. Int. 2022, 48, 14173–14181. [Google Scholar] [CrossRef]
  40. Khalifa, A.Z.; Cizer, Ö.; Pontikes, Y.; Heath, A.; Patureau, P.; Bernal, S.A.; Marsh, A.T.M. Advances in alkali-activation of clay minerals. Cem. Concr. Res. 2020, 132, 106050. [Google Scholar] [CrossRef]
  41. Chen, X.; Niu, Z.; Wang, J.; Zhu, G.R.; Zhou, M. Effect of sodium polyacrylate on mechanical properties and microstructure of metakaolin-based geopolymer with different SiO2/Al2O3 ratio. Ceram. Int. 2018, 44, 18173–18180. [Google Scholar] [CrossRef]
  42. Kaze, C.R.; Jiofack, S.B.K.; Cengiz, Ö.; Alomayri, T.S.; Adesina, A.; Rahier, H. Reactivity and mechanical performance of geopolymer binders from metakaolin/meta-halloysite blends. Constr. Build. Mater. 2022, 336, 15–19. [Google Scholar] [CrossRef]
  43. Luo, Y.; Jiang, Z.; Wang, D.; Lv, Y.; Gao, C.; Xue, G. Effects of alkaline activators on pore structure and mechanical properties of ultrafine metakaolin geopolymers cured at room temperature. Constr. Build. Mater. 2022, 361, 129678. [Google Scholar] [CrossRef]
  44. Villaquirán-Caicedo, M.A.; de Gutiérrez, R.M.; Sulekar, S.; Davis, C.; Nino, J.C. Thermal properties of novel binary geopolymers based on metakaolin and alternative silica sources. Appl. Clay Sci. 2015, 118, 276–282. [Google Scholar] [CrossRef]
  45. Lemougna, P.N.; Adediran, A.; Yliniemi, J.; Ismailov, A.; Levanen, E.; Tanskanen, P.; Kinnunen, P.; Roning, J.; Illikainen, M. Thermal stability of one-part metakaolin geopolymer composites containing a high volume of spodumene tailings and glass wool. Cem. Concr. Compos. 2020, 114, 103792. [Google Scholar] [CrossRef]
  46. Provis, J.L.; Harrex, R.M.; Bernal, S.A.; Duxson, P.; Van Deventer, J.S.J. Dilatometry of geopolymers as a means of selecting desirable fly ash sources. J. Non. Cryst. Solids. 2012, 358, 1930–1937. [Google Scholar] [CrossRef]
  47. Selmani, S.; Essaidi, N.; Gouny, F.; Bouaziz, S.; Joussein, E.; Driss, A.; Sdiri, A.; Rossignol, S. Physical-chemical characterization of Tunisian clays for the synthesis of geopolymers materials. J. Afr. Earth Sci. 2015, 103, 113–120. [Google Scholar] [CrossRef]
  48. Muracchioli, M.; Menardi, G.; D’Agostini, M.; Franchin, G.; Colombo, P. Modeling the compressive strength of metakaolin-based geopolymers based on the statistical analysis of experimental data. Appl. Clay Sci. 2023, 242, 107020. [Google Scholar] [CrossRef]
  49. Ghanbari, M.; Hadian, A.M.; Nourbakhsh, A.A.; MacKenzie, K.J.D. Modeling and optimization of compressive strength and bulk density of metakaolin-based geopolymer using central composite design: A numerical and experimental study. Ceram. Int. 2017, 43, 324–335. [Google Scholar] [CrossRef]
Figure 1. (a) XRD patterns and (b) FTIR spectra of MK samples.
Minerals 14 00974 g001
Figure 2. Physical aspect of precursors: (a) MK1, (b) MK2, (c) MK3, (d) MK4, (e) particle size distribution of MK samples.
Minerals 14 00974 g002
Figure 3. (a) Zeta potential and (b) electric Conductivity of MK samples at different pH.
Minerals 14 00974 g003
Figure 4. Pozzolanic index for materials.
Minerals 14 00974 g004
Figure 5. (a) Heat flow for each MK-activated system, (b) total heat cumulative for each MK-activated system.
Minerals 14 00974 g005
Figure 6. Behavior of energy activation on MK-activated systems.
Minerals 14 00974 g006
Figure 7. Values for compressive strength of MK-activated systems.
Minerals 14 00974 g007
Figure 8. Dilatometry curves of each MK-activated system. (a) Based on dimensional changes, (b) based on dimensional variation-temperature ratio.
Minerals 14 00974 g008
Figure 9. Surface response of Fck: (a) Fck as the response of amorphism vs. SiO2/Al2O3 interaction, (b) Fck as the response of pozzolanic index vs. SiO2/Al2O3 interaction.
Minerals 14 00974 g009
Table 1. Principal oxides on four MK types.
SiO2Al2O3Fe2O3TiO2K2OCaOOthersBlaine (m2/kg)
MK153.7342.200.570.112.150.111.132039.94
MK263.9330.941.531.560.540.141.36701.68
MK365.3228.952.152.100.310.091.08801.39
MK451.2838.277.181.631.040.100.501118.20
Table 2. Molar ratios for activated systems.
Molar RatioMK1MK2MK3MK4
Na2O/SiO20.180.160.160.18
SiO2/Al2O33.285.045.463.51
H2O/Na2O18.0318.0318.0318.03
Na2O/Al2O30.580.790.850.64
Table 3. Apparent activation energy for MK-activated systems.
Average EA (kJ/mol)MK1MK2MK3MK4
19.9822.2719.7019.32
Table 4. Summary of values used for the regression model.
SampleSiO2/Al2O3Specific Area (m2/kg)%P. IndexApparent Activation Energy (kJ/mol)Amorphism (Points)Fck (MPa)Aver. Fck 28 Days
MK13.282104.1115.5719.988.94831.6830.69
MK13.282013.4214.1019.989.14332.05
MK13.282002.3016.1419.988.54528.35
MK25.04692.5010.3322.270.91525.1523.75
MK25.04711.3910.8222.271.06824.05
MK25.04701.1410.5122.270.89522.05
MK35.46812.9020.2319.701.33928.2528.53
MK35.46810.2720.1519.701.32029.35
MK35.46781.0120.3519.701.34827.99
MK43.511120.2122.4219.3221.65836.7538.20
MK43.511118.4122.4619.3221.16740.11
MK43.511116.1122.3019.3221.93237.73
Disclaimer/Publisher’s Note: The statements, opinions and data contained in all publications are solely those of the individual author(s) and contributor(s) and not of MDPI and/or the editor(s). MDPI and/or the editor(s) disclaim responsibility for any injury to people or property resulting from any ideas, methods, instructions or products referred to in the content.

