Article

Peak Height Comparison K-Ar Method Applied to Zao Volcano Bomb Samples Younger than ca. 35 ka

by
Mirai Takebe
1,
Keiko Sato
2,3,
Hidenori Kumagai
3,4,
Naoyoshi Iwata
1 and
Masao Ban
1,*
1
Department of Science, Faculty of Science, Yamagata University, 1-4-12, Kojirakawa-machi, Yamagata 990-8560, Japan
2
Department of Career and Liberal Arts, Sakura no Seibo Junior College, 3-6, Hanazono-machi, Fukushima 960-8585, Japan
3
Submarine Resources Research Center, Research Institute for Marine Resources Utilization, Japan Agency for Marine-Earth Science and Technology (JAMSTEC), 2-15, Natsushima-cho, Yokosuka 237-0061, Japan
4
Department of Intercultural Communication, Faculty of Intercultural Studies, Gakushuin Women’s College, 3-20-1, Toyama, Shinjuku-ku, Tokyo 162-8650, Japan
*
Author to whom correspondence should be addressed.
Minerals 2024, 14(10), 979; https://doi.org/10.3390/min14100979 (registering DOI)
Submission received: 23 August 2024 / Revised: 20 September 2024 / Accepted: 26 September 2024 / Published: 28 September 2024

Abstract

:
The peak height comparison K-Ar dating method was applied to very young (younger than ca. 35 ka) vesiculated bombs from three pyroclastic units (Komakusadaira Pyroclastics, Kattadake Pyroclastics, and Umanose Agglutinate) from Zao Volcano in northeast Japan. Because the 38Ar/36Ar ratios differed from 0.187, the mass fractionation was corrected for all measurement data. The obtained K-Ar ages are 30.0 ± 32.2 ka (no. 1-1, weakly vesiculated), 37.4 ± 64.8 ka, and 33.0 ± 58.0 ka (nos. 2-1, 2-2, weakly vesiculated) for the samples from Komakusadaira Pyroclastics; 12.6 ± 46.7 ka (no. 3-1, highly vesiculated) for a sample from Kattadake Pyroclastics; and 5.3 ± 44.9 ka, 5.7 ± 14.3 ka (no. 4-1, 4-2, weakly vesiculated), and 17.3 ± 79.3 ka (no. 5-1, moderately vesiculated) for the samples from Umanose Agglutinate on a 1σ error basis. For all cases, the obtained ages’ errors exceed 100%, with none involved within the error range. Therefore, the following age value upper limits are considered statistically significant: no. 1-1 is ≤94.4 ka, 2-1 is ≤167.0 ka, 2-2 is ≤149.0 ka, 3-1 is ≤106.0 ka, 4-1 is ≤95.1 ka, 4-2 is ≤34.3 ka, and 5-1 is ≤175.9 ka, considering 2σ errors. The obtained ages are generally consistent with those previously estimated using 14C dating.

1. Introduction

The peak height comparison K-Ar method has seen advancements over time, and careful analyses have been performed to determine the ages of young eruption products from several volcanoes (e.g., Hawaii, [1]; Ontake, [2]; Aso, [3]; and [4]). However, not many studies have been carried out in this area. To apply the peak height comparison K-Ar method to very young volcanic rocks, the blank value must be kept low and the mass spectrometer stable.
In this study, samples whose ages were estimated to be younger than c. 35 ka were dated using the peak height comparison K-Ar method. Samples were collected from the youngest stage (younger than ca. 35 ka) of proximal products from Zao Volcano, northeast Japan. Ages of the products were estimated based on those of the correlating tephra layers [5]; these were determined by 14C dating the intercalating paleosol or included wood samples [5,6,7,8] and can therefore serve as good examples for investigating the applicability of the peak height comparison K-Ar method to very young eruption products. While lava samples have been used in previous studies (e.g., [1,2,3,4]) applying this method, vesicular volcanic bombs were used in this study. This manuscript presents the dating results of bomb samples from Zao from the youngest stage and discusses the applicability of the method by comparing with previously determined ages based on 14C dating.

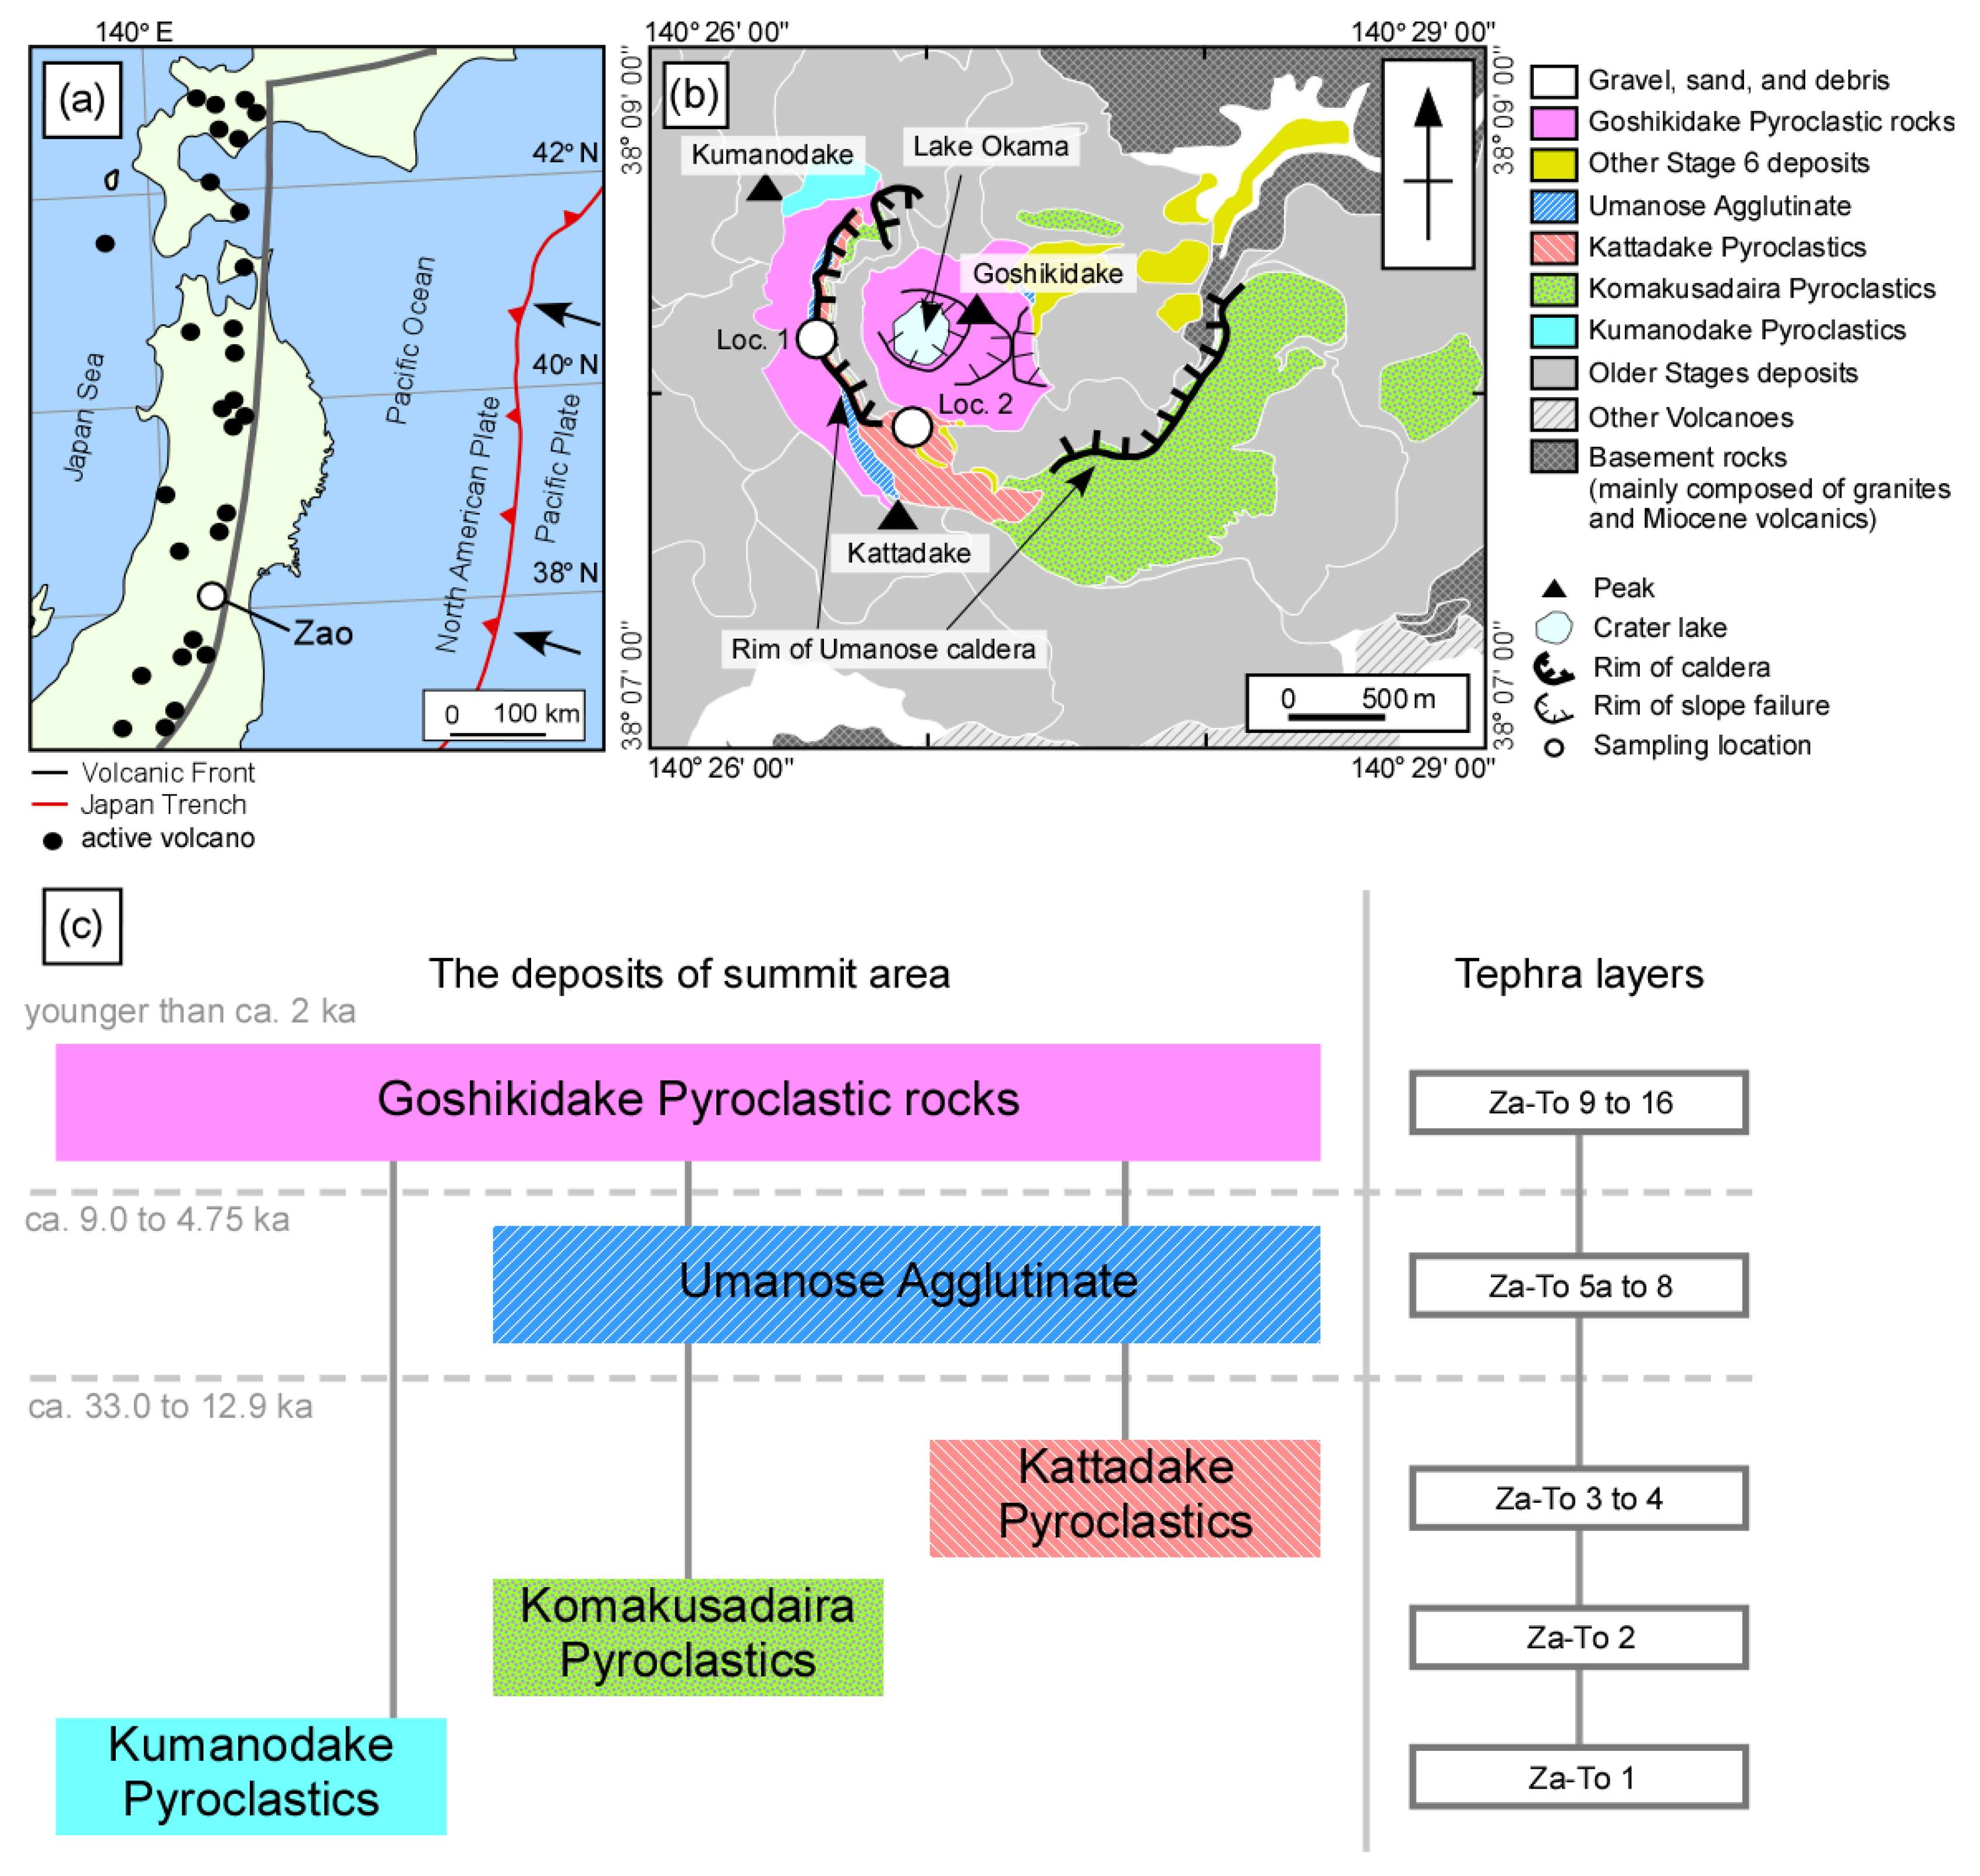
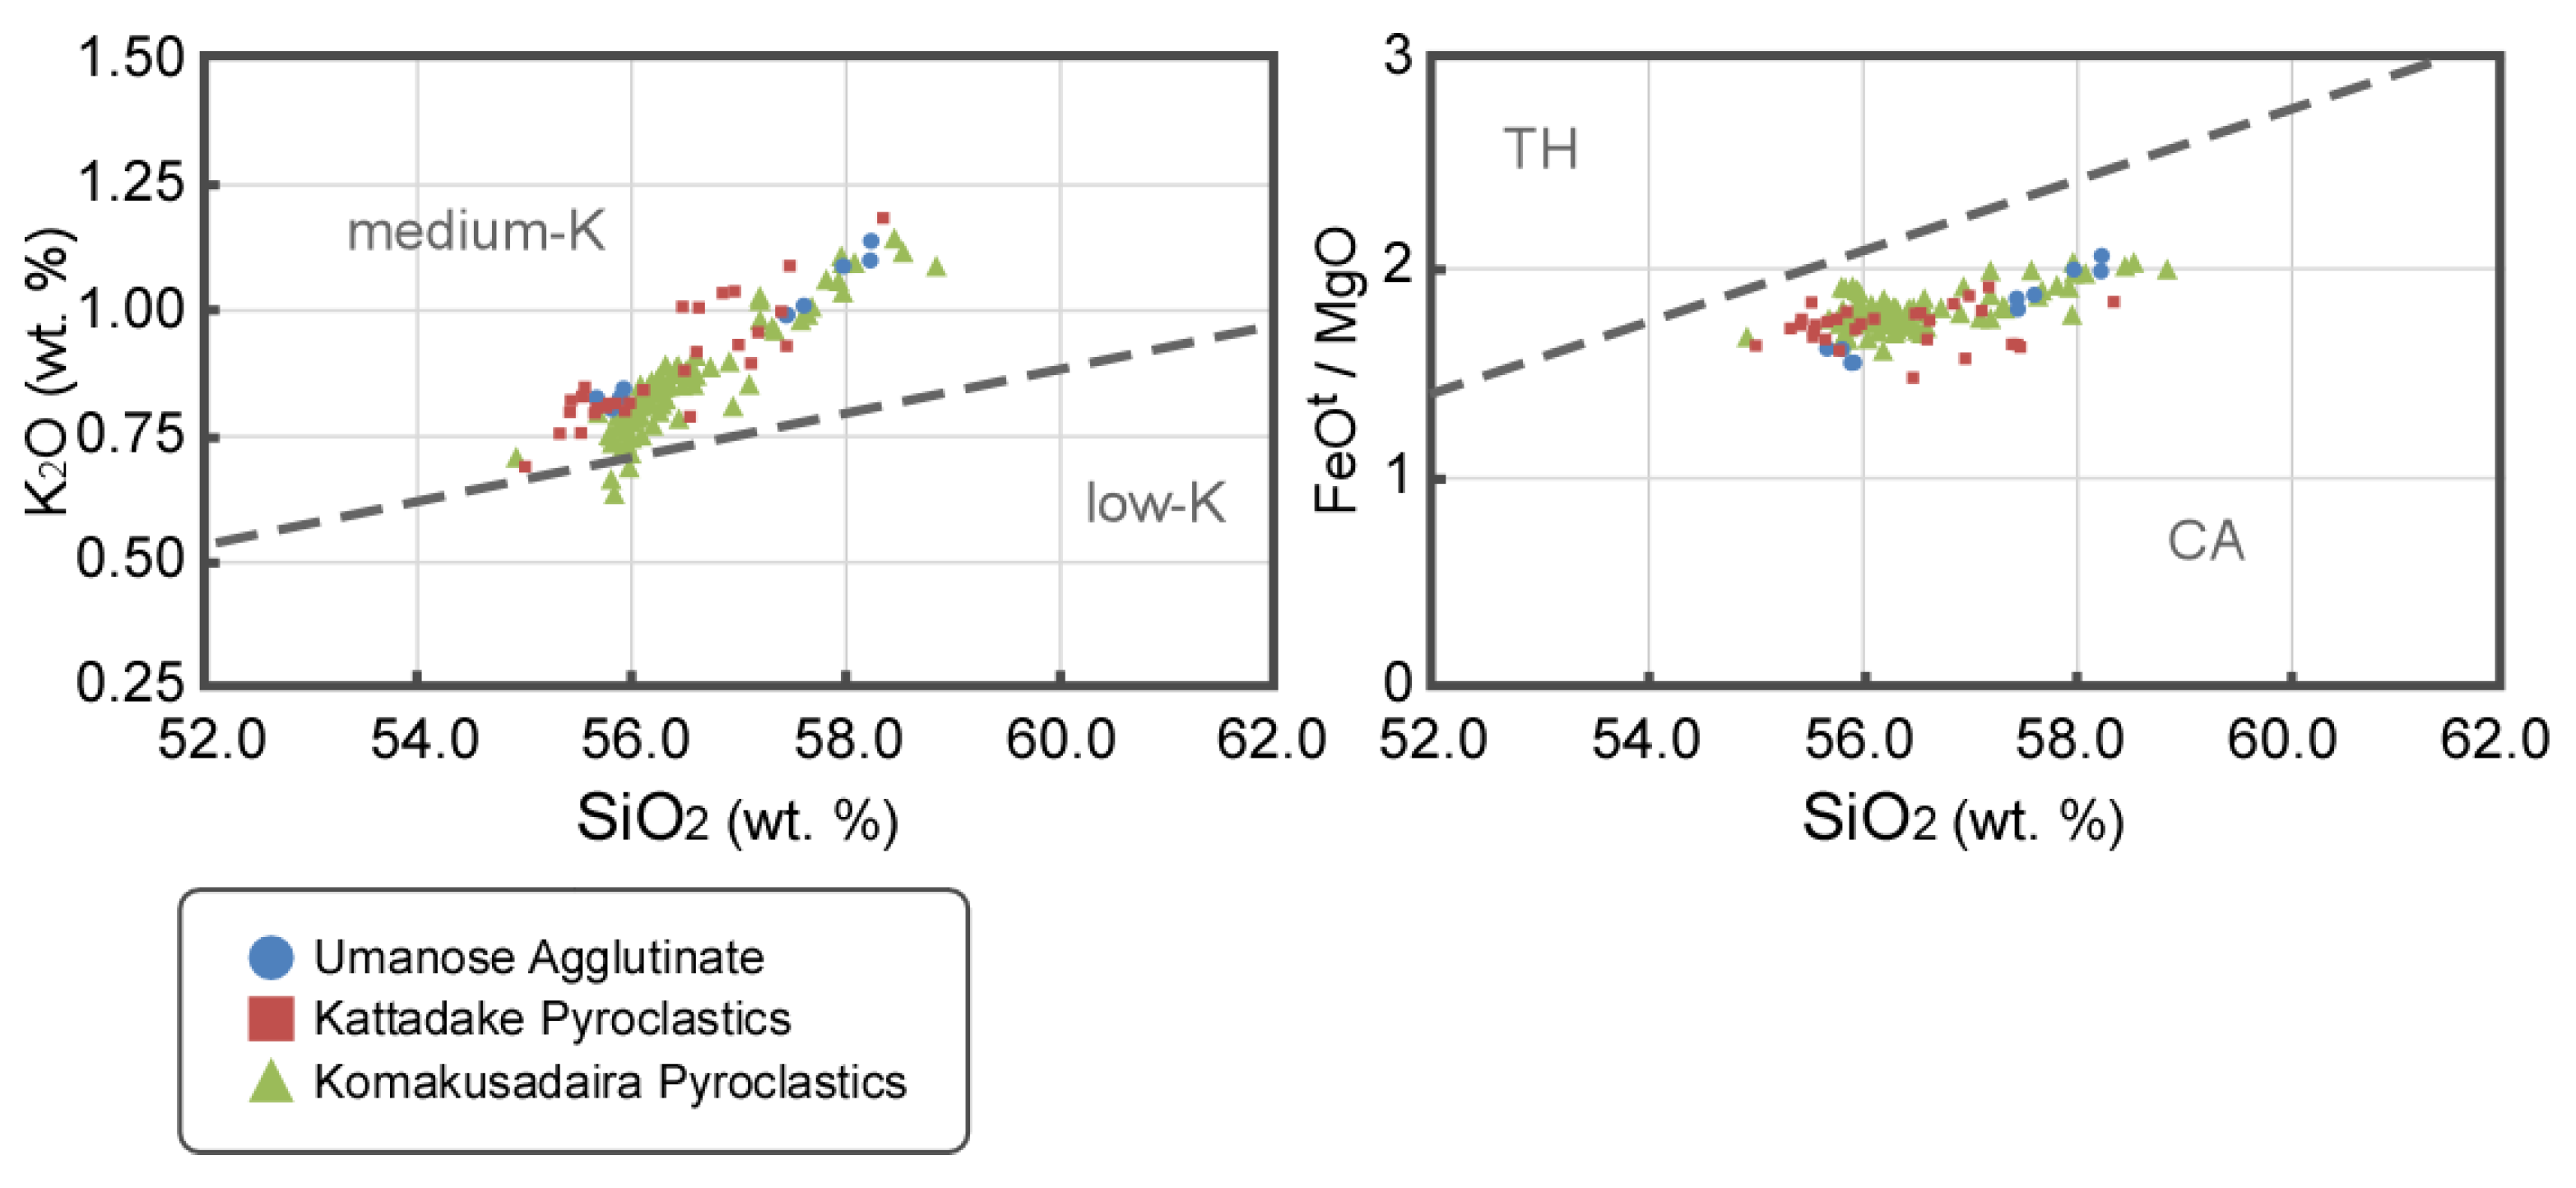
2. Geologic and Petrologic Outline of the Youngest Activity of Zao Volcano

Zao Volcano is one of the most representative active stratovolcanoes of the volcanic front in northeast Japan (Figure 1a). Many geologic and petrologic studies have been carried out [5,9,10,11,12,13]. According to the authors of [5], who conducted the most recent study on Zao Volcano, its activity is divided into six stages (1 to 6). The youngest activity (stage 6) began at ca. 35 ka with the formation of the horseshoe-shaped Umanose caldera (~1.7 km in diameter) at the summit area, which is still present. The pyroclastic products of stage 6 were divided into the following five units [5]: Kumanodake Pyroclastics, Komakusadaira Pyroclastics, Kattadake Pyroclastics, Umanose Agglutinate, and Goshikidake Pyroclastic rocks (Figure 1b,c). Kumanodake Pyroclastics are distributed in the summit area of Mt. Kumanodake. Komakusadaira Pyroclastics are distributed along the outside of the caldera rim, and the others are mainly distributed in the inner area of the caldera (Figure 1b). Kumanodake Pyroclastics show alternated agglomerates, volcanic breccia, and lapilli tuff layers [11]. Komakusadaira Pyroclastics are the largest volume unit of the youngest activity stage, consisting of twenty-seven pyroclastic layers showing alternated agglutinates, agglomerates, scoriaceous tuff, lapilli tuff, volcanic breccia, and tuff breccia layers. The pyroclastics are grouped into seven eruptive units (products of episodes 1 to 7 from the bottom to the top) and are delineated according to evidence of a time break in the form of secondary sediment deposition (loam) or the presence of erosional surfaces [12]. Kattadake Pyroclastics are divided into lower and upper parts, both parts showing alternated agglutinates, agglomerates, scoriaceous tuff, volcanic breccia, and tuff breccia. Eighteen pyroclastic beds were identified by main facies changes or secondary sediment intercalation (loam) [13]. It is noted that there would be a long time gap between formations of lower and upper parts. Most of the products of the lower part were altered and it is difficult to find samples without alterations; those of the upper part, however, were not altered [13]. Umanose Agglutinate is composed of agglutinate, agglomerate, and scoriaceous tuff [5]. Goshikidake Pyroclastic rocks are composed of scoriaceous tuff, volcanic breccia, and tuff breccia layers [5].
The tephra layers, which are mainly composed of scoriaceous ash, are widely distributed in the eastern middle to the foot regions of Zao Volcano. These layers were divided into 16 layers (Za-To 1 to Za-To 16 from the bottom to the top) [5]. Za-To 5 tephra was sub-divided into six layers (Za-To 5e to Za-To 5a and Za-To 5 from the bottom to the top). The relationships between the summit area pyroclastic units and these tephra layers are as follows [5]: Kumanodake Pyroclastics, Komakusadaira Pyroclastics, and Kattadake Pyroclastics were correlated with Za-To 1 to 4; Umanose Agglutinate with Za-To 5a to 8; and Goshikidake Pyroclastic rocks with Za-To 9 to 16. Recently, the authors of [14] compared the petrologic features between Komakusadaira Pyroclastics and Za-To 2, concluding that they are correlated. Therefore, Kumanodake and Kattadake Pyroclastics would correlate with Za-To 1 and Za-To 3 and/or 4, respectively (Figure 1c). The lower and upper parts of Kattadake Pyroclastics would correlate with Za-To 3 and 4, because, as described previously, a long age gap supposedly exists between lower and upper parts.
Based on the 14C data of the intercalated paleosol and included wood samples, the ages of the tephra layers are as follows: Za-To 1, ca. 33 ka; Za-To 2, ca. 31 ka; Za-To 3, ca. 27 ka; Za-To 4, ca. 12.9 ka; Za-To 5e to 5, ca. 9 to 5.8 ka; Za-To 6, ca. 5.6 ka; Za-To 7, 5.05 ka; Za-To 8, ca. 4.75 ka; and Za-To 9 to 16, younger than ca. 2 ka [5,7,8].
Based on previous studies [11,12,13,15,16,17], the petrologic features of the stage 6 pyroclastic rocks are summarized below. The rocks are porphyritic olivine ± two pyroxene basaltic andesite to andesite (54.9–59.0% SiO2), which belong to a medium-K calc-alkaline series. K2O and FeOt/MgO-SiO2 diagrams of Umanose Agglutinate, Kattadake Pyroclastics, and Komakusadaira Pyroclastics are presented in Figure 2. The phenocryst volumes are 17–39 vol.%, consisting of plagioclase (11–29 vol.%), orthopyroxene (2–10 vol.%), clinopyroxene (0.25–5 vol.%), olivine (0–4 vol.%), and rare magnetite. The groundmass is composed of plagioclase, pyroxene, magnetite, and interstitial glass with bubbles (<0.1–38.4 vol.%). Plagioclase phenocryst cores usually show compositional oscillatory zoning and/or a patchy texture. Dusty zones containing abundant circular to irregularly shaped melt inclusions [18] are sometimes observed near the rim. Pyroxene phenocrysts sometimes show compositionally reverse zoning near the rim, whereas olivine phenocrysts usually show compositionally normal zoning here. All the rocks were formed mainly by the mixing of two compositionally distinct magmas in the magma chamber [11,12,13,15,16,17].

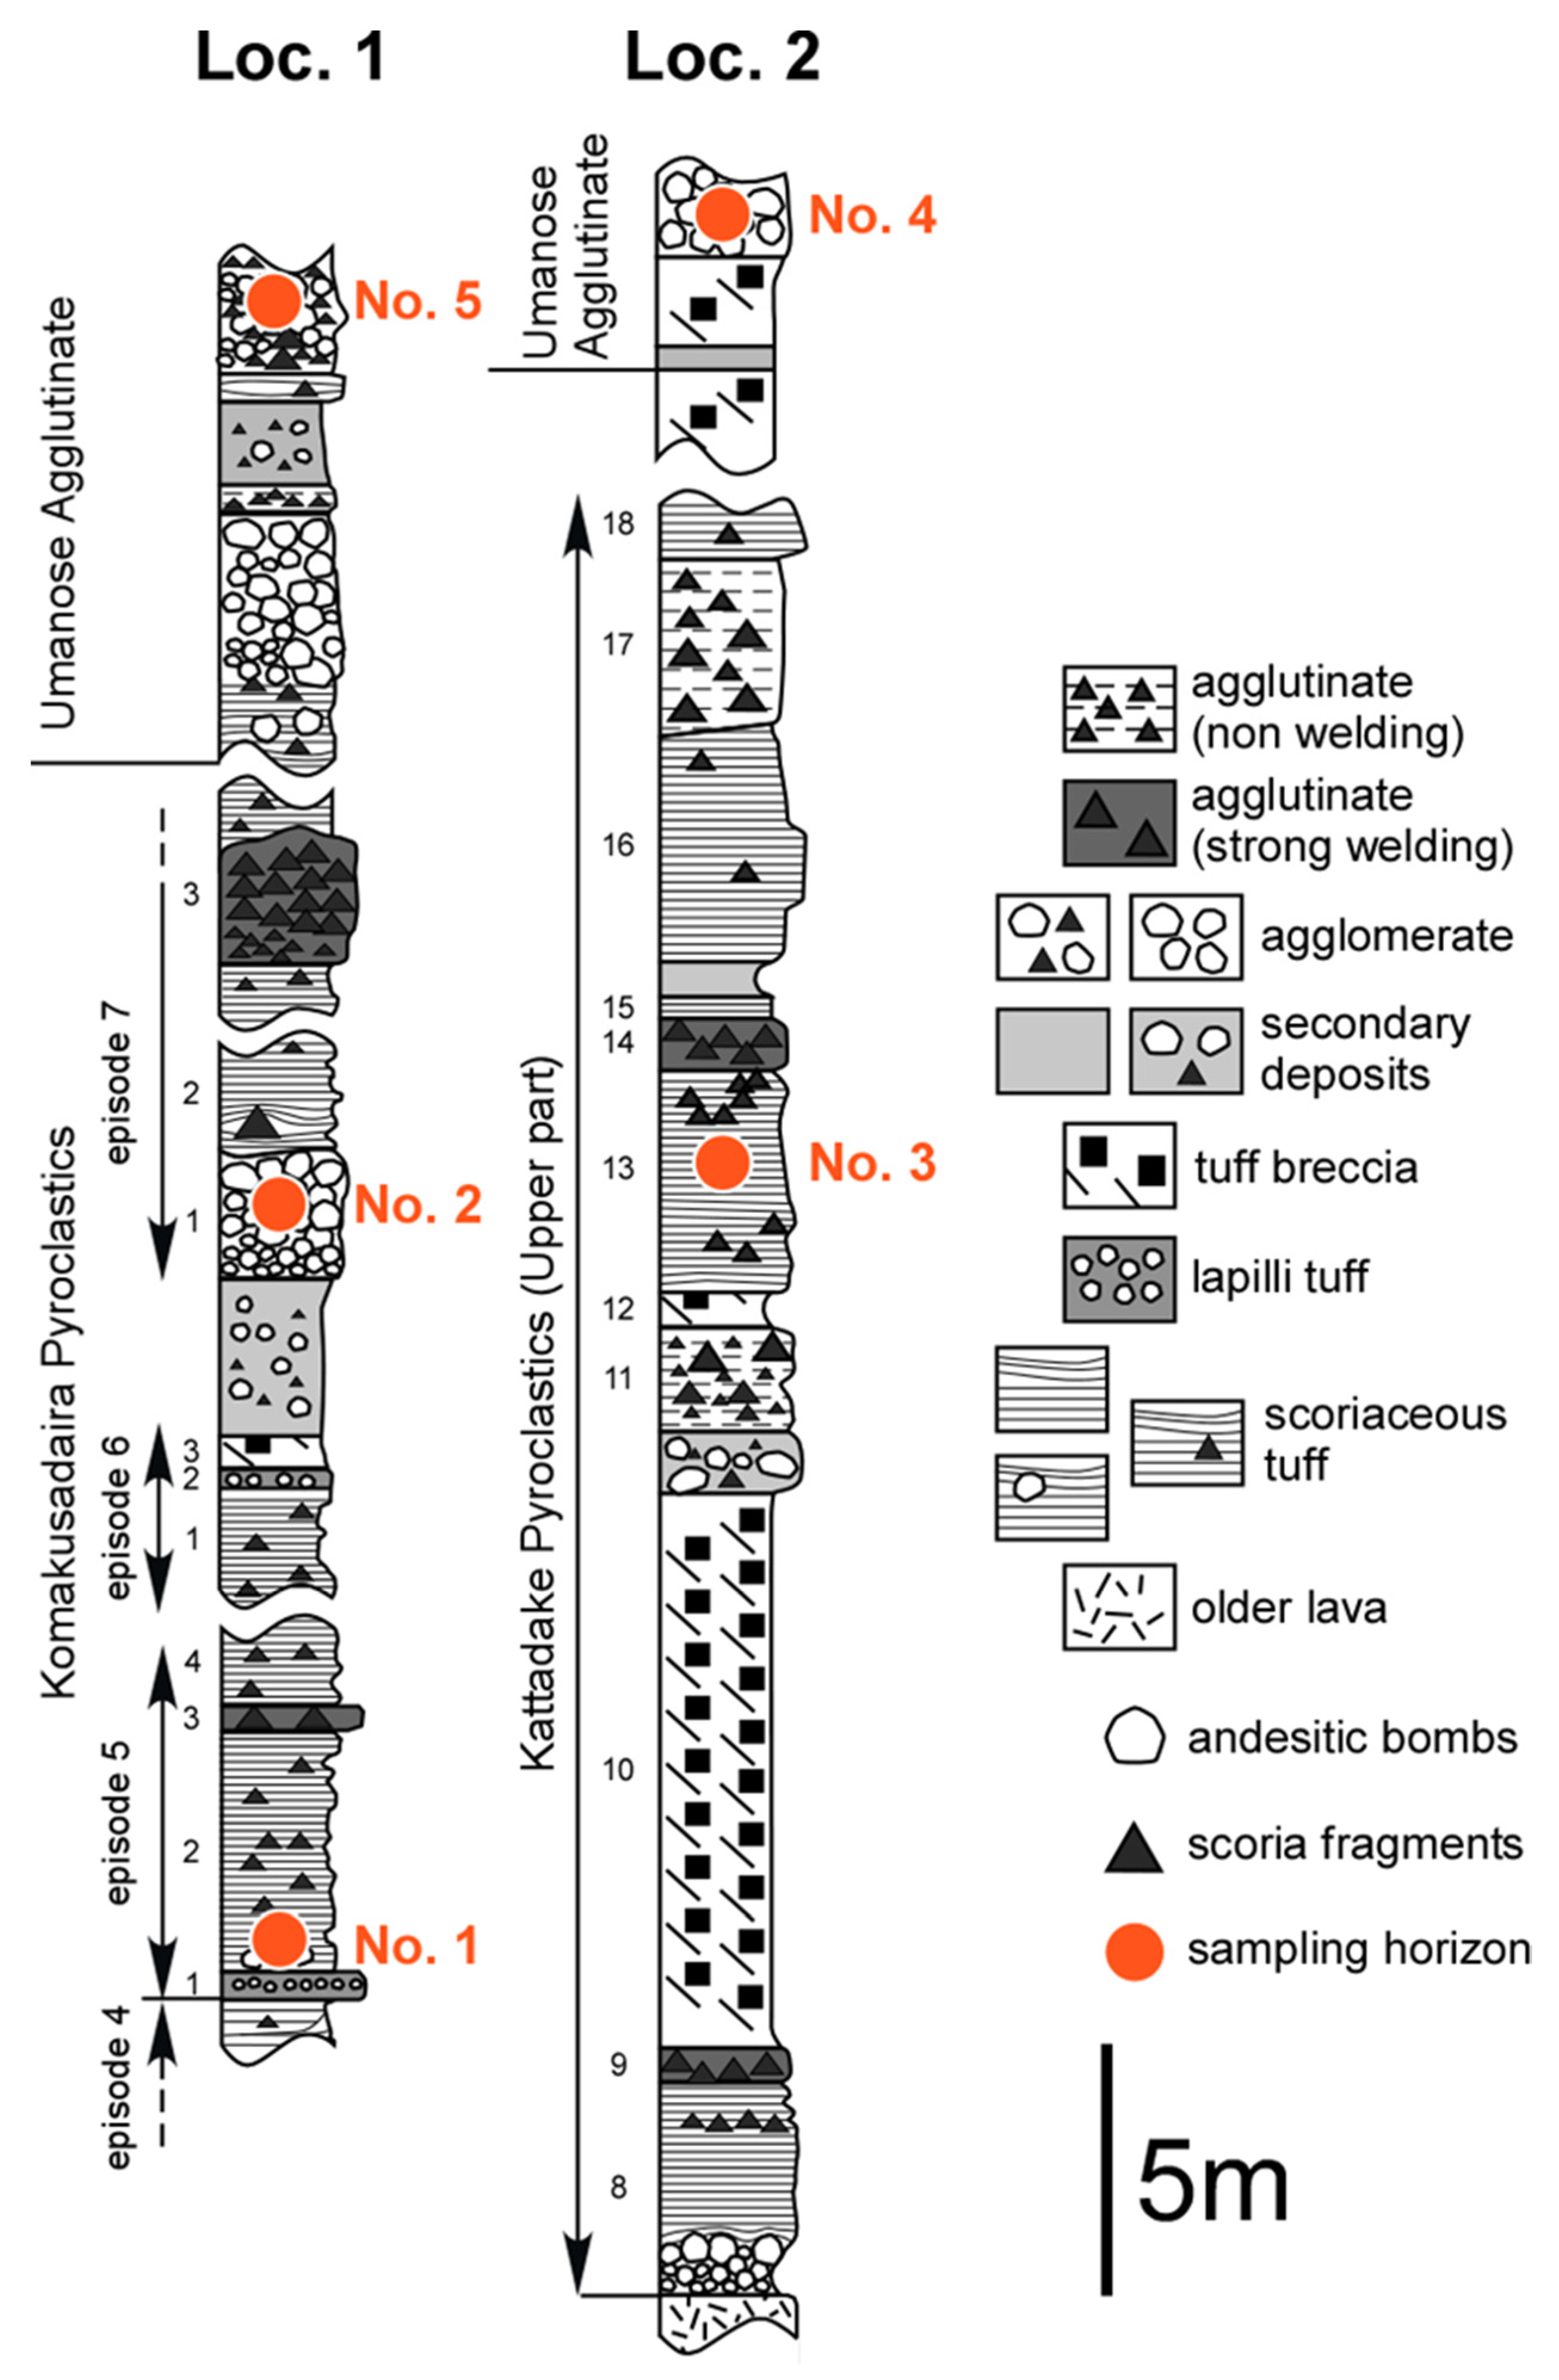
3. Sample Descriptions

Five samples were collected for K-Ar dating. The sampled formations, locations, and petrologic characters are summarized in Table 1. The columnar sections showing the sampling horizon of these five samples, and photographs of the deposits from which the samples were collected, are shown in Figure 3 and Figure 4, respectively.
Two samples were from Komakusadaira Pyroclastics (no. 1 from episode 5 and no. 2 from episode 7) (Figure 4a,b), one was from Kattadake Pyroclastics (no. 3 from the upper part) (Figure 4c), and two were from Umanose Agglutinate (no. 4 and no. 5 from the deposits correlating to Za-To 6 and Za-To 7, respectively) (Figure 4d,e).
Photographs of the hand specimens and photomicroscope images of the samples are shown in Figure 5 and Figure 6. All samples are dark gray to black colored bombs (Figure 5a–e) that are weakly to highly vesiculated. The original lengths of the bomb samples are ca. 10 to 30 cm in diameter. Sample no. 1 is ol-cpx-opx andesite, no. 2 is ol-cpx-opx basaltic andesite, no. 3 is cpx-opx basaltic andesite, no. 4 is cpx-opx andesite, and no. 5 is cpx-opx andesite.

4. Materials and Methods

The samples were analyzed at the JAMSTEC (Japan Agency for Marine-Earth Science and Technology) but prepared at Yamagata University. The analytical method, a summary of which can be found below, followed that of the studies in [23,24].
Samples were crushed and sieved to a 60–80 mesh size. The phenocrysts were removed from the samples as much as possible using a magnetic separator and picking by hand in the sample preparation room at Yamagata University. The resultant groundmass concentrates were used for Ar isotopes and potassium concentration measurements.
Argon isotopic measurements were performed using the peak height comparison method [2,25], using a GVI-5400He mass spectrometer connected to the extraction and purification lines. Groundmass concentrates of about 0.15 to 0.30 g wrapped in aluminum foil were introduced to the gas extraction and purification system. The samples were melted in a molybdenum crucible at 1600 °C and the extract gasses were purified with three Ti-Zr getters at ~800 °C and two SAES getters (purification line and mass spectrometer inlet) at room temperature. After the second Ti-Zr gettering, the Ar fraction was trapped in a cold finger. After 15 min, the Ar gas fraction was extended using the purification line and activated carbon with the next Ti-Zr getter and Sorb-Ac pump. After 15 min, the purified Ar fraction was introduced into the GVI-5400He mass spectrometer and analysis was started. Standard atmosphere and SORI 93 standard [26,27] were used as the reference samples. Hot blank was repeatedly analyzed during the analysis of each unknown sample.
The potassium concentrations of the groundmass samples were measured using a Hitachi Z-5010 atomic absorption spectrophotometer. Reagents (HF, HClO4, and HCl) from the UP grade series from Kanto Chemical were used. About 0.1 g of the groundmass concentrates was dissolved in a HF and HClO4 solution. After drying, the concentrate was re-dissolved in HCl. The sample solution dilution rate was determined using a weighing method. The analytical error for potassium measurement is 1%, as determined by the standard deviation of replicate analyses of standards JB-3 and JA-2 (GSJ standard, [28]).
K-Ar ages were calculated using the isotopic ratio and decay constants for 40K recommended by the IUGS Subcommission on Geochronology [29] (40K/K = 1.167 × 10⁻⁴, λe = 0.581 × 10⁻¹⁰ year−1, λβ = 4.962 × 10⁻¹⁰ year−1). The Ar isotope ratios of the samples nos. 2 and 4 were measured twice. The K-Ar ages of the standard YZ1.7 [25] were measured using the same method as the samples.

5. Results

The data obtained from K-Ar analyses and the 40Ar/36Ar versus 38Ar/36Ar diagram are presented in Table 2 and Figure 7, respectively.
The 38Ar/36Ar ratios of all analyses differ from 0.187; therefore, the initial 40Ar/36Ar ratios of the trapped argon component in the sample were calculated using the 38Ar/36Ar ratios and mass fractionation correction [2,30]. Komakusadaira Pyroclastic samples show heavier isotope (38Ar) enrichment mass fractionation, whereas that of Kattadake Pyroclastic samples (36Ar) is lighter. Umanose Agglutinate samples show slightly lighter isotope enrichment.
In general, when very young samples are analyzed by K-Ar dating, the analytical uncertainty tends to become large [1,2,4,31]. Furthermore, once mass fractionation correction is applied, uncertainties increase (e.g., [4,25]). This applies to this study, but the median values are consistent with the previously estimated pyroclastic sample ages, except for one sample that was dated to 17.3 ka. The median K-Ar ages range from 30.0 to 37.4 ka for samples from Komakusadaira Pyroclastics, from 12.6 ka for the sample from Kattadake Pyroclastics, and from 5.3 to 17.3 ka for samples from Umanose Agglutinate. In terms of the duplicated measured samples, the obtained ages are similar, at 37.4 ± 64.8 and 33.0 ± 58.0 ka for sample no. 2 and 5.3 ± 44.9 and 5.7 ± 14.3 ka for sample no. 4.
Figure 7. The 40Ar/36Ar versus 38Ar/36Ar diagram of the analyzed samples. 1σ uncertainties are shown. The star symbol is air reference value (40Ar/36Ar = 295.5 [29] and 38Ar/36Ar = 0.1869 [32]). The pink line is the mass fractionation line of the atmospheric argon [33].
Minerals 14 00979 g007

6. Discussion

All obtained ages have errors exceeding 100%, while none (zero) is involved within the error range for all the cases. Therefore, the upper limits of the age values are considered statistically significant. Consequently, the eruption ages for the samples are as follows: sample 5-1 is less than 175.9 ka, 4-1 is less than 95.1 ka, 4-2 is less than 34.3 ka, 3-1 is less than 106.0 ka, 2-1 is less than 167.0 ka, 2-2 is less than 149.0 ka, and 1-1 is less than 94.4 ka, considering 2σ errors. The obtained ages are consistent with those previously estimated based on 14C dating (Figure 8).
According to the authors of [34], the amounts of 40Ar in samples equilibrated with the atmospheric pressure were expected to be 8.8 × 10⁻⁷ cc/g for andesitic melt, 9.7 × 10⁻⁸ cc/g for plagioclase, and 3.8 × 10⁻⁸ cc/g for pyroxene. These values can be converted to 36Ar amounting to 3.0 × 10⁻⁹ cc/g, 3.3 × 10⁻¹⁰ cc/g, and 1.3 × 10⁻¹⁰ cc/g. The samples of this study are andesite groundmass concentrates with plagioclase, pyroxene, and glass as the main phases; therefore, the 36Ar should be between 1.3 × 10⁻¹⁰ cc/g and 3.0 × 10⁻⁹ cc/g if the samples were solidified in equilibrium with the atmospheric pressure. The errors in the obtained amount of 36Ar exceed 100%; none (zero) is within the error range for all cases. Therefore, 36Ar amounts for the samples are less than 6.78, 6.82, 1.10, 4.31, 1.86, 1.56, and 1.28 × 10⁻⁹ cc/g for measurement no. 5-1, 4-1, 4-2, 3-1, 2-1, 2-2, and 1-1, respectively. All of these values include or overlap the range from 1.3 × 10⁻¹⁰ cc/g to 3.0 × 10⁻⁹ cc/g. Ultimately, it is not possible to judge all the samples were not in disequilibrium with the atmosphere during solidification at atmospheric pressure.
As mentioned in the Results section, the 38Ar/36Ar ratios of all analyses differ from 0.187. In particular, the ratios of measurement 3-1 (0.1850 ± 0.0006) and no. 1-1 (0.1878 ± 0.0007) do not include 0.187 in their error ranges; the former is lower and the latter is higher.
Light Ar isotope enrichment has been reported in several volcanoes, including Ontake Volcano [2], historical lavas in Hawaii [35], Bratan Volcano in Indonesia [36], and the Aso Volcano [3,4]. The authors of [36] attributed this mass fractionation from atmospheric argon not to the degassing processes at the surface but to the processes in much deeper parts, including shallow reservoirs. This is because, although the 36Ar concentrations are varied, the 38Ar/36Ar ratios of post-caldera-stage lavas of the Aso Volcano are atmospheric [37,38]. To explain the light Ar isotope enrichment, the authors of [36] referred to the effects of groundwater on magma proposed by the study in [39]. They considered the magma’s interaction with the atmospheric argon transported through underground water or seawater deep in the reservoir. The lower 38Ar/36Ar ratio of sample no. 3 in this study could be explained by this process, but it is worth noting that Zao Volcano is far from the sea and therefore seawater is likely not involved.
The heavy Ar isotope enrichment observed in sample no.1 has not been mentioned in previous studies on young volcanic products. If the Ar mass fractionation occurs during degassing in magma reservoirs, the residual melt enriches heavy Ar isotope. However, no evidence of degassing in the magma reservoir for Komakusadaira Pyroclastics has been detected. Further studies are necessary in order to investigate the processes that cause heavy Ar enrichment.

7. Conclusions

  • The peak height comparison K-Ar method was applied on very young (younger than ca. 35 ka) bomb samples from Zao Volcano in order to verify the applicability of this method in such vesiculated cases.
  • The errors in all the obtained ages exceed 100%, while none (zero) is involved within error range for all cases. However, the obtained data are able to constrain the upper age limits. A detailed comparison between the ages obtained in this study and those previously estimated based on 14C dating was not possible.
  • The 38Ar/36Ar ratio below 0.187 obtained from Kattadake Pyroclastic samples could be attributed to the magma’s interaction with the atmospheric argon transported to the reservoir via underground water. The 38Ar/36Ar ratio exceeding 0.187 obtained from the sample from Komakusadaira Pyroclastics is unusual for young volcanic rocks.

Author Contributions

Conceptualization, M.T., K.S., H.K., N.I. and M.B.; methodology, K.S., H.K. and N.I.; software, M.T. and K.S.; validation, M.T., K.S. and M.B.; formal analysis, M.T., K.S. and M.B.; investigation, M.T., K.S. and M.B.; resources, M.T. and M.B.; data curation, M.T.; writing—original draft preparation, M.T. and M.B.; writing—review and editing, M.T., K.S., H.K., N.I. and M.B.; visualization, M.T.; supervision, M.B.; project administration, M.B.; funding acquisition, K.S. All authors have read and agreed to the published version of the manuscript.

Funding

This study was supported by the funds from the JSPS of Japan (No. 16K01322).

Data Availability Statement

All data presented in this study are included in this article.

Acknowledgments

We highly appreciate the constructive reviews of anonymous reviewers. We are also grateful to Miyagi and Yamagata Prefecture Governments to have given us special permissions to collect samples in the protected area of Zao Volcano.

Conflicts of Interest

The authors declare that they have no known competing financial interests or personal relationships that could have appeared to influence the work reported in this manuscript.

References

  1. Guillou, H.; Turpin, L.; Garnier, F.; Charbit, S.; Thomas, D.M. Unspiked K–Ar dating of Pleistocene tholeiitic basalts from the deep core SOH-4, Kilauea, Hawaii. Chem. Geol. 1997, 140, 81–88. [Google Scholar] [CrossRef]
  2. Matsumoto, A.; Kobayashi, T. K-Ar age determination of late Quaternary volcanic rocks using the ‘mass fractionation correction procedure’: Application to the Younger Ontake Volcano, central Japan. Chem. Geol. 1995, 125, 123–135. [Google Scholar] [CrossRef]
  3. Miyoshi, M.; Sumino, H.; Miyabuchi, Y.; Shinmura, T.; Mori, Y.; Hasenaka, T.; Furukawa, K.; Uno, K.; Nagao, K. K-Ar ages determined for post-caldera volcanic products from Aso volcano, central Kyushu, Japan. J. Volcanol. Geotherm. Res. 2012, 229–230, 64–73. [Google Scholar] [CrossRef]
  4. Shimura, T.; Miyoshi, M.; Sumino, H.; Ueda, Y.; Mori, Y.; Hasenaka, T.; Arakawa, Y.; Nagao, K. K-Ar ages of volcanic rocks from Nekodake Volcano in the eastern part of Aso Caldera, central Kyushu, Japan. Bull. Volcanol. Soc. Jpn. 2022, 67, 135–147, (In Japanese with English Abstract). [Google Scholar] [CrossRef]
  5. Ban, M.; Oikawa, N.; Yamazaki, S. Geological map of Zao volcano. In Geological Survey of Japan; National Institute of Advanced Industrial Science and Technology (AIST): Tsukuba, Japan, 2015; (In Japanese with English Abstract). [Google Scholar]
  6. Itagaki, N.; Toyoshima, M.; Terado, T. The scoria bed of late Pleistocene in Sendai and its environs. Ann. Tohoku Geogr. Assoc. 1981, 33, 48–53, (In Japanese with English Abstract). [Google Scholar] [CrossRef]
  7. Miura, K.; Ban, M.; Yagi, K. The tephra layers distributed around the eastern foot of the Zao volcano: Ages and volumes of the Za-To 1 to 4 tephras. Bull. Volcanol. Soc. Jpn. 2008, 53, 151–157. [Google Scholar] [CrossRef]
  8. Ban, M.; Oikawa, T.; Imura, T.; Tsunematsu, K.; Jin, H.; Takahashi, Y. An Example of the Magma Discharge Step-diagram: Zao Volcano. Tech. Note Natl. Res. Inst. Earth Sci. Disaster Resil. 2024, 500, 37–43, (In Japanese with English Abstract). [Google Scholar]
  9. Sakayori, A. Magmatic evolution of Zao volcano, Northeast Japan. Bull. Volcanol. Soc. Jpn. 1991, 36, 79–92, (In Japanese with English Abstract). [Google Scholar] [CrossRef]
  10. Sakayori, A. Geology and petrology of Zao volcano, Northeast Japan. J. Mineral. Petrol. Econ. Geol. 1992, 87, 433–444, (In Japanese with English Abstract). [Google Scholar] [CrossRef]
  11. Takebe, Y.; Ban, M. Evolution of magma feeding system in Kumanodake agglutinate activity, Zao Volcano, northeastern Japan. J. Volcanol. Geotherm. Res. 2015, 304, 62–74. [Google Scholar] [CrossRef]
  12. Takebe, M.; Ban, M.; Nishi, Y. Evolution of the calc-alkaline magma feeding system of the Komakusadaira pyroclastics in Zao volcano, NE Japan. Bull. Volcanol. 2021, 83, 12. [Google Scholar] [CrossRef]
  13. Takebe, M.; Ban, M.; Sato, M.; Nishi, Y. The Temporal Variation of Magma Plumbing System of the Kattadake Pyroclastics in the Zao Volcano, Northeastern Japan. Minerals 2021, 11, 430. [Google Scholar] [CrossRef]
  14. Wakabayashi, Y.; Ban, M.; Imura, T.; Takebe, M. Comparison of geologic and petrologic features between a pyroclastic unit in summit area and a tephra layer in eastern foot of early youngest stage of Zao volcano, NE Japan. In Proceedings of the Abstract Annual Meeting Bull. Volcanological Society Japan, Kagoshima, Japan, 18–20 October 2023. (In Japanese). [Google Scholar] [CrossRef]
  15. Ban, M.; Takebe, Y.; Adachi, T.; Matsui, R.; Nishi, Y. Eruption Histories of Zao and Azuma Volcanoes and Their Magma Feeding Systems for Recent Activities. Bull. Earthq. Res. Inst. Univ. Tokyo 2016, 91, 25–39. [Google Scholar] [CrossRef]
  16. Nishi, Y.; Ban, M.; Takebe, M.; Álvarez-Valero, A.M.; Oikawa, T.; Yamasaki, S. Structure of the shallow magma chamber of the active volcano Mt. Zao, NE Japan: Implications for its eruptive time scales. J. Volcanol. Geotherm. Res. 2019, 371, 137–161. [Google Scholar] [CrossRef]
  17. Sato, M.; Ban, M.; Yuguchi, T.; Adachi, T. Pre-eruptive magmatic processes of historical activities at Zao volcano, northeastern Japan: Insights from compositional zoning in orthopyroxene phenocrysts. J. Volcanol. Geotherm. Res. 2022, 432, 107686. [Google Scholar] [CrossRef]
  18. Tsuchiyama, A. Dissolution kinetics of plagioclase in the melt of the system diopside-albite-anorthite, and origin of dusty plagioclase in andesites. Contrib. Mineral. Petrol. 1985, 89, 137–161. [Google Scholar] [CrossRef]
  19. Ban, M.; Sagawa, H.; Miura, K.; Hirotani, S. Evidence for short-lived stratified magma chamber: Petrology of Z-To tephra layer (~5.8ka) at Zao volcano, NE Japan. In Dynamics of Crustal Magma Transfer, Storage, and Differentiation Integrating Geochemical and Geophysical Constraints; Special Publication; Zellmer, G., Annen, C., Eds.; The Geological Society of London: London, UK, 2005; Volume 304, pp. 149–168. [Google Scholar] [CrossRef]
  20. Gill, J.B. Orogenic Andesites and Plate Tectonics; Springer: Berlin/Heidelberg, Germany, 1981; pp. 1–392. [Google Scholar] [CrossRef]
  21. Miyashiro, A. Volcanic rock series in island arcs and active continental margins. Am. J. Sci. 1974, 274, 321–355. [Google Scholar] [CrossRef]
  22. Whitney, D.L.; Evans, B.W. Abbreviations for names of rock-forming minerals. Am. Mineral. 2010, 95, 185–187. [Google Scholar] [CrossRef]
  23. Sato, K.; Tamura, H.; Nishio, Y.; Kumagai, H.; Hanyu, T. Application of K-Ar Dating Performed by New Technique of Ultra Low Potassium Analysis with New Zeeman Atomic Absorption Photometry in Clean Room Laboratory. Frontier Research on Earth Evolution 2, IFREE Report for 2003–2004. 2005, Volume 2, pp. 1–6. Available online: https://www.researchgate.net/profile/Hidenori-Kumagai/publication/267689576_Application_of_K-Ar_dating_performed_by_new_technique_of_ultra_low_potassium_analysis_with_new_Zeeman_atomic_absorption_photometry_in_clean_room_laboratory/links/5467f7a40cf20dedafcf52d4/Application-of-K-Ar-dating-performed-by-new-technique-of-ultra-low-potassium-analysis-with-new-Zeeman-atomic-absorption-photometry-in-clean-room-laboratory.pdf (accessed on 25 September 2024).
  24. Sato, K.; Tamura, H.; Kumagai, H.; Hanyu, T. Application of K–Ar Dating System to Be Performed by New Noble Gas Mass Spectrometry and Its Calibration from Standard Air Analysis. Frontier Research on Earth Evolution, IFREE Report 2003–2004. 2005, Volume 2, pp. 1–6. Available online: https://d1wqtxts1xzle7.cloudfront.net/70816935/Application_of_K-Ar_dating_system_to_be_20210930-2558-108m2ff.pdf?1633050261=&response-content-disposition=inline%3B+filename%3DApplication_of_K_Ar_dating_system_to_be.pdf&Expires=1727575826&Signature=Zen~lR2WECdK1-DTAXaLnFJmgLOKjb9BOQh~BeTxeOC~3DaPitlb3QGwlx0xPaWbNYIVgycOHY2ykw823AQxHGWzye0mDqEGOMCJxgqbqs23b4WLw9wIMB92CJ2kplMX7b4n-5b15oKiFLl0VsdOZfwHH4rNROu827VeR6SNNzOEwe5jkCj-EUYhfcXs8dfmMQAHmf7oBWcXfBQF0l5Y71ozD1yo0~JS1NP7G4QdqQUGKWxdJ4d-NOHlE9t2yZpX~eENdHhHVZmKAaDQ1JPSB6twsuxnZFh1XTrYTzvvayikOnxPR4YR0R-QWpnV9duOBB3kHSQQIY58wX9uLAlQ0w__&Key-Pair-Id=APKAJLOHF5GGSLRBV4ZA (accessed on 25 September 2024).
  25. Takaoka, N.; Konno, K.; Oba, Y.; Konda, T. K-Ar dating lavas from Zao Volcano, North-eastern Japan. J. Geol. Soc. Jpn. 1989, 95, 157–170, (In Japanese with English Abstract). [Google Scholar] [CrossRef]
  26. Sudo, M.; Tagami, T.; Sato, K.; Hasebe, N.; Nishimura, S. Calibration of a new Ar analytical system for the K-Ar dating method and analytical results of K-Ar age known samples. Mem. Fac. Sci. Kyoto Univ. Ser. Geol. Mineral. 1996, 58, 21–40. Available online: http://hdl.handle.net/2433/186680 (accessed on 25 September 2024).
  27. Sudo, M.; Uto, K.; Anno, K.; Ishizuka, O.; Uchimi, S. SORI93 biotite: A new mineral standard for K-Ar dating. Geochem. J. 1998, 32, 49–58. [Google Scholar] [CrossRef]
  28. Imai, N.; Terashima, S.; Itoh, S.; Ando, A. 1994 compilation of analytical data for minor and trace elements in seventeen gsj geochemical reference samples, “igneous rock series”. Geostand. Newsl. 1995, 19, 135–213. [Google Scholar] [CrossRef]
  29. Steiger, R.H.; Jäger, E. Subcommission on geochronology: Convention on the use of decay constants in geo- and cosmochronology. Earth Planet. Sci. Lett. 1977, 36, 359–362. [Google Scholar] [CrossRef]
  30. Yamasaki, S.; Sawada, R.; Ozawa, A.; Tagami, T.; Watanabe, Y.; Takahashi, E. Unspiked K–Ar dating of Koolau lavas, Hawaii: Evaluation of the influence of weathering/alteration on age determinations. Chem. Geol. 2011, 287, 41–53. [Google Scholar] [CrossRef]
  31. Ozawa, A.; Tagami, T.; Garcia, M.O. Unspiked K–Ar dating of the Honolulu rejuvenated and Ko‘olau shield volcanism on O‘ahu, Hawai‘i. Earth Planet. Sci. Lett. 2005, 232, 1–11. [Google Scholar] [CrossRef]
  32. Nier, A.O. Redetermination of the relative abundances of the isotopes of carbon, nitrogen, oxygen, argon, and potassium. Phys. Rev. 1950, 77, 789. [Google Scholar] [CrossRef]
  33. Matsumoto, A.; Uno, K.; Shibata, K. Argon isotopic ratios in historic lavas-Importance of correction for the initial argon in K-Ar dating of young volcanic rocks. J. Mass. Spectrom. Soc. Jpn. 1989, 37, 353–363, (In Japanese with English Abstract). [Google Scholar] [CrossRef]
  34. Kaneoka, I. Noble gas signatures of magmatic sources and processes. Geochem. J. 1993, 27, 201–211, (In Japanese with English Abstract). [Google Scholar] [CrossRef]
  35. Ozawa, A.; Tagami, T.; Kamata, H. Argon isotopic composition of some Hawaiian historical lavas. Chem. Geol. 2006, 226, 66–72. [Google Scholar] [CrossRef]
  36. Ryu, S.; Kitagawa, H.; Nakamura, E.; Itaya, T.; Watanabe, K. K–Ar analyses of the post-caldera lavas of Bratan volcano in Bali Island, Indonesia—Ar isotope mass fractionation to light isotope enrichment. J. Volcanol. Geotherm. Res. 2013, 264, 107–116. [Google Scholar] [CrossRef]
  37. Itaya, T.; Nagao, K. K-Ar age determination of volcanic rocks younger than 1 Ma. Mem. Geol. Soc. Jpn. 1988, 29, 143–161, (In Japanese with English Abstract). Available online: http://dl.ndl.go.jp/info:ndljp/pid/10809696 (accessed on 25 September 2024).
  38. Itaya, T.; Okada, T.; Onoe, T.; Isshiki, N. K-Ar ages of the Middle Pleistocene Takahara Volcano, central Japan, and argon release processes in cooling lava. J. Mass Spectrom. Soc. Jpn. 1989, 37, 365–374. [Google Scholar] [CrossRef]
  39. Kaneoka, I. The effect of water on noble gas signatures of volcanic materials. In Noble Gas Geochemistry and Cosmochemistry; Matsuda, J., Ed.; TERRAPUB: Tokyo, Japan, 1994; pp. 205–215. [Google Scholar]
Figure 1. (a) Location map of Zao Volcano in NE Japan. (b) Geological sketch map of summit area of Zao Volcano redrawn from [5]. The circle symbol shows the location of sampling. (c) Stratigraphic relationship of geologic units and tephra layers, Zao youngest activity. Detailed description is presented in the chapter of geologic and petrologic outline.
Minerals 14 00979 g001
Figure 2. K2O and FeOt/MgO versus SiO2 diagrams of Umanose Agglutinate, Kattadake Pyroclastics, and Komakusadaira Pyroclastics. The data are from [12,13,19]. The boundary lines in the K2O and FeOt/MgO-SiO2 diagram are from [20,21].
Minerals 14 00979 g002
Figure 3. The columnar sections of sampling sites. The lower half of the column loc. 1 is quoted from [12]. The column loc. 2 is quoted from [13].
Minerals 14 00979 g003
Figure 4. Photographs (ae) show the deposits where the samples no. 1 to 5 were collected. The deposits of (a,c) are scoriaceous tuff including scarce andesitic bombs; (b,d,e) are agglomerate. The size of the hammer in each photograph is ca. 30 cm.
Minerals 14 00979 g004
Figure 5. Photographs (ae) hand specimens of the analyzed samples. The samples of (a,b,d) are dark gray andesitic bombs with weakly vesiculated, whereas the samples (c,e) are black scoria with highly and moderately vesiculated. The size of black pen in each photograph is about 14 cm.
Minerals 14 00979 g005
Figure 6. Photomicrographs (ae) of the analyzed samples. Images on the left, open Nicol; those on the right, crossed Nicols. Pl, plagioclase; Opx, orthopyroxene; Cpx, clinopyroxene; Ol, olivine (mineral abbreviations are from [22]). The bar indicates 0.1 mm.
Minerals 14 00979 g006
Figure 8. Graphic comparison of the K-Ar ages and the previously estimated ages of the corresponding tephra layers. 2σ uncertainties are shown. The ages of the tephra layers are from [5,7,8].
Minerals 14 00979 g008
Table 1. Summary of petrological features of the samples.
Sample NameMeasurement No.FormationLayer or Bed No.LocationSampleBubble (vol.%)Rock Type
Longitude (N)Latitude (E)
55-1Umanose
Agglutinate
-38°08′24.6″140°26′38.2″moderately vesiculated bomb17.6cpx-opx andesite
44-1 and 4-2Umanose
Agglutinate
-38°07′55.9″140°26′49.9″weakly vesiculated bomb<0.1cpx-opx andesite
33-1Kattadake
Pyroclastics
bed 1338°07′55.8″140°27′02.0″highly vesiculated bomb38.4cpx-opx basaltic andesite
22-1 and 2-2Komakusadaira
Pyroclastics
layer 1 of
episode 7
38°08′12.9″140°26′37.2″weakly vesiculated bomb9.8ol-cpx-opx basaltic andesite
11-1Komakusadaira
Pyroclastics
layer 2 of
episode 5
38°08′14.7″140°26′37.7″weakly vesiculated bomb0.2ol-cpx-opx andesite
Table 2. The peak height comparison K-Ar dating results.
Unit NameNo.wt. (g)K2O (wt.%)40Ar/36Ar (Total)38Ar/36Ar40Ar rad.
(×10−9 cc/g)
Air con. (%)36Ar
(×10−9 cc/g)
Applied
40Ar/36Ar
Initial
Corrected Age (ka)
Umanose 5-10.28981.28 ± 0.03296.0 ± 1.20.1869 ± 0.00070.72 ± 3.2899.81.22 ± 5.56295.4 ± 2.417.3 ± 79.3
4-10.27811.39 ± 0.03295.7 ± 1.20.1869 ± 0.00080.24 ± 2.0199.90.72 ± 6.10295.4 ± 2.55.3 ± 44.9
4-20.29681.39 ± 0.03295.8 ± 0.90.1867 ± 0.00060.25 ± 0.6499.70.31 ± 0.79295.0 ± 1.95.7 ± 14.3
Kattadake3-10.16491.33 ± 0.03290.3 ± 0.90.1850 ± 0.00060.54 ± 2.0199.80.92 ± 3.39289.7 ± 2.012.6 ± 46.7
Komakusadaira2-10.17771.50 ± 0.03301.6 ± 1.90.1880 ± 0.00131.81 ± 3.1599.10.68 ± 1.18298.9 ± 4.237.4 ± 64.8
2-20.19681.50 ± 0.03298.5 ± 2.10.1870 ± 0.00141.60 ± 2.8199.10.57 ± 0.99295.7 ± 4.533.0 ± 58.0
1-10.16511.48 ± 0.03300.6 ± 1.00.1878 ± 0.00071.43 ± 1.5499.20.62 ± 0.66298.3 ± 2.330.0 ± 32.2
Standard sampleYZ1.70.07361.69 ± 0.03312.0 ± 1.70.1850 ± 0.001112.3 ±1.1994.70.75 ± 0.07295.5 *225.4 ± 22.3
Atmospheric Ar ratios, (40Ar/36Ar = 295.5 [28], 38Ar/36Ar = 0.1869 [30]) were assumed for age calculation. 1 sigma uncertainties are shown. rad.: radiogenic. Air con.: Air contamination ratio. * Mass fractionation uncorrected.
Disclaimer/Publisher’s Note: The statements, opinions and data contained in all publications are solely those of the individual author(s) and contributor(s) and not of MDPI and/or the editor(s). MDPI and/or the editor(s) disclaim responsibility for any injury to people or property resulting from any ideas, methods, instructions or products referred to in the content.

