Article

LA-ICP-MS Analyses of Sulfides from Gold-Bearing Zones at the Perron Deposit, Abitibi Belt, Canada: Implications for Gold Remobilization through Metamorphism from Volcanogenic Mineralizations to Orogenic Quartz–Carbonate Veins

1
Sciences de la Terre, Université du Québec à Chicoutimi (UQAC), Chicoutimi, QC G7H 2B1, Canada
2
Laurentia Exploration Inc., Jonquière, QC G7X 0J6, Canada
3
Amex Exploration Inc., Montréal, QC H2Y 2P5, Canada
*
Author to whom correspondence should be addressed.
Minerals 2024, 14(8), 843; https://doi.org/10.3390/min14080843
Submission received: 22 June 2024 / Revised: 14 August 2024 / Accepted: 16 August 2024 / Published: 21 August 2024
(This article belongs to the Special Issue Understanding Hydrothermal Ore Deposits)

Abstract

:
The Perron deposit, located in the northern part of the Archean Abitibi belt, bears some of the highest gold-grade mineralization for orogenic-vein-type deposits worldwide (High-Grade Zone: HGZ). More than 13 gold-bearing zones with different sulfide assemblages, hydrothermal alterations, and gold grades have been recently outlined, and they range from volcanogenic to orogenic in origin. In addition, seven zones are hosted in a restricted volume of ~1 km3, which is called the Eastern Gold Zone. Pyrite, sphalerite, pyrrhotite, and chalcopyrite—each from a different gold-bearing zone—were analyzed with LA-ICP-MS to decipher their genetic links, mineralizing processes, and temperature of formation. The temperatures calculated with the sphalerite GGIMFis thermometer range from 348 to 398 °C. All gold-bearing zones recorded volcanogenic hydrothermal inputs at different intensities, manifested by pyrrhotite. Pyrite was late-metamorphic and related to the orogenic gold system induced by the contact metamorphism of amphibolite facies. The pyrrhotite grains had very homogeneous trace element signatures in all zones, which is a characteristic of metamorphic recrystallization, exhibiting a loss of mobile elements (Au, Te, Bi, Tl, Sn, W, In) but high concentrations of Ni, Co, and As. Conversely, the pyrite was systematically enriched with all elements depleted from pyrrhotite, bearing five specific signatures of element enrichments: W, Tl, Sn, In-Cd-Zn, and Bi-Te-Au. For gold-rich zones (e.g., the HGZ), gold was linked to the Bi-Te-Au signature of pyrite, with Bi enrichment occurring at up to 72,000 times the background level in Archean shale pyrite. It was concluded that gold was transported, at least in part, as Bi-Te melts in the previously documented non-aqueous orogenic fluids, hence accounting for the very-high-grade gold content of the HGZ. Genetically, the metamorphism of primary gold-bearing volcanogenic mineralizations was the main source of gold during the overprinting of amphibolite (600 °C) in a metamorphically induced orogenic mineralizing event. A strong volcanogenic pre-enrichment is considered the main factor accounting for the gold endowment of the Eastern Gold Zone.

1. Introduction

The Archean Abitibi belt in Canada is one of the most prolific greenstone belts worldwide for gold, with >6100 metric tons of gold produced in a century [1]. The total endowment, including production, reserves, and resources, reaches >9375 metric tons of gold. Four main genetic models account for gold deposit formation [1]: (1) orogenic quartz–carbonate veins (63%); (2) intrusion-related deposits (23%); (3) auriferous volcanogenic massive sulfide lenses and veins (13%); (4) sulfide-rich Cu-Au-Ag lodes (~1%). Gold deposits formed at various stages of the evolution of the greenstone belt. The volcanogenic-related deposits (types 3 and 4) formed early during the submarine volcanic construction, in association with calc-alkaline rocks [2]. Intrusion-related gold deposits are associated mostly with alkaline magmatism occurring along major regional faults [3]. Orogenic gold deposits formed at the end of the regional tectonic shortening and are mostly distributed along the margin of the major regional faults [1]. The largest gold deposits are commonly composed of only a single genetic type [1], with examples such as Hollinger–McIntyre [4], Canadian Malartic [5], and LaRonde–Penna [1,6] for types 1 to 3, respectively.
The Perron deposit is an active-exploration gold project located in the northern part of the Abitibi belt (Figure 1); it is owned by Amex Exploration Inc. (Montréal, QC, Canada) and currently under extensive drilling managed by Laurentia Exploration (Jonquière, QC, Canada). This project bears some of the highest gold-grade mineralization for Archean vein-type deposits worldwide.
A recent study [8] documented two different mineralization types: (1) exceptionally gold-rich quartz–carbonate veins of the orogenic type; (2) auriferous volcanogenic-related sulfidic mineralization. The LA-ICP-MS signatures of pyrite were inconclusively used to test the possible remobilization of gold in orogenic veins from primary volcanic-related mineralization. Nevertheless, Gaboury et al. [8] demonstrated that gold was not transported in aqueous complexes for the formation of the late quartz–carbonate veins but, rather, as hydrocarbon–metal complexes or as colloidal gold nanoparticles within non-aqueous hydrocarbon-rich fluids, hence accounting for the exceptionally high-gold-grade orogenic mineralization.
Recent exploration activity has outlined more than 13 gold-bearing zones (Figure 2 and Figure 3), most of which have different sulfide assemblages, hydrothermal alterations, and gold grades.
One of the most impressive characteristics of the Perron gold deposit, in addition to the exceptional gold grade and particular mineralizing fluids, is the occurrence of seven zones with different characteristics hosted in a restricted volume of ~1 km3, which is called the Eastern Gold Zone (Figure 3). The Perron project is, thus, an exceptional natural laboratory for trying to understand why gold is so locally enriched and what the processes accounting for the introduction of gold in such a small-volume area. Furthermore, the newly discovered zones share hybrid characteristics between the two previously documented end-members of volcanogenic and orogenic mineralization [8], hence providing a possible record of remobilization and/or overprinting processes at various stages of the tectonic evolution of the mineralized block. The distributions and variations of the trace elements in sulfides, particularly in pyrite, are a powerful tool for constraining ore genesis and interpreting ore-forming processes [10,11,12,13,14,15,16,17,18,19,20,21].
Different levels of volcanogenic hydrothermal inputs, manifested by the presence of metamorphosed pyrrhotite, were recorded in all of the gold-bearing zones. The pyrite is late-metamorphic and related to the orogenic gold system. The pyrrhotite has a very homogeneous signature that is characteristic of metamorphic recrystallization, with mobile elements (Au, Te, Bi, Tl, Sn, W, In) being lost but structurally bound elements, such as Ni, Co, and As, being retained. Conversely, the pyrite is enriched with all elements depleted from pyrrhotite. It is, thus, interpreted that the metamorphism of primary volcanogenic mineralization was the main source of gold during the metamorphic and orogenic mineralizing overprinting event. In addition, gold is linked to the Bi-Te signature of pyrite for the gold-rich zones (e.g., the HGZ), and it is concluded that gold was transported, at least in part, as Bi-Te melts in non-aqueous orogenic fluids. This study attempts to document the gold pre-enrichment through volcanic processes for the formation of orogenic gold deposits in Archean terrains.

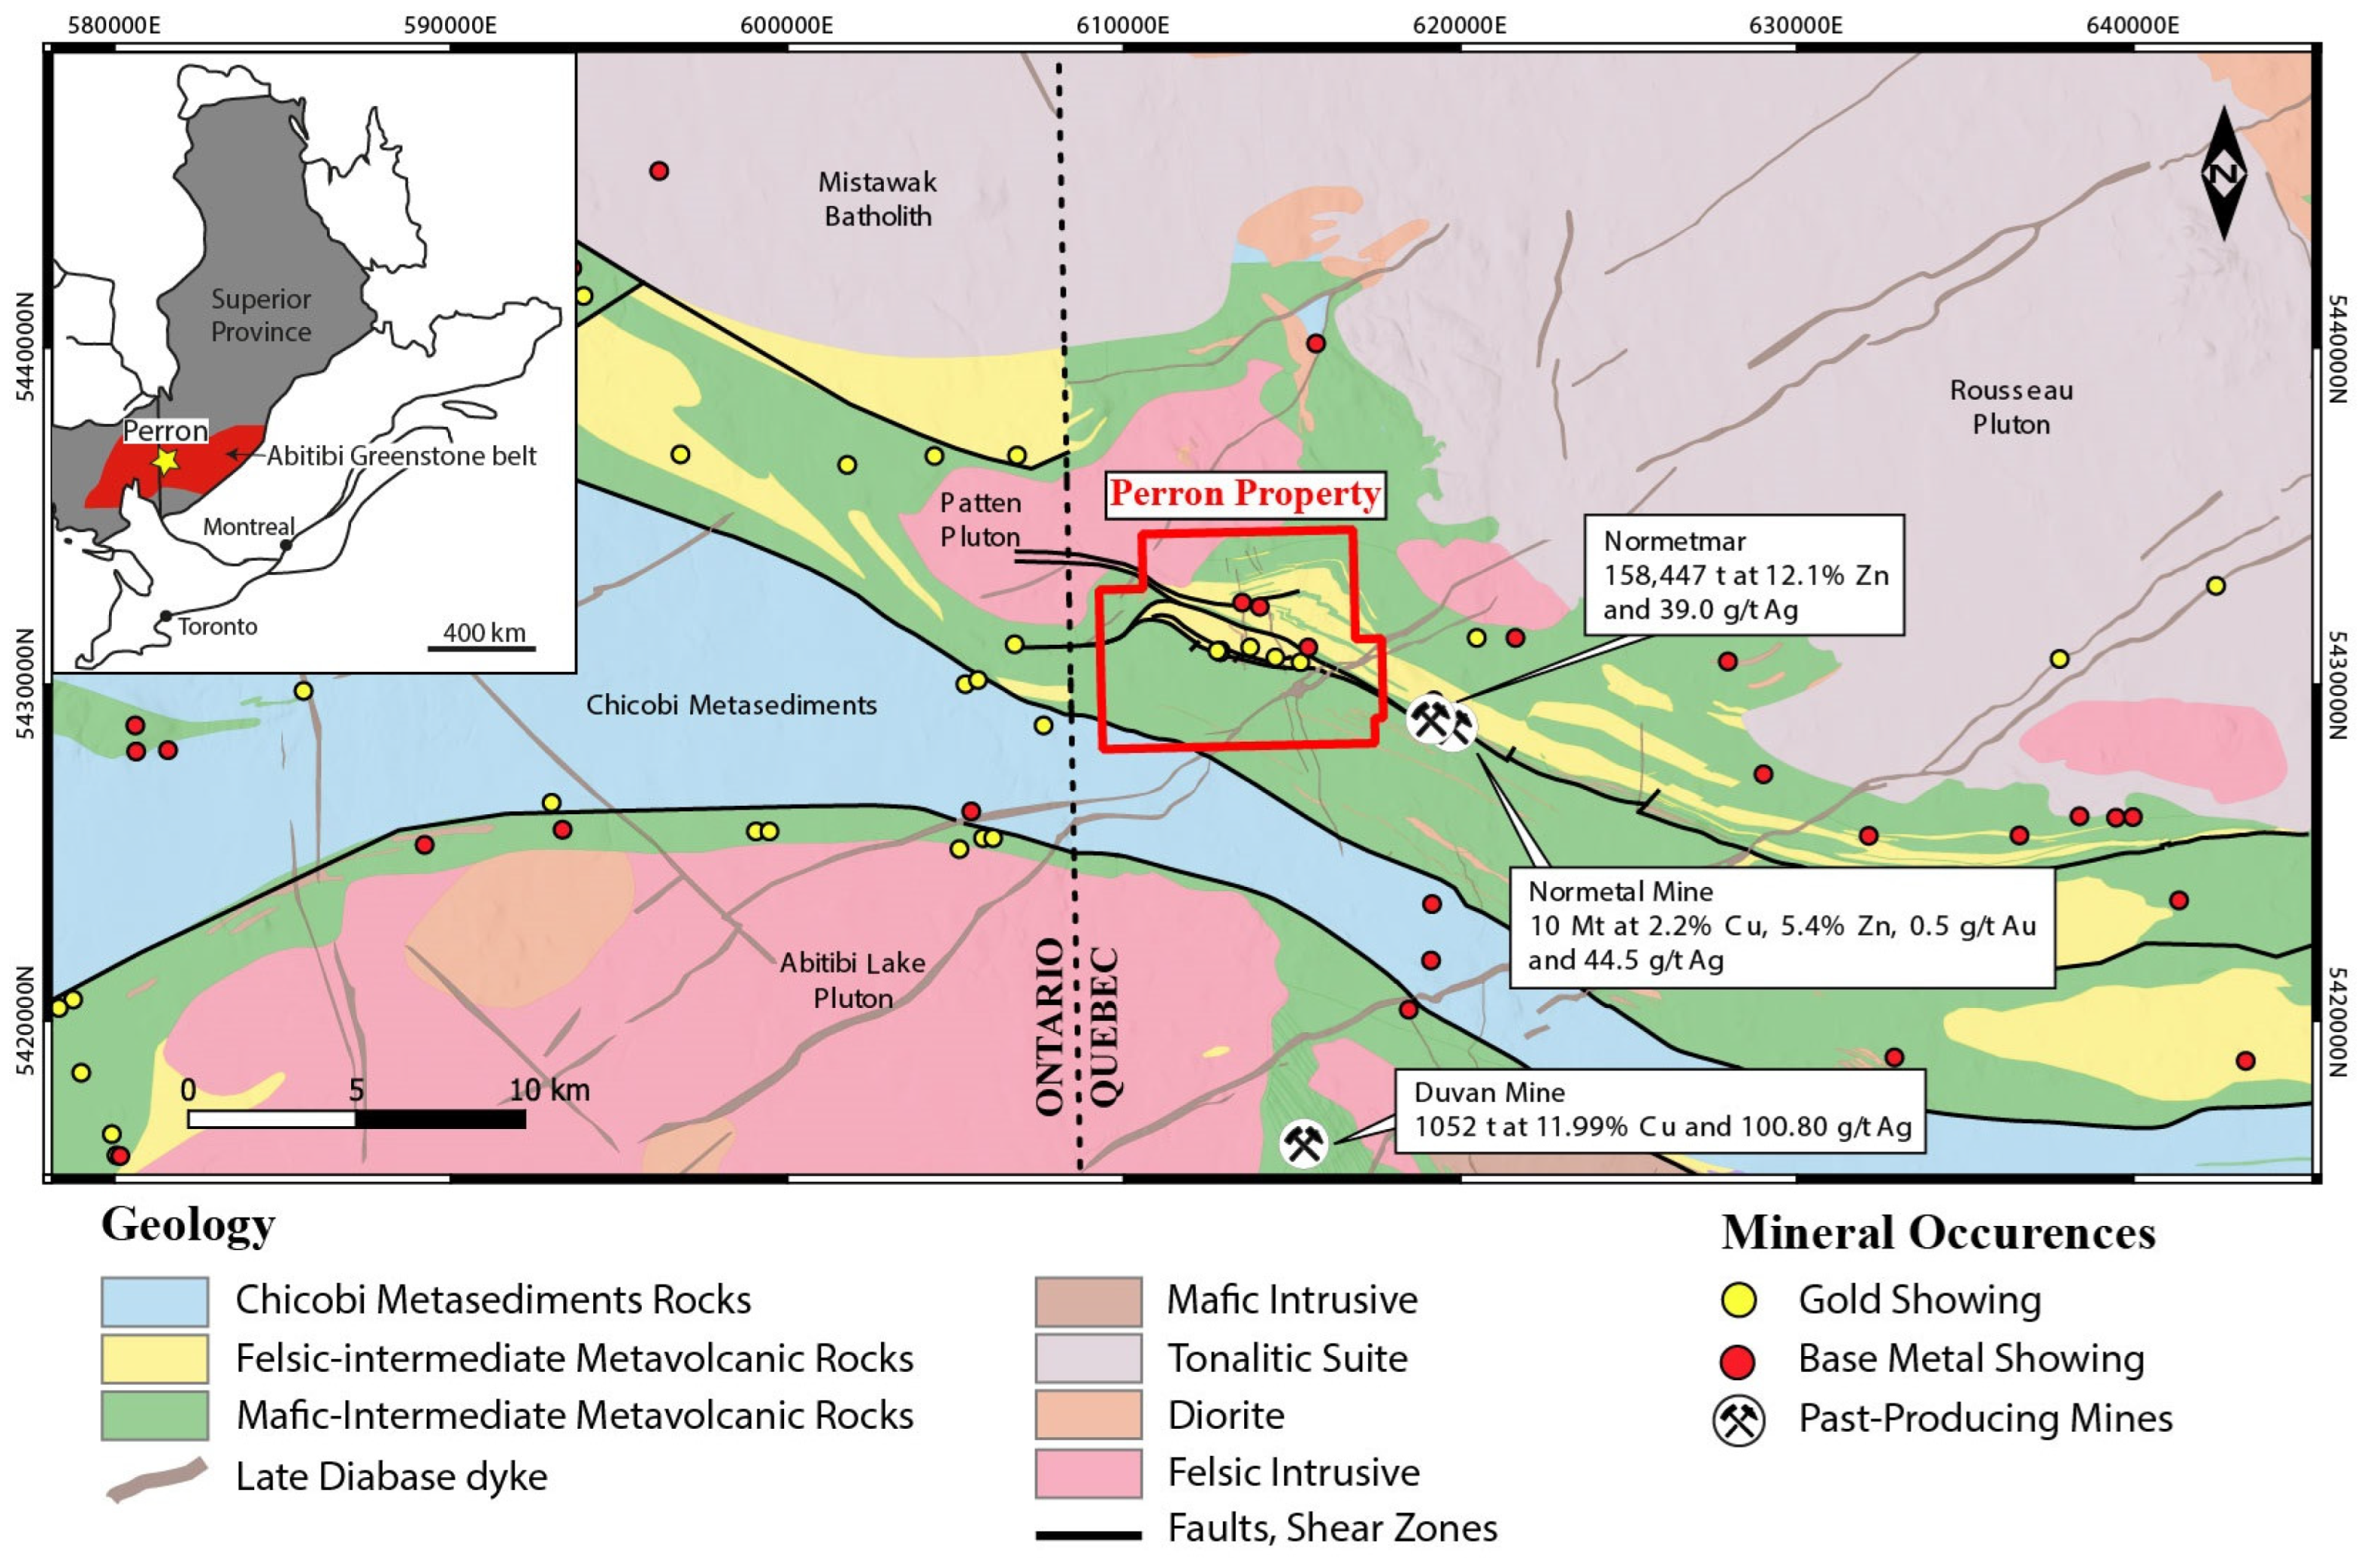
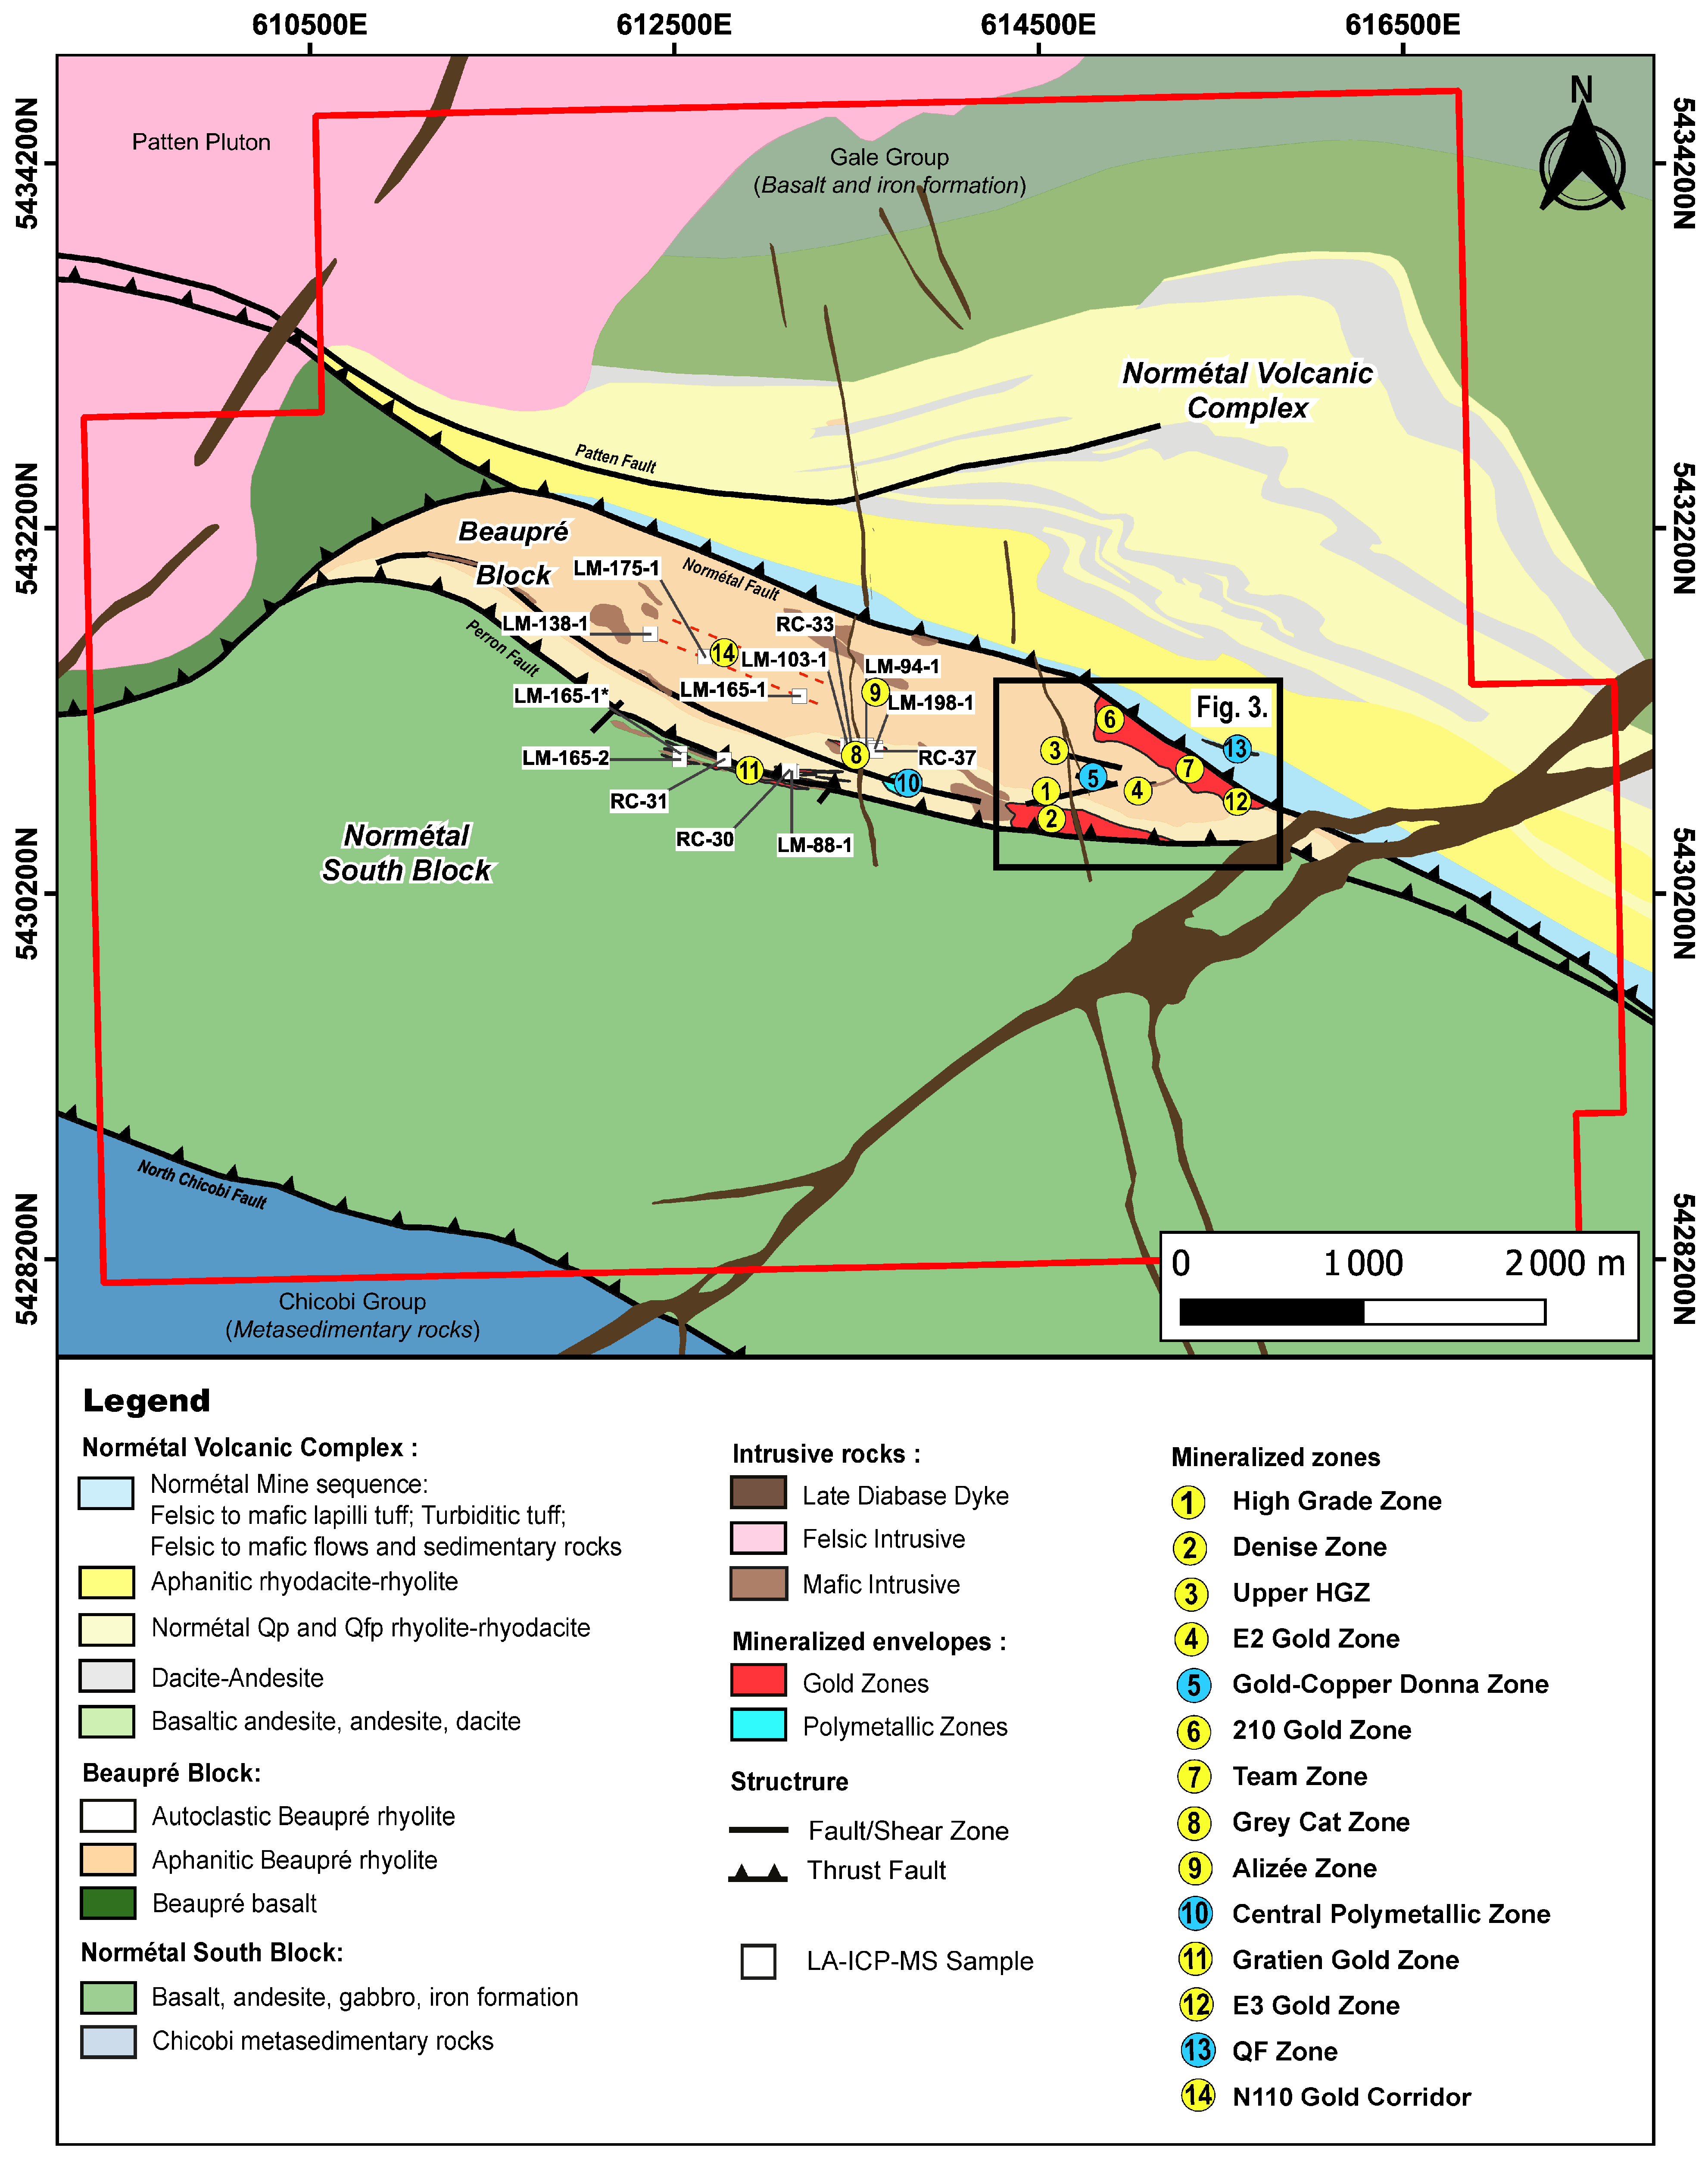
2. Regional and Local Geology

The 2.8 to 2.6 Ga Abitibi greenstone belt is composed of several east-trending successions of folded volcanic and sedimentary rocks. Volcanic rocks comprise submarine mafic to felsic volcanic rocks with lesser ultramafic volcanic rocks (e.g., [22,23,24]). The volcanic successions are injected by syn-volcanic to late-tectonic intrusive bodies [25]. The folded volcanic blocs are separated by east-trending major regional faults. The belt covers an area that is approximately 700 km from southeast to northwest and 350 km from north to south, spanning the Ontario–Quebec border. It is the largest and best-preserved Archean greenstone belt in the world [24,26].
The Perron project is located close to the old mining town of Normétal and the former polymetallic Normétal mine (Figure 1). The Normétal Volcanic Complex (NVC), 60 km long with a 4 km thickness, is composed predominately of rhyolite, with minor basalt, andesite, dacite, and volcanic–sedimentary rocks [9]. The NVC was dated at 2727.7 + 2.6/−2.1 Ma [27], but more recent dating indicates that the central and western parts are circa 2725 to 2720 Ma [28]. The homoclinal NVC is tilted vertically with a southward younging direction. A volcanic–sedimentary horizon defining the end of five volcanic cycles lies at the top of two principal calderas (Western and Central). The NVC hosts two massive past-producing volcanogenic massive sulfide deposits: Normétal [29] and Normetmar (Figure 1). These deposits are located at the top of the NVC along a laterally continuous volcanic–sedimentary horizon referred to as the Normétal mine horizon. The Beaupré Block occurs above the Normétal mine horizon and above the Western caldera. It is interpreted as a large endogenic rhyolitic dome (Figure 2) stratigraphically coherent with the NVC, as supported by the recent U-Pb ages. Rhyolite geochemistry indicates a mix of FI, FII, and FIII rhyolites—according to the nomenclature of Lesher et al. [30]—for the NVC [9]. The Beaupré Block is tholeiitic (FI) to transitional (FII), but the interface tuffaceous rocks of the Normétal mine horizon are calc-alkaline (FIII: [31]).
All of the known gold-bearing zones of the Perron deposit (Figure 2) are hosted in the lens-shaped, verticalized rhyolite of the Beaupre Block, which is 9 km long and 1 km thick. The rhyolites were dated at 2722 ± 3 Ma [32] and 2725.4 ± 0.9 Ma [28]. Aphanitic and essentially aphyric rhyolites define a relatively homogeneous sequence. The rhyolites at the base are massive with flow bandings but are brecciated at the top, consistent with a south-facing dome interpretation. The rhyolite colors vary from dark green to grayish or even whitish locally. It is commonly dotted with 2–3 mm spots of chlorite or garnet. The dark green color reflects a widespread hydrothermal alteration of chlorite. Mafic aphanitic intrusions crosscut the rhyolites (Figure 1). They are considered sills because their trend and dip appear parallel to the strata, but some are clearly discordant.
The Normétal deformation corridor defines the contact between the NVC and the Beaupré Block (Figure 2). The regionally extensive steeply north-dipping Normétal corridor (NE to E-W) is developed along a volcanic–sedimentary horizon at the top of the NVC. The southern contact of the Beaupré Block is also fault-defined by a similar fault: the Perron fault (Figure 2). Inside the Beaupré Block, the deformation is weak in the competent rhyolites. However, an E-W trending and steeply dipping schistosity has been recorded due to incompetent mafic dykes. The regional metamorphism is at greenschist facies. However, in the Beaupré Block, an amphibolite facies is recorded in the aureole of contact metamorphism [9,33] around the syn-tectonic Patten pluton at 2687.8 ± 1.3 Ma [28] (Figure 1 and Figure 2). This higher metamorphism at ~600 °C [8] is manifested by porphyroblastic garnet and randomly oriented amphibole and biotite overprinting the schistosity [8].

3. Gold-Bearing Zones

Thirteen gold mineralized zones were defined through core drilling (Figure 2 and Figure 3). They are described below according to their interpreted origin as orogenic, volcanogenic, or hybrid-style mineralization zones. As exploration is ongoing, not all of the zones are at the same level of definition in terms of morphology, trend, and dimensions. However, the style of mineralization, sulfide composition, gold grade, and hydrothermal alterations are well constrained.

3.1. Orogenic Gold Mineralization

Quartz–carbonate veins and veinlets with visible gold are the manifestations of this genetic type. Veins and veinlets are post-tectonic and post-metamorphic and accompanied by a sericite alteration [8]. The gold grade is commonly 10X greater than the silver values.

3.1.1. High-Grade Zone

The High-Grade Zone (HGZ) is the richest gold zone and the best defined by drilling. The steeply north-dipping zone (Figure 3) was traced by drilling over 500 m laterally, from near the surface to >1260 m vertically along a 75° eastern plunge, with a true thickness of 1 to 4 m. The HGZ corresponds to massive whitish-to-greyish quartz veins with traces of iron carbonates, green chlorite, and tourmaline (Figure 4A). Brown sphalerite, reaching >5% locally, is common in the veins, as is pyrite. Pyrrhotite is locally present in the host rock. Visible gold grains occur in association with sphalerite, along chlorite ribbons and flakes, and freely in quartz. The HGZ is hosted in rhyolite but developed at the interface of a narrow (1–5 m) deformed mafic dyke. Veins occur either along one side or both sides of the dyke. The hydrothermal alteration is very weak, even within the mafic dykes, and it is manifested by the chloritization of the mafic dyke and weak sericite alterations of rhyolites.

3.1.2. Grey Cat Zone

The Grey Cat Zone (Figure 2) is a near-surface zone that contains high-grade gold within a large corridor of disseminated gold mineralization hosted in a slightly brecciated rhyolite with moderate sericite, silica, and chlorite alterations. The strike length is defined as 425 m with a vertical depth of approximately 400 m and a thickness between 3 m and 20 m. The mineralized system is composed of a main quartz vein located along the lower or upper contact of a mafic intrusion crosscutting the rhyolite, as in the structural setting of the HGZ. However, the mineralization differs from that of the HGZ because gold is more widespread within a large envelope hosting several quartz veinlets or silicified sheared zones around the main vein. Visible gold occurs in quartz–carbonate veins and veinlets in association with sphalerite and pyrite (Figure 4B).

3.1.3. Gratien Zone

The Gratien Zone comprises several stacked vertically dipping lenses of gold mineralization hosted within and close to the Perron Fault. This zone extends over a strike length of 1 km and a vertical depth of 300 m (Figure 2). Mineralization occurs as quartz and carbonate-sheeted quartz veinlets within strongly deformed rocks, with variable propositions of sulfides, mostly pyrite and sphalerite, traces of galena, and visible gold (Figure 4C). It is hosted along the Perron fault, in the rhyolite package of the Beaupré Block, and in the andesite sequence of the Normétal South Block. Minor alterations in the assemblage of chlorite and iron carbonates are locally present.

3.1.4. E2 Gold Zone

The E2 Gold Zone lies in the same structure hosting the bonanza mineralization of the HGZ (Figure 3). Its mineralization is very similar to that of the HGZ in terms of its structural setting and mineralogy. Gold-bearing quartz veinlets occur on both sides of an unmineralized narrow deformed mafic dyke. This zone strikes 350 m laterally and 550 m vertically. Sphalerite is the most common sulfide with lesser pyrite (Figure 4D). Visible gold grains are evident in several cores of drill holes. A weakly sericitic alteration is developed in the rhyolite. The mafic dyke is affected by green chlorite and minor biotite.

3.1.5. N110 Zone

The N110 Zone is a newly defined mineralized corridor located on the western part of the Beaupré Block (Figure 2). The corridor is over one kilometer along its strike and extends to a vertical depth of 200 m. Its mineralization corresponds to centimeter-scale quartz veinlets with minor percentages of pyrite (Figure 4E) with a large amount of visible gold in the system. The mineralization is hosted in an aphanitic rhyolite without apparent hydrothermal alterations.

3.2. Primary Volcanogenic-Related Mineralization

Mineralization occurs as massive lenses, disseminations, and stringers of pyrrhotite, sphalerite and chalcopyrite with lesser pyrite, and local galena [8]. Sericite and chlorite define the hydrothermal alteration envelope. Metamorphosed alteration is manifested by porphyroblasts of garnet and amphibole and randomly oriented biotite. Regional deformation overprinted the mineralization. Silver values are typically ~10 times higher than gold values. Higher gold grades are related to higher sulfide contents and are correlated with either the zinc or copper values.

3.2.1. Central Polymetallic Zone

The Central Polymetallic Zone (CPZ: Figure 2) was the first volcanogenic mineralization hosted in the Beaupré Block to be discovered. The mineralization is currently known to have a lateral extent of 200 m at a vertical depth of 300 m and is oriented E-W. The zone corresponds to stringers and massive sulfides of chalcopyrite, sphalerite, pyrrhotite, and pyrite hosted in chlorite–sericite-altered rhyolite (see Figure 2A–C of Gaboury et al. [8]). Sulfide stringers are commonly transposed parallel to the schistosity. This zone is interpreted as a discordant linear volcanogenic hydrothermal feeder [8].

3.2.2. Donna Gold–Copper Zone

The Donna Zone lies north of the HGZ at depth (Figure 3), with a strike that is oriented E-W and a sub-vertical dip. The mineralization consists of centimeter-scale stringers of chalcopyrite–pyrrhotite hosted in strongly altered aphanitic rhyolite with chlorite and garnet–amphibole porphyroblasts (Figure 4F). The correlation between the gold and copper values is strong.

3.2.3. QF Zone

The QF Zone consists of massive to semi-massive copper-rich sulfide lenses (Figure 4G) along the Normétal Mine Horizon (Figure 2) at the interface between a strongly altered intermediate ash to lapilli tuff and a rhyodacitic tuff. The QF Zone is interpreted as an envelope that is oriented WNW-ESE (N300), with a dip of 80° to the north. Its mineralization varies in thickness from several decimeters to a maximum of 6 m, with a lateral extension reaching 100 m. The mineralization is composed of pyrrhotite with smaller amounts of chalcopyrite, sphalerite, and pyrite hosted in chloritized (magnesian chlorite) volcaniclastic rocks with local amphibole porphyroblasts.

3.3. Hybrid-Style Mineralization

Some specific zones share characteristics of both genetic types (volcanogenic and orogenic) and are referred to descriptively as hybrid mineralization. Genetically, volcanogenic-related mineralizations, composed of disseminated and stringers of sulfides, appear to be overprinted by later orogenic mineralizations manifested by quartz veinlets and silicification.

3.3.1. Team Zone

The Team Zone occurs approximately 600 m northeast of the HGZ and forms a large pocket of mineralized intercepts of about 400 m × 200 m (Figure 3), extending down a dip from the surface to a depth of ~400 m. The large overall mineralized envelope is defined by several higher-grade intercepts. The mineralization is hosted in the undeformed aphanitic rhyolite of the Beaupré Block, which is crosscut by mafic dykes and sills. The mineralization corresponds to centimetric gold-bearing quartz–carbonate veinlets, with sphalerite, pyrite, and traces of chalcopyrite and molybdenite (Figure 4H). Gold mineralization is disseminated within the massive and silicified rhyolite, unlike in the other zones. Significant amounts of visible native gold grains also occur in the quartz–carbonate veinlets.

3.3.2. Upper High-Grade Zone

The Upper High-Grade Zone (Upper HGZ) is located ~200 m north of the HGZ (Figure 3), striking WNW. The strike length is approximately 300 m, with a 75° plunge to the east and a vertical depth of 700 m. The Upper HGZ is commonly hosted by or proximal to a swarm of sub-vertical narrow and deformed mafic dykes. The mineralization is associated with quartz veining, dissemination and stringers of pyrrhotite, pyrite, sphalerite, and visible gold (Figure 4I). Amphibole porphyroblasts in the margin of sulfide stringers support a primary volcanogenic contribution to the gold mineralization.

3.3.3. 210 Zone

The 210 Zone is located north of the HGZ close to the Normétal fault (Figure 3). It is defined within an area of 200 × 200 m down to a vertical depth of 300 m. The 210 Zone appears to strike NNE-SSW, as defined by several gold panels in multiple directions. The dipping and plunging are unknown. Gold mineralization is associated with a stockwork of quartz–sulfide tension veinlets hosted in massive aphanitic rhyolite (Figure 4J). Visible gold is mainly associated with chalcopyrite, pyrrhotite, and sphalerite assemblages.

3.3.4. Denise Zone

The Denise Zone is located 50 to 100 m south and sub-parallel to the HGZ. It is hosted within the brecciated rhyolite of the Beaupré Block, which represents the top of the felsic dome (Figure 3). The Denise Zone is a high-tonnage envelope with a low grade. It is defined from the surface to 750 m vertically and continues along the strike for >500 m. The true thickness reaches 50 m at the western limit and decreases to the east. Its gold mineralization is controlled by a kilometric mafic dyke to the west that is crosscut by E-W shear corridors. The Denise Zone consists of disseminated sulfides and quartz veinlets bearing gold (Figure 4K). These veinlets contain visible gold in association with sphalerite, pyrite, and minor pyrrhotite. The gold mineralization is associated with intense and widespread sericite alterations and disseminations of pyrite, sphalerite, pyrrhotite, and chalcopyrite.

3.3.5. Eastern Denise Zone

The Eastern Denise Zone is the eastern lateral continuation of the Denise Zone (Figure 3). Its characteristics are similar to those of the Denise Zone, with disseminations of sulfides and quartz veining (Figure 4L). Together, the Denise Zone and Eastern Denise Zone define a large E-trending zone that is over 1 km long.

4. Material and Methods

Representative samples taken from the various zones using drill cores were selected based on the following: (1) typical gold grade; (2) visual gold grain occurrence; (3) a high percentage of sulfides; (4) spatial distribution. Three to five samples were selected for each mineralized zone (Table S1) for a total of 41 samples. In addition, the data from Gaboury et al. [8] were integrated into this study, including 18 samples from 10 drill holes from the HGZ to cover its vertical distribution and 13 samples from the primary volcanogenic gold mineralization to cover the various styles and sulfide assemblages. These latter samples correspond to those starting with “RC”. A polished thin section of 30 µm was fabricated for all samples for petrographic observations and the purpose of an in-situ LA-ICP-MS analysis. Trace element concentrations in pyrite, sphalerite, chalcopyrite, and pyrrhotite were measured using laser ablation inductively coupled plasma mass spectrometry (LA-ICP-MS) on polished thin sections. The analyses were performed at LabMaTer (UQAC) using an Excimer 193 nm Resonetics Resolution M-50 laser ablation system coupled with an Agilent 7700X mass spectrometer. Analyses (Agilent Technologies., Santa Clara, CA, USA) were performed using lines according to the procedures of Gaboury et al. [8,18] and Genna and Gaboury [14]. For pyrite, the lines commonly cut the entire grains, hence accounting for possible zoning. Pyrrhotite, sphalerite, and chalcopyrite occurred in the groundmass, and consequently, lines were positioned within the minerals. Iron was used as an internal standard using stoichiometric values. The sulfide analyses were calibrated using MASS-1 and GSE standards, and the data quality was verified using in-house standards UQAC-FeS1 and UQAC-FeS5 (Supplementary Materials, Table S2). The analytical results are given in Table S3. The Limit of Detection (LOD) values are reported in various diagrams. In some cases, the reported analytical values are below the LOD for some specific elements. To avoid dealing with the LOD, the classification diagrams are based on elements with values above the LOD. Specifically, the pyrite classification is based on the highest values for specific elements.
The sphalerite GGIMFis geothermometer [34] was used to determine mineralization temperatures using the chemical composition of sphalerite from the LA-ICP-MS analyses (Table S4). For data reduction, the stoichiometric sulfur concentration was used as an internal standard to calculate the Fe content of sphalerite.

5. Results

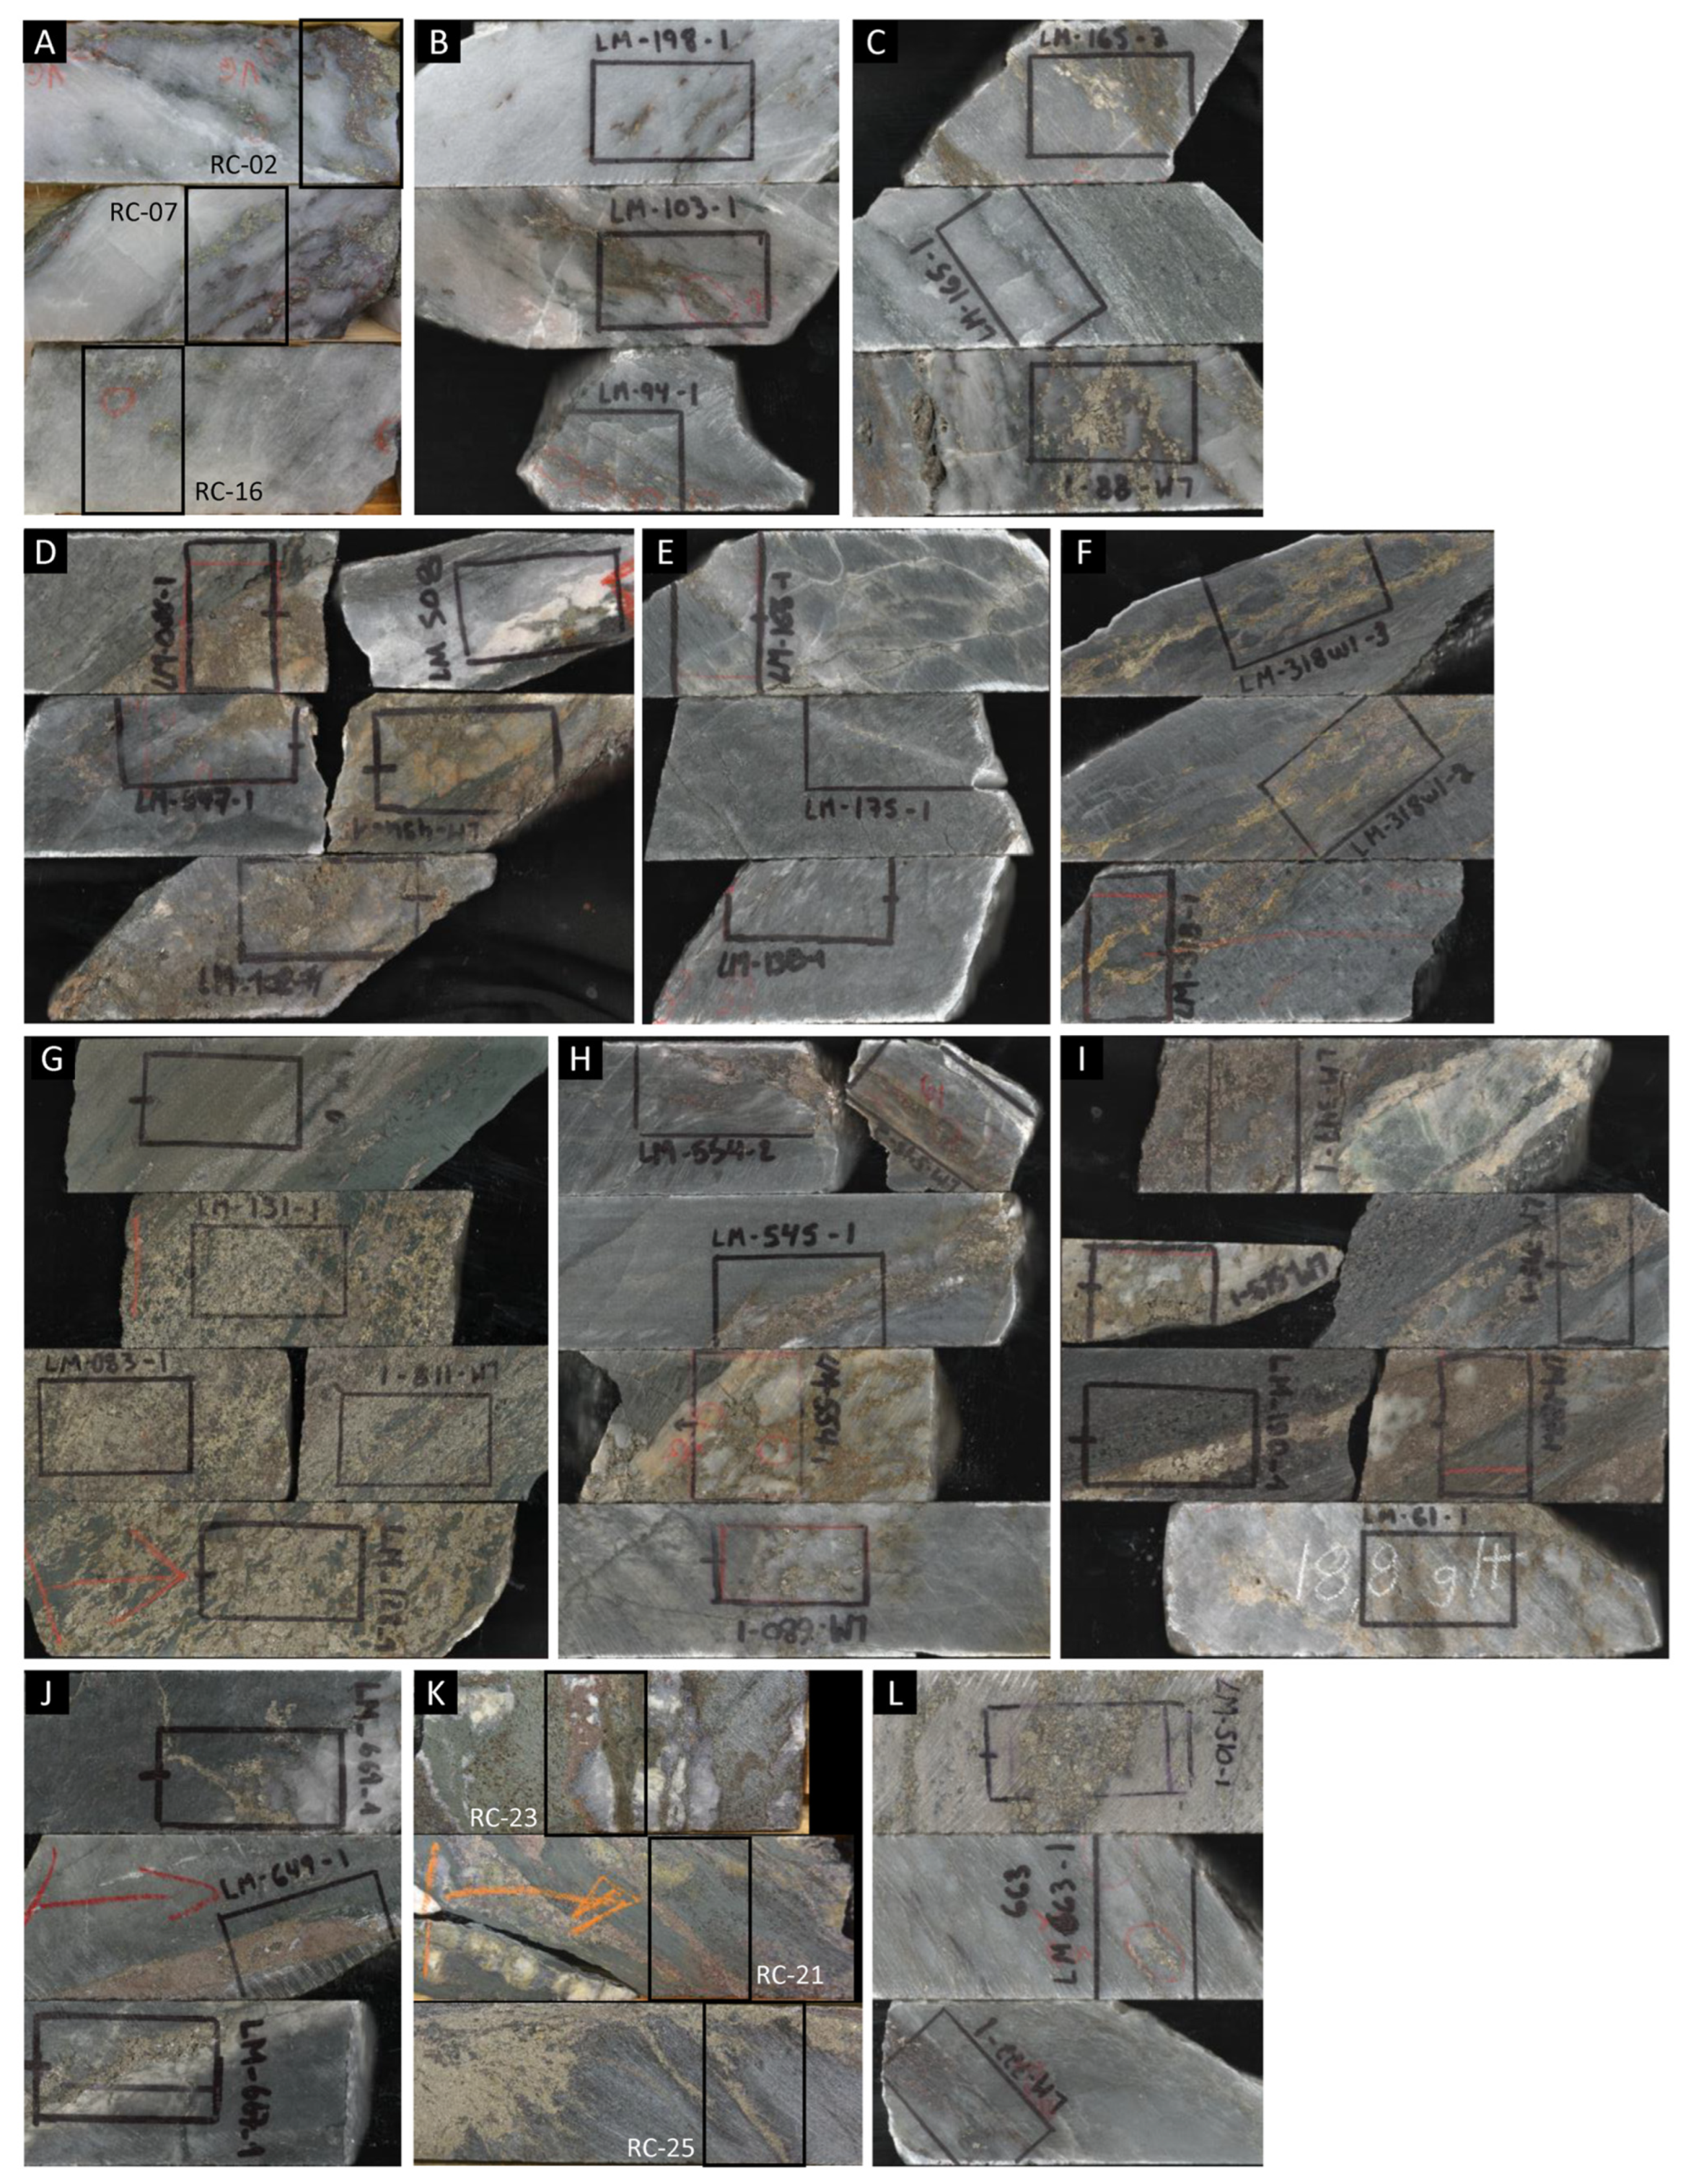
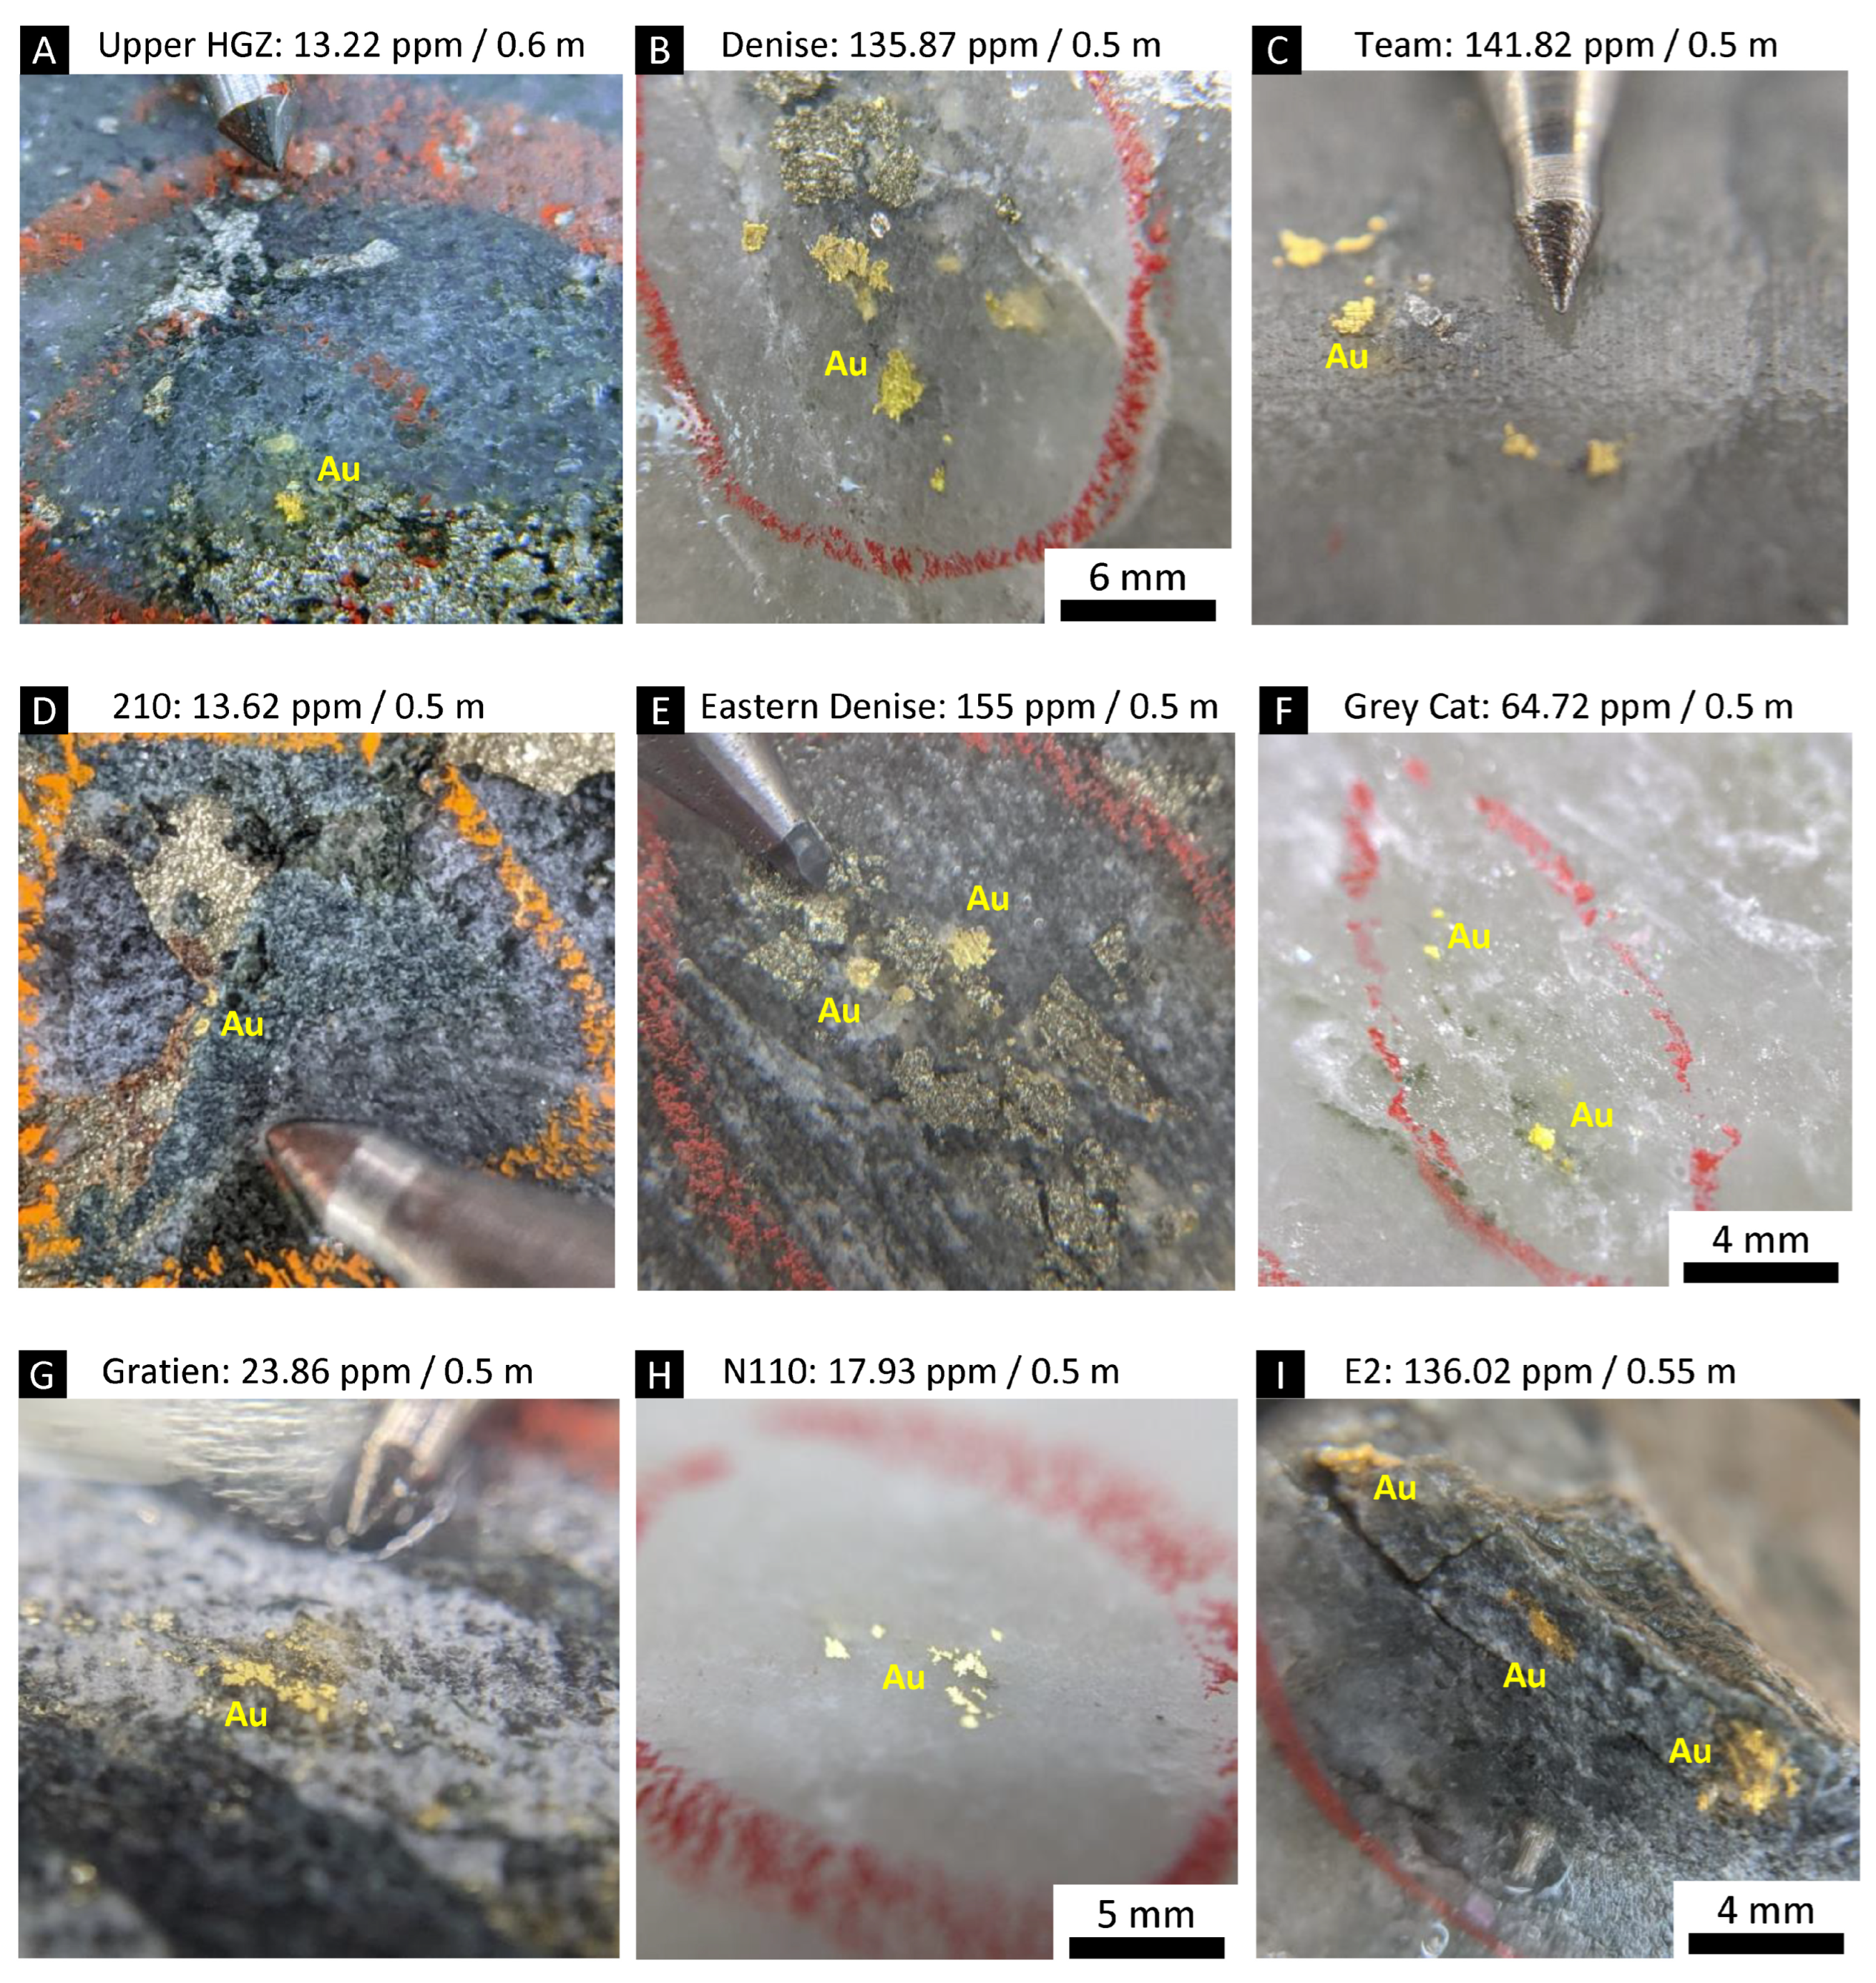
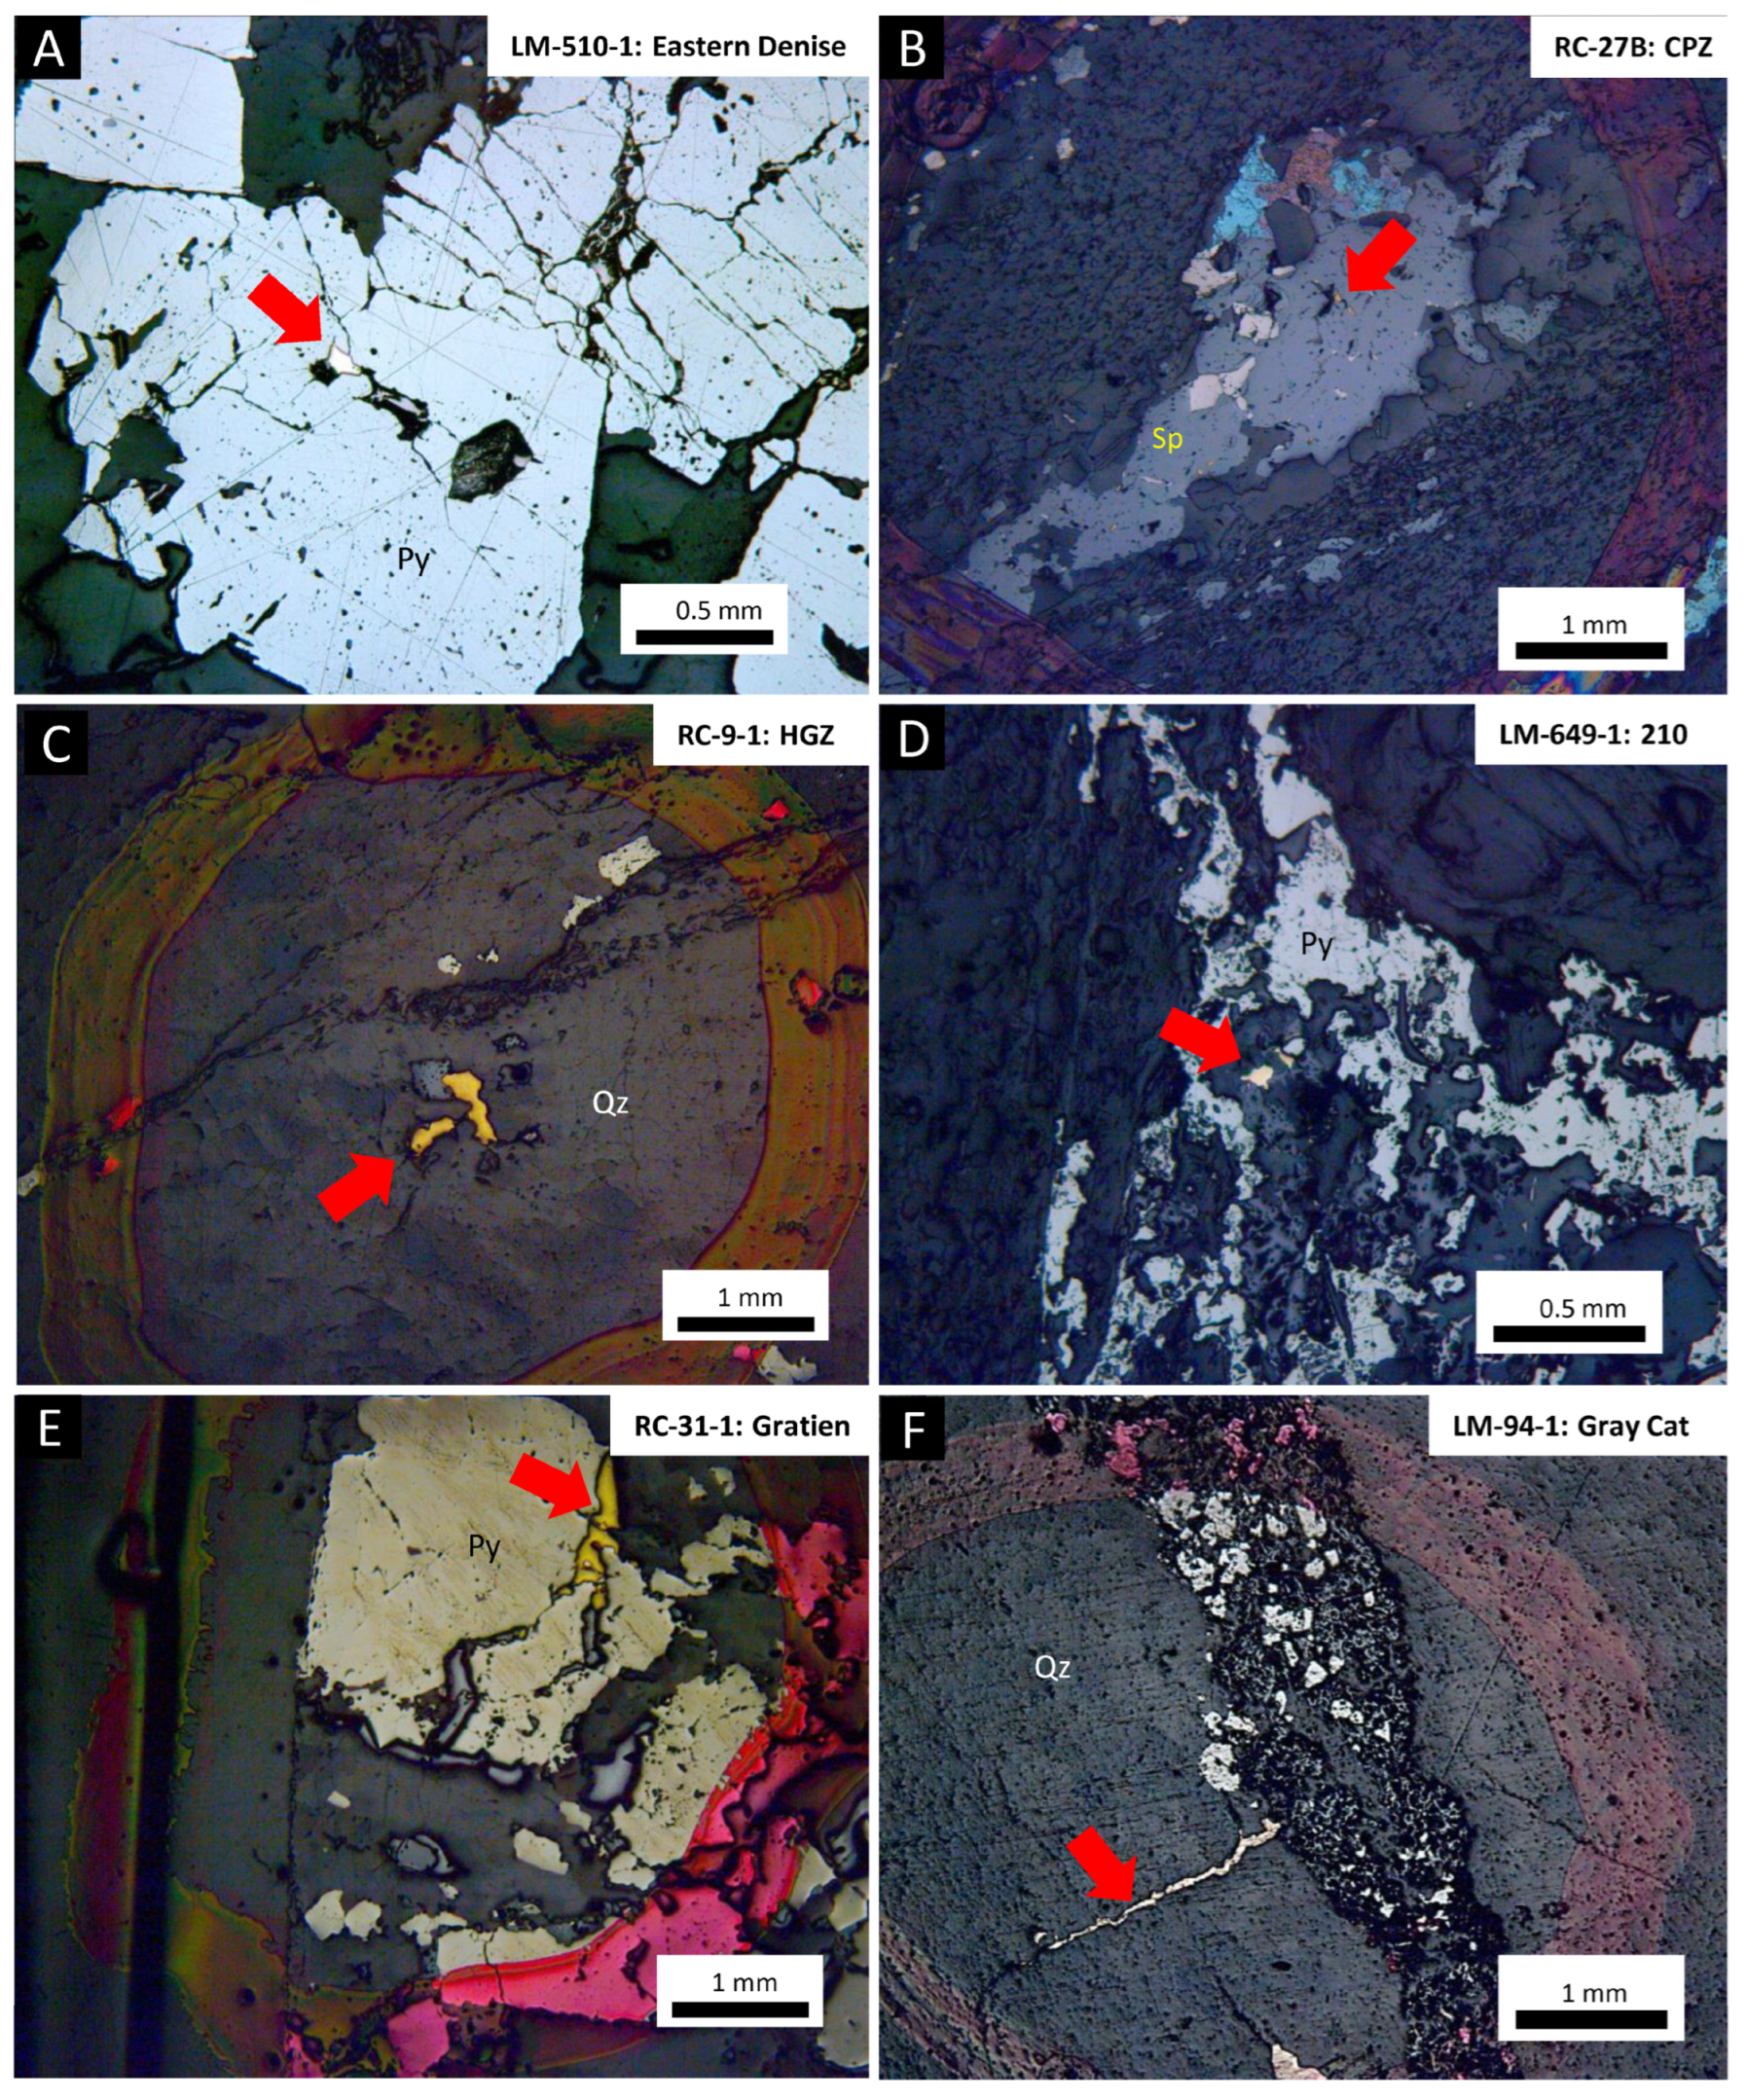
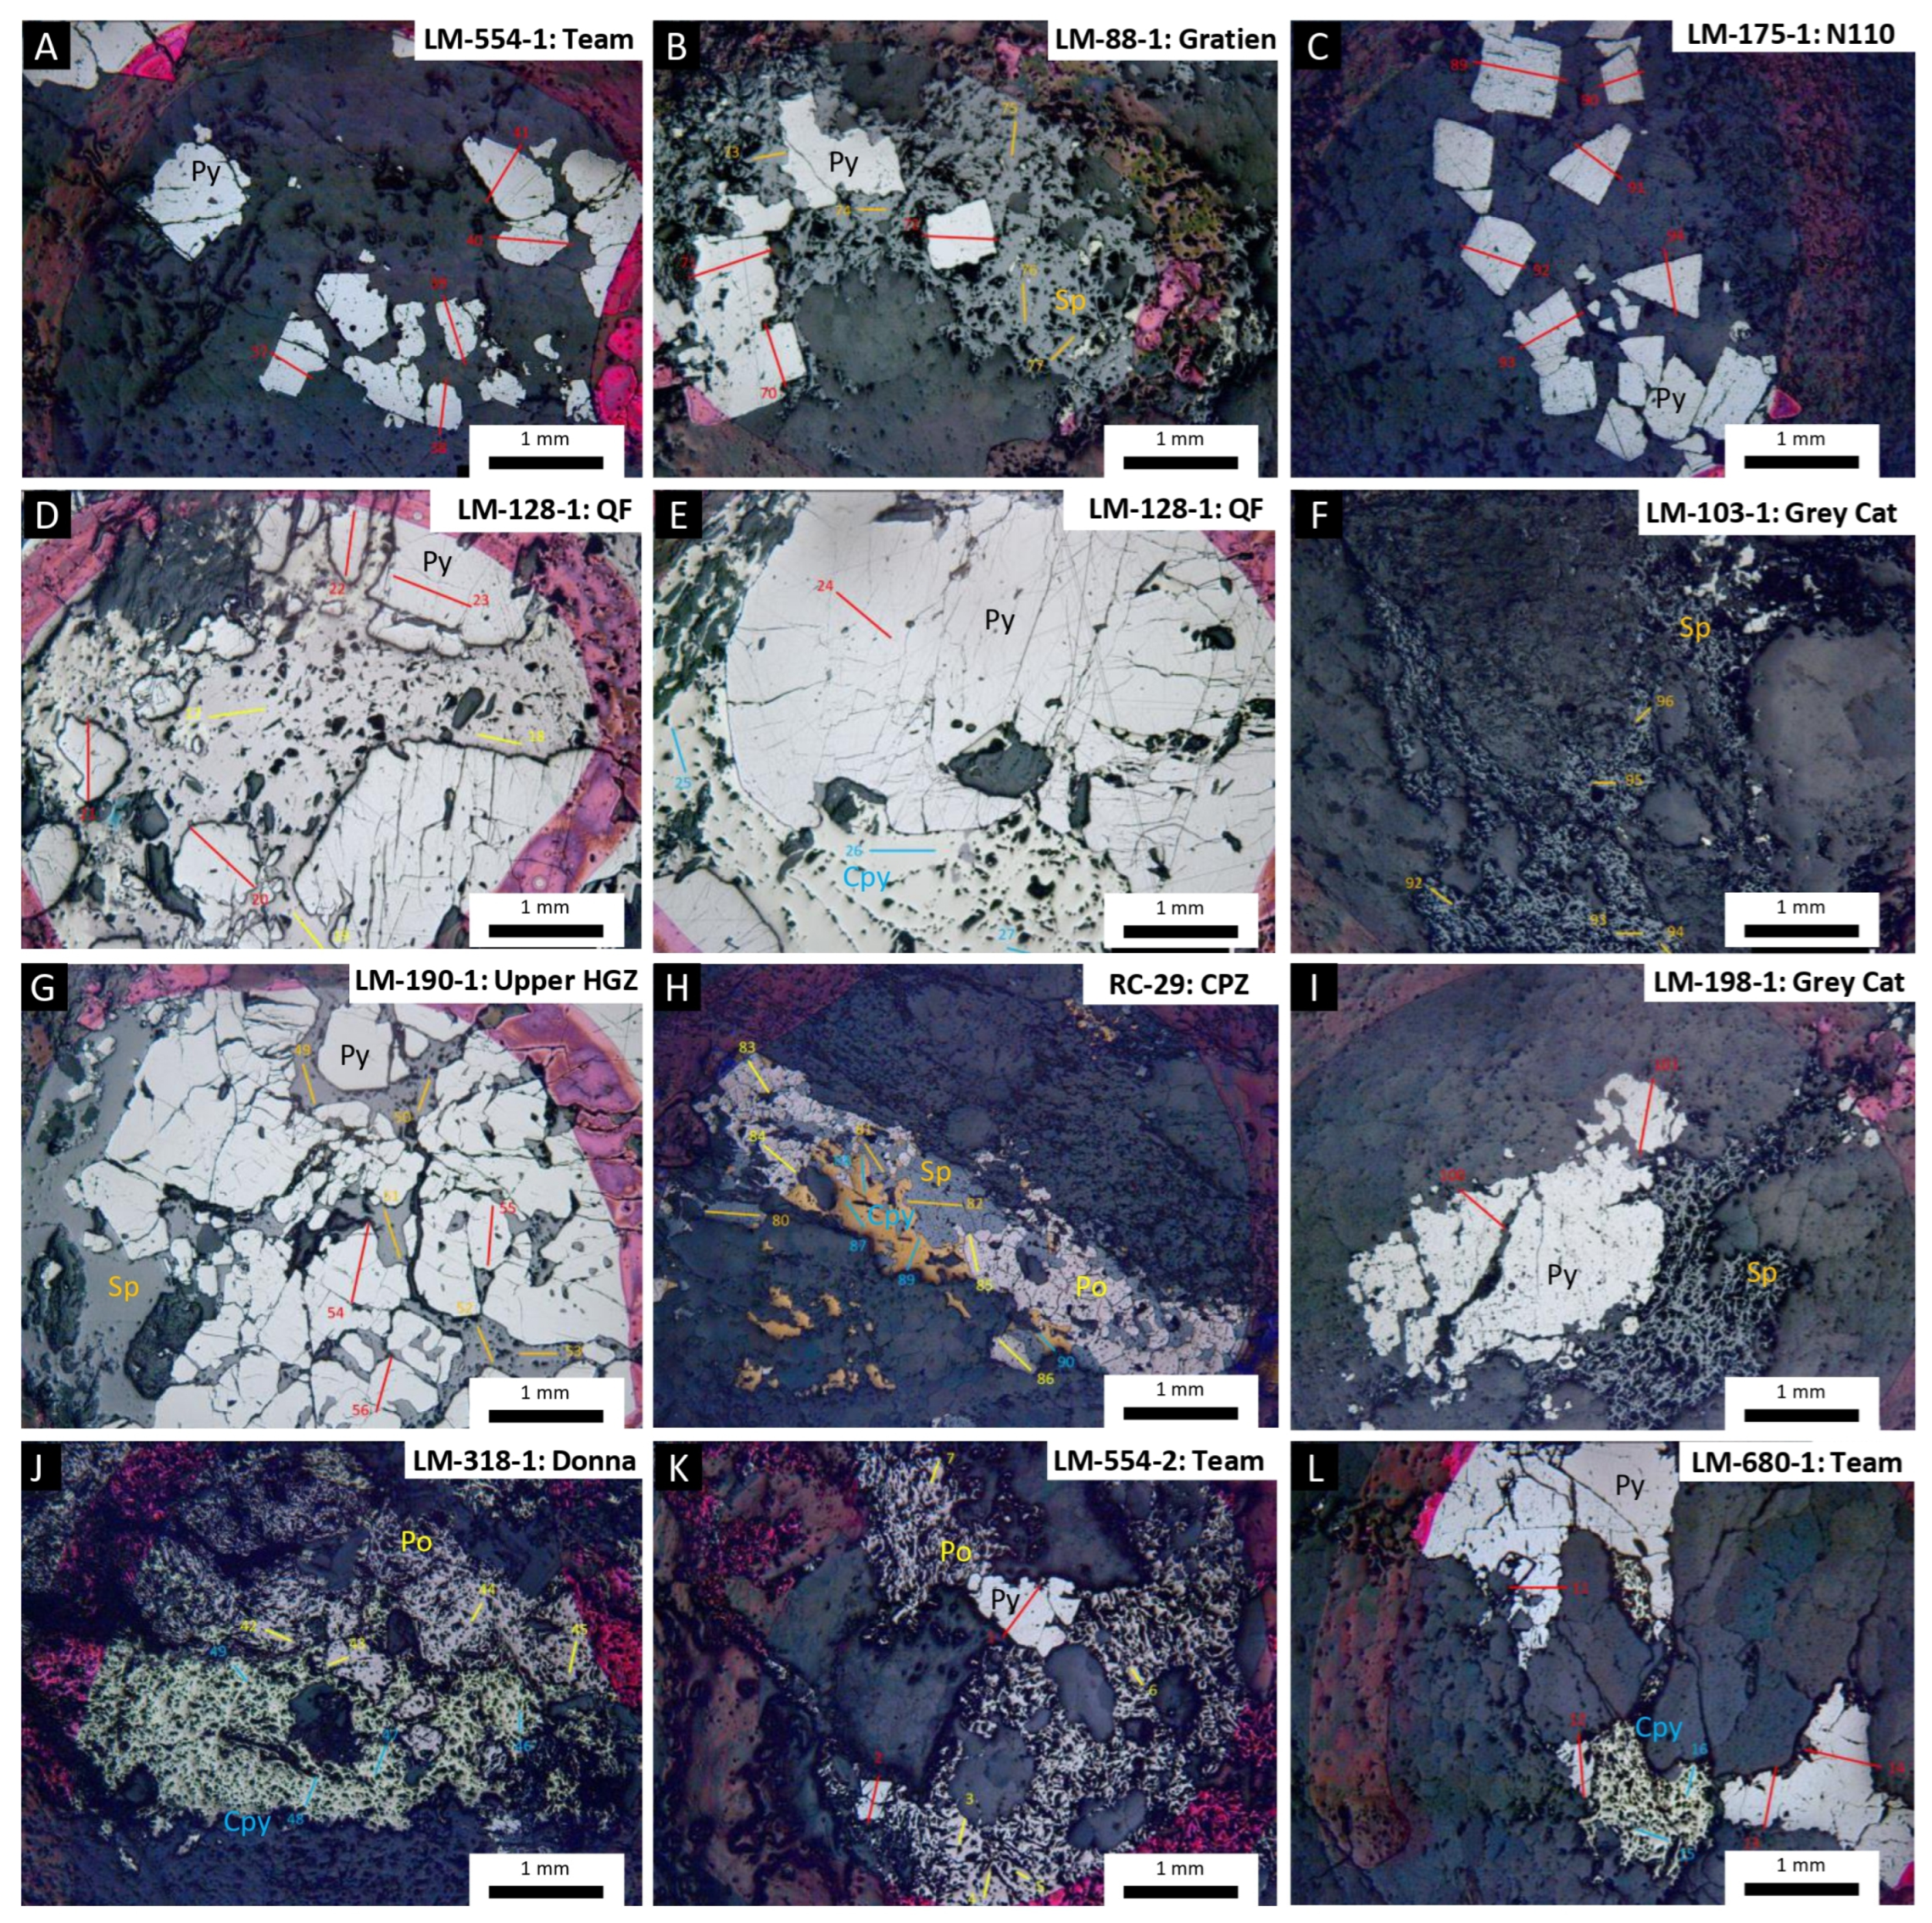
5.1. Gold Habit and Sulfide Textures

One particular feature of the gold mineralization at Perron is its occurrence as visible gold for all of the zones, except those interpreted as volcanogenic (Figure 5). Visible gold occurs mostly as yellowish irregular grains of <5 mm disseminated in quartz–carbonate veins and in host rocks that are spatially associated with sulfides. Locally, gold occurs as inclusions in pyrite (Figure 6A) and sphalerite (Figure 6B), as small grains in quartz veining (Figure 6C) and host rocks (Figure 6D), and as the filling of fractures in quartz (Figure 6E) and pyrite (Figure 6F).
Pyrite is present in all gold-bearing zones and is the dominant sulfide in the orogenic-related zones. In the orogenic and hybrid zones, pyrite is disseminated as subhedral aggregates in quartz (Figure 7A), as subhedral grains within sphalerite groundmass (Figure 7B), and as locally euhedral isolated crystals in quartz veinlets with variable internal porosity (Figure 7C). In volcanogenic mineralization, pyrite occurs as large aggregates of subhedral crystals and as isolated grains hosted in a groundmass of pyrrhotite (Figure 7D) and chalcopyrite (Figure 7E). Pyrite also occurs as rounded grains of primary origin (nodular) in sedimentary horizons of volcaniclastites and black shales, which define the Normétal deformation corridor.
Sphalerite is the second most important sulfide in abundance, and it occurs in all types of gold mineralization studied here. In the orogenic and hybrid zones, sphalerite occurs as void filling in quartz veins and along fractures (Figure 7F) and locally as groundmass surrounding pyrite crystals (Figure 7B,G). Sphalerite also defines the groundmass of massive sulfides associated with either chalcopyrite or pyrrhotite in volcanogenic zones (Figure 7H). It occurs with two textural habits regardless of the zone origin: (1) fine-grained aggregates with net-like texture and high porosity (Figure 7F,I) and (2) homogeneous groundmass interstitial to other sulfides (Figure 7G,H).
Pyrrhotite and chalcopyrite are mostly restricted to volcanogenic and hybrid mineralization. Both sulfides are absent in quartz–carbonate veins. They occur as stringers in host rocks (Figure 7J) and as groundmass in the massive sulfide mineralization (Figure 7D,E,H). Fine-grained aggregates with a net-like texture and high porosity, similar to that of sphalerite, characterize the stringer occurrences (Figure 7J–L). Conversely, the groundmass occurrences, which are interstitial to other sulfides in massive sulfide ore, are homogeneous (Figure 7D,E).
In short, pyrite and sphalerite are omnipresent in the gold-bearing zones. Pyrrhotite and chalcopyrite are more restricted to volcanogenic and hybrid mineralization and are absent in quartz veining. No specific texture of sulfide appears to discriminate among genetic types.

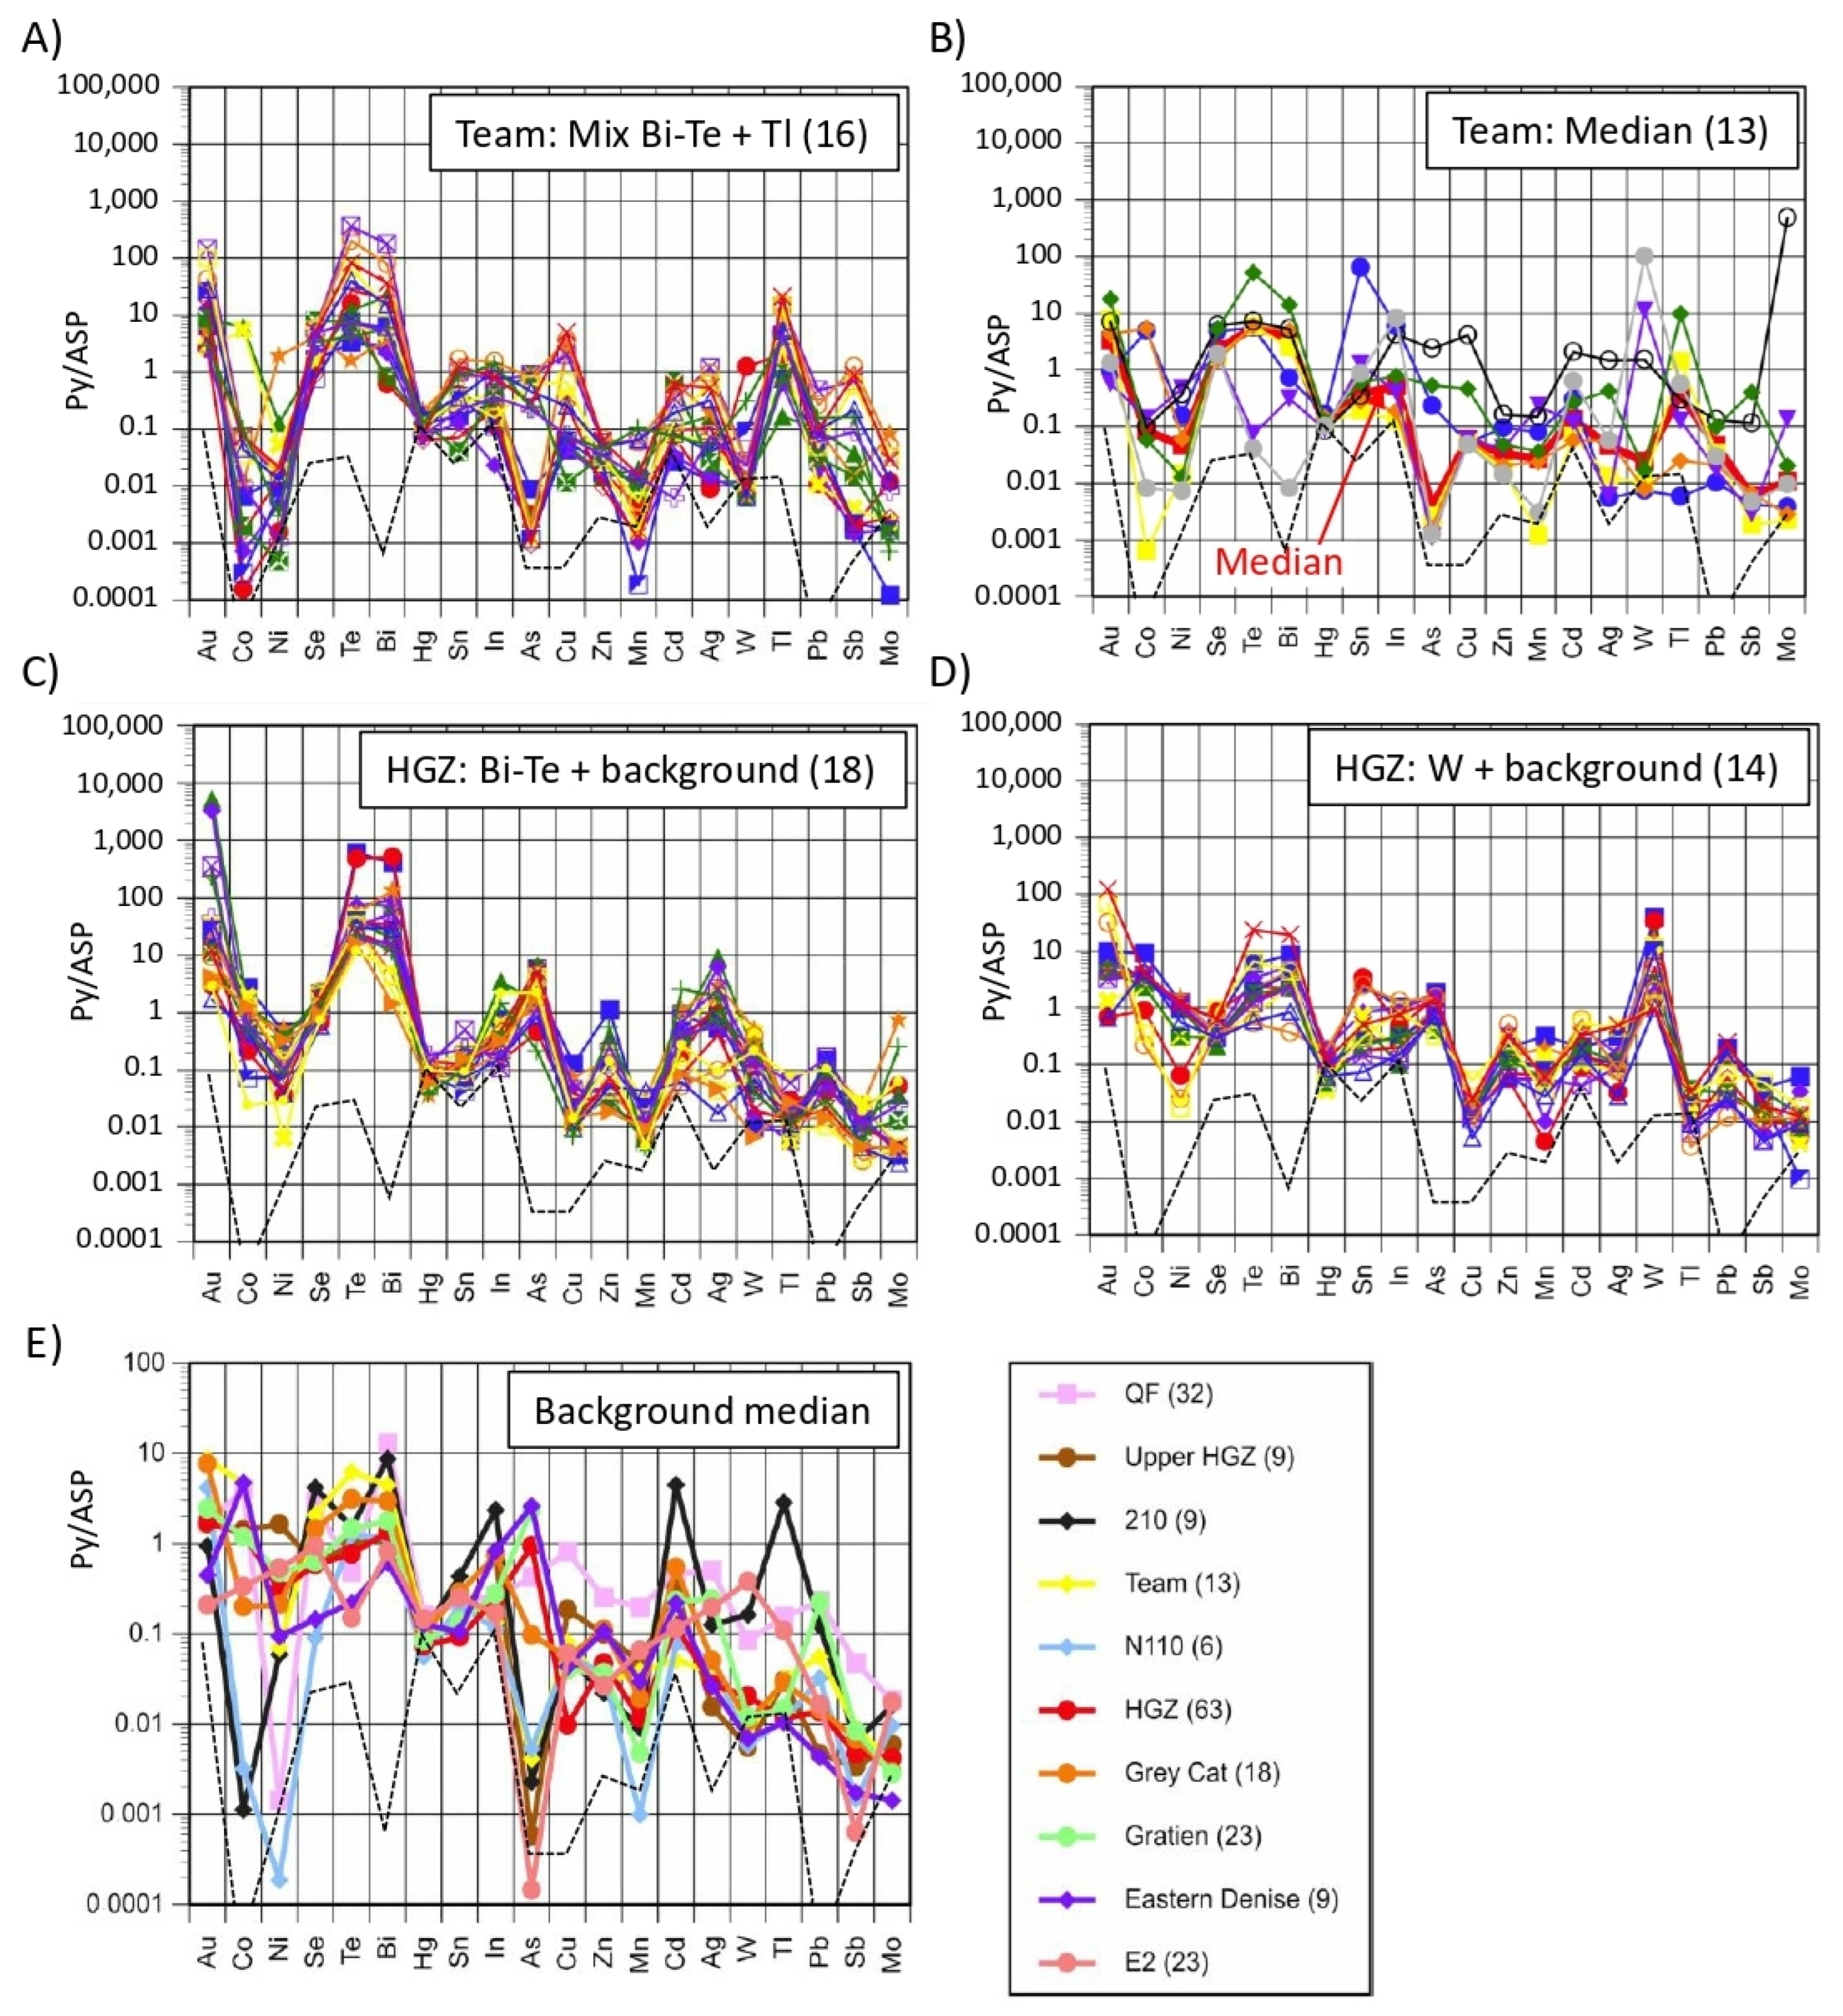
5.2. Pyrite Trace Element Composition

Pyrite grains were analyzed in 69 samples, in addition to the results from Gaboury et al. [8], for a total of 361 individual analyses from all gold-bearing samples studied. LA-ICP-MS trace element analyses of pyrite grains (Supplementary Materials, Figure S1) were generated (1) to compare the gold-bearing zones, (2) to consider the particular compositions for input about genetic processes, and (3) to test the potential remobilization of gold from volcanogenic zones.
The pyrite data were treated using the diagram of Gaboury et al. [8]. This diagram displays patterns of pyrite normalized to Archean sedimentary pyrite (ASP [8]), where the elements are sequenced in decreasing order of abundance for orogenic gold deposits. The resulting diagrams show the patterns of enrichment and depletion of the pyrite composition relative to the ASP standard, hence providing a quick way to compare the signatures for each zone.
The plots of the pyrite analyses for each zone display significant variations in the signature inside specific zones and even in pyrite grains within a thin section, implying that no direct comparison of the zones is possible (Figure S1). To individualize hydrothermal events, regardless of the zones, specific pyrite patterns were defined mostly based on the enrichment of a particular element or group of elements (Figure 8), such as (1) Tl, (2) Sn, (3) W, (4) In-Cd-Zn, and (5) Bi-Te-Au. The Tl pattern, which was defined in all analyses of the N110 zone, was characterized by Tl and Pb enrichments and Ni, As, and Sb depletions (Figure 8A). The Sn signature corresponded to a gain of Sn with the depletion of Co, Ni, and As (Figure 8B). The W signature was characterized by the enrichment of W and the depletion of Sb and As (Figure 8C). The In-Cd-Zn pattern was defined by the enrichment of these elements and the depletion of As (Figure 8D). Finally, the Bi-Te-Au signature corresponded to the enrichment of these elements, as well as Ag and As, and the depletion of Co, Ni, Cu, W, Zn, Tl, and Mo (Figure 8E). Gold was strongly enriched by up to 72,000 times relative to the ASP standard, clearly manifesting a gold-rich hydrothermal input. This signature is very well developed for the Eastern Denise Zone.
The pyrite data for each zone were grouped according to these specific signatures (Table S1). The Tl signature was defined only with data from the N110 Zone. The Sn signature was recorded in samples from the Donna, E2, Grey Cat, Team, and 210 Zones. The W signature was given by samples from the E2, CPZ, Team, 210, and Upper HGZ Zones. The In-Cd-Zn signature was defined in samples from the Upper HGZ, 210, Team, QF, N110, HGZ, Grey Cat, Gratien, Eastern Denise, and Denise Zones. The Bi-Te-Au signature was defined in samples from the Eastern Denise Zone.
Different pyrite signatures coexist in the same samples without significant textural differences (Figure 9). Furthermore, there is no particular sulfide assemblage, nor style of mineralization associated with specific signatures, such as the In-Cd-Zn signature of pyrite expected to occur in sphalerite-rich samples (Figure 9). The only exception is the sample LM-347-1 from the E2 Zone, where a subhedral large crystal of pyrite overprints groundmass pyrite with different signatures (Figure 9D). In short, the textural aspect is not discriminating for the signature of pyrites.
In addition to the five signatures established above, hybrid signatures were defined for the Team Zone and the HGZ. For the Team Zone, numerous samples showed a combination of the In-Cd-Zn and Bi-Te-Au signatures (Figure 10A). The remaining signature of the Team Zone (Figure 10B) highlighted the background signal of trace elements. The background signal was defined by considering only the pyrite signatures that were not allotted to one of the five specific patterns. For the HGZ, there were two different patterns mixed with the background signal: (1) the Bi-Te-Au signature (Figure 10C) and (2) the W signature (Figure 10D).
The median value was used to compare the different background signals from each zone (Figure 10E). The HGZ was considered the reference for the pyrite signature resulting from orogenic metamorphic fluids. The Upper HGZ and Team, Grey Cat, Gratien, and Eastern Denise Zones had comparable background patterns to that of the HGZ and were, thus, considered to be related to the same orogenic hydrothermal system. However, these background signals bore discrepancies relative to the pattern established for As-poor orogenic gold deposits in the Archean Abitibi belt (CONSOREM, internal compilation). Specifically, As and Bi-Te were higher than expected, and Hg was lower. The QF Zone was the reference for volcanogenic-related mineralization. The 210, N110, E2, and Eastern Denise Zones had different background patterns, suggesting that they were formed by different hydrothermal systems.
For the HGZ and Team Zone, gold was correlated with Te and Bi (Figure 11). From the five signatures established, only the Bi-Te-Au signature was correlated with gold. For the Eastern Denise Zone, where the Bi-Te-Au signature was defined, Au was also correlated with Bi and Te but based on a smaller number of samples (n = 10).

5.3. Sphalerite Trace Element Composition

A total of 135 analyses of sphalerite were available for this study. Since sphalerite occurs in most of the gold-bearing zones, except for QF, Donna, Team, and E2 Zones, the results of LA-ICP-MS were used to calculate the temperature of mineralization, hence adding possible constraints on the mineralizing processes.
The temperatures for sphalerite calculated with the GGIMFis geothermometer [34] were very similar for all of the gold-bearing zones, with the median values ranging from 348 °C for the Gratien Zone to 398 °C for the Denise Zone (Table 1 and Table S4). This narrow temperature difference of 50 °C was within the uncertainty of the geothermometer [34] and, consequently, not usable for deciphering specific hydrothermal systems.
The plotting of selected elements for each zone showed very similar patterns inside a specific zone and from zone to zone (Figure S2). The median values of each element by zone were plotted to compare the patterns of each zone more directly (Figure 12A). Although the patterns were similar, there are variations of four orders of magnitude for Co and Ni and three orders of magnitude for Ag, As, Au, In, Pb, and Tl (Figure 12A).
Binary plots of Co vs. In, Co vs. Ni, and Ag vs. Pb (Figure 13A–C) were used to obtain more information about the relationships of the gold-bearing zones. In the Co vs. In diagram (Figure 13A), the samples from the Gratien, Eastern Denise, Upper HGZ, HGZ, Grey Cat, CPZ, and Denise Zones showed a coherent trend of distribution, supporting a genetic link. Furthermore, the calculated temperatures progressively increased from the Gratien Zone (348 °C) to the Denise Zone (398 °C). In this plot, the 210 and N110 Zones were outsiders, supporting their different origins. The Co vs. Ni plot (Figure 13B) yielded a similar relationship, but with more variable Ni content for the CPZ, Grey Cat, and Denise Zones. The Ag vs. Pb plot (Figure 13C) highlights the similarity between the Denise and the CPZ Zones, with higher values of Ag and Pb. All other zones plotted in the same cluster.
In short, the sphalerite data did not allow discrimination of hydrothermal systems with respect to temperature. However, sphalerite appeared to be related to the same orogenic hydrothermal system for the Gratien, Eastern Denise, HGZ, Upper HGZ, and Grey Cat Zones. The volcanogenic CPZ shared similar clustering with the Denise Zone, suggesting that the Denise Zone is, in part, related to a volcanogenic hydrothermal system.

5.4. Pyrrhotite Trace Element Composition

A total of 113 analyses of pyrrhotite were generated. The pyrrhotite analyses were treated similarly to those of sphalerite. As with sphalerite, the plots of the selected elements for each zone showed very similar patterns inside specific zones and from zone to zone (Figure S3). The median values of each element by zone were plotted to compare the patterns of each zone more directly (Figure 12B). Although the patterns were similar, there were variations of four orders of magnitude for Co and Ni. These two metals can substitute for Fe2+ in pyrrhotite [35] and, hence, have the potential for discriminating among hydrothermal systems. Three different clusterings were defined in the Ni vs. Co plot (Figure 13D): (1) higher Co content (>11 ppm) with variable Ni concentration, including volcanogenic-related zones, such as the CPZ, Donna, QF, Denise, and Grey Cat Zones; (2) low Co (<11 ppm) but higher Ni content (>1 ppm), where samples showed a coherent trend of distribution with variations in Co at a specific Ni content, including the HGZ, Eastern Denise, Upper HGZ, Team, and E2 Zones and samples from the 210 Zone; (3) low Co (<11 ppm) and low Ni (<1 ppm), where clustering was less defined, with samples from the QF, 210, and N110 Zones. The clustering was not perfectly defined for the N110 and QF Zones, where samples are plotted within the volcanogenic field and outside. Furthermore, the samples from the orogenic Grey Cat Zone plot in the volcanogenic field. The implications are discussed below.
In short, the pyrrhotite data support the grouping of the Denise Zone with the volcanogenic-related system, sharing the high Co content with the QF and Donna Zones, and the CPZ, but with higher Ni content. Although the pyrrhotite content of the orogenic zones was very weak, their signature supported a similar origin, where the Ni concentration progressively increased from the Team, Upper HGZ, E2, and Eastern Denise Zones to the HGZ. Finally, the 210 and N110 Zones appeared to be different systems, as suggested by their sphalerite compositions.

5.5. Chalcopyrite Trace Element Composition

The chalcopyrite data were treated similarly to those of pyrrhotite and sphalerite. Chalcopyrite was less abundant in the various zones, accounting for a lower number of analyses (n = 57). Plots of the elements for each zone also showed a similar pattern within each zone (Figure S4). The median values were used to compare the various zones (Figure 12C). Overall, the chalcopyrite grains were enriched (>1 ppm) in Ag, Bi, Cd, In, Pb, Se, Sn, and Zn. Although the median patterns for each zone were similar, there are variations of three orders of magnitude for Co, Ni, Au, Ga, and In. Co and Ni are of interest because they can substitute for Fe2+ and Cu2+ in chalcopyrite. The Co and Ni plot (Figure 13E) displayed a specific grouping for the Donna, CPZ, Denise, and QF Zones, hence confirming their volcanogenic-related interpretation. The samples from the Team Zone and Upper HGZ had a lower Ni content but a specific Co content, suggesting that chalcopyrite was not related to a volcanogenic hydrothermal system. Finally, the three analyses from sample LM-118-1 from the QF Zone plot away from the volcanogenic grouping. This relationship was also recorded for pyrrhotite (Figure 13D), and the implications are discussed below.

5.6. Origins of the Various Gold-Bearing Zones

According to the textural and metamorphic relationships, the origins of the gold zones are established with confidence as orogenic (HGZ, Grey Cat and Gratien Zones) and volcanogenic-related (QF, CPZ, and Donna Zones). The origin of the other zones could be interpreted using their sulfide trace element signatures on a comparative basis. Table 1 shows the parameters established in this study: (1) temperature of mineralization; (2) the distribution of the five signatures established in the pyrite analyses; (3) the pyrite background pattern; (4) the genetic link established through the comparison of sphalerite, pyrrhotite, and chalcopyrite. From the compilation, the following interpretation is proposed based on the dominant hydrothermal system for the hybrid zones: (1) orogenic-dominant: Team, Upper HGZ, Eastern Denise, and E2 Zones; (2) volcanogenic-dominant: Denise Zone. The N110 and the 210 Zones appear to be related to different hydrothermal systems.

5.7. Comparison of Pyrite and Pyrrhotite

The aim of comparing pyrite and pyrrhotite was to determine if pyrrhotite was of metamorphic origin or if it was an integral component of the orogenic hydrothermal system. In the first case, it was expected that the elemental patterns of pyrrhotite would be different from those of pyrite, with lower concentrations [36], as the metamorphic desulfidation of pyrite to pyrrhotite is a purifying mechanism involving the expulsion of trace elements (e.g., [37,38]). Conversely, if pyrrhotite was genetically related to pyrite, then they would share similar patterns of trace elements. In such a case, pyrrhotite rather than pyrite could be related to S deficiency, minor differences in the redox (fO2) and pH conditions, or a higher temperature of the mineralizing system (e.g., [39]).
The plots of the medians for the various zones display a large discrepancy between the signatures of both pyrite and pyrrhotite for each zone (Figure 14). In fact, no pyrrhotite has a signature similar to that of pyrite in the same zone. Despite these discrepancies, the level of trace elements was within the range of those of pyrite and even higher for Co and Ni (Figure 14). Overall, the signature of pyrrhotite appears to be the opposite of that of pyrite; a higher elemental content in pyrite corresponds to a lower content in pyrrhotite and vice versa (Figure 14). We conclude that pyrite and pyrrhotite were not related to the same hydrothermal event. This is coherent with the textural relationship, where pyrite systematically overgrew pyrrhotite (Figure 7). One hypothesis is that pyrrhotite was an early metamorphosed product, whereas pyrite was formed later by metamorphic fluids. Conceptually, the conversion of early pyrite into pyrrhotite during metamorphism can provide metals to metamorphic fluids for forming orogenic gold deposits [40,41,42]. This concept can be tested by comparing the metal contents of pyrite and pyrrhotite to determine the gains and losses of metals [20]. Figure 15A–C display the averages of pyrrhotite vs. pyrite in the same sample for specific zones. Although there were variations between zones and even between samples in the same zone, the following trace elements were systematically depleted from pyrrhotite: Au, In, Te, and Tl; however, W, Sn, Cd, and Bi were commonly depleted but at more variable levels. These trace elements were probably transferred to metamorphic fluids and contributed to the formation of pyrite. It is noteworthy that the five pyrite signatures established previously corresponded to these trace elements. The genetic implications are discussed below.

5.8. Comparison of Pyrite with Chalcopyrite and Sphalerite

The comparison of pyrite with chalcopyrite and sphalerite is limited by their number of analyses. Figure 15F displays the averages of chalcopyrite vs. pyrite in the same samples for the QF Zone. Comparison with the pyrrhotite vs. pyrite diagram (Figure 15D) reveals a similar pattern of gains and losses, where Au, Te, W, and Tl are depleted in chalcopyrite. This similarity is expected because the chalcopyrite is interpreted to be volcanogenic in origin. Therefore, chalcopyrite was also probably metamorphosed and provided similar elements to be transferred to metamorphic fluids.
For sphalerite, the number of analyses with pyrite in volcanogenic zones is too low to provide a reliable comparison (Table S1). However, the orogenic HGZ is richer in sphalerite. The comparison of the sphalerite vs. pyrite (Figure 15G) displays a different pattern of gains and losses related to crystallographic control of the trace element incorporation in sphalerite coexisting with pyrite. Specifically, the crystallographic control is indicated by the gains in Hg, In, and Cd, which are elements typically enriched in sphalerite [43].

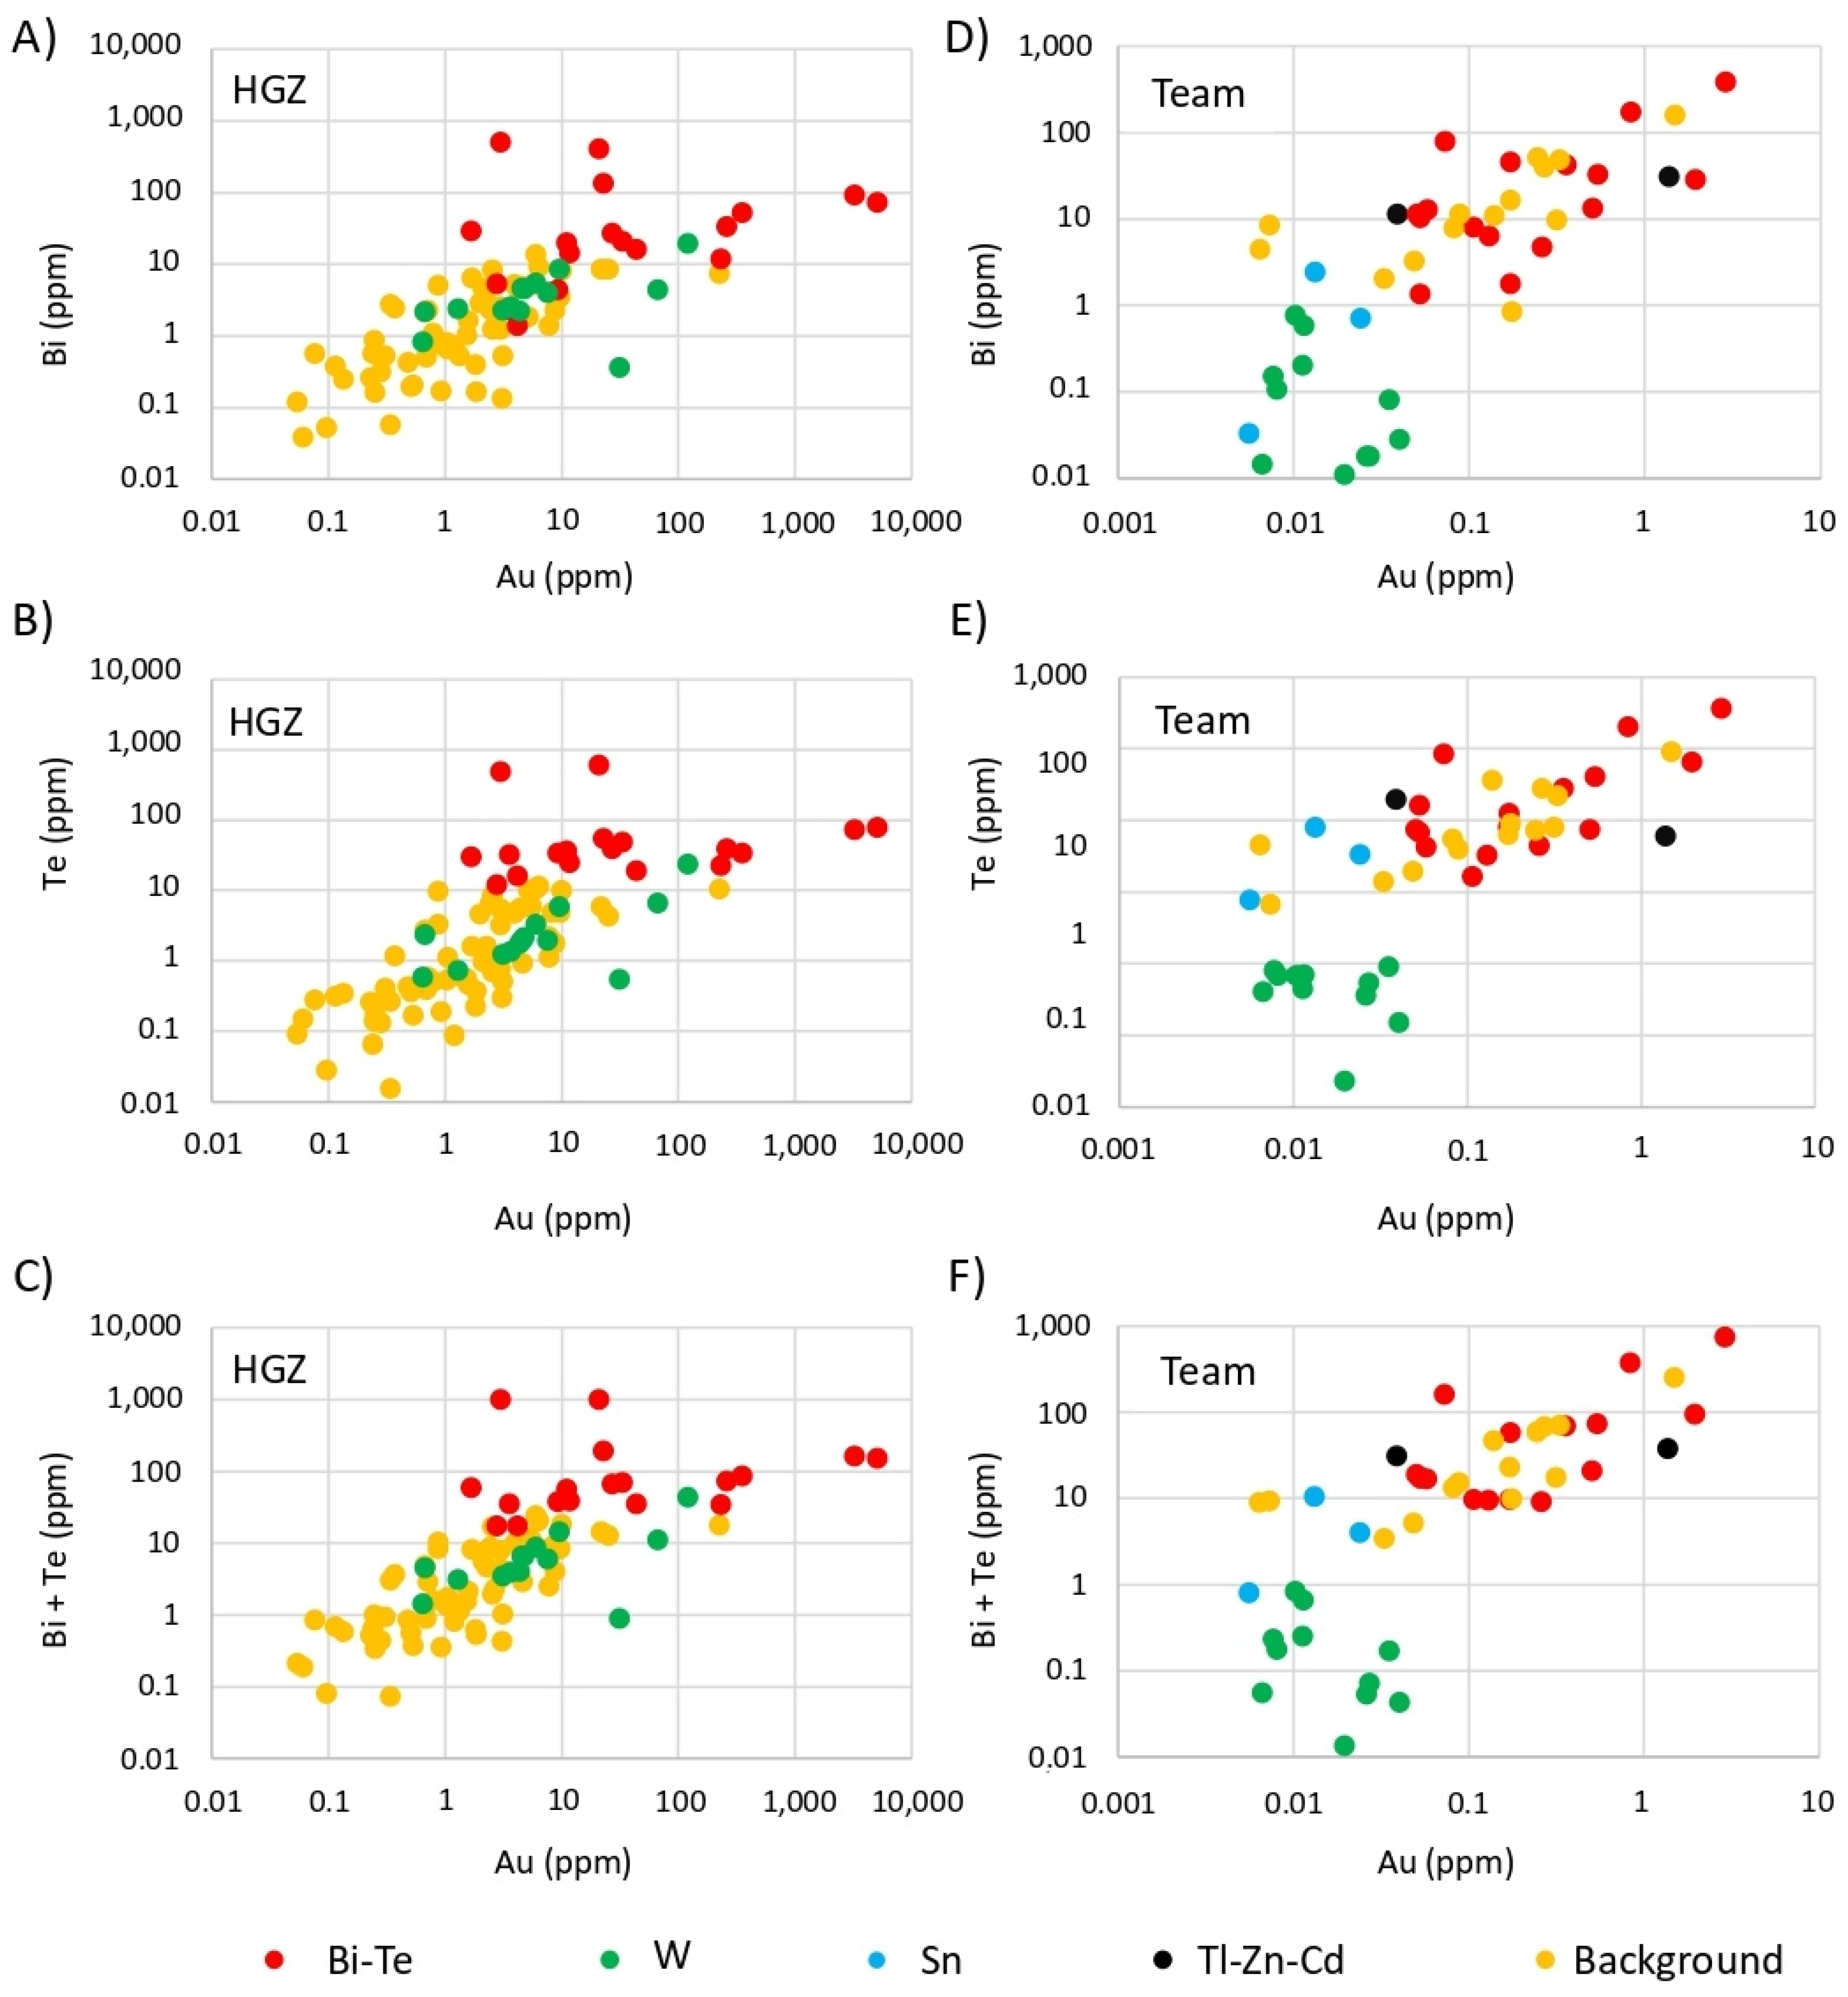
5.9. Pyrite Signature and Visible Gold

Pyrite analyses were selected where visible gold grains were present in thin sections to test if there was a special pyrite signature associated with visible gold. Thin sections were taken from the HGZ (n = 7), Denise (n = 2), Gratien (n = 2), and Grey Cat (n = 1) Zones, all of the orogenic origin. From the five signatures established for pyrite, only the Bi-Te-Au signature was commonly associated with visible gold. Of the 12 thin sections with visible gold, 9 contained pyrites with a Bi-Te-Au signature. Although non-systematic, this relationship is significant and is discussed below.

6. Discussion

6.1. Validity of the Classification of Gold-Bearing Zones

The classification of the zones in terms of being volcanogenic or orogenic depends on the trace elements in sphalerite, pyrrhotite, and chalcopyrite. The metamorphism affected pyrrhotite, probably chalcopyrite, and some sphalerite. The validity of using trace elements from these sulfides can be questioned. Furthermore, it is interpreted that the pyrite in all of the gold-bearing zones is orogenic and late-metamorphic in origin; hence, it is useless for the genetic classification of the studied zones.
Sample LM-118-1 from the volcanogenic QF Zone is of importance for supporting the proposed interpretations. This sample corresponds to massive sulfides with large aggregates of pyrite with chlorite and the remaining interstitial pyrrhotite and chalcopyrite (Figure 16A–C). For this sample, the pyrrhotite and chalcopyrite plotted away from the volcanogenic field (Figure 13D,E) and more toward the orogenic zones. It is, thus, interpreted that even if pyrrhotite and chalcopyrite are primary, their trace element composition changed during the influx of metamorphic fluids. The occurrence of chlorite with pyrite is a mineralogical association supporting retrograde metamorphic fluid flow. The median data on pyrite from the QF Zone (Figure 10E) also support this interpretation. The QF pattern, except for the depletion of Ni, displays a similar pattern to that of the orogenic zones, although it is slightly more enriched.
The validity of such a re-equilibration process implies that some pyrrhotite with a volcanogenic signature should have been preserved locally in orogenic mineralization. The Grey Cat Zone is the validation of such preservation, where all four samples were clustered in the volcanogenic field (Figure 13E). The pyrrhotite grains analyzed occur in the host rocks with chalcopyrite (Figure 16D).
This re-equilibration of trace elements during the influx of orogenic fluids can also be perceived due to the Co content of sphalerite (Figure 13A,B). The data from the orogenic zones showed the spread from the very low Co content (0.003 ppm) in the Gratien Zone to the high Co content in the HGZ (1471 ppm), trending toward higher values of Co for sphalerite from the volcanogenic zones. This spread of Co values is also recorded in specific zones, such as from 0.03 to 1471 ppm in the HGZ.
In short, the preservation of the primary volcanogenic signature and late fluid-induced re-equilibration are processes supporting the proposed classification. It is considered that the established genetic classification of the gold-bearing zones based on trace element contents of sphalerite, pyrrhotite, and chalcopyrite is robust, even if the paragenesis of sulfides is not well constrained.

6.2. Source for the Gold in Orogenic Gold Mineralization

Recent advances have focused on a sedimentary source of gold for orogenic deposits based on the metamorphic dehydration of sediments that are rich in organic matter and gold-bearing nodular pyrite [11,40,41,42,44,45]. This source is considered the most important for recent deposits and districts, such as Sukhoi Log in Russia [46], Bendigo in Australia [47], Muruntau in Uzbekistan [48], Otago Schist in New Zealand [49,50], Homestake in the USA [15], the Nubian shield in Sudan [51], and the Luk Ulo Complex in Indonesia [38]. Although a recent study supported a sedimentary source for the gold deposits of the southern Abitibi belt [52], the sedimentary source is largely questioned for Archean orogenic gold deposits where volcanic rocks are dominant [53,54,55].
The pyrrhotites at Perron have a similar trace element pattern for all of the gold-bearing zones, regardless of their origin being volcanogenic or orogenic. Conn et al. [36] demonstrated that despite the recrystallization of pyrite to pyrrhotite and the subsequent remobilization of some trace elements in metamorphic fluids, Co, Ni, and As, which were structurally bound in these Fe-bearing sulfides, still retain elevated concentrations in the conditions of amphibolite facies. Mobile elements, such as Tl, Sn, W, Bi, Te, Au, In, Cd, and Zn, in the pyrrhotite at Perron were depleted, but Co, Ni, and As were retained (Figure 14). Clearly, the pyrrhotite has a metamorphic signature. Such a metamorphic overprinting on primary volcanogenic pyrite (or pyrrhotite) explains the uniformity of the resulting pyrrhotite composition for all of the gold-bearing zones studied. Consequently, the pyrrhotite in orogenic-related zones corresponds to a volcanogenic metamorphic heritage overprinted by later orogenic mineralization, whereas the pyrite in the volcanogenic-related zones (CPZ, QF, and Donna Zones) corresponds to later overprinting induced by orogenic-related fluids. This interpretation is coherent with the five signatures of pyrite established, regardless of whether the mineralization was volcanogenic or orogenic (Table 1 and Table S1).
The peak pressure and temperature of the metamorphism were calculated using the equations of Zenk and Schulz [56] for calcic amphiboles. The pressure values ranged from 4.7 to 6.1 kbar with a median of 5.6 kbar, whereas the temperature reached a median of 599 °C with values from 545 to 630 °C [8]. These were the conditions of the amphibolite facies and were interpreted as a contact metamorphism induced by the nearby Patten pluton [8]. In short, the metamorphic conditions are within the documented range for converting primary pyrite into pyrrhotite [36,57].
The most striking outcome of the metamorphosed pyrrhotite lies in its trace element patterns, which are antithetic to those of pyrite (Figure 14); the pyrites were enriched with elements lost by pyrrhotite. This is a convincing relationship showing that pyrrhotite provided mobile metals (Tl, Sn, W, Bi, Te, In, Cd, and Zn) and especially gold for mobilization into metamorphic fluids and for the formation of metamorphogenic pyrite in orogenic ore zones. The calculated gains and losses for specific thin sections with both pyrites and pyrrhotites are supportive of this concept (Figure 15).
Orogenic gold deposits have a typical pathfinder in the form of As, Sb, B, Se, Te, Hg, Bi, Mo, and W [58]. Phillips and Powell [58] proposed that hydrogen sulfide is the most suitable ligand because Au1+ has an elevated electronegativity value for sulfur (a value of 2.58 in Pauling units), favoring covalent bonding. Arsenic, Sb, B, Se, Te, Hg, Bi, Mo, and W also have Pauling values of >2, hence accounting for this classical pathfinder signature. In comparison, the pyrites at Perron are enriched only with Te, Bi, and W relative to the typical pathfinder signature for orogenic gold deposits.
Pyrites from the Archean Yilgarn craton in Australia are enriched in Cu, Co, Pb, Se, Zn, Sn, and Bi for VMS deposits, whereas orogenic gold pyrites have higher levels of Ni, As, Au, W, and V [16]. In comparison, the pyrites at Perron only have W enrichment relative to the orogenic pyrites from the Yilgarn craton. The background signatures of pyrites from the orogenic zones at Perron also differ from the compilation of orogenic gold deposits in the Abitibi belt, as they are enriched in Cd, In, Bi, and Te, with As being either depleted or enriched (Figure 10E).
In addition, the Tl, Sn, In, Cd, and Zn enrichments in the pyrites at Perron are not typical of the orogenic gold pathfinder. In short, the Perron orogenic pyrites do not have the classical orogenic signature. The validation of the concept of the extraction of gold and trace metals from the metamorphosed pyrrhotites is, thus, supported by (1) the specific composition of the pyrites relative to the Australian signatures and (2) the fact that the depleted metals in the pyrrhotites are enriched in the pyrites. However, it is not clear if the remobilization of mobile metals is a local (cm to m) or larger-scale (km) phenomenon.
The HGZ is the richest and the only gold-bearing zone without a significant amount of pyrrhotite. The HGZ is a sub-vertical quartz vein conduit that was traced down by drilling to 1260 m. Because pyrrhotite is very rare, local remobilization can be ruled out for the formation of this orogenic gold zone. Hence, it is interpreted that metamorphic fluids were channeled into the conduit from a deeper reservoir. Nevertheless, remobilization at the local scale, especially for the hybrid and some orogenic zones, such as the Upper HGZ, E2, N110, Team, and 210 Zones, cannot be ruled out. In particular, the presence of different pyrite signatures in the same thin section (Table S1; Figure 9) could be related to the mixing between local and more regional remobilization of trace elements in pyrite.
The remobilization of gold from volcanogenic mineralization into orogenic gold-bearing quartz veins is not a new concept. Hutchinson [59] promoted this concept, mostly based on the common occurrences in the same district of VMS and orogenic gold deposits in the Abitibi belt. However, the antithetic signatures of pyrrhotite and pyrite are the first convincing documentation of this phenomenon in the Abitibi belt. The greater metamorphism at amphibolite facies overprinting the volcanogenic mineralization at Perron is probably the reason why this demonstration of remobilization is possible, as greenschists are the dominant facies in most mining districts in the Abitibi belt [60,61].

6.3. Why the HGZ Is So Rich in Gold

The HGZ is one of the richest orogenic veins in the world, with gold grades that are commonly >30 g/t Au and several assays showing that they are above 500 g/t Au [8]. Based on volatile analyses of fluid inclusions, Gaboury et al. [8] established that the mineralizing fluids for the HGZ were not aqueous but, rather, comparable to fossil gas composed mostly of hydrocarbons (methane, ethane, and possibly butane, propane, and other unidentified organic compounds) and rich in CO2, with N2 and traces of Ar, H2S, and He. It was interpreted that this unusual fluid has a high capacity for transporting gold and zinc as hydrocarbon–metal complexes or as colloidal gold nanoparticles to account for the richness of the HGZ [8].
The new data on pyrite yield an additional possibility for accounting for this richness in gold. Of the five different signatures of pyrite, the Bi-Te-Au signature was enriched in gold by a factor of up to 72,000 times relative to the ASP. This pyrite signature is well distributed in the Eastern Denise Zone. The HGZ and Team Zone also have this signature, although it is mixed with background signals and the Tl signature, respectively (Figure 10A–D). In addition, most thin sections with visible gold (n = 12) had pyrites with higher Bi-Te-Au signatures (n = 9). The Bi-Te-Au signature of pyrite is clearly related to high-grade gold contents of the mineralization. It was documented that gold scavenging by Bi-rich melts accounts for the close correlation of Bi and Au concentrations [62,63]. For the pyrite with the Bi-Te-Au signature, Au was correlated with Bi and Te (Figure 11).
The “Liquid Bismuth Collector Model” [64] was introduced as a concept to account for the link between Bi and Au in some gold deposits [62,65]. Bismuth is a low-melting-point (271 °C at 1 bar) and relatively abundant chalcophile element [66]. An alloy of Au with low-melting-point chalcophile elements (e.g., Bi, Te, Ag) would have different melting temperatures, but all would be within the temperature range of typical orogenic fluids [67].
Au is scavenged by Bi and Bi-Te in hydrothermal fluids to form Au-Bi and Au-Bi-Te melts [65]. According to a phase diagram calculated for the Au-Bi system at 1 bar [65], the Au-Bi melt should have approximately 25% Au and 75% Bi at 370 °C, which is the temperature of formation of the HGZ (364 °C: Table 1). This solubility difference implies that Au is expected to partition into Bi melts even in undersaturated aqueous solutions. According to experiments by Tooth et al. [65], “a fluid undersaturated by an order of magnitude (2 ppb Au) would coexist with a Bi melt that still contains ~18 wt% Au. Even at 0.2 ppb, this fluid coexists with a melt containing ~5 wt% Au. This means that a deposit containing only 100 ppm Bi deposited as Bi melt would display Au grades of 5 ppm”. For Perron, the pyrite (LM-661-1-27) from the Eastern Denise Zone with the Bi-Te-Au signature and a Bi concentration of 1098 ppm had 145 ppm Au. These values are supportive of the possibility of the scavenging of gold by Bi melts at the Perron deposit.
However, no direct association between Bi-Te-bearing minerals and gold was observed in the thin sections. It is, thus, possible that Au occurs with Bi-Te as nano-inclusions in pyrite. The time-resolved count by second (CPS) analysis in LA-ICP-MS for LM-661-1-27 is very instructive in better understanding the behavior of Bi-Te relative to Au (Figure 17). First, Bi-Te displays the same time-resolved CPS pattern. Gold and Ag also display similar CPS patterns. There are two different behaviors: (1) antithetical, where Bi-Te and Au-Ag have an antithetical correlation in terms of abundance; (2) correlative, where Bi, Te, Au, and Ag display similar peaks. The correlative portion of the time-resolved CPS supports the occurrence of Bi-Te-Au-Ag nano-inclusions in pyrite. In addition, the correlation of Ag with Bi-Te-Au is coherent with melt transport, as Ag is also a low-melting-point chalcophile element. The explanation of the antithetical part of the spectra is more difficult. Since visible gold is abundant in this thin section, it is possible that Au and Ag were leached later by Bi-Te-rich fluids and remobilized as visible gold.
The source of Bi and, by extension, Te is relevant to the possibility of Au scavenging by Bi melts. The Bi and Te sources are varied but are commonly interpreted as magmatic [63]. Reduced Au- and Te-rich felsic magmas can be generated through the partial melting of pre-existing portions of Au enrichment in the lower crust [68]. Conversely, Tooth et al. [65] considered the active Escanaba Trough VMS system as a good example of Bi-Au scavenging. Consequently, volcanogenic mineralization in submarine arc settings is a possible source for Bi and Te. The metamorphosed pyrrhotites of Perron displayed systematic losses of Bi and Te, hence providing a significant source for Te and Bi remobilization in the metamorphic fluids. Bismuth and possibly the scavenging of Au by Bi-Te melts are, thus, an additional possibility when accounting for the richness of the gold mineralization in the HGZ and Eastern Denise Zone, in addition to the higher capacity for gold transport as hydrocarbon–metal complexes or as colloidal gold nanoparticles in hydrocarbon-rich fluids.
Although scavenging for gold by Bi-Te melts is an attractive possibility, recent studies of orogenic gold deposits with Bi and Te in Archean belts reached other conclusions. Wehrle et al. [69] concluded that Bi-rich polymetallic melts were unlikely to form primary Au mineralization in orogenic systems but could have a significant impact on the ultimate deposit-scale distribution of Au via secondary mobilization and enrichment. Herzog et al. [70] reached a similar conclusion, where the association of Bi-Te-Au in pyrite was related to changes in the precipitating conditions of pyrite (fO2, fS2 and fTe). However, scavenging for gold by Bi-Te melts is considered a viable mechanism for the HGZ because it is compatible with the non-aqueous nature of the fluids documented for it [8] and because the gold grade of the HGZ is at least 10 times greater than that of the deposits studied by Wehrle et al. [69] and Herzog et al. [70].
Aside from the effectiveness of gold transport, a large gold source appears to be necessary. The pyrrhotite data show that gold was released from primary volcanogenic sulfide (probably primary pyrite). One can expect that a deeper massive sulfide deposit would have provided gold to the HGZ. As a speculative hypothesis, VMS deposits are commonly associated with biological activity, even in Archean time [71], and they now occur as black shales. Such organic matter can account for the generation of hydrocarbon-rich fluids during metamorphism, as documented for the HGZ [8].

6.4. Why Is There an Exceptional Gold Endowment in the Eastern Gold Zone?

The Eastern Gold Zone hosts seven gold-bearing zones in a restricted volume of ~1 km3. Of interest is the diversity of the gold mineralization in this small volume, including the orogenic-related HGZ and the volcanogenic-related Donna Zone. In addition, the Upper HGZ and the Team Zone demonstrate hybrid mineralization with a dominant orogenic signature, whereas the Denise Zone displays a dominant volcanogenic signature. Finally, the 210 and E2 Zones appear to be related to different hydrothermal systems or at least to an undetermined combination of systems. By comparison to the largest gold deposits in the Abitibi belt, the Eastern Gold Zone is thus composed of numerous genetic types rather than only one.
From the interpretation of the process of gold extraction from the metamorphosed pyrrhotite, it seems obvious that the gold endowment of the Eastern Gold Zone is related to a primary gold enrichment by a volcanogenic hydrothermal system and later enrichment by the orogenic remobilization of gold. First, there are two volcanogenic zones (QF and Donna) at different stratigraphic levels. Second, most of the zones showed numerous signatures of pyrite (up to five for the Team Zone) (Table 1), whereas the orogenic zones distant from the Eastern Gold Zone, such as the Gratien and Grey Cat Zones, had only one pyrite signature. This is suggestive of multiple pulses of element extractions from the volcanogenic heritage during the metamorphism of the Eastern Gold Zone, as suggested by the coexisting signatures of metamorphogenic pyrites with different signatures in the same samples (Figure 9). In short, volcanogenic gold enrichment provided a source for later remobilization of gold into orogenic mineralization.
The Abitibi belt is famous for its gold-bearing VMS deposits [1]. The gold-rich volcanogenic mineralization is related to calc-alkaline volcanic rocks [2,72]. This association of calc-alkaline rocks and gold-rich volcanogenic mineralization is generally ascribed to the input of magmatic fluid into the convecting seafloor hydrothermal system [73], which is analogous to epithermal and porphyry deposits in subaerial arc settings (e.g., [74]).
The whole rock geochemistry of the Beaupré Block revealed tholeiitic to transitional affinities. However, the Normétal horizon, which bears some volcanogenic gold-bearing zones, such as the QF Zone, is calc-alkaline (FIII). Volcanogenic gold-rich mineralization in the Abitibi belt is typically related to FIII rhyolites [2].
Volcanogenic gold-rich mineralization provided a pre-enrichment during the sub-horizontal construction of the subaqueous flow-dome rhyolitic complex of the Beaupré Block. It is interpreted that volcanogenic sulfide mineralization followed permeabilities along the contacts of the lobes and within the hyaloclastites (e.g., [75]), providing a mostly stacked sub-horizontal sulfidic heritage. Later, during the tectonic shortening, these sub-horizontal zones were verticalized, providing zones of weakness for focusing deformation, shearing, and metamorphic fluid flow channeling. The amphibolite metamorphism favored the remobilization of gold in orogenic and hybrid gold-bearing zones during the metamorphism, hence accounting for the gold endowment of the Eastern Gold Zone.

7. Conclusions

Pyrite, sphalerite, pyrrhotite, and chalcopyrite from 13 different gold-bearing zones were analyzed with LA-ICP-MS to decipher their genetic links, mineralizing processes, and temperatures of formation. The mineralized zones range from volcanogenic to orogenic, whereas some zones display hybrid characteristics resulting from the overprinting of primary volcanogenic mineralization by later orogenic mineralization. The temperatures calculated with a sphalerite thermometer [34] range from 348 to 398 °C and are non-conclusive in distinguishing mineralizing events. All gold-bearing zones show different proportions of volcanogenic hydrothermal inputs, manifested by metamorphosed pyrrhotite. Pyrite was interpreted to be late-metamorphic and related to the orogenic gold system induced by the contact metamorphism of amphibolite facies. Pyrrhotite grains had very homogeneous trace element signatures for all of the zones, which is a characteristic of metamorphic recrystallization, with mobile elements (Au, Te, Bi, Tl, Sn, W, In, Cd, Zn) being lost but with high concentrations of structurally bound elements, such as Ni, Co, and As. Conversely, pyrite was systematically enriched in all elements that were depleted from pyrrhotite, with five specific signatures of element enrichments, such as W, Tl, Sn, In-Cd-Zn, and Bi-Te-Au. It was interpreted that the metamorphism of primary gold-bearing volcanogenic mineralization was the main source of gold during the overprinting of a metamorphism-induced orogenic mineralizing event. This is the first documentation of the remobilization of gold into orogenic quartz veins from a local volcanogenic pre-enrichment.
For some gold-rich zones, such as the HGZ and the Upper HGZ, gold enrichment was linked to the Bi-Te-Au signature of pyrite. It was interpreted that gold was transported, at least in part, by Bi-Te melts in non-aqueous orogenic fluids, hence accounting for the very-high-grade gold content of the HGZ. Finally, the spectacular gold endowment of the Eastern Gold Zone is explained by the diversity of the gold mineralization, which ranges from orogenic to VMS and hybrid mineralization. A strong volcanogenic pre-enrichment is considered to be the main factor accounting for such a gold endowment with later enrichment by the orogenic remobilization of gold during pyrrhotite metamorphism.

Supplementary Materials

The following supporting information can be downloaded at https://www.mdpi.com/article/10.3390/min14080843/s1, Table S1: Samples used for the study with the number of sulfides analyzed in thin sections and their interpreted pyrite signatures. Table S2. Reference materials for LA-ICP-MS analyses. Table S3. LA-ICP-MS analyses of sulfides. Table S4. LA-ICP-MS analyses of sphalerite with the calculated temperatures. Figure S1. Plots of trace elements from pyrite normalized to Archean sedimentary pyrite (ASP) divided by gold-bearing zones. Dashed black lines are the limits of detection (LODs). Figure S2. Multielement diagrams for sphalerite divided by gold-bearing zones. Dashed black lines are the limits of detection (LODs). Figure S3. Multielement diagrams for pyrrhotite divided by gold-bearing zones. Dashed black lines are the limits of detection (LODs). Figure S4. Multielement diagrams for chalcopyrite divided by gold-bearing zones. Dashed black lines are the limits of detection (LODs).

Author Contributions

Conceptualization, D.G. (Damien Gaboury); D.G. (Dominique Genna) and J.T.; data curation, D.G. (Damien Gaboury); formal analysis, D.G. (Damien Gaboury) and D.G. (Dominique Genna); funding acquisition, D.G. (Damien Gaboury); investigation, D.G. (Damien Gaboury), D.G. (Dominique Genna), M.B. and J.A.; methodology, D.G. (Damien Gaboury), D.G. (Dominique Genna) and J.A.; project administration, D.G. (Damien Gaboury); Supervision, D.G. (Damien Gaboury); validation, D.G. (Damien Gaboury), D.G. (Dominique Genna), M.B. and J.A.; writing—original draft, D.G. (Damien Gaboury); writing—review & editing, D.G. (Damien Gaboury), D.G. (Dominique Genna), J.T., M.B. and J.A. All authors have read and agreed to the published version of the manuscript.

Funding

This research was funded by the Natural Sciences and Engineering Research Council of Canada (NSERC) grant number DDG-2022-00019 to D. Gaboury.

Data Availability Statement

The data presented in this study are available in Supplementary Materials.

Acknowledgments

All of the staff at Laurentia Exploration Inc. are thanked for their help with the on-site sampling session. Audrey Lavoie (UQAC) and Dany Savard performed the LA-ICP-MS analyses. Emile Gaboury (Geology Student at UQAC) helped with the petrographic selection of the sulfides for analyses. Louis Fortin (Atelier de Pétrographie Inc. Québec, Canada) provided rapid and dedicated thin section preparation. This study is a contribution to the NSERC research project DDG-2022-00019: “Source of gold in orogenic deposits”.

Conflicts of Interest

The authors declare no conflict of interest. The coauthors Jérôme Augustin and Maxime Bouchard are affiliated with Laurentia Exploration Inc., while coauthor Jacques Trottier is affiliated with Amex Exploration Inc. The authors received funding from both companies. However, the funding sponsors had no role in the design of the study; in the collection, analysis, or interpretation of data; in the writing of the manuscript; or in the decision to publish the results.

References

  1. Dubé, B.; Mercier-Langevin, P. Gold deposits of the Archean Abitibi greenstone Belt, Canada. In Geology of the World’s Major Gold Deposits and provinces. Special Publications of the Society of Economic Geologists; Society of Economic Geologists: Littleton, CO, USA, 2020; Volume 23, pp. 669–708. [Google Scholar]
  2. Gaboury, D.; Pearson, V. Rhyolite Geochemical Signatures and Association with Volcanogenic Massive Sulfide Deposits: Examples from the Abitibi Belt, Canada. Econ. Geol. 2008, 103, 1531–1562. [Google Scholar] [CrossRef]
  3. Mathieu, L. Intrusion-associated gold systems and multistage metallogenic processes in the Neoarchean Abitibi Greenstone Belt. Minerals 2021, 11, 261. [Google Scholar] [CrossRef]
  4. Burrows, D.R.; Spooner, E.T.; Wood, P.C.; Jemielita, R.A. Structural controls on formation of the Hollinger-McIntyre Au quartz vein system in the Hollinger shear zone, Timmins, southern Abitibi greenstone belt, Ontario. Econ. Geol. 1993, 88, 1643–1663. [Google Scholar] [CrossRef]
  5. Helt, K.M.; Williams-Jones, A.E.; Clark, J.R.; Wing, B.A.; Wares, R.P. Constraints on the genesis of the Archean oxidized, intrusion-related Canadian Malartic gold deposit, Quebec, Canada. Econ. Geol. 2014, 109, 713–735. [Google Scholar] [CrossRef]
  6. Mercier-Langevin, P.; Dubé, B.; Hannington, M.D.; Davis, D.W.; Lafrance, B.; Gosselin, G. The LaRonde Penna Au-rich volcanogenic massive sulfide deposit, Abitibi greenstone belt, Quebec: Part I. Geology and geochronology. Econ. Geol. 2007, 102, 585–609. [Google Scholar] [CrossRef]
  7. Ayer, J.A.; Chartrand, J.E. Geological Compilation of the Abitibi Greenstone Belt: Ontario Geological Survey Miscellaneous Release Data 282; Ontario Geological Survey: Toronto, ON, Canada, 2011; 1 map, scale 1:250,000. [Google Scholar]
  8. Gaboury, D.; Genna, D.; Trottier, J.; Bouchard, M.; Augustin, J.; Malcolm, K. The Perron gold deposit, Archean Abitibi belt, Canada: Exceptionally high-grade mineralization related to higher gold-carrying capacity of hydrocarbon-rich fluids. Minerals 2021, 11, 1066. [Google Scholar] [CrossRef]
  9. Lafrance, B. Reconstruction d’un Environnement de Sulfures Massifs Volcanogènes Déformés: Exemple Archéen de Normétal, Abitibi. PhD Thesis, Université du Québec à Chicoutimi, Chicoutimi, QC, Canada, 2003; 362p. [Google Scholar]
  10. Yang, X.-M.; Lentz, D.R.; Sylvester, P.J. Gold contents of sulfide minerals in granitoids from southwestern New Brunswick, Canada. Miner. Depos. 2006, 41, 369–386. [Google Scholar] [CrossRef]
  11. Large, R.R.; Bull, S.W.; Maslennikov, V.V. A carbonaceous sedimentary source-rock model for Carlin-type and orogenic gold deposits. Econ. Geol. 2011, 106, 331–358. [Google Scholar] [CrossRef]
  12. Large, R.R.; Halpin, J.A.; Danyushevsky, L.V.; Maslennikov, V.V.; Bull, S.W.; Long, J.A.; Gregory, D.D.; Lounejeva, E.; Lyons, T.W.; Sack, P.J.; et al. Trace element content of sedimentary pyrite as a new proxy for deeptime ocean-atmosphere evolution. Earth Planet. Sci. Lett. 2014, 389, 209–220. [Google Scholar] [CrossRef]
  13. Cook, N.J.; Ciobanu, C.L.; Meria, D.; Silcock, D.; Wade, B. Arsenopyrite-pyrite association in an orogenic gold ore: Tracing mineralization history from textures and trace elements. Econ. Geol. 2013, 108, 1273–1283. [Google Scholar] [CrossRef]
  14. Genna, D.; Gaboury, D. Deciphering the Hydrothermal Evolution of a VMS System by LA-ICP-MS Using Trace Elements in Pyrite: An Example from the Bracemac-McLeod Deposits, Abitibi, Canada, and Implications for Exploration. Econ. Geol. 2015, 110, 2087–2108. [Google Scholar] [CrossRef]
  15. Steadman, J.A.; Large, R.R.; Olin, P.H.; Danyushevsky, L.V.; Meffre, S.; Huston, D.; Fabris, A.; Lisitsin, V.; Wells, T. Pyrite trace element behavior in magmatic-hydrothermal environments: An LA-ICPMS imaging study. Ore Geol. Rev. 2021, 128, 103878. [Google Scholar] [CrossRef]
  16. Belousov, I.; Large, R.R.; Meffre, S.; Danyushevsky, L.V.; Steadman, J.; Beardsmore, T. Pyrite compositions from VHMS and orogenic Au deposits in the Yilgarn Craton, Western Australia: Implications for gold and copper exploration. Ore Geol. Rev. 2016, 79, 474–499. [Google Scholar] [CrossRef]
  17. Keith, M.; Smith, D.J.; Jenkin, G.R.T.; Holwell, D.A.; Dye, M.D. A review of Te and Se systematics in hydrothermal pyrite from precious metal deposits: Insights into ore-forming processes. Ore Geol. Rev. 2018, 96, 269–282. [Google Scholar] [CrossRef]
  18. Augustin, J.; Gaboury, D. Multi-stage and multi-sourced fluid and gold in the formation of orogenic gold deposits in the world-class Mana district of Burkina Faso-Revealed by LA-ICP-MS analysis of pyrites and arsenopyrites. Ore Geol. Rev. 2019, 104, 495–521. [Google Scholar] [CrossRef]
  19. Gaboury, D.; Ore Sanchez, C. Electrochemical gold precipitation to explain extensive vertical and lateral mineralization in the world-class Poderosa-Pataz district, Peru. Terra Nova 2020, 32, 97–107. [Google Scholar] [CrossRef]
  20. Steadman, J.A.; Large, R.R. Synsedimentary, diagenetic, and metamorphic pyrite, pyrrhotite, and marcasite at the Homestake BIF-hosted gold deposit, south Dakota, USA: Insights on Au-As ore genesis from textural and LA-ICP-MS trace element studies. Econ. Geol. 2016, 111, 1731–1752. [Google Scholar] [CrossRef]
  21. Kang, J.; Gregory, D.D.; Gill, B.; Huang, S.; Lai, C.; Chang, Z.; Cui, H.; Belousov, I.; Xiao, S. Trace element evidence for diverse origins of superheavy pyrite in Neoproterozoic sedimentary strata. Geochim. Cosmochim. Acta 2024, 364, 1–9. [Google Scholar] [CrossRef]
  22. Card, K.D. A review of the Superior Province of the Canadian Shield, a product of Archean accretion. Precambrian Res. 1990, 48, 99–156. [Google Scholar] [CrossRef]
  23. Chown, E.H.; Daigneault, R.; Mueller, W. Tectonic evolution of the Northern Volcanic Zone, Abitibi belt, Quebec. Can. J. Earth Sci. 1992, 29, 2211–2225. [Google Scholar] [CrossRef]
  24. Monecke, T.; Mercier-Langevin, P.; Dubé, B.; Frieman, B. Geology of the Abitibi greenstone belt. In Archean Base and Precious Metal Deposits, Southern Abitibi Greenstone Belt, Canada, Reviews in Economic Geology; Monecke, T., Mercier-Langevin, P., Dubé, B., Eds.; Society of Economic Geologists: Littleton, CO, USA, 2017; Volume 19, pp. 7–49. [Google Scholar]
  25. Gaboury, D. Geochemical approaches in the discrimination of synvolcanic intrusions as a guide for volcanogenic base metal exploration: Example from the Abitibi belt, Canada. Appl. Earth Sci. 2006, 115, 71–79. [Google Scholar] [CrossRef]
  26. Mercier-Langevin, P.; Dubé, B.; Houlé, M.G.; Bécu, V.; Sappin, A.A.; Pilote, J.L.; Castonguay, S. Metallogeny of the Abitibi Greenstone Belt, Canada. In Metallic Resources 2: Geodynamic Framework and Remarkable Examples in the World; Wiley: New York, NY, USA, 2023; pp. 63–141. [Google Scholar]
  27. Mortensen, J.K. U-Pb gechronology of the eastern Abitibi Subprovince. Part 1: Chibougamau-Matagami-Joutel. Can. J. Earth Sci. 1993, 30, 11–28. [Google Scholar] [CrossRef]
  28. Barrett, T.J.; Ayer, J.A.; Ordóñez-Calderón, J.C.; Hamilton, M.A. Burntbush-Normétal volcanic belt, Abitibi greenstone belt, Ontario-Quebec: Geological Mapping and Compilation Project, Discover Abitibi Initiative. In Geological Mapping and Compilation of the Burntbush-Normétal Volcanic Belt, Abitibi Greenstone Belt, Ontario-Quebec, Miscellaneous Release—Data 299; Ontario Geological Survey: Sudbury, ON, Canada, 2013; 135p. [Google Scholar]
  29. Teasdale, N. Regional Study of Geochemical Alteration Associated with the Normétal Deposit Abitibi Greenstone Belt, Québec. Master’s Thesis, École Polytechnique, Montreal, QC, Canada, 1993; 160p. [Google Scholar]
  30. Lesher, C.M.; Goodwin, A.M.; Campbell, I.H.; Gorton, M.P. Trace-element geochemistry of ore-associated and barren, felsic metavolcanic rocks in the Superior Province, Canada. Can. J. Earth Sci. 1986, 23, 222–237. [Google Scholar] [CrossRef]
  31. Fayard, Q. Lithogeochemistry Phase II–New Advances, Perron Project; Part 1: New Classification and Implications for Our Understanding of Perron’s Metallogeny. Internal Report to Amex Exploration; Amex Exploration: Abitibi, QC, Canada, 2023; 17p. [Google Scholar]
  32. Zhang, Q.; Machado, N.; Ludden, J.N.; Moore, D. Geotectonic Constraints from U-Pb Ages for the Blake River Group, the KinojevisGroup and the Normetal Mine Area, Abitibi, Quebec. Program and Abstract; MAC/AMC: Edmonton, AB, Canada, 1993; p. A-114. [Google Scholar]
  33. Lafrance, B.; Mueller, W.U.; Daigneault, R.; Dupras, N. Evolution of a submerged composite arc volcano: Volcanology and geochemistry of the Normétal volcanic complex, Abitibi greenstone belt, Québec, Canada. Precambrian Res. 2000, 101, 277–311. [Google Scholar] [CrossRef]
  34. Frenzel, M.; Hirsch, T.; Gutzmer, J. Gallium, germanium, indium, and other trace and minor elements in sphalerite as a function of deposit type—A meta-analysis. Ore Geol. Rev. 2016, 76, 52–78. [Google Scholar] [CrossRef]
  35. Bralia, A.; Sabatini, G.; Troja, F.A. Revaluation of the Co/Ni ratio in pyrite as geochemical tool in ore genesis problems. Mineral. Depos. 1979, 14, 353–374. [Google Scholar] [CrossRef]
  36. Conn, C.D.; Spry, P.G.; Layton-Matthews, D.; Voinot, A.; Koenig, A. The effects of amphibolite facies metamorphism on the trace element composition of pyrite and pyrrhotite in the Cambrian Nairne Pyrite Member, Kanmantoo Group, South Australia. Ore Geol. Rev. 2019, 114, 103128. [Google Scholar] [CrossRef]
  37. Slack, J.F.; Van Baalen, M.R.; Reusch, D.N. Regional geochemical variations in a metamorphosed black shale: A reconnaissance study of the Silurian Smalls Falls Formation, Maine, USA. Atl. Geol. 2020, 56, 231–255. [Google Scholar] [CrossRef]
  38. Suhendra, R.; Takahashi, R.; Agangi, A.; Imai, A.; Sato, H.; Setiawan, N.I. Textural-compositional evolution of pyrite and metal remobilization during low-grade metamorphism of metapelite: Contribution to gold mineralization in the Luk Ulo Complex, Central Java, Indonesia. Ore Geol. Rev. 2014, 166, 105966. [Google Scholar] [CrossRef]
  39. Graham, U.M.; Ohmoto, H. Experimental study of formation mechanisms of hydrothermal pyrite. Geochim. Cosmochim. Acta 1994, 58, 2187–2202. [Google Scholar] [CrossRef]
  40. Tomkins, A.G. Windows of metamorphic sulfur liberation in the crust: Implications for gold deposit genesis. Geochim. Cosmochim. Acta. 2010, 74, 3246–3259. [Google Scholar] [CrossRef]
  41. Gaboury, D. Does gold in orogenic deposits come from pyrite in deeply buried carbon-rich sediments? Insight from volatiles in fluid inclusions. Geology 2013, 41, 1207–1210. [Google Scholar] [CrossRef]
  42. Gaboury, D. Parameters for the formation of orogenic gold deposits. Appl. Earth Sci. 2019, 128, 124–133. [Google Scholar] [CrossRef]
  43. Benedetto, R.D.; Bernardini, G.P.; Costagliola, P.; Plant, D.; Vaughan, D.J. Compositional zoning in sphalerite crystals. Am. Mineral. 2005, 90, 1384–1392. [Google Scholar] [CrossRef]
  44. Goldfarb, R.J.; Pitcairn, I. Orogenic gold: Is a genetic association with magmatism realistic? Miner. Depos. 2023, 58, 5–35. [Google Scholar] [CrossRef]
  45. Gaboury, D. The neglected involvement of organic matter in forming large and rich hydrothermal orogenic gold deposits. Geosciences 2021, 11, 344. [Google Scholar] [CrossRef]
  46. Large, R.R.; Maslennikov, V.V.; Robert, F.; Danyushevsky, L.V.; Chang, Z. Multistage sedimentary and metamorphic origin of pyrite and gold in the giant Sukhoi Log deposit, Lena gold province, Russia. Econ. Geol. 2007, 102, 1233–1267. [Google Scholar] [CrossRef]
  47. Thomas, H.V.; Large, R.R.; Bull, S.W.; Maslennikov, V.; Berry, R.F.; Fraser, R.; Froud, S.; Moye, R. Pyrite and pyrrhotite textures and composition in sediments, laminated quartz veins, and reefs at Bendigo gold mine, Australia: Insights for ore genesis. Econ. Geol. 2011, 106, 1–31. [Google Scholar] [CrossRef]
  48. Pasava, J.; Frimmel, H.; Vymazalová, A.; Dobes, P.; Jukov, A.V.; Koneev, R.I. A two-stage evolution model for the Amantaytau orogenic-type gold deposit in Uzbekistan. Miner. Depos. 2013, 48, 825–840. [Google Scholar] [CrossRef]
  49. Large, R.; Thomas, H.; Craw, D.; Henne, A.; Henderson, S. Diagenetic pyrite as a source for metals in orogenic gold deposits, Otago Schist, New Zealand. N. Z. J. Geol. Geophys. 2012, 55, 137–149. [Google Scholar] [CrossRef]
  50. Gaboury, D.; Mackezie, D.; Craw, D. Fluid volatile composition associated with orogenic gold mineralization, Otago Schist, New Zealand: Implications of H2 and C2H6 for fluid evolution and gold source. Ore Geol. Rev. 2021, 133, 104086. [Google Scholar] [CrossRef]
  51. Gaboury, D.; Nabil, H.; Ennaciri, A.; Maacha, L. Structural setting and fluid composition of gold mineralization along the central segment of the Keraf suture, Neoproterozoic Nubian Shield, Sudan: Implications for the source of gold. Int. Geol. Rev. 2022, 64, 45–71. [Google Scholar] [CrossRef]
  52. Pitcairn, I.K.; Leventis, N.; Beaudoin, G.; Faure, S.; Guilmette, C.; Dubé, B. A metasedimentary source of gold in Archean orogenic gold deposits. Geology 2021, 49, 862–866. [Google Scholar] [CrossRef]
  53. Goldfarb, R.J.; Groves, D.I. Orogenic gold: Common vs evolving fluid and metal sources through time. Lithos 2015, 223, 2–26. [Google Scholar] [CrossRef]
  54. Wyman, D.A.; Cassidy, K.F.; Hollings, P. Orogenic gold and the mineral systems approach: Resolving fact, fiction and fantasy. Ore Geol. Rev. 2016, 78, 322–335. [Google Scholar] [CrossRef]
  55. Groves, D.I.; Santosh, M.; Deng, J.; Wang, Q.; Yang, L.; Zhang, L. A holistic model for the origin of orogenic gold deposits and its implications for exploration. Miner. Depos. 2020, 55, 275–292. [Google Scholar] [CrossRef]
  56. Zenk, M.; Schulz, B. Zoned Ca-amphiboles and related P-T evolution in metabasites from the classical Barrovian metamorphic zones in Scotland. Miner. Mag. 2004, 68, 769–786. [Google Scholar] [CrossRef]
  57. Finch, E.G.; Tomkins, A.G. Pyrite-Pyrrhotite Stability in a Metamorphic Aureole: Implications for Orogenic Gold Genesis. Econ. Geol. 2017, 112, 661–674. [Google Scholar] [CrossRef]
  58. Phillips, G.N.; Powell, R. Formation of gold deposits: A metamorphic devolatilization model. J. Metam. Geol. 2010, 28, 689–718. [Google Scholar] [CrossRef]
  59. Hutchinson, R.W. A multi-stage, multi-process genetic hypothesis for greenstone-hosted gold lodes. Ore Geol. Rev. 1993, 8, 349–382. [Google Scholar] [CrossRef]
  60. Powell, W.G.; Carmichael, D.M.; Hodgson, C.J. Conditions and timing of metamorphism in the southern Abitibi greenstone belt, Quebec. Can. J. Earth Sci. 1995, 32, 787–805. [Google Scholar] [CrossRef]
  61. Faure, S. Relations Entre les Minéralisations Aurifères et les Isogrades Métamorphiques en Abitibi. Rapport Projet CONSOREM 2013-03. 2015. 52p. Available online: https://consorem2.uqac.ca/production_scientifique/2013_03/2013-03_Final.pdf (accessed on 23 March 2024).
  62. Cockerton, A.B.; Tomkins, A.G. Insights into the liquid bismuth collector model through analysis of the Bi-Au Stormont skarn prospect, northwest Tasmania. Econ. Geol. 2012, 107, 667–682. [Google Scholar] [CrossRef]
  63. Feng, H.; Shen, P.; Zhu, R.; Tomkins, A.G.; Brugger, J.; Ma, G.; Li, C.; Wu, Y. Bi/Te control on gold mineralizing processes in the North China Craton: Insights from the Wulong gold deposit. Miner. Depos. 2023, 58, 263–286. [Google Scholar] [CrossRef]
  64. Douglas, N.; Mavrogenes, J.; Hack, A.; England, R. The liquid bismuth collector model: An alternative gold deposition mechanism. In Understanding Planet Earth; Searching for a Sustainable Future; on the Starting Blocks of the Third Millennium: Australian Geological Convention, 15th, Sydney; Skilbeck, C.G., Hubble, T.C.T., Eds.; Geological Society of Australia: Sydney, Australia, 2000; 135p. [Google Scholar]
  65. Tooth, B.; Brugger, J.; Ciobanu, C.; Liu, W. Modeling of gold scavenging by bismuth melts coexisting with hydrothermal fluids. Geology 2008, 36, 815–818. [Google Scholar] [CrossRef]
  66. Frost, B.R.; Mavrogenes, J.A.; Tomkins, A.G. Partial melting of sulfide deposits during medium- and high-grade metamorphism. Can. Mineral. 2002, 40, 1–18. [Google Scholar] [CrossRef]
  67. Goldfarb, R.J.; Baker, T.; Dube, B.; Groves, D.I.; Hart, C.J.; Gosselin, P. Distribution, character and genesis of gold deposits in metamorphic terranes. In Economic Geology: One Hundredth Anniversary Volume; Society of Economic Geologists: Littleton, CO, USA, 2005; pp. 407–450. [Google Scholar]
  68. Tomkins, A.G.; Weinberg, R.F.; McFarlane, C.R. Preferential magma extraction from K-and metal-enriched source regions in the crust. Miner. Depos. 2009, 44, 171–181. [Google Scholar] [CrossRef]
  69. Wehrle, E.A.; Samson, I.M.; Montreuil, J.F.; Kontak, D.J. Au-Bi-Te(-Cu) Mineralization in the Wawa Gold Corridor (Ontario, Canada): Implications for the Role of Bi-Rich Polymetallic Melts in Orogenic Au Systems. Minerals 2023, 13, 1119. [Google Scholar] [CrossRef]
  70. Herzog, M.; LaFlamme, C.; Beaudoin, G.; Barré, G.; Martin, L.; Savard, D. Fluid-rock sulfidation reactions control Au-Ag-Te-Bi precipitation in the Val-d’Or orogenic gold vein field (Abitibi subprovince, Canada). Miner. Depos. 2024, 59, 1039–1064. [Google Scholar] [CrossRef]
  71. Martin, A.N.; Stüeken, E.E.; Michaud, J.S.; Münker, C.; Weyer, S.; van Hees, E.H.P.; Gehringer, M.M. Mechanisms of nitrogen isotope fractionation at an ancient black smoker in the 2.7 Ga Abitibi greenstone belt, Canada. Geology 2024, 52, 181–186. [Google Scholar] [CrossRef]
  72. Dubé, B.; Gosselin, P.; Mercier-Langevin, P.; Hannington, M.; Galley, A. Gold-rich volcanogenic massive sulphide deposits. Geol. Assoc. Can. Miner. Depos. Div. 2007, 75–94. [Google Scholar]
  73. Yang, K.; Scott, S.D. Magmatic fluids as a source of metals in seafloor hydrothermal systems. In Geophysical Monograph Series; American Geophysical Union: Washington, DC, USA, 2006; Volume 166, pp. 163–184. [Google Scholar]
  74. Sillitoe, R.H. Gold-rich porphyry deposits: Descriptive and genetic models and their role in exploration and discovery. Soc. Econ. Geol. Rev. 2000, 13, 315–345. [Google Scholar]
  75. Genna, D.; Gaboury, D.; Moore, L.; Mueller, W.U. Use of micro-XRF chemical analysis for mapping volcanogenic massive sulfide related hydrothermal alteration: Application to the subaqueous felsic dome-flow complex of the Cap d’Ours section, Glenwood rhyolite, Rouyn-Noranda, Québec, Canada. J. Geochem. Explor. 2011, 108, 131–142. [Google Scholar] [CrossRef]
Figure 1. Regional geology showing the Perron property, the gold and base metal showings, and the location of the closed mines, modified from Ayer and Chartrand [7].
Minerals 14 00843 g001
Figure 2. Geological map of the Perron gold project, with the location of the various gold-bearing zones, the Eastern Gold Zone, and the samples used for this study. Stratigraphic subdivisions from Lafrance [9]. Figure modified [9] from and AMEX Exploration.
Minerals 14 00843 g002
Figure 3. Geological map of the Eastern Gold Zone showing the seven gold-bearing zones defined in this area and the location of the samples in detail. Mineralized zones are illustrated with a red color. Figure modified from Amex Exploration.
Minerals 14 00843 g003
Figure 4. Representative drill cores of the mineralized zones showing the various styles of mineralizations ranging from quartz veining to massive sulfides, stringers, and disseminations. The black rectangles are the location of the thin section with their reference number. (A) HGZ. (B) Grey Cat Zone. (C) Gratien Zone. (D) E2 Zone. (E) N110 Zone. (F) Donna Zone. (G) QF Zone. (H) Team Zone. (I) Upper HGZ. (J) 210 Zone. (K) Denise Zone. (L) Eastern Denise Zone.
Minerals 14 00843 g004
Figure 5. Examples of visible gold from various zones with gold values (ppm) over drill core length (m). (A) Upper HGZ (PE-20-192: 328.85–328.9 m) within a quartz vein with pyrite. (B) Denise Zone (PE-21-287: 972.9–973.1 m) within a quartz vein with pyrite. (C) Team Zone (PE-22-580: 411.5–411.8 m) within a quartz vein with pyrite. (D) 210 Zone (PE-23-649: 194.10–194.35 m) within a silicified host rock with pyrite and sphalerite. (E) Eastern Denise Zone (PE-23-663: 961.8–692.0 m) within a silicified host rock with pyrite. (F) Grey Cat Zone (PEG-20-143: 108.50–108.95 m) within a quartz vein. (G) Gratien Zone (PEG-24-745: 66.00–66.15 m) within a silicified host rock. (H) N110 Zone (PEG-24-765: 76.60–76.75 m) within a quartz vein. (I) E2 Zone (PEX-20-034: 151.45–151.90 m) within a silicified host rock.
Minerals 14 00843 g005
Figure 6. Microphotographs of gold occurrences (red arrow). (A) A gold inclusion in pyrite (Py). (B) Micro-inclusions of gold in sphalerite (Sp). (C) Gold grains in quartz (Qz). (D) Gold grains disseminated in the host rock in association with pyrite. (E) Gold as a fracture filling in pyrite. (F) Gold as a fracture filling in quartz.
Minerals 14 00843 g006
Figure 7. Microphotographs of the textural relationships for the sulfides with the locations of the line analyses and their numbers. (A) Subhedral pyrite in a quartz vein. (B) Subhedral pyrite in a sphalerite groundmass. (C) Euhedral pyrite crystals in a quartz veinlet. (D) Subhedral pyrite grains in a chalcopyrite groundmass. (E) Large subhedral pyrite crystal in a chalcopyrite groundmass. (F) Sphalerite as a fracture filling in a quartz vein. (G) Sphalerite as a groundmass with subhedral pyrite. (H) Sphalerite coexisting with chalcopyrite and pyrrhotite. (I) Net-like texture of sphalerite. (JL) Stringers of chalcopyrite and pyrrhotite with a net-like texture. Numbers for analysis are composed of the thin section reference followed by the line number, such as LM-554-1-17. Pyrite (Py: red line); sphalerite (Sp: orange line); pyrrhotite (Po: yellow line); chalcopyrite (Cpy: blue line).
Minerals 14 00843 g007
Figure 8. Plots of trace elements from pyrite normalized to Archean sedimentary pyrite (ASP) for the five different signatures of element enrichments for the studied gold-bearing zones, with the number of samples used (n). (A) Pyrite with the Tl enrichment signature. (B) Sn signature. (C) W signature. (D) In-Cd-Zn signature. (E) Bi-Te-Au signature. The various colors and symbols are used for distinguishing different samples. Dashed black lines are the limits of detection (LODs).
Minerals 14 00843 g008
Figure 9. Microphotographs of the textural relationships for the pyrite with the location of line analyses and their numbers, in relation to their established geochemical signature. Note the coexisting signatures (AC) without apparent textural difference of the pyrite morphology, except for (D). (E) Tl signature with comparable morphologies of pyrite to (AC).
Minerals 14 00843 g009
Figure 10. Plots of trace elements from pyrite normalized to ASP for mixed pyrite signatures. (A) Mixed signatures of Bi-Te-Au and Tl. (B) Examples of the background signal with the calculated median value established using samples from the Team Zone that were not attributed to the mixed Bi-Te-Au and Tl signatures. (C) Mixed Bi-Te signatures with the background for the HGZ. (D) Mixed W signatures with the background for the HGZ. (E) Background medians of gold-bearing zones with the number of samples used (n). The background was defined using the remaining samples that were not allocated to one of the five pyrite signatures. Square symbols are for volcanogenic, rounds for orogenic, and lozenges for hybrid zones. The green envelope is a compilation of the Abitibi belt’s orogenic gold deposits (Internal Data CONSOREM). Dashed black lines are the limits of detection (LODs).
Minerals 14 00843 g010
Figure 11. Scatter plots for Bi, Te, and Bi+Te vs. Au in the analyses of pyrite from the HGZ and Team Zone (AF). Positive correlations exist among Bi-Au, Te-Au, and Te + Bi-Au. Correlation with gold is absent for the other pyrite signatures (W, Sn, and Tl-Zn-Cd).
Minerals 14 00843 g011
Figure 12. Plots of median values of trace elements for all of the gold-bearing zones, with the numbers of analyses. (A) Sphalerite showing patterns with higher concentrations of Cd, Cu, In, Mn, Pb, and Se and lower concentrations of Au, Ga, Ge, Mo, Sb, Tl, U, V, and W. The patterns are similar for all zones but with significant variations in Co and Ni. (B) Pyrrhotite, where patterns display higher concentrations of Co, Mn, Ni, Pb, Se, V, and Zn and lower concentrations of Au, In, Mo, Sb, Tl, U, and W. The patterns are similar for all zones but with significant variations in Co and Ni. (C) Chalcopyrite showing similar patterns for all zones with enrichment of Ag, Cd, In, Pb, and Zn and weak values of Mo, Sb, Tl, U, V, and W, but with significant variations in Co and Ni. Square symbols are for volcanogenic, rounds for orogenic, and lozenges for hybrid zones. Dashed black lines are the limits of detection (LODs).
Minerals 14 00843 g012
Figure 13. Scatter plots for the various sulfides. (A) In vs. Co for sphalerite. (B) Ni vs. Co for sphalerite. Plots A and B display the grouping of the data along a trend manifested by the significant variations in Co content. (C) Pb vs. Ag for sphalerite showing the grouping of the Denise Zone and CPZ. (D) Ni vs. Co for the pyrrhotite data, with field subdivision based on the data clustering. Note the variation in Co in the orogenic zones, as in the case of sphalerite. Black arrows are pointing LM-118-1 sample. (E) Ni vs. Co for the chalcopyrite data, with field subdivision based on the data clustering. There is no variation in Co in the orogenic zones.
Minerals 14 00843 g013
Figure 14. Comparative multielement diagrams of pyrite (Py) vs. pyrrhotite (Po) for the various zones subdivided by their interpreted origin (Table 1). (A) Volcanogenic. (B) Orogenic. (C) Different hydrothermal systems. The plotted values are from the median, and the number of analyses is shown (n). The grey envelope is the contour of the pyrrhotite median values. Regardless of the origin of the mineralization, the envelopes of pyrrhotite are very similar, suggesting a common origin. The pyrrhotite envelopes display a trace element pattern that is antithetical to that of pyrite; pyrites are enriched in elements depleted in pyrrhotites. Dashed black lines are the limits of detection (LODs).
Minerals 14 00843 g014
Figure 15. Sulfide vs. pyrite trace element loss/enrichment diagrams. These diagrams compare the sulfides with the pyrite in the same thin section (sample) of gold-bearing zones with coexisting sulfides. A value of 1 indicates that both sulfides have the same composition for this element. A value lower than 1 indicates the loss of this element from the selected sulfide and vice versa. (AE) Pyrrhotite vs. pyrite: Au, Cd, In, Te, and Tl are systematically lost from the pyrrhotite, whereas Bi, Sn, and W are commonly lost. It is noteworthy that these elements compose the five enrichment signatures established for the pyrites. (F) Chalcopyrite vs. pyrite for the volcanogenic QF Zone. (G) Sphalerite vs. pyrite for the orogenic HGZ.
Minerals 14 00843 g015
Figure 16. Textural characteristics of key samples. (A) Drill core sample (LM-118-1) with the position of the thin section from the volcanogenic QF Zone. Note the occurrence of pyrite aggregates with chlorite (green mineral between pyrite: Chl). The thickness is about 4 cm. (B,C) Texture of the subhedral pyrite with interstitial pyrrhotite and chalcopyrite (LM-118-1), where the influx of metamorphic fluids generated pyrite and chlorite and changed the composition of the remaining pyrrhotite and chalcopyrite. (D) Sample RC-37 from the orogenic Grey Cat Zone, where volcanogenic-related pyrrhotite and chalcopyrite occur in the host rock. Numbers for analysis are composed of the thin section reference followed by the line number, such as LM-118-1-40. Pyrite (Py: red line); pyrrhotite (Po: yellow line); chalcopyrite (Cpy: blue line).
Minerals 14 00843 g016
Figure 17. Validation of the links between Te, Bi, and Au from sample LM-663-1 (Eastern Denise Zone). (A) Textural relationships of the analyzed pyrite (line 27) with visible gold. (B) Time-resolved signal (count per second vs. time) recorded with the mass spectrometer during line analysis (red line 27 in (A)) across the entire pyrite grain from locations 1 to 2 (black circles). The laser ablation started after 30 s of gas blank acquisition. Bi-Te and Au-Ag display a similar pattern, indicating that these paired elements have a genetic link. The whole spectrum is divided into two portions: (1) antithetical, where Bi-Te and Au-Ag have an antithetical correlation in terms of abundance (CPS); (2) correlative, where Bi, Te, Au, and Ag display similar patterns and peaks. For the correlative portion, Bi, Te, Au, and Ag are genetically linked, whereas the small peaks suggest nano-inclusions of Au-Ag-Bi-Te alloy.
Minerals 14 00843 g017
Table 1. Compilation of results by zone, with sphalerite temperatures, pyrite signatures, genetic interpretations gained from sphalerite, pyrrhotite, and chalcopyrite, and the new genetic zone interpretation.
ZoneOriginT °CTlSnWIn-Cd-ZnBi-Te-AuBackgroundSpPoCpyNew Origin
QFVolcanogenic X Volc VolcVolcVolc
CPZVolcanogenic382 X VolcVolcVolcVolc
DonnaVolcanogenic X VolcVolc
Grey CatOrogenic361 X OrogOrogVolc Orog-
dominated
HGZOrogenic364 XXOrogOrogOrog Orog
E2Orogenic XX Orog Orog-
dominated
GratienOrogenic348 X OrogOrog Orog
N110Orogenic369X Different
system
TeamHybrid XXXXXOrog OrogOrogOrog-
dominated
210Hybrid385 XXX Different
system
Upper HGZHydrid389 XX Orog OrogOrogOrog-
dominated
Eastern DeniseHydrid373 XXOrogOrogOrog Orog-
dominated
Denisehybrid398 X VolcVolcVolcVolc-
dominated
Origin: Interpretation from field and textural relatioships. T °C: Temperature calculated with the sphalerite GGIMFis geothermometer. Tl, Sn, W, In-Cd-Zn and Bi-Te-Au signatures of pyrite. Background: interpretation of the origin from the median backgroup signature of pyrite. Sp: interpretation of the origin from the sphalerite signature. Po: interpretation of the origin from the pyrrhotite signature. Cpy: interpretation of the origin from the chalcopyrite signature. New Origin: interpreted origin based on this study.
Disclaimer/Publisher’s Note: The statements, opinions and data contained in all publications are solely those of the individual author(s) and contributor(s) and not of MDPI and/or the editor(s). MDPI and/or the editor(s) disclaim responsibility for any injury to people or property resulting from any ideas, methods, instructions or products referred to in the content.

