Article

Characterization and Analysis of the Main Factors of Brittleness of Shale Oil Reservoirs in the Liushagang Formation, X Depression, Beibuwan Basin

1
Chongqing Key Laboratory of Complex Oilfield Exploration and Development, Chongqing University of Science and Technology, Chongqing 401331, China
2
Sinopec Petroleum Exploration and Production Research Institute, Beijing 102206, China
*
Author to whom correspondence should be addressed.
Minerals 2024, 14(9), 958; https://doi.org/10.3390/min14090958
Submission received: 13 August 2024 / Revised: 1 September 2024 / Accepted: 16 September 2024 / Published: 23 September 2024
(This article belongs to the Special Issue Distribution and Development of Faults and Fractures in Shales)

Abstract

:
The analysis of the main factors of brittleness is an important basis for the selection of engineering desserts in shale oil reservoirs. In this study, with the shale oil reservoir of the Liushagang Formation in the X Depression of the Beibuwan Basin as the research object, a characterization and analysis of the main factors of brittleness of the reservoir was performed in order to further reveal the brittleness of shale reservoirs in the study area. The brittleness of reservoirs in the study area was controlled by both internal and external factors, and the main factors of brittleness in the target section included the maturity of organic matter, horizontal stress difference, and brittle minerals. As the maturity of organic matter increased, the density, elastic modulus, and hardness of casein increased and the differentially hardened internal structure occurred and significantly affected brittleness. The mineral composition of the reservoir was characterized by complex mineral types and high contents of brittle minerals, and the minerals determining brittleness were mainly quartz, feldspar, calcite, and dolomite. The horizontal stress difference of the shale oil section was relatively small and contributed to fracturing and reforming. This study clarified the brittleness characteristics of E2l shale and its main factors, and provided a basis for the selection of shale formation geo-engineering dessert layers in the study area.

1. Introduction

Shale oil and gas resources are abundant and widely distributed, and have a significant effect on international political and economic patterns [1,2]. After the U.S.A realized energy independence through the shale oil and gas revolution [3], it transformed into a net exporter of crude oil in 2022 [4], and the rapid growth of shale oil and gas production has deeply reformed the energy industry in the U.S.A [5,6,7]. In China, the exploration of shale oil resources has also developed rapidly in the past five years [8], and the production of onshore shale oil was about 3.18 million tons of crude oil in 2022 [9,10]. Land-phase basins are widely distributed in China and contain several sets of organic-rich shale formations, and land-phase shale oil and gas has become an important resource [11].
In May 2022, a major breakthrough was achieved in China’s offshore shale oil, with the discovery of Liushagang Formation (E2l) shale oil in the X Depression of the Beibuwan Basin [12] allowing the diversification and sustainable development of China’s energy resources; this landmark event implied the development potential of the X Depression. Shale oil reservoirs generally need to be fractured before production, so the key challenges in the exploitation of shale oil reservoirs are the selection of favorable fracturing segments and the determination of engineering desserts [13,14]. Brittleness is an important parameter of the fracturability of shale reservoirs and can be used to optimize the selection of favorable fracturing sections [15,16,17]. Shale brittleness determines the difficulty in hydraulic fracturing and the pattern of fracture development [18,19]. Fracturing rocks with higher brittleness leads to the formation of larger-scale fracture systems containing widely distributed pores, which in turn increase shale gas production [20]. Existing brittleness evaluation methods mainly include the brittle mineral method, the elastic parameter evaluation method, the comprehensive evaluation method based on brittle minerals and elastic parameters, the triaxial stress–strain curve method, and imaging spectroscopy [21,22,23,24]. Shale brittleness is related to the internal and external factors of a rock. The external part of a rock is mainly affected by the depth of burial and the magnitude of horizontal stress difference, whereas the internal part of a rock is mainly controlled by minerals, the maturity of organic matter, cracks, porosity, and other factors [25,26,27,28,29]. The internal and external factors together determine the stress–strain relationship of a rock as well as the mechanical properties, such as the strength, energy, and elasticity modulus [30]. The exploration of the influences of different factors on rock brittleness is significant for the in-depth understanding of the fracture mechanism of rocks.
The shale oil resource in the Liushagang Formation (E2l) in the X Depression is still in the exploration stage and the reservoir brittleness characteristics and the main factors of brittleness are still unclear. In this study, with the shale oil reservoir of the Liushagang Formation in the X Depression as the research object, a characterization and analysis of main factors of the brittleness of the reservoir was performed in order to reveal the brittleness of shale reservoirs in the study area. This study revealed the brittleness characteristics of shale in the Liushagang Formation (E2l) and its controlling factors, and provided a basis for the selection of possible engineering desserts in the study area.

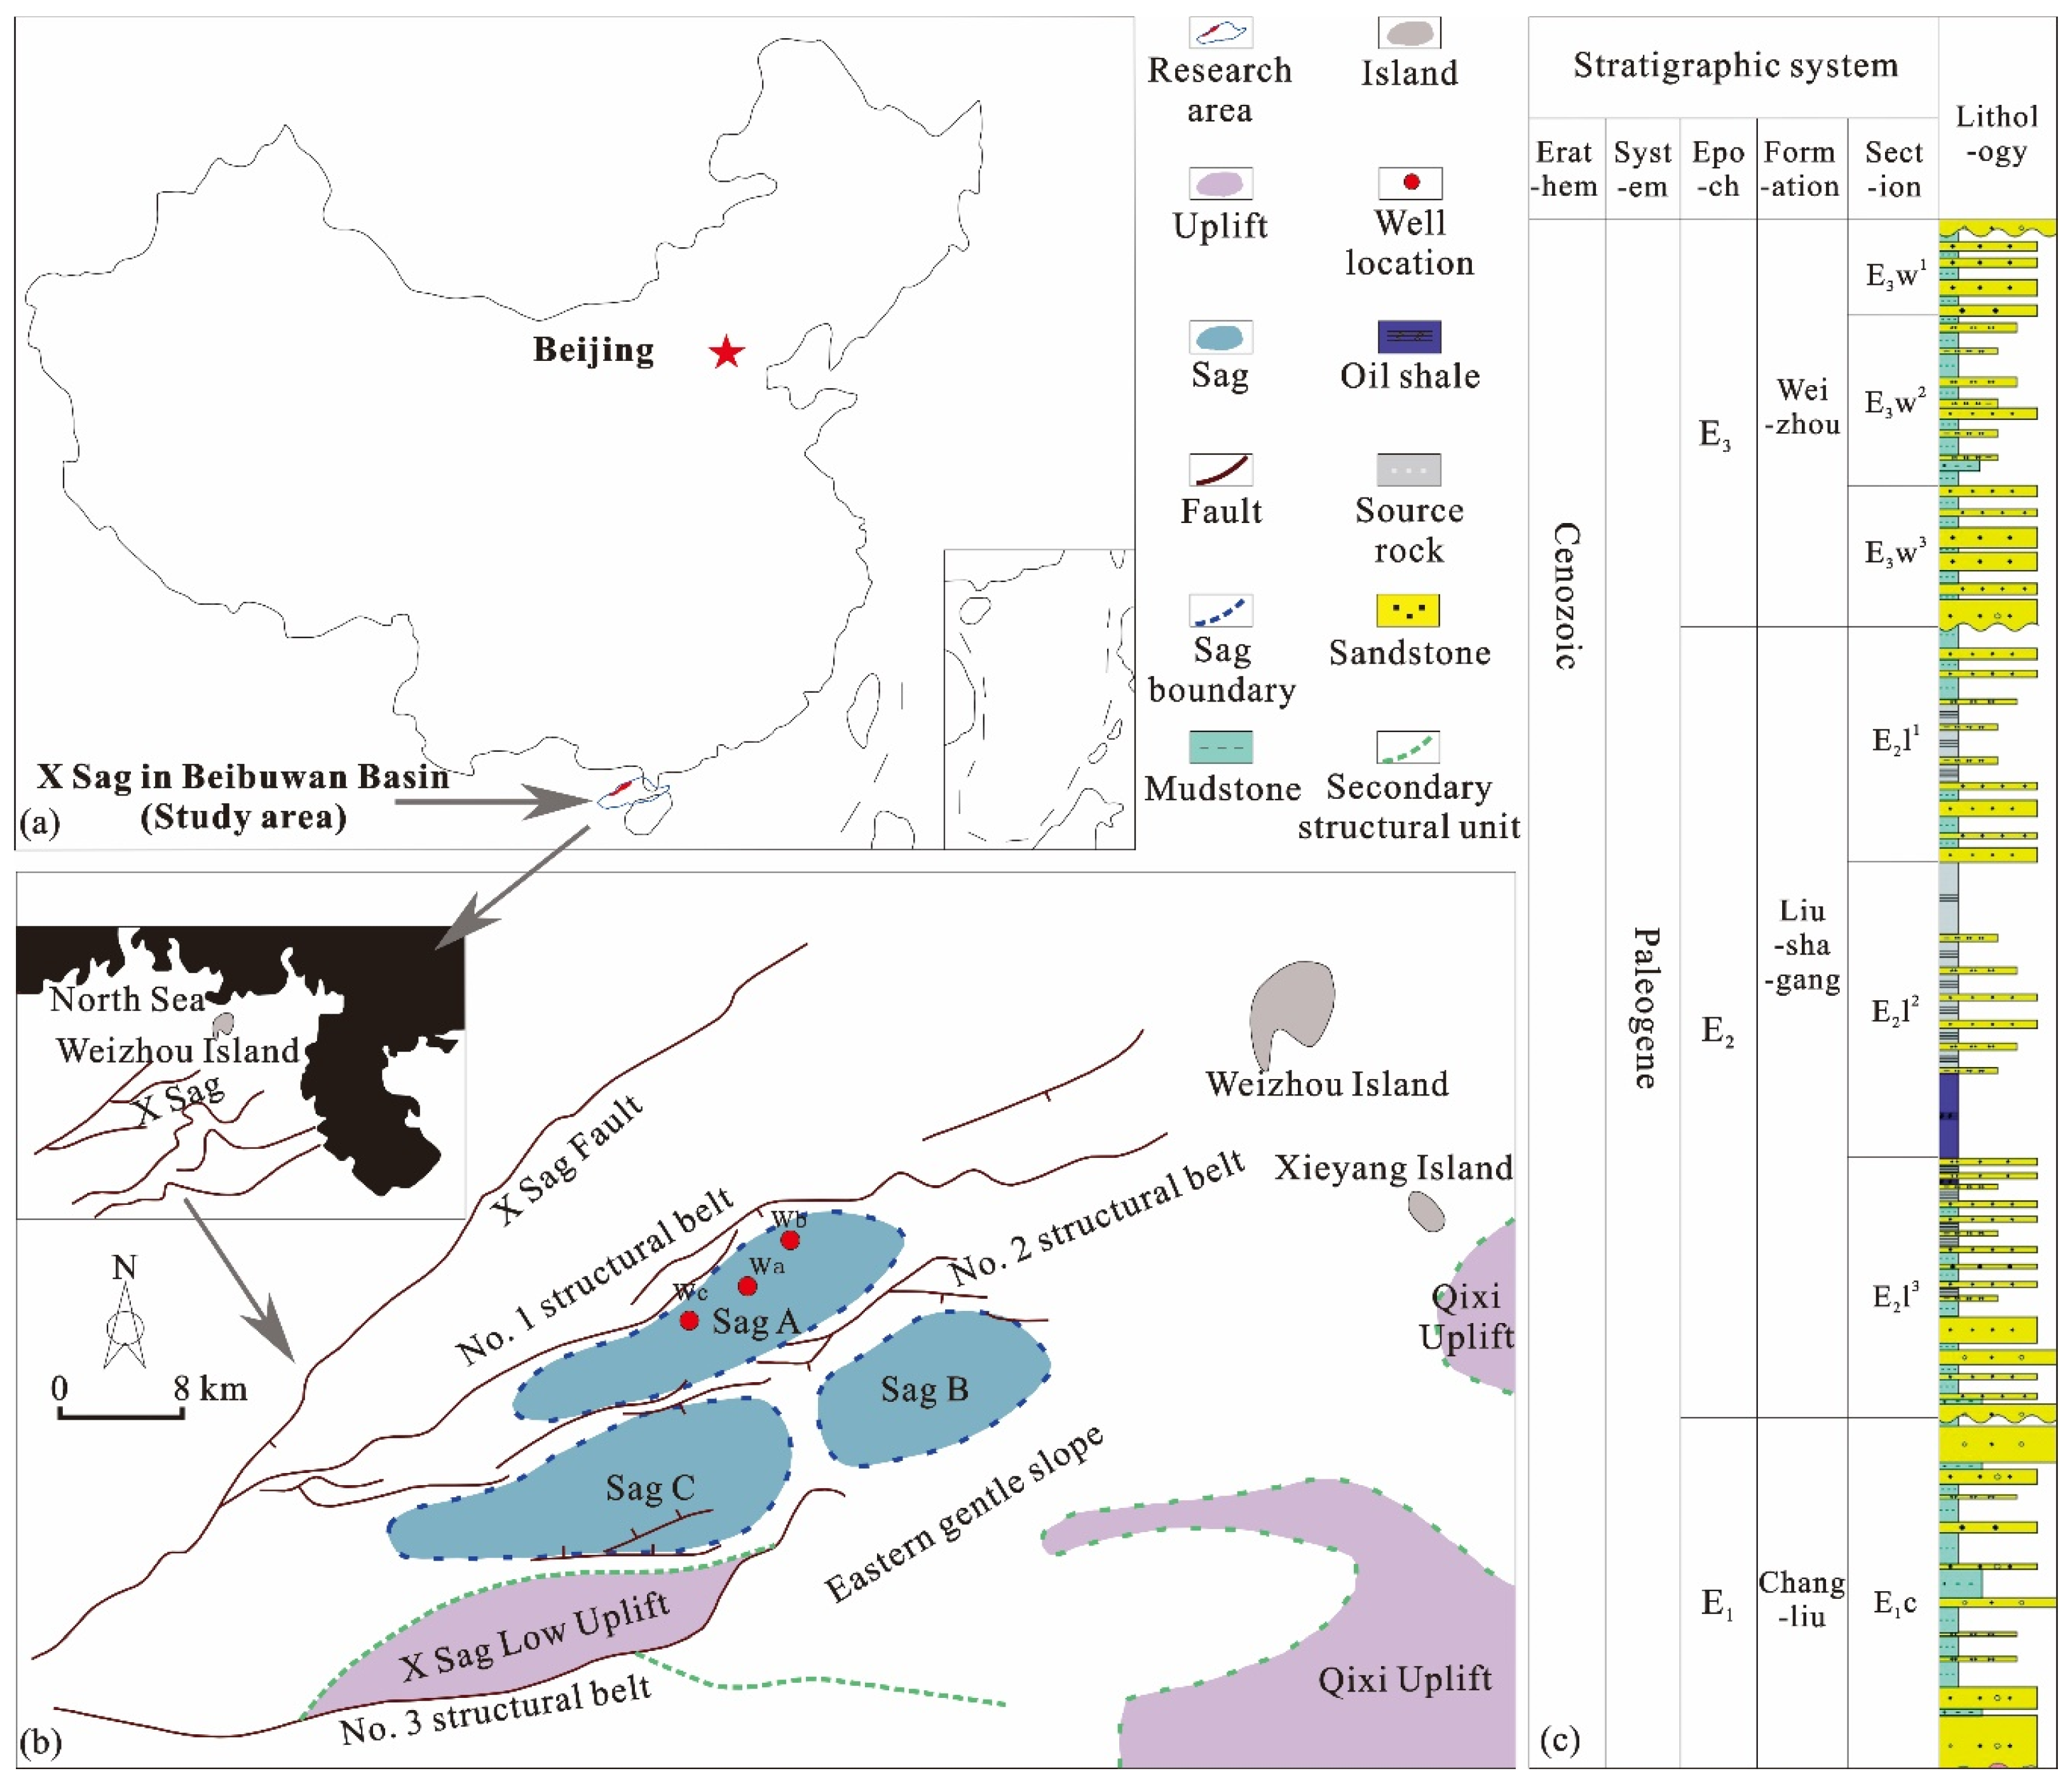
2. Geological Formation and Background

The study area is located in the X Depression in the Beibuwan Basin of China, which is one of the basins with the highest water contents in the continental shelf in the northern part of the South China Sea, and covered an area of about 3.9 × 10⁴ km2; it was formed during the Paleoproterozoic rifting period and is bordered by the Qixi uplift to the east [31] (Figure 1a). The X Depression, a tertiary tectonic depression in the northwestern Beibuwan Basin [32], is one of the most explored depressions, and is rich in oil and gas at present. The depression is divided into three subdepressions (A, B, and C), which were respectively formed during the two extension periods of the Paleogene and Neogene, and is rich in shale oil resources mainly distributed in the downthrown block of Fault 1 and the periphery of Fault 2 (Figure 1b) [33]. During the rifting stage, several sets of Paleocene and Neocene strata were deposited in the basin, and the Paleocene Eocene Liushagang Formation (E2l) can be divided into Sections E2l1, E2l2, and E2l3 according to the differences in petrographic characteristics. In Section E2l2, a thick succession of mud shale and oil shale is deposited mainly in a semi-deep lake-deep lake environment (Figure 1c) and has become the main hydrocarbon source rock of shale oil [9]. Section E2l2 is the main target layer in this study. The longitudinal lithology and petrography of the target layer are complex and show rapid variations, and the reservoir is strongly non-homogeneous [12]. The brittleness characteristics of the study area were seldom reported, and the main controlling factors of brittleness are still not clear [32]. Therefore, it is necessary to investigate the characteristics and main controlling factors of the brittleness of the reservoir in the study area.

3. Samples and Methods

3.1. Experimental Methods

A total of 41 rock samples were obtained from the X Depression in the Beibuwan Basin, China. A series of parameters and properties were determined with 41 shale samples (sampling depth range of 2950 to 3010 m), mainly including total organic carbon (TOC) content, maturity, mineral composition, field emission scanning electron microscopy (FE-SEM), and physical properties, and all the tests were completed by the Zhanjiang Experimental Center of CNOOC Energy Development Co., Ltd., Zhanjiang, China. The TOC contents of 32 samples were tested with a carbon and sulfur analyzer (LECO CS-230) according to the GB/T 19145-2003 Determination [34] of Total Organic Carbon in Sedimentary Rocks. The asphaltene reflectances (Rb) of 9 samples were determined with an MPV-III microphotometer according to the SY/T 5124-1995 [35] Determination Method of Vitrinite Reflectance in Sedimentary Rocks. The equivalent vitrinite reflectance (Ro) was calculated with the formula Ro = 0.319 5 + 0.679Rb [36]. Mineral fractions of 29 samples were determined with an X-ray diffractometer (SmartLab9, Rigaku Corporation, Tokyo, Japan) according to the SY/T 5163-2010 [37] Methods for X-Diffraction Analysis of Clay Minerals and Common Non-Clay Minerals in Sedimentary Rock. Twenty-two samples were investigated with a scanning electron microscope (Quanta 200F FE-SEM, Thermo Fisher, Waltham, MA, USA). The cast thin sections of 18 samples were observed with a polarized light microscope (Leica DM4500P, D03GS019, Leica Microsystems, Wetzlar, Germany) according to the standard SY/T 5368-2000 [38] Rock Thin Section Identification.

3.2. Characterization Methods of Reservoir Parameters

The main factors of brittleness are classified into intrinsic and extrinsic factors. Extrinsic factors mainly include burial depth and horizontal stress difference, and intrinsic factors mainly include brittle minerals, maturity of organic matter, natural cracks, laminations, porosity, and adsorption, which control the stress–strain relationship of the rock as well as the mechanical properties such as strength, energy, and elastic modulus [25,39]. The influences of porosity and adsorption were generally less considered in previous studies [40,41], so the parameters to be considered in this study included minerals, linear density of laminations, fracture development index, and maturity of organic matter. Horizontal stress difference was obtained from the data interpretation in the software Ciflog Version 3.1. The characterization methods of the above parameters are introduced as follows.

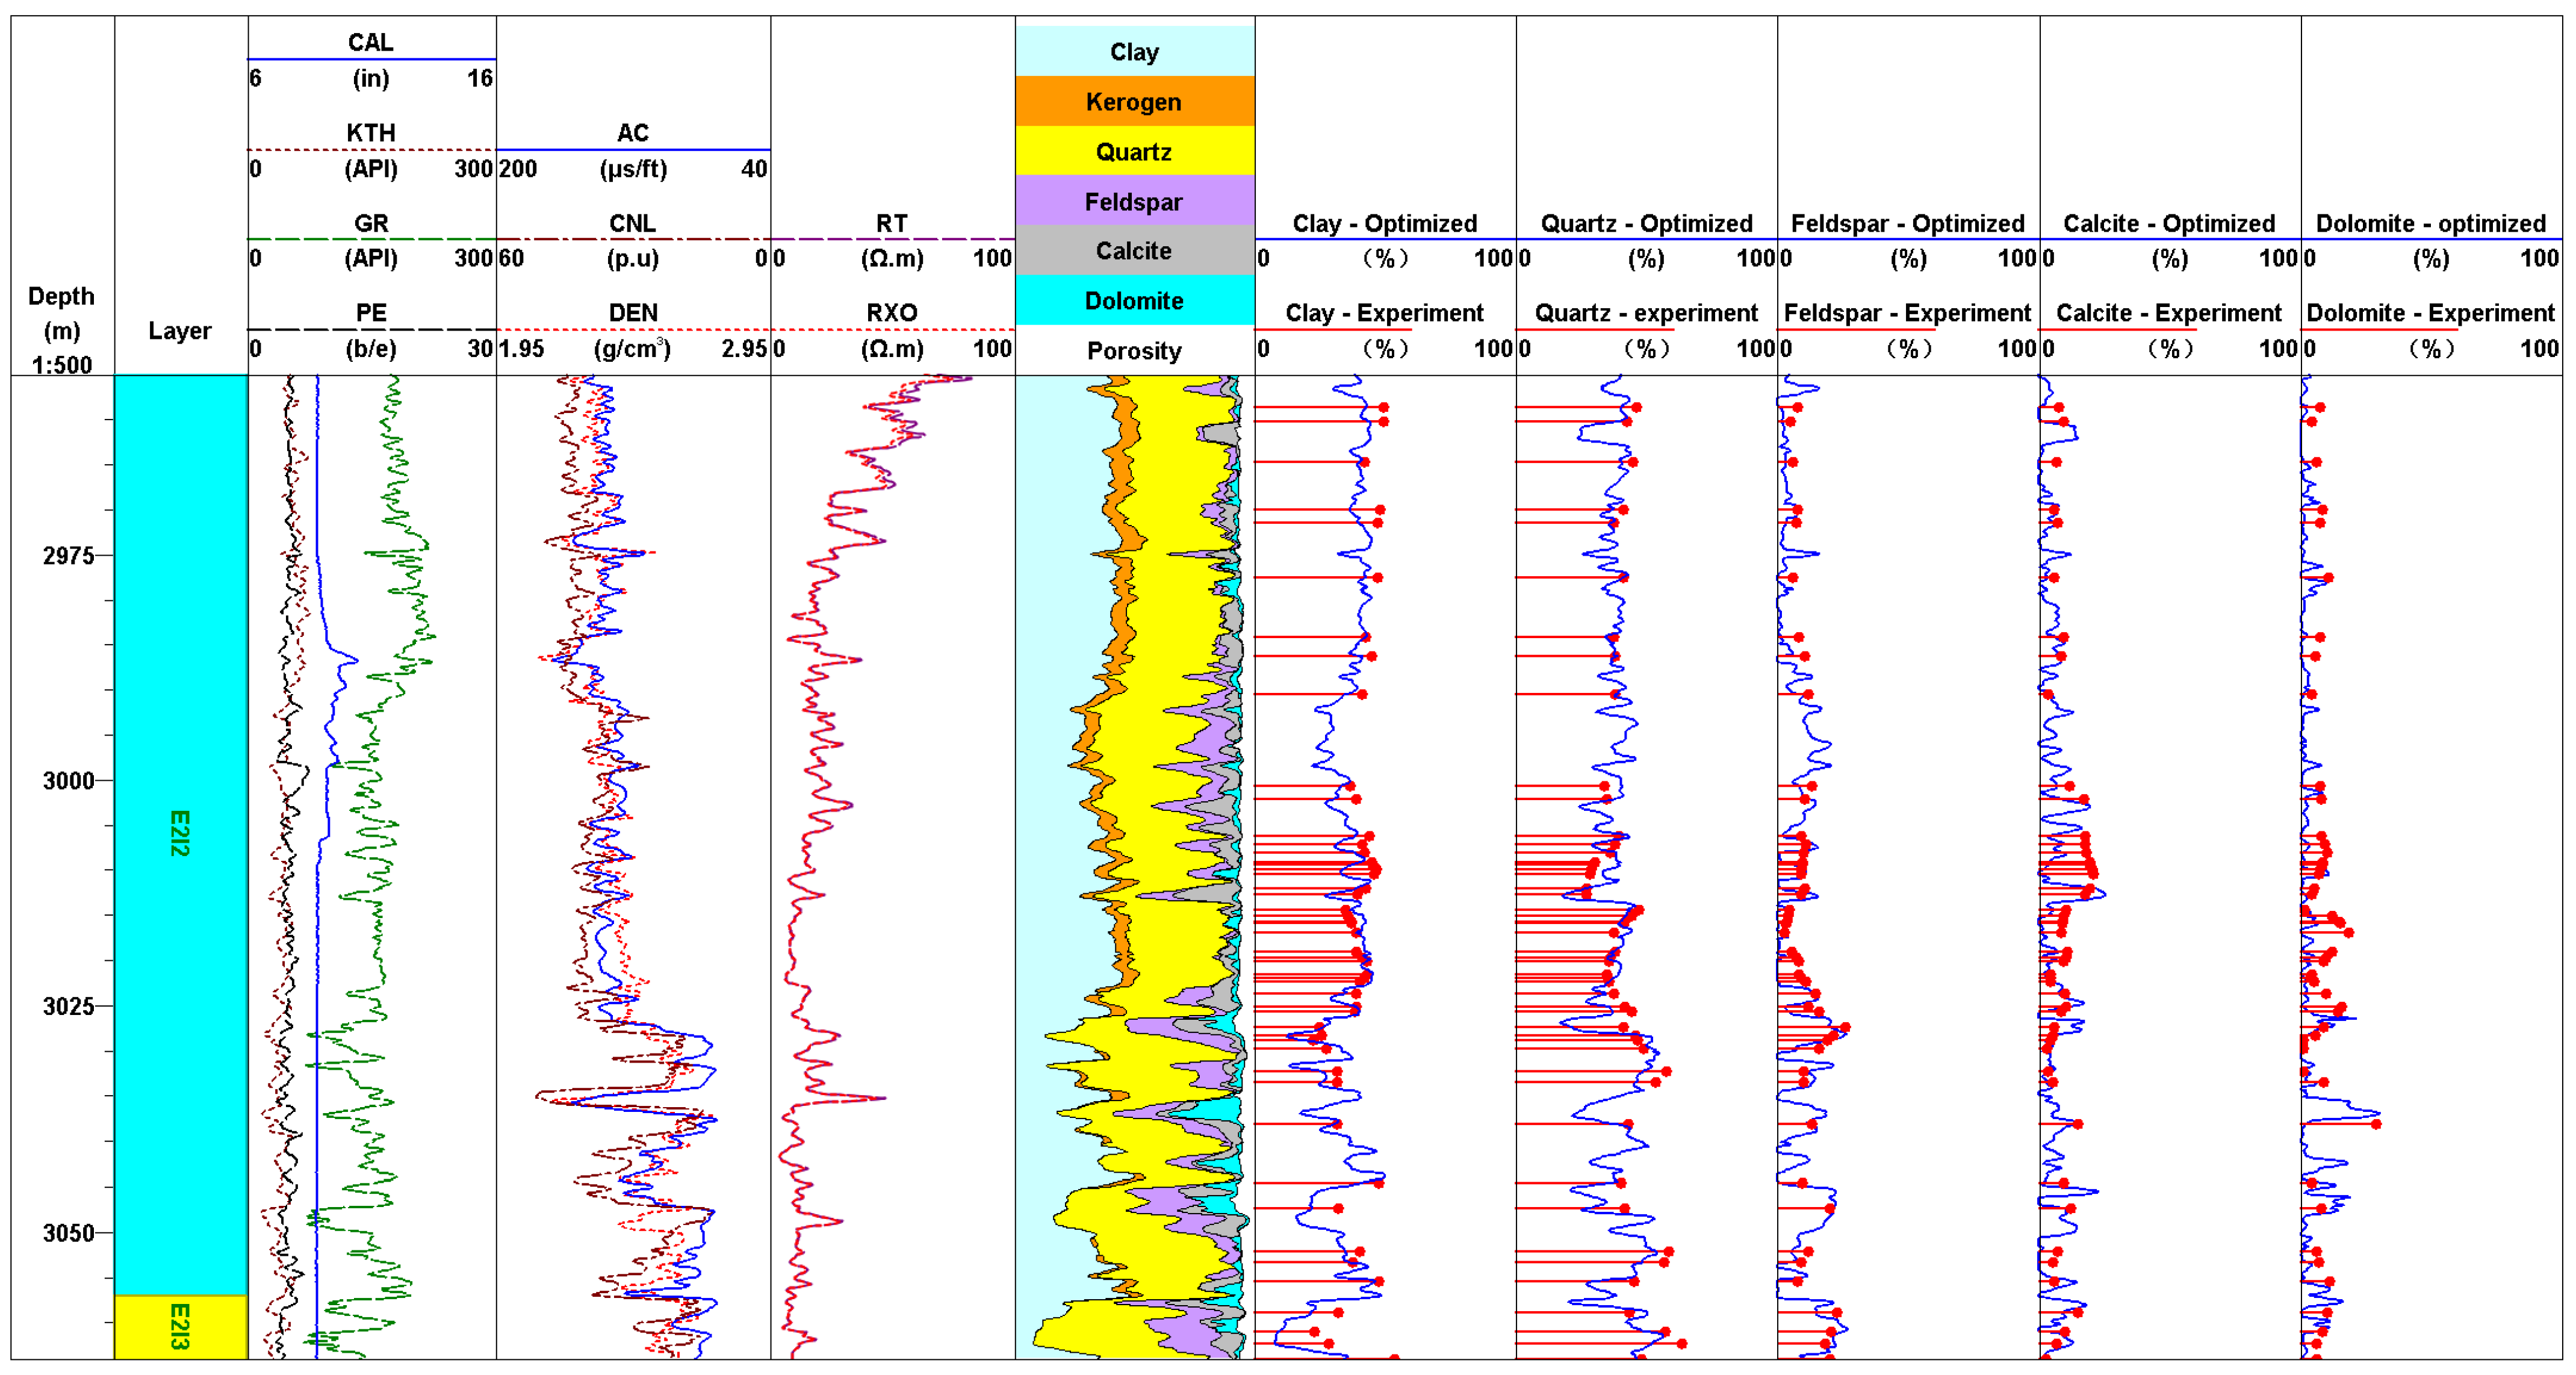
3.2.1. Calculation of Mineral Content

The inverse calculation of mineral volume percentage is the basis of reservoir evaluation and the differences in lithology, physical properties, and brittleness can be initially obtained from the changes of volume percentages of minerals. The X-ray diffraction analysis of whole-rock mineralogy is the most direct and accurate method to determine the mineral composition of the core. However, due to the limitations of coring and experimental conditions, X-ray diffraction can only yield the values of several discrete points, which are not enough for the continuous evaluation of the whole phase. In the more reliable method, elemental logging data are generally used to obtain the continuous mineral distribution based on the oxide closure model. However, based on the consideration of the economic effect, elemental logging is generally carried out only in a small number of evaluation wells. Conventional logging data are a mandatory item to be determined for each well and contain mineral information, so the construction of the mineral content inversion model based on conventional logging was the basis for the evaluation of mineral components, lithology, and brittleness in the whole area. The mineral inversion of conventional logging curves has been extensively explored, but its accuracy or applicability is not good [42,43,44]. In this study, based on a previous study [45], we constructed a petrophysical volume model of double-skeleton mineral components in oil shale reservoirs and carried out the inverse calculation of mineral contents based on the multi-mineral volume model constrained by petrophysical conditions with the least-squares and singular-value decomposition methods so as to improve the accuracy and regional applicability of mineral inversion (Figure 2).

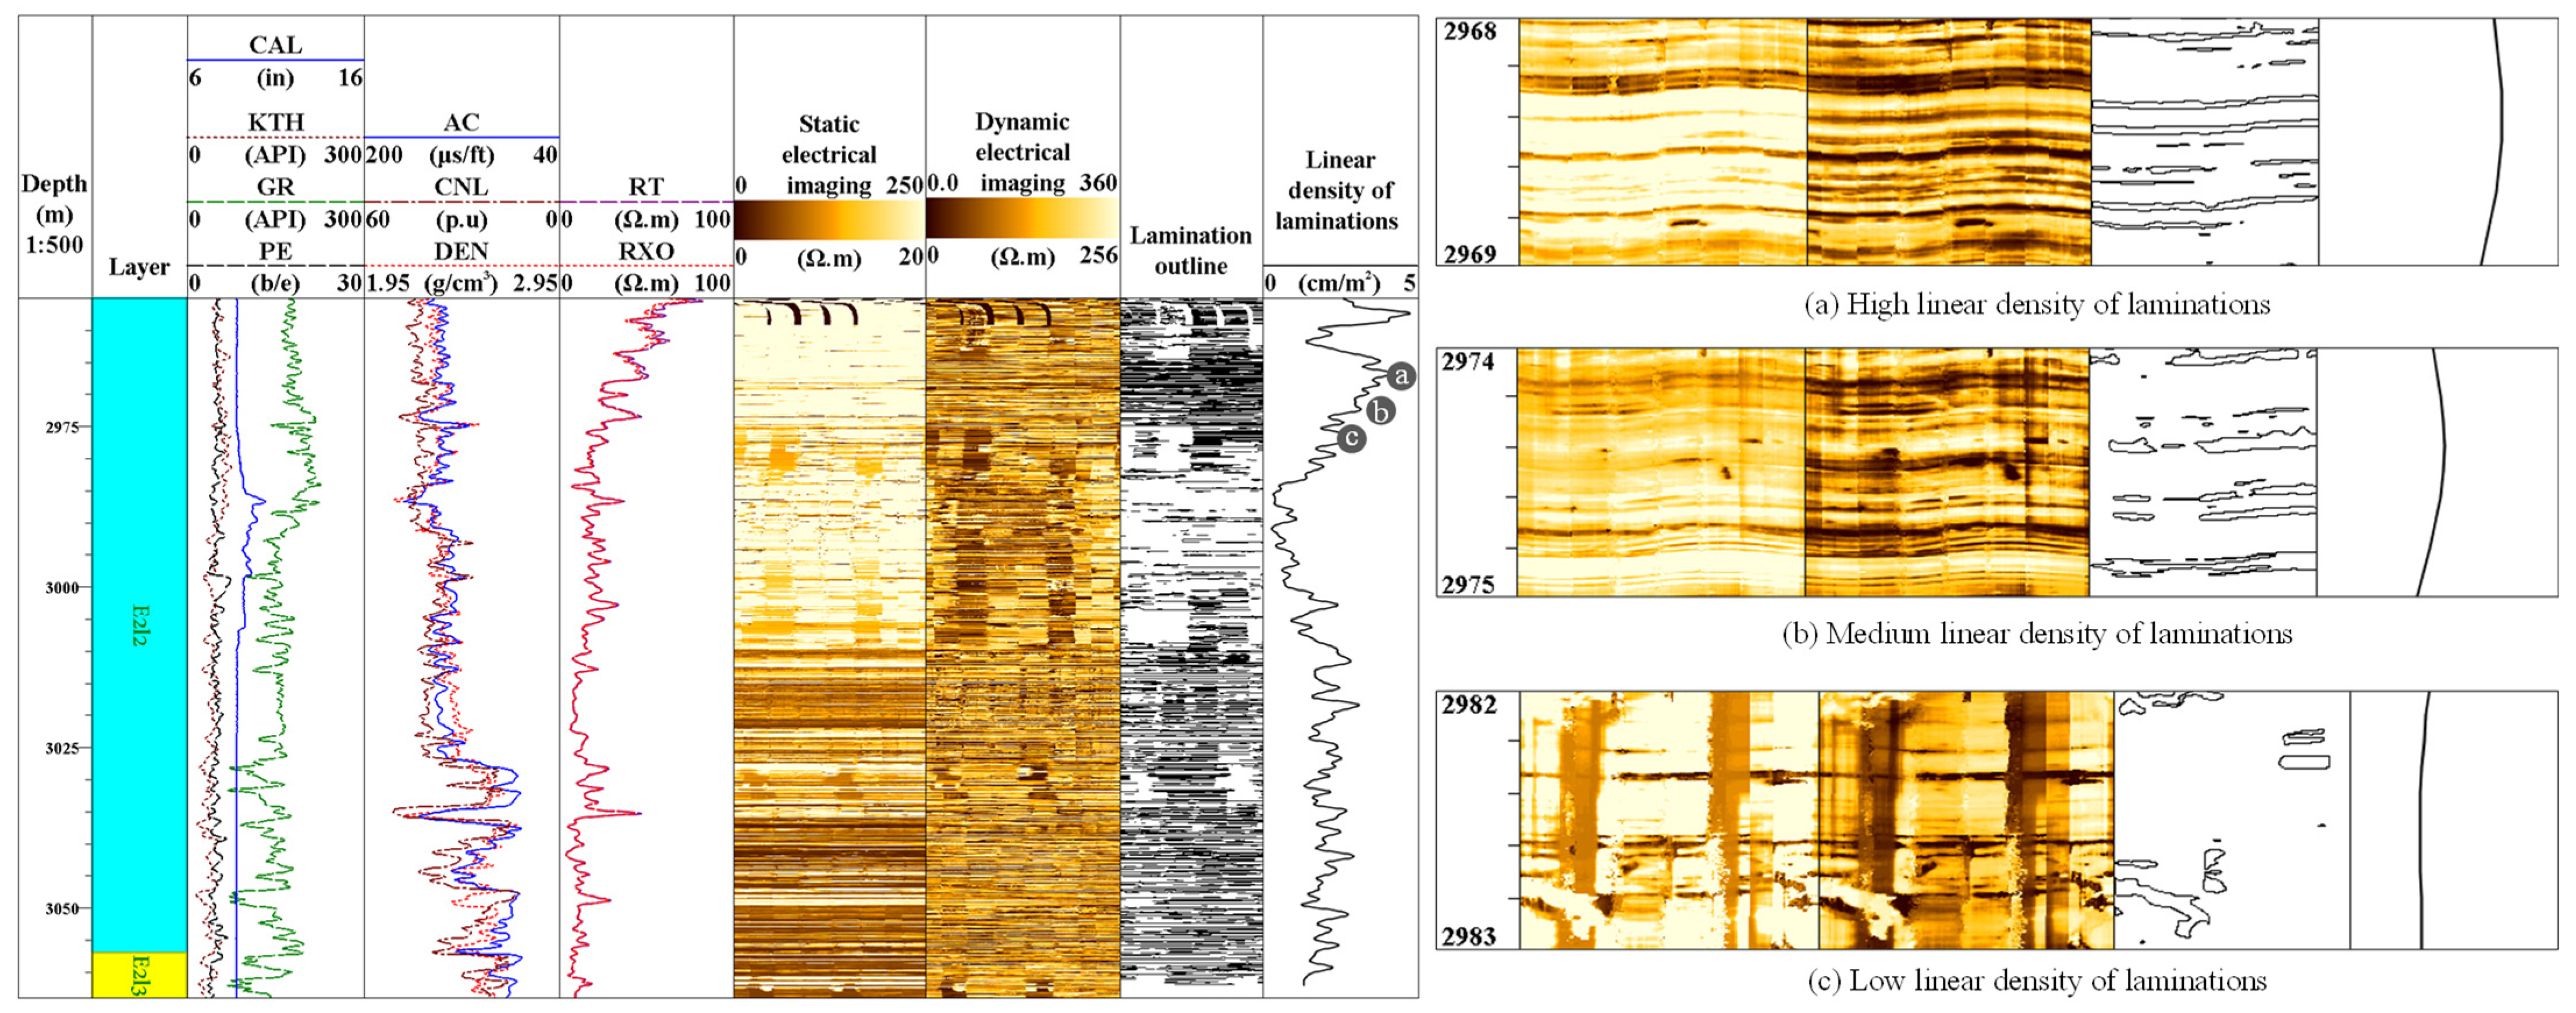
3.2.2. Calculation of Linear Density of Laminations

Among the acquisition methods of lamination parameters from logging data, the most intuitive extraction method is the image processing method based on electro-imaging logging images. The method consists of five main steps [46] (Figure 3). First, the images are filled to make sure that the electro-imaging images are complete images. In other words, after filling the images, there are no blank bars between the images, so that the recognition of laminations is not affected. Second, the boundaries of laminations are determined with a segmentation algorithm, so that the locations and areas of laminations can be accurately identified. Thirdly, lamination calibration and contour tracking extraction are performed, so that the feature information of laminations can be accurately extracted. Fourthly, the extracted lamination information is stored with the algorithm for subsequent processing and analysis. Fifthly, the parameters of the stored lamination are calculated with the algorithm. The extracted lamination parameter in this study is the linear density of laminations.

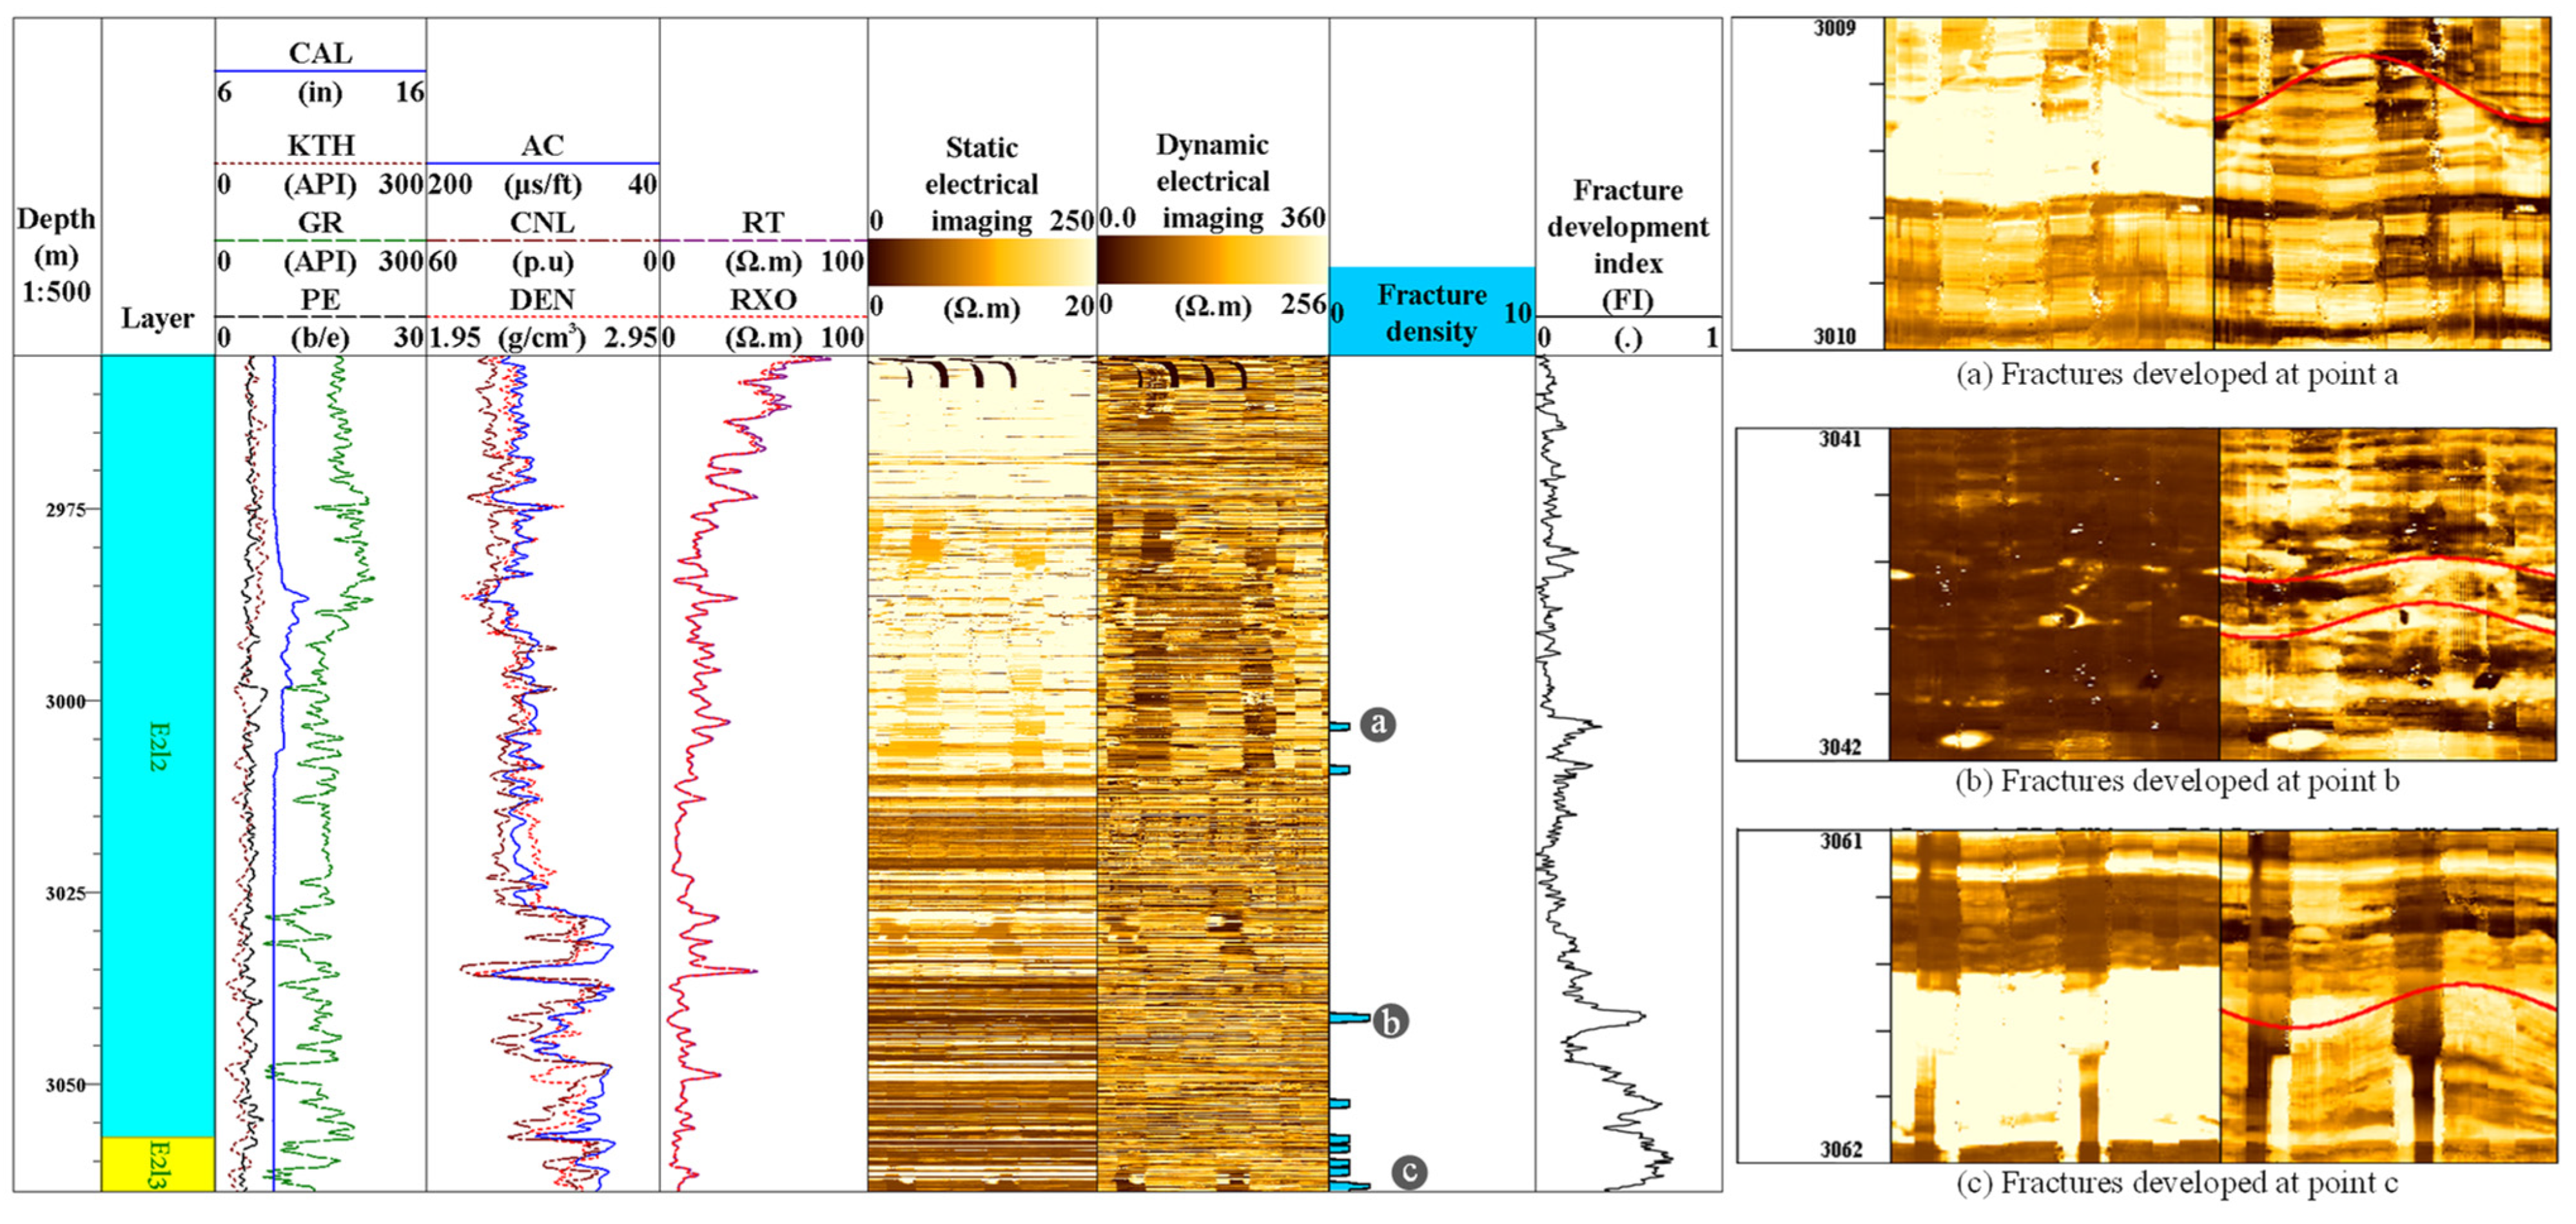
3.2.3. Calculation of Fracture Development Index with Logging Data

Fracture development index (FI) is an index used to characterize the degree of fracture development in rocks and calculated with various methods. These calculation methods are mostly based on conventional logging data. Although conventional logging data contain less fracture data, the contained weak high-frequency signals indicating the development of fractures can be utilized. These useful signals are expressed in different forms in various conventional logging methods. For example, the existence of fractures can be determined with the resistivity differences obtained from dual lateral logging data. The development of fractures can be determined with acoustic time differences obtained from sonic logging data. The distribution of fractures can be determined with the oscillation of caliper logging curves. The natural gamma energy spectral logging method and density logging method can increase U-element content and decrease the density so as to determine the degree of fracture development [47]. In these methods, the well sections with developed fractures can be identified by separating and extracting weak high-frequency signals indicating fracture development. Previous studies have focused on new identification techniques of fractures and conventional logging techniques for identifying fractures based on new theories. Approximately 50 fracture identification methods have been proposed [48]. These methods allowed the calculation of the fracture development index. Although numerous methods have been proposed, a commonly accepted efficient method for all the reservoirs has not been developed. He et al. (2023) [49] compared the three widely used methods (weighted probability index method, wavelet transform method, and fractal dimension method) and concluded that the weighted probability index method was the most efficient. Li et al. (2021) [48] concluded that the three-porosity ratio method and resistivity intrusion correction difference ratio method were the most efficient for fracture identification. In the two methods, the information of fracture development was extracted through processing and analyzing logging data. Nonlinear techniques such as the neural network technique and gray correlation technique achieved good results in some studies, but they need to be further improved due to complexity and uncertainty.
In general, the calculation of the fracture development index is complex and involves various logging methods and techniques. Through in-depth analysis and processing of conventional logging data, weak high-frequency signals indicating fracture development can be effectively extracted, so as to accurately identify the well sections with developed fractures. Due to the continuous development of new logging technologies and theories, the calculation method of the fracture development index will be improved. In this paper, based on previous studies [47,48,49], according to the weighted probability index method, with the three-porosity ratio and the resistivity intrusion correction difference ratio as the input of the probability index, the calculation model of the fracture development index (FI) for this particular study area is constructed as follows:
F I = R p + R T C 2 ,
R p = ρ m a ρ b ρ m ρ f + ϕ N m a ϕ N ϕ N m a ϕ N f 2 Δ t m a Δ t Δ t m a Δ t f / ϕ D + ϕ N 2 ,
R T C = ( R t R L L s ) / R L L s ,
R t = a · R L L d b · R L L s ,
where FI is the fracture development index; R p is the three-porosity ratio; ρ , ϕ , and Δ t are, respectively, the density (g/cm3), porosity (%), and acoustic time-difference values (us/ft) of rock components; m a is the skeletal composition of the rock; f is the fluid in the rock; R T C is the resistivity intrusion correction difference ratio; R L L d and R L L s are, respectively, the deep and shallow resistivities (r·m); and a and b are the resistivity intrusion correction coefficients and can be experimentally determined. Equations (2)–(4) were taken from a previous report [48].

3.2.4. Calculation of the Maturity of Organic Matter

The maturity of organic matter indicates the degree of conversion of organic matter into hydrocarbons. Under the same total organic carbon (TOC) content, the maturity of organic matter is an important indicator of the hydrocarbon production capacity of hydrocarbon source rocks and also determines the oil and gas production of hydrocarbon source rocks [50]. The most important index of the maturity of organic matter is vitrinite reflectance (Ro) [51]. In this paper, Ro was used to quantitatively evaluate the maturity of organic matter. Ro is mainly affected by formation temperature and pressure and also has a good correlation with logging curves, thus allowing the construction of the calculation model of Ro with conventional logging data [52]. In the study, the calculation model of Ro was determined through the regression analysis of Ro and conventional logging curves.

4. Results

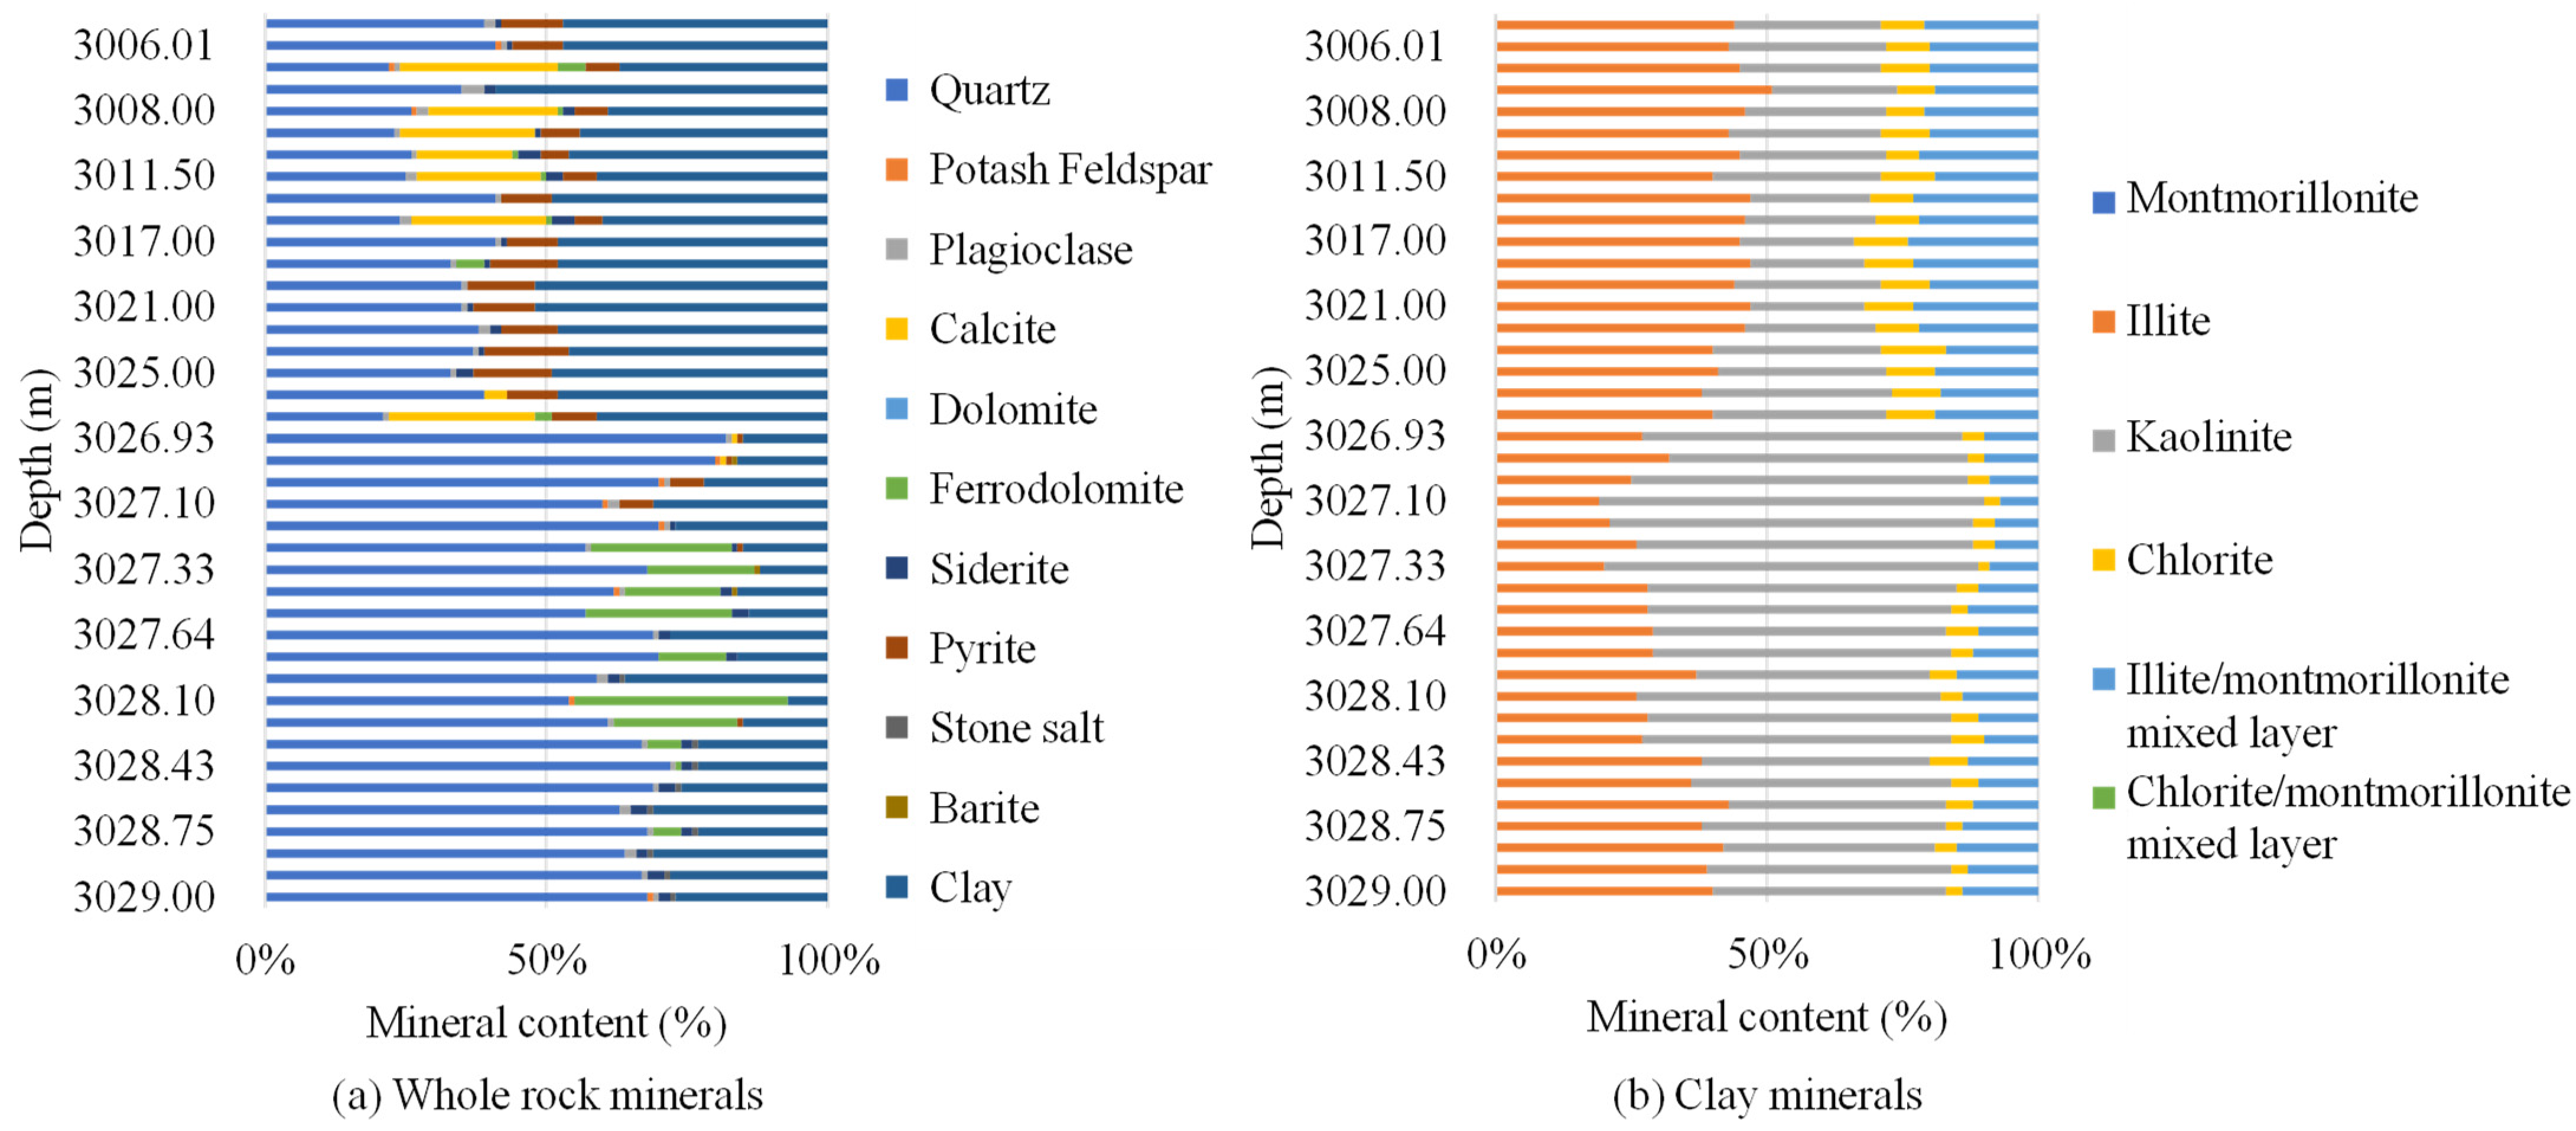
4.1. Experimental Analysis and Calculation Results of Mineral Contents

Based on the X-diffraction whole-rock mineral analysis of the lower sequence of E2l2 and the upper sequence of E2l3, feldspathic minerals were the main minerals in the reservoir and its content ranged from 28% to 78% (average content = 53%), The content of clay minerals ranged from 27% to 56% (average content = 42%). The lower section was essentially free of calcite. Average calcite content in the upper section was about 17%. Pyrite distribution showed the same pattern, but its average content was only about 7%. The average contents of other minerals were lower than 10% and dolomite, rock salt, and barite were essentially absent in the reservoir. Quartz content showed an obvious segmental change. Quartz content increased sharply at a depth below 3026 m and was nearly double of that in the upper section, whereas clay content showed the opposite trend. Among clay minerals, illite and kaolinite had the highest contents (Figure 4). From the mineral point of view, the difference in the contents of brittle minerals (feldspar and quartz) in the reservoir caused the significant difference in the longitudinal brittleness/compressibility of the reservoir. Through the mineral content and petrographic analysis, the lower sequence of E2l2 and the upper sequence of E2l3 show the characteristics of complex minerals and high contents of brittle minerals.
With the above methods, the organic skeleton and inorganic skeleton mineral components were calculated. The optimal inversion results of the mineral contents in Well Wa are shown in Figure 5. The red bar chart shows the percentages of mineral components obtained in core X-ray diffraction experiments (XRD). The percentages of mineral components determined in XRD experiments were the weight percentages of minerals, whereas the percentages of mineral components calculated from logging data were volume percentages. For the purpose of direct comparison, the weight percentages of minerals were converted into volume percentages: Volume percentage of Mineral X = (weight percentage of Mineral X/density of Mineral X)/Σ (weight percentages of various minerals/densities of various minerals)). Blue solid lines show the optimal inversion results of the percentages of mineral components. The percentages of mineral components calculated with the optimized inversion of the double-skeleton mineral component model were consistent with the percentages of mineral components determined in the core X-diffraction experiments (Figure 5). The data analysis showed that the average relative errors between the calculated mineral percentages and the mineral percentages determined in the core X-diffraction experiments were less than 5% and the average absolute errors were less than 10%.

4.2. Calculation Results of Linear Density of Laminations

The calculation of the linear density of laminations was carried out for several wells in the study area. The results of Well Wa (Figure 6) were compared with the electro-imaging data. The comparison results showed that the linear density of laminations was consistent with the results in the electro-imaging image. The comparison of the whole well section indicated that no abnormality phenomenon was found. The trend of the linear density of laminations was consistent with that in the electro-imaging results, indicating that the lamination parameter extraction method proposed in this paper was reliable. The method could efficiently identify laminations and quantify the linear density of laminations for timely engineering interpretation. In this paper, the characterization of lamination parameters can provide a parameter basis for the subsequent construction of the brittleness model.

4.3. Calculation Results of Fracture Development Index Based on Logging Data

The calculation results of fracture development index FI are shown in Figure 7. In order to verify whether the calculated fracture index is reasonable and reliable, through human–computer interaction, in the logging interpretation software Ciflog Version 3.1, the identification of fractures and the calculation of fracture density parameter were carried out based on the results of artificial calibration and parameter calculation. The obtained result was compared with the calculated fracture development index. The comparison results indicated a good correspondence between the calculation results and identification results. The fracture development index showed an increasing tendency in the layers with calibrated fractures, indicating that the fracture development index could better indicate the development of fractures. In the matrix oil shale reservoir, fractures were basically not developed and fractures only locally existed at the bottom of laminations and interlayers. Fractures were seldom developed in Sections E2l2 and E2l3 and the characteristics of laminations were obvious in the two sections, indicating that the water environment of the target layer was more stable in the depositional stage.

4.4. Calculation Results of Vitrinite Reflectance

Vitrinite reflectance (Ro) has a potential correlation with conventional logging curves. The regression analysis between Ro-Measured and conventional logging curves indicated that the density (DEN) and neutron (CNL) logging curves had the most significant correlation with Ro-Measured. Through multivariate regression, the Ro regression calculation model (Equation (5)) was obtained. The coefficient of determination between the calculated values of the model and the measured values of experiments was up to 0.83 (Figure 8) and the obtained model laid the better foundation for the subsequent evaluation.
R o = 0.478 + 0.13 × D E N 0.001 × C N L
where DEN is the density log, g/cm3 and CNL is the neutron log, v/v.

4.5. Calculation Results of Horizontal Stress Difference

The calculation of horizontal stress difference was performed in Ciflog Version 3.1 software. Horizontal stress difference was obtained by choosing an appropriate calculation model in the software for the data. In the electro-logging image, it was found that the fractures were seldom developed in the target layer and mainly developed in the interlayers. Fractures were basically not observed in the matrix, but the laminations were more developed. It could be approximated as a transversely isotropic medium. The horizontal stress calculation model for TIV (Transversely Isotropic Medium) medium is usually used to calculate the horizontal stress for these types of reservoirs in petroleum engineering. This calculation model takes into account the anisotropy of the subsurface rock and can more accurately describe the state of horizontal stress. The calculation results showed that minimum horizontal principal stress ranged from 49.5 Mpa to 64.0 Mpa with an average value of 58 Mpa. Maximum horizontal principal stress ranged from 52 Mpa to 70 Mpa with an average value of 61.5 Mpa. Horizontal stress difference ranged from 0.8 Mpa to 6.8 Mpa with an average value of 2.2 Mpa (Figure 9).

5. Discussion

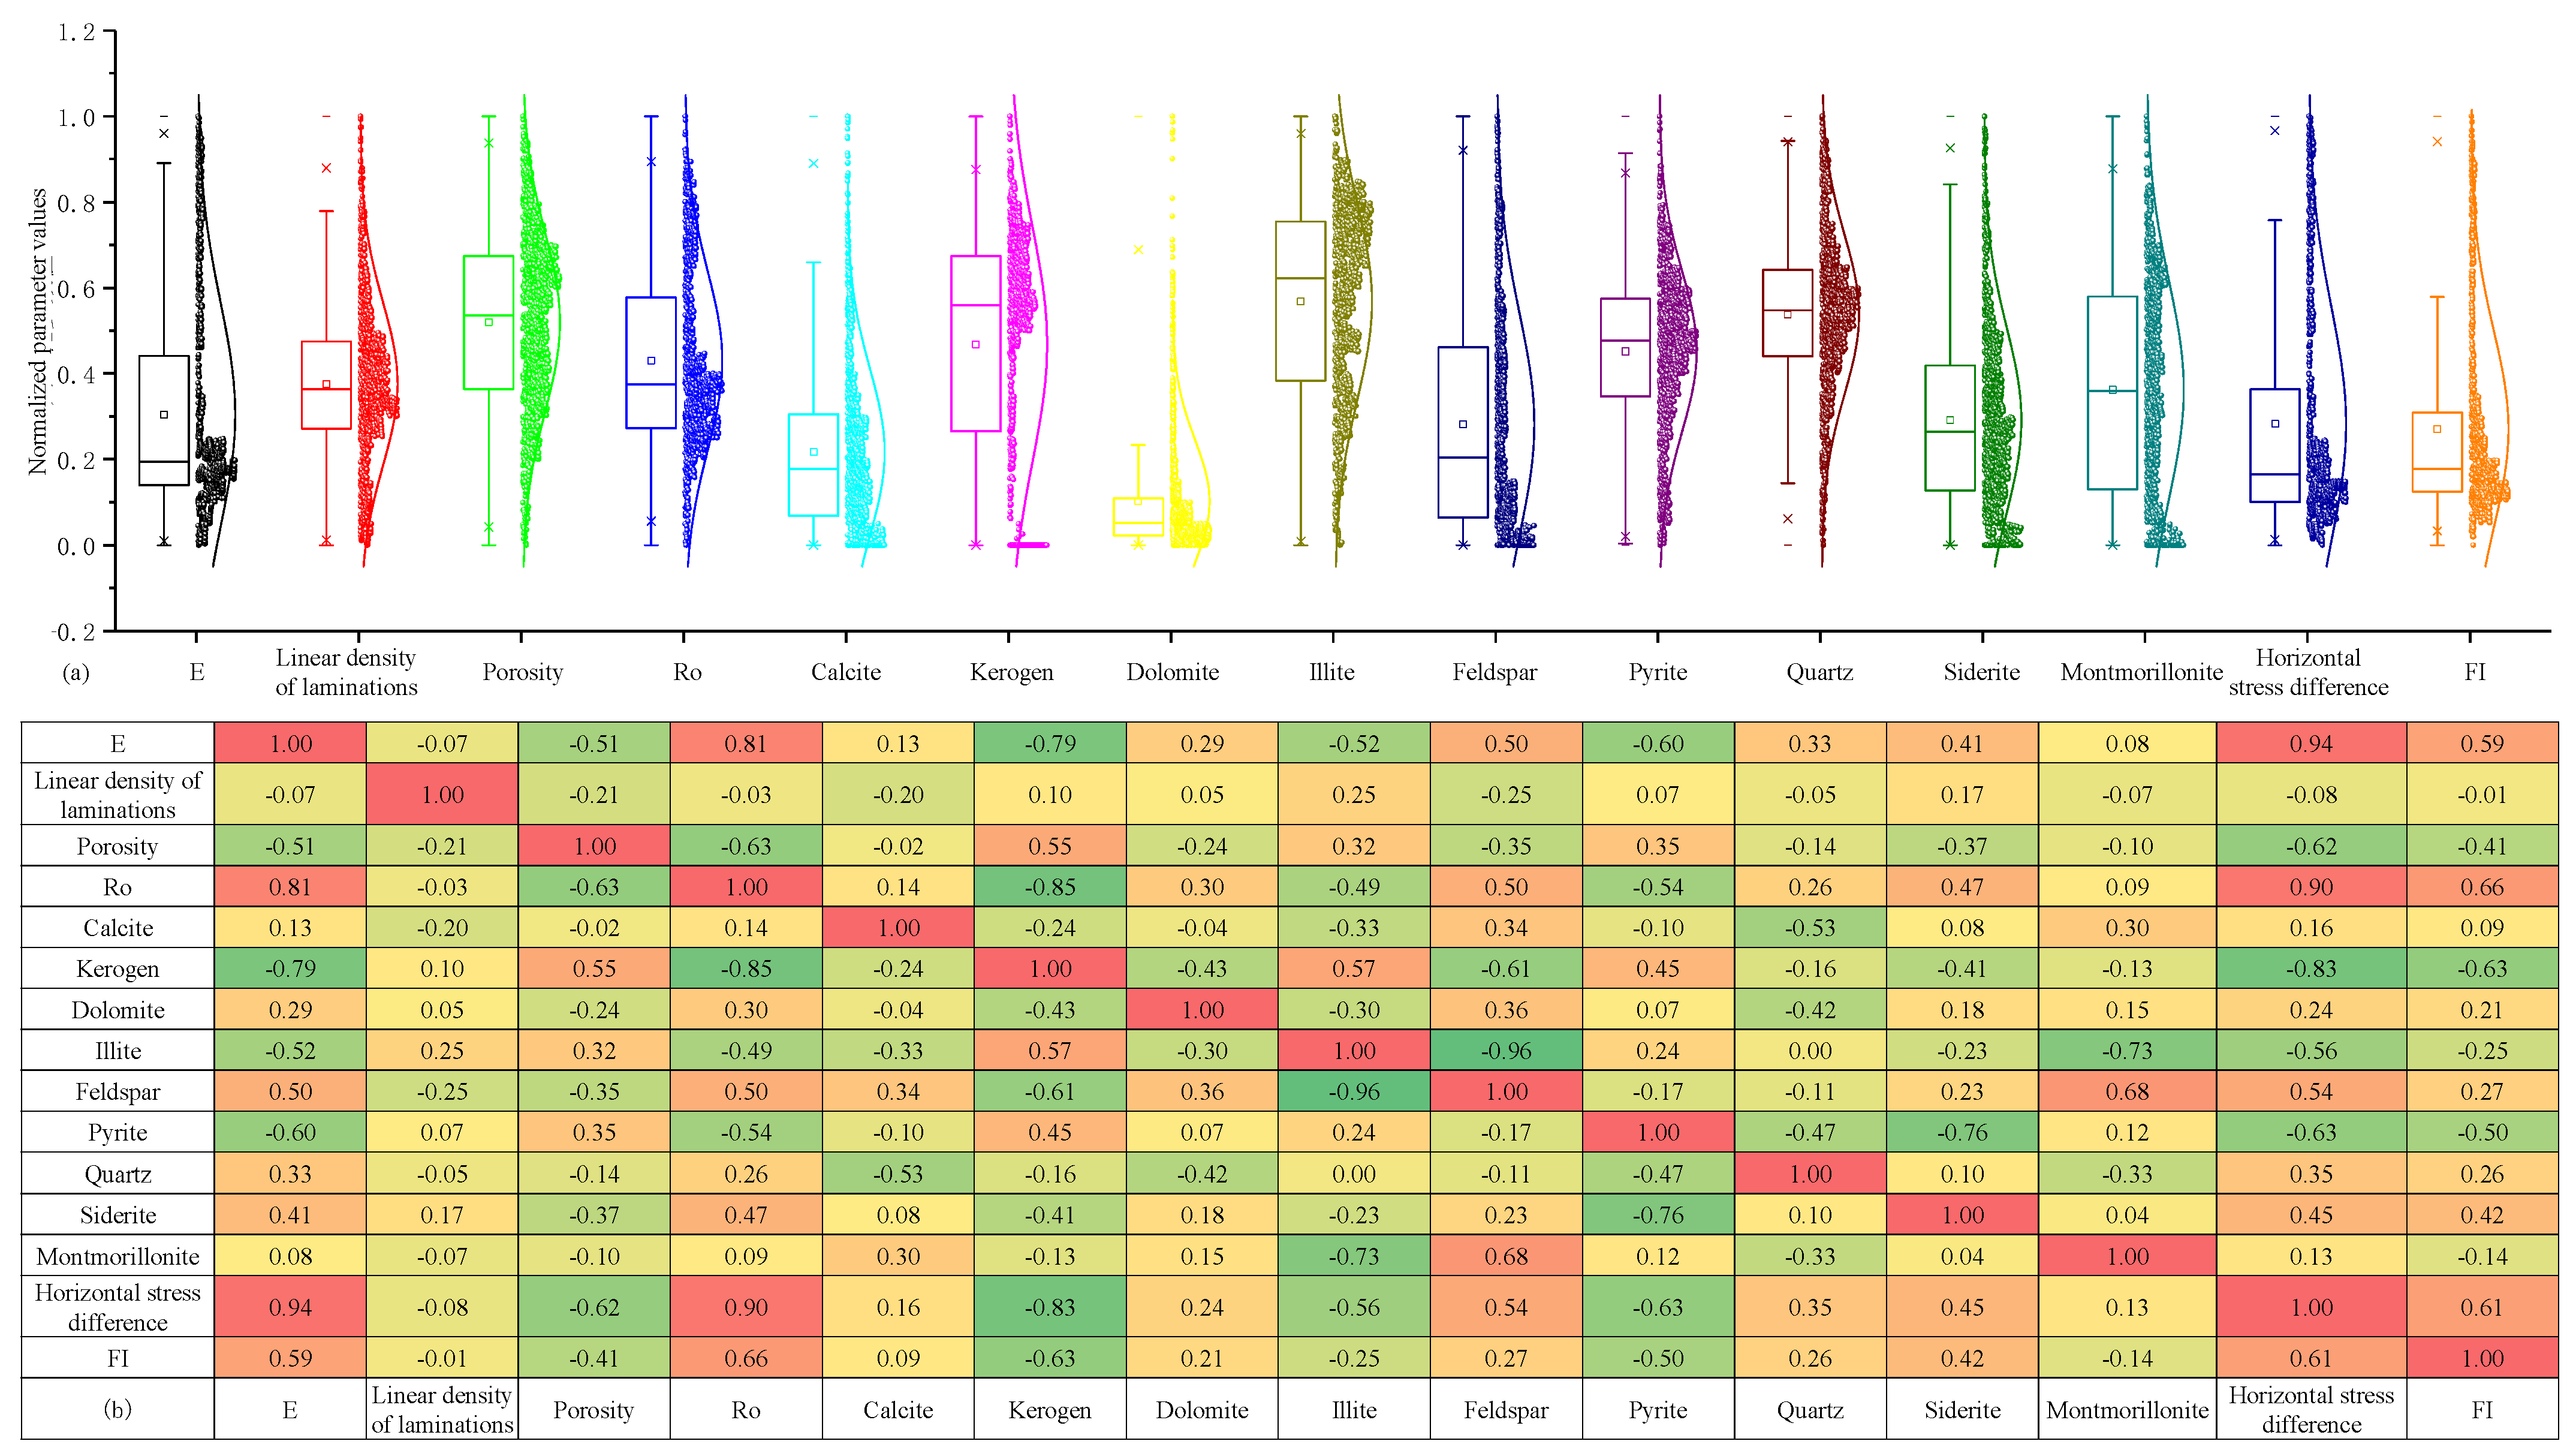
5.1. Correlation Analysis of the Main Factors and Brittleness

Rickman et al. (2008) [53] explored the relationships between rock brittleness index BI and two parameters (Young’s modulus E and Poisson’s ratio υ) with statistical methods and concluded that the ability of rocks to sustain damage during loading could be quantified with Poisson’s ratio, whereas the ability of rocks to retain internal fractures after damage could be quantified with Young’s modulus. They proposed that rock brittleness was positively correlated with Young’s modulus and negatively correlated with Poisson’s ratio. Finally, they established the brittleness index (Figure 10) and widely applied it in oil fields in South America.
In this study, the correlation coefficient matrix between quantitative parameters and Young’s modulus was established by taking Young’s modulus as the benchmark (Figure 11). Horizontal stress difference and Ro showed the closest distribution with Young’s modulus. The coefficient of determination (R2) between the above factors and Young’s modulus ranked in the following descending order: horizontal stress difference > Ro > fracture development index > feldspar content > rhodochrosite content > quartz content > dolomite content > calcite content. The correlations indicated that the main factors of the brittleness in shale oil reservoirs in the study area mainly included horizontal stress difference, Ro, fracture development index, feldspar content, rhodochrosite content, quartz content, dolomite content, and calcite content. The fractures in shale oil reservoirs in the study area were basically undeveloped. Although the correlation between crack development index and Young’s modulus was significant, the contribution of fractures to reservoir brittleness was small. Therefore, fractures were not considered in the quantification of the brittleness index. It was believed that the main factors of the brittleness of shale oil reservoirs in the study area included mineral content difference, Ro, and horizontal stress difference.

5.2. Analysis of the Main Factors of Brittleness

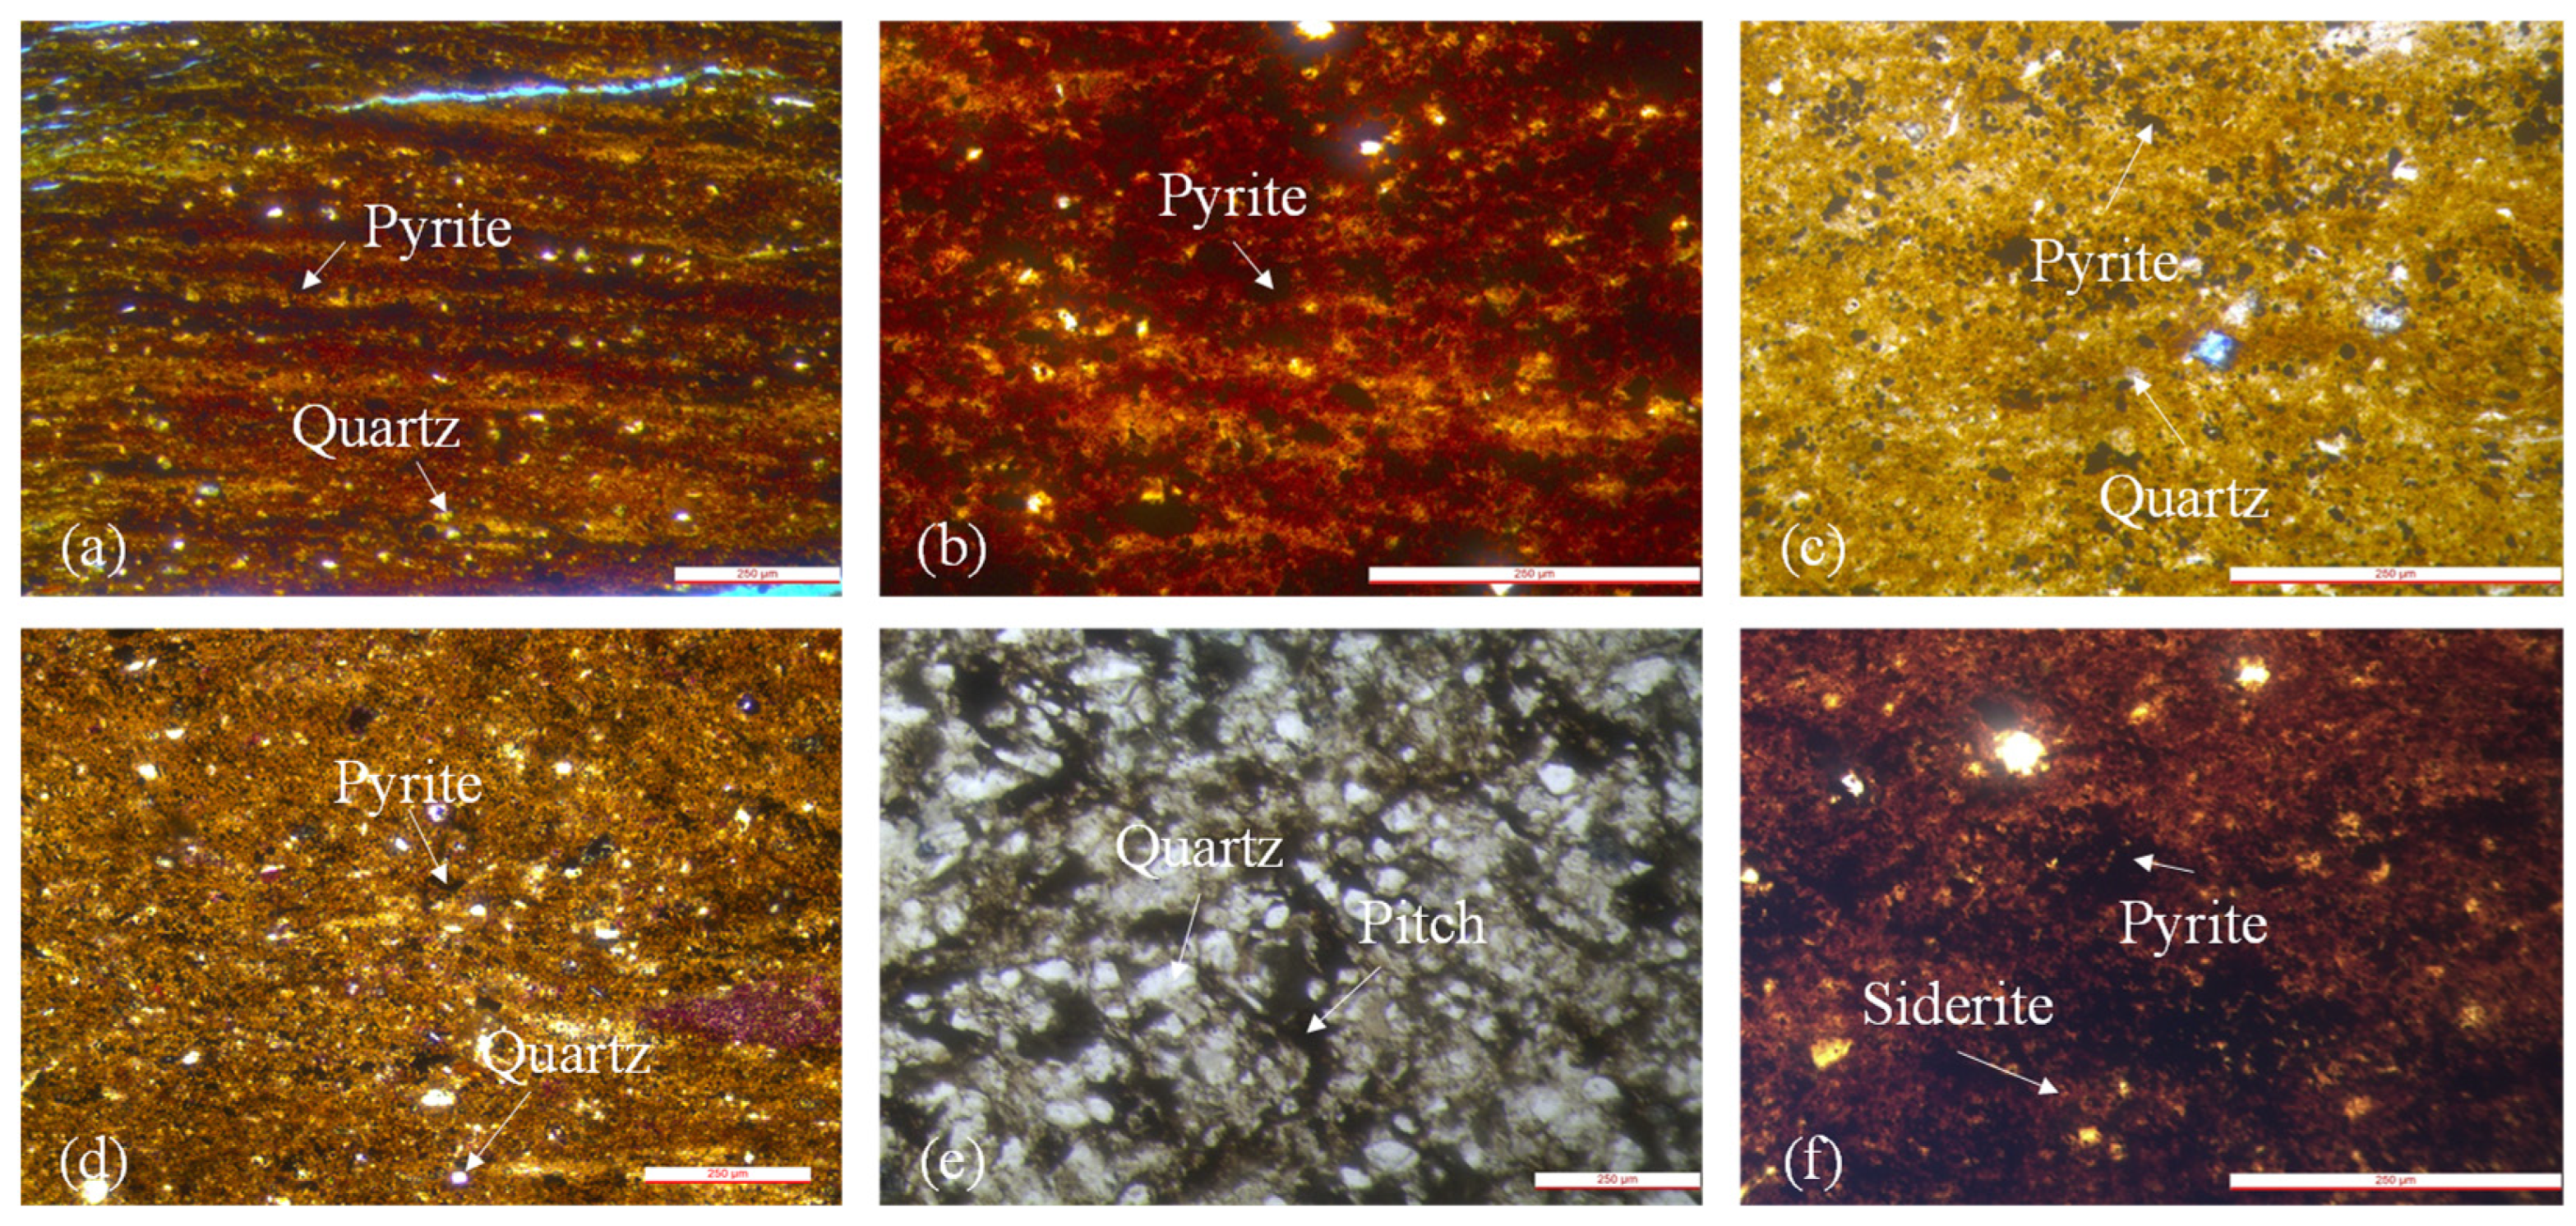
5.2.1. Brittle Minerals

The Young’s modulus and Poisson’s ratio of a rock are significantly affected by its mineral composition. Rocks with high contents of brittle minerals such as quartz and feldspar usually have a high Young’s modulus because the strong bonding between the particles of these minerals increases the overall stiffness, whereas those with high contents of plastic minerals such as clay minerals have a low Young’s modulus because of their soft structure and weak bonding. In addition, the Young’s modulus and Poisson’s ratio of rocks are also affected by other factors such as the proportion of minerals and the size and spatial arrangement of particles. The interactions among different minerals have complex effects, which jointly determine the mechanical properties of rocks.
The above analysis indicated that the influences of various minerals on Young’s modulus ranked in the following descending order: feldspar > rhodochrosite > quartz > dolomite > calcite. Pyrite, like quartz, has a high elastic modulus and a low Poisson’s ratio, which correspond to a high brittleness index. The presence of pyrite increased the overall stiffness of rocks, thus increasing the brittleness of rocks. However, in the study area, pyrite showed a weak increasing effect and even a negative effect. In the observation of the core casting thin section (Figure 12), pyrite existed in the form of granular or tiny particles, which were dispersed with a low content. From top to bottom, pyrite content gradually decreased, and the depositional environment gradually shifted from a reducing environment to an oxidizing environment. Pyrite was gradually converted into siderite, and sandstone was deposited. The presence of sandstone interlayers greatly improved the brittleness of the reservoir. The above observations indicated the negative correlation between pyrite content and Young’s modulus and the positive correlation between rhodochrosite content and Young’s modulus. However, due to the low content of rhodochrosite, quartz, and feldspar, calcite and dolomite were the main minerals which were responsible for the difference in reservoir brittleness attitude.

5.2.2. Maturity of Organic Matter

The strong correlation between the maturity of organic matter and Young’s modulus was ascribed to the transformations in the structures and properties of organic matter during thermal evolution, including density, chemical structures, hardness, Young’s modulus, and porosity of organic matter. Previous studies indicated that the density, hardness, and Young’s modulus of typical organic matter, such as casein, increased with the increase in the maturity of organic matter due to the decrease in the ratio of carbon–hydrogen bonds, nitrogen, sulfur, oxygen, and hydrocarbons in casein and the increase in carbon-hydrogen ratio and aromatic compounds. In the thermal evolution, the molecular structures of aromatic compounds underwent physical reorientation and rearrangement, which somewhat reduced the overall defects and enhanced rock brittleness [54]. The data analysis results showed that the coefficient of determination between Ro and Young’s modulus of the target layer in the study area was as high as 0.81 (Figure 13). The maturity of organic matter largely determined the brittleness difference.

5.2.3. Horizontal Stress Difference

Horizontal stress difference is negatively correlated with the brittleness of rocks. With the increase in brittleness, horizontal stress difference gradually decreases. Horizontal stress difference determines the fracture mode. When horizontal stress difference is small, the propagation direction and path of fractures are randomly and massively deflected, thus resulting in the larger and more complex fracture network, which is conducive to the transportation of oil and gas. However, the propagation path corresponding to a larger stress difference is basically not deflected and the fracture basically only expands along the direction of the maximum horizontal stress, thus resulting in a single fracture network. Therefore, the latent hydrocarbons around the single fracture cannot be transported out. Horizontal stress difference affects the fracturing pattern of rocks and thus the shale brittleness.
Horizontal stress difference in this oil shale section was low (0.8 to 6.8 Mpa, mean = 2.2 Mpa) and favorable for fracturing and reforming. The good correlation between horizontal stress difference and Young’s modulus is one of the main factors of the brittleness of the target section. The correlation between horizontal stress difference and brittleness index can be utilized in the selection of high-quality target sections for shale oil reservoirs in the study area.

6. Conclusions

The mineral composition of the target section in the study area was characterized by complex mineral types and high contents of brittle minerals, and the main minerals that determined the brittleness index mainly included quartz, feldspar, calcite, and dolomite. Pyrite, one of the commonly recognized brittle minerals, was negatively correlated with brittleness due to its small content, scattered distribution, and the influences of other major minerals in the rock.
The brittleness of reservoirs in the study area was controlled by both intrinsic and extrinsic factors. The coefficient of determination (R2) between the above factors and Young’s modulus ranked in the following descending order: horizontal stress difference > maturity of organic matter > fracture development index > feldspar content > rhodochrosite content > quartz content > dolomite content > calcite content. The contribution of fractures to brittleness was not significant due to the low fracture development in the reservoir. The main factors of the brittleness of the target section mainly included maturity of organic matter, horizontal stress difference, and brittle minerals.
The investigation on the influences of the main factors on brittleness and the construction of a brittleness evaluation model considering maturity of organic matter, horizontal stress difference, and brittle minerals will promote the selection of high-quality target sections in shale oil reservoirs in the study area and guide fracture reforming.

Author Contributions

Conceptualization, Y.L. and R.W.; Methodology, F.L.; Software, M.T. and C.Z.; Formal analysis, Y.L., C.Z. and R.W.; Data curation, M.T.; Writing—original draft, Y.L.; Writing—review & editing, F.L.; Supervision, Y.L., C.Z. and R.W.; Funding acquisition, F.L. All authors have read and agreed to the published version of the manuscript.

Funding

This research was jointly supported by the National Natural Science Foundation of China (414021185196400752104080), Chongqing Basic Research and Frontier Exploration Projects (cstc2018jcyjAX0503), and Chongqing Postgraduate Research and Innovative Projects (CYS22722).

Data Availability Statement

All data provided within the article.

Acknowledgments

Thank you Zhanjiang branch of China Oilfield Services Limited, Zhanjiang 524057, China, for the assistance and support, and I would like to express my heartfelt gratitude.

Conflicts of Interest

Ruyue Wang is affiliated with the SINOPEC Petroleum Exploration and Production Research Institute. The paper reflects the views of the scientists and not the company.

References

  1. Lei, Q.; Weng, D.W.; Xiong, S.C.; Liu, H.B.; Guan, B.S.; Deng, Q.; Yan, X.M.; Liang, H.B.; Ma, Z.Y. Progress and development directions of shale oil reservoir stimulation technology of China National Petroleum Corporation. Pet. Explor. Dev. Online 2021, 48, 1198–1207. [Google Scholar] [CrossRef]
  2. Arfaoui, I.; Hamdi, O.; Boulvain, F. Geochemical and mineralogical characterizations of Silurian “Hot” shales: Implications for shale gas/oil reservoir potential in Jeffara basin-southeastern Tunisia, North Africa. J. Afr. Earth Sci. 2024, 212, 105213. [Google Scholar] [CrossRef]
  3. Mauricio, T.F.; Adrián, M.; Wei, Y.; Jijun, M. Characterization of complex hydraulic fractures in Eagle Ford shale oil development through embedded discrete fracture modeling. Pet. Explor. Dev. Online 2021, 48, 713–720. [Google Scholar]
  4. Kubra, H.U.; Nukhet, D.; Hakan, M.B. Effects of US foreign and domestic shocks on US shale oil production across different basins. Resour. Policy 2022, 79, 102991. [Google Scholar]
  5. Stinchfield, B.T.; Auch, T.; Bratman, E. Energy Security, International Investment, and Democracy: The Case of the United States Shale Oil and Gas Industry. Democr. Secur. 2020, 16, 309–333. [Google Scholar] [CrossRef]
  6. Emad, K.; Taher, M.S.A.; Taghi, S.E.; Narges, S.; Alireza, P. Oil price shocks on shale oil supply and energy security: A case study of the United States. Int. J. Dev. Issues 2022, 21, 249–270. [Google Scholar]
  7. Zhao, W.Z.; Zhu, R.K.; Zhang, J.Y.; Yang, J.R. Classification, exploration and development status and development trend of continental shale oil in China. China Pet. Explor. 2023, 28, 1–13. [Google Scholar]
  8. Yang, Y.M.; Wen, L.; Wang, X.Z.; Hong, H.T.; Zhu, H.H.; Xiong, Y.; Li, M.Q.; Lu, J.G.; Zeng, D.; Yang, W. Geological characteristics and favorable exploration area selection of shale oil and gas of the Lower Jurassic Da’anzhai Member in the Sichuan Basin. Nat. Gas Ind. 2023, 43, 32–42. [Google Scholar]
  9. Sun, L.D.; Liu, H.; Zhu, R.K.; Cui, B.W.; Lei, Z.D.; Meng, S.W.; Tang, J.Z. Ten noteworthy issues on shale oil revolution in China. Acta Pet. Sin. 2023, 44, 2007–2019. [Google Scholar]
  10. Zou, C.N.; Lin, M.J.; Ma, F.; Liu, H.L.; Yang, Z.; Zhang, G.S.; Yang, Y.C.; Guan, C.X.; Liang, Y.B.; Wang, Y.; et al. Development, challenges and strategies of natural gas industry under carbon neutral target in China. Pet. Explor. Dev. 2024, 51, 418–435. [Google Scholar] [CrossRef]
  11. Lei, Q.; Weng, D.W.; Guan, B.S.; Shi, J.F.; Cai, B.; He, C.M.; Sun, Q.; Huang, R. Shale oil and gas exploitation in China: Technical comparison with US and development suggestions. Pet. Explor. Dev. Online 2023, 50, 944–954. [Google Scholar] [CrossRef]
  12. Xu, C.G.; Lai, W.C.; Zhang, X.T.; Zhang, J.W. New progress and future exploration thinking of CNO0C oil and gas exploration. China Offshore Oil Gas 2023, 35, 1–12. [Google Scholar]
  13. Zhang, J.H. Progress in Sinopec shale oil engineering technology. Pet. Reserv. Eval. Dev. 2023, 13, 1–8. [Google Scholar]
  14. Li, X.; Wu, K.Y.; Wang, J.G.; Yang, S.Y.; Zhang, Q.H.; Zhang, Q. Impact of Lithologic Heterogeneity on Brittleness of Cenozoic Unconventional Reservoirs (Fine-Grained) in Western Qaidam Basin. Minerals 2022, 12, 1443. [Google Scholar] [CrossRef]
  15. Liu, S.Y.; Cao, N.; Lou, Y.S.; Yuan, Y. A new approach for post-fracturing evaluation and productivity prediction based on a reservoir fracability index model in shale gas reservoirs. J. Pet. Explor. Prod. Technol. 2023, 13, 1807–1818. [Google Scholar] [CrossRef]
  16. Liu, Y.J.; Lai, F.Q.; Wang, R.Y.; Wu, Z.H.; Zhang, X.S.; Xu, H.; Li, J. Influencing Factors of the Brittleness of Continental Shales Containing Shell Limestone Interlayer. Minerals 2023, 13, 460. [Google Scholar] [CrossRef]
  17. Zhan, Y.; Lin, C.Y.; Ma, C.F.; Han, W.Z.; Ma, P.J.; Li, G. Lithofacies Characteristics and Sweet Spot Distribution of Lacustrine Shale Oil Reservoirs: A Case Study of the Second Member of the Kongdian Formation in the Cangdong Sag, Bohai Bay Basin. Minerals 2023, 13, 1391. [Google Scholar] [CrossRef]
  18. Ye, Y.P.; Tang, S.H.; Xi, Z.D.; Lu, R.Q.; Zhang, Z.Y.; Li, J.T. The Effects of Quartz Content, Particle Size and Distribution Mode on the Mechanical Properties and Fracturing of Shale. Nat. Resour. Res. 2023, 33, 239–262. [Google Scholar] [CrossRef]
  19. Sethi, C.; Hazra, B.; Ostadhassan, M.; Motra, B.H.; Dutta, A.; Pandey, J.K.; Kumar, S. Depositional environmental controls on mechanical stratigraphy of Barakar Shales in Rajmahal Basin, India. Int. J. Coal Geol. 2024, 285, 104477. [Google Scholar] [CrossRef]
  20. Zahrah, F.B.; Suhaili, M.I. The brittleness and ductility of shale from Setap shale, Miri, Sarawak. IOP Conf. Ser. Earth Environ. Sci. 2022, 1003, 012012. [Google Scholar]
  21. Kivi, R.I.; Ameri, M.; Molladavoodi, H. Shale brittleness evaluation based on energy balance analysis of stress-strain curves. J. Pet. Sci. Eng. 2018, 167, 1–19. [Google Scholar] [CrossRef]
  22. Iyare, U.; Blake, O.; Ramsook, R. Brittleness evaluation of Naparima Hill mudstones. J. Pet. Sci. Eng. 2021, 196, 107737. [Google Scholar] [CrossRef]
  23. Ye, Y.P.; Tang, S.H.; Xi, Z.D.; Jiang, D.X.; Duan, Y. Quartz types in the Wufeng-Longmaxi Formations in southern China: Implications for porosity evolution and shale brittleness. Mar. Pet. Geol. 2022, 137, 105479. [Google Scholar] [CrossRef]
  24. Tan, M.J.; Wu, H.L.; Wang, S.Y.; Du, G.H.; Bai, Y.; Wang, Q. Progress and development direction of log interpretation technology for marine shale gas in China. Acta Pet. Sin. 2024, 45, 241–260. [Google Scholar]
  25. Wang, Q.; Li, H.; Liu, T.; Li, Z.G.; Dong, Y.J.; Jiang, B.K. Characterization method and main controlling factors of shale brittleness. Fault-Block Oil Gas Field 2020, 27, 458–463. [Google Scholar]
  26. Bobaru, F.; Zhang, G. Why do cracks branch? A peridynamic investigation of dynamic brittle fracture. Int. J. Fract. 2015, 196, 59–98. [Google Scholar] [CrossRef]
  27. Florin, B.; Ugo, G.; Ziguang, C. Introduction to the special issue on nonlocal models in fracture and damage. Int. J. Fract. 2024, 245, 115–120. [Google Scholar]
  28. Wang, L.Y.; Golfier, F.; Tinet, A.; Chen, W.Z.; Vuik, C. An efficient adaptive implicit scheme with equivalent continuum approach for two-phase flow in fractured vuggy porous media. Adv. Water Resour. 2022, 163, 104186. [Google Scholar] [CrossRef]
  29. Wang, L.Y.; Yin, Z.Y.; Chen, W.Z. Characteristics of crack growth in brittle solids with the effects of material heterogeneity and multi-crack interaction. Int. J. Fract. 2024, 246, 77–99. [Google Scholar] [CrossRef]
  30. Mews, S.K.; Alhubail, M.M.; Barati, G.R. A Review of Brittleness Index Correlations for Unconventional Tight and Ultra-Tight Reservoirs. Geosciences 2019, 9, 319. [Google Scholar] [CrossRef]
  31. Zhang, B.T.; Tang, J.Y.; Wang, W.J.; Yin, C.L. Characteristics of tectonic sedimentary evolution in northern depression of beibuwan basin. Offshore Oil 2014, 34, 7–12. [Google Scholar]
  32. Xu, J.J.; Jin, Q.; Xu, X.D.; Cheng, F.Q.; Hu, C.H.; Wang, B.; Chen, T. Factors controlling organic-rich shale development in the Liushagang Formation, Weixinan Sag, Beibu Gulf Basin: Implications of structural activity and the depositional environment. Pet. Sci. 2024, 18, 1011–1020. [Google Scholar] [CrossRef]
  33. Deng, Y.; Hu, D.S.; Zhu, J.T.; Liu, G.H.; Chen, K.; Tong, C.X.; Zhang, D.J.; Xu, X.D.; Man, Y.; You, J.J.; et al. Hydrocarbon accumulation regularities, new fields and new types of exploration, and resource potentials in Beibuwan Basin. Acta Pet. Sin. 2024, 45, 202–225. [Google Scholar]
  34. GB/T 19145-2003; Petroleum. Determination of Total Organic Carbon in Sedimentary Rock. Petroleum Industry Press: Beijing, China, 2003.
  35. SY/T 5124-1995; Geology Exploration. Method for Determination of Vitrinite Reflectance in Sedimentary Rocks. Petroleum Industry Press: Beijing, China, 1995.
  36. Lohr, C.D.; Hackley, P.C. Relating Tmax and hydrogen index to vitrinite and solid bitumen reflectance in hydrous pyrolysis residues: Comparisons to natural thermal indices. Int. J. Coal Geol. 2021, 242, 103768. [Google Scholar] [CrossRef]
  37. SY/T 5163-2010; Geology Exploration. Analysis Method for Clay Minerals and Ordinary Non-Clay Minerals in Sedimentary Rocks by the X-ray Diffraction. Petroleum Industry Press: Beijing, China, 2010.
  38. SY/T 5368-2000; Geology Exploration. Thin Section Examination of Rock. Petroleum Industry Press: Beijing, China, 2000.
  39. Shubhangi, K.; Javaregowda, D.; Sanjukta, D.; Abdul, M.R. Multiproxy geochemical characterization of Kommugudem Formation, Krishna Godavari Basin, India: Implication on hydrocarbon potential and shale brittleness. Geol. J. 2021, 57, 1373–1390. [Google Scholar]
  40. Owolabi, L.L.; Mohamed, M.; Abdulrauf, A.; Abdulrauf, A.; Abdullah, S. Brittleness and Microcracks: A New Approach of Brittleness Characterization for Shale Fracking. J. Nat. Gas Sci. Eng. 2020, 87, 103793. [Google Scholar]
  41. Wang, R.Y.; Liu, Y.J.; Li, Z.; Wang, D.H.; Wang, G.P.; Lai, F.Q.; Li, Z.H.; He, J.H. Microscopic pore structure characteristics and controlling factors of marine shale: A case study of Lower Cambrian shales in the Southeastern Guizhou, Upper Yangtze Platform, South China. Front. Earth Sci. 2024, 12, 1368326. [Google Scholar] [CrossRef]
  42. Mazouz, H.E.; Hamimed, M.; Yahiaoui, A.; Benzagouta, S.M.; Khodja, M.; Achi, N.; Duplay, J. An integrated approach for the identification of lithofacies and clay mineralogy through Neuro-Fuzzy, cross plot, and statistical analyses, from well log data. J. Earth Syst. Sci. Publ. Indian Acad. Sci. 2020, 129, 117–127. [Google Scholar]
  43. Lai, F.Q.; Li, S.C.; Wang, M.; Liu, Y.J.; Zhong, L.L.; Huang, Z.H.; Wang, H.T. Optimal Retrieval Method for Mineral Constituents of Shale Oil Reservoirs in Jiyang Sag. Spec. Oil Gas Reserv. 2022, 29, 16–23. [Google Scholar]
  44. Zhao, L.; Mao, R.; Deng, X.; Feng, Z.Y.; Chen, J.K.; Zong, X.H.; Feng, C. Research on Inversion Log Evaluation Method of Special Mineral in Alkali Lake Shale Oil Reservoir—A Case Study of the Fengcheng Formation in the Mahu Sag, China. Processes 2024, 12, 105. [Google Scholar] [CrossRef]
  45. Liu, Y.J.; Lai, F.Q.; Zhang, H.J.; Tan, Z.J.; Wang, Y.F.; Zhao, X.T.; Tan, X.F. A novel mineral composition inversion method of deep shale gas reservoir in Western Chongqing. J. Pet. Sci. Eng. 2021, 202, 108528. [Google Scholar]
  46. Lai, F.Q.; Zhang, G.T.; Huang, Z.H.; Wang, H.T.; Zhu, Z.X.; Zhong, L.L.; Xia, X.X. A Method for Extracting Sand Lamination Parameters of Shale Oil and Gas Reservoir. Patent CN202010855000.5, 12 March 2021. [Google Scholar]
  47. Ding, W.L.; Wang, Y.; Wang, S.H.; Liu, T.F.; Zhang, Z.Y.; Gou, T.; Zhang, M.Y.; He, X. Research progress and insight on non-tectonic fractures in shale reservoirs. Earth Sci. Front. 2024, 31, 297–314. [Google Scholar]
  48. Li, C.H.; Zhao, L.; Liu, B.; Li, J.X.; Chen, Y.F.; Zhang, Y. Research status and development trend of fractures in carbonate reservoir. Bull. Geol. Sci. Technol. 2021, 40, 31–48. [Google Scholar]
  49. He, S.B.; Meng, K.; Wang, C.; Chen, Y.B.; Zhao, H.; Wang, H.Y.; Yu, H.Y. Fracture Identification Using Conventional Logs in Ultra-Low Permeability Sandstone Reservoirs: A Case Study of the Chang 6 Member of the Ordos Basin, China. Minerals 2023, 13, 297. [Google Scholar] [CrossRef]
  50. Brave, M.; Renatus, K.; Habibu, M.; Habibu, M.; Simon, G.C. The organic geochemistry of Permian high latitude sediments in two boreholes in the southern Sydney Basin, New South Wales, Australia. Mar. Pet. Geol. 2023, 154, 1063116. [Google Scholar]
  51. Ejeh, I.O.; Etobro, A.A.I.; Perleros, K.; Ogala, J.E.; Ehinola, A.O.; Christanis, k.; Kalaitzidis, S. Hydrocarbon generation potential of Campano-Maastrichtian to Paleogene shales in the Benin Flank of the Anambra Basin, SW Nigeria. Energy Geosci. 2024, 5, 100286. [Google Scholar] [CrossRef]
  52. Farouk, S.; Arafat, M.; Fagelnour, S.M.; Kahtany, K.A.; Gentzis, T. Petroleum system assessment of the Beni Suef Basin, Western Desert, Egypt. J. Afr. Earth Sci. 2024, 217, 105345. [Google Scholar] [CrossRef]
  53. Rickman, R.; Mullen, M.; Petre, E.; Grieser, B.; Kundert, D. A practical use of shale petrophysics for stimulation design optimization: All shale plays are not clones of the Barnett Shale. In Proceedings of the SPE Annual Technical Conference and Exhibition, Denver, CO, USA, 21–24 September 2008; Volume 2, pp. 840–850. [Google Scholar]
  54. Okiongbo, K.S.; Aplin, A.C.; Larter, S.R. Changes in type II kerogen density as a function of maturity: Evidence from the Kimmeridge Clay Formation. Energy Fuels 2005, 19, 2495–2499. [Google Scholar] [CrossRef]
Figure 1. Tectonic position, section, and stratigraphic histogram of the X Depression: (a) Location of the study area. (b) Structure of the study area. (c) Stratigraphic column of the study area.
Minerals 14 00958 g001
Figure 2. Inversion process of the double-skeleton mineral model of the reservoir.
Minerals 14 00958 g002
Figure 3. Flow chart of extracting the linear density of laminations from electro-imaging logging images.
Minerals 14 00958 g003
Figure 4. Whole-rock mineral and clay mineral analysis.
Minerals 14 00958 g004
Figure 5. Comparison of mineral fractions identified in the shale in Well Wa.
Minerals 14 00958 g005
Figure 6. Lamination identification and parameter extraction in Well Wa.
Minerals 14 00958 g006
Figure 7. Calculation results of fracture development index of Well Wa.
Minerals 14 00958 g007
Figure 8. Comparison of logging curve regression analysis and model calculation: (a) Correlation analysis of Ro-Measured and AC (acoustic logging). (b) Correlation analysis of Ro-Measured and DEN (density logging). (c) Correlation analysis of Ro-Measured and GR (gamma logging). (d) Correlation analysis of Ro-Measured and RT (resistivity logging). (e) Correlation analysis of Ro-Measured and CNL (neutron logging). (f) Correlation analysis of Ro-Calculated values and Ro-Measured values.
Minerals 14 00958 g008
Figure 9. Plot of the calculation results of horizontal stress in Well Wa.
Minerals 14 00958 g009
Figure 10. Plot of rock brittleness with Young’s modulus and Poisson’s ratio [44].
Minerals 14 00958 g010
Figure 11. Matrix of the correlation coefficients between Young’s modulus and control factors of brittleness: (a) Distribution characteristics of parameter values. (b) Correlation matrix between parameters.
Minerals 14 00958 g011
Figure 12. Core casting thin sections. (a) Section at the depth of 2978 m mainly composed of mud mixed with chalky quartz and other detrital particles. Granular pyrite was scattered or aggregated along the laminations and the size of most of particles was small. (b) Section at the depth of 2986 m mainly composed of mud. Granular pyrite was widely distributed; (c) Section at the depth of 2992 m. Granular pyrite was widely distributed and the particle size was small. Rhombic crystals of iron dolomite were occasionally observed. (d) Section at the depth of 3010 m. Rhombic crystals of iron dolomite were observed and a small quantity of granular pyrite existed. (e) Section at the depth of 3028 m. Detrital particles were mainly silt as well as some fine sand, and bituminous organic matter filled the intergranular space. Mud rhodonite aggregates showed an uneven distribution and pyrite was not observed; (f) Section at the depth of 3058 m mainly composed of muddy rock. Siltstone clast was not observed. A widespread moldy granular rhodonitization was observed.
Minerals 14 00958 g012
Figure 13. Correlation analysis between the maturity of organic matter and Young’s modulus.
Minerals 14 00958 g013
Disclaimer/Publisher’s Note: The statements, opinions and data contained in all publications are solely those of the individual author(s) and contributor(s) and not of MDPI and/or the editor(s). MDPI and/or the editor(s) disclaim responsibility for any injury to people or property resulting from any ideas, methods, instructions or products referred to in the content.

