1. Introduction
Kalsilite (KAlSiO
4), is a rare mineral that is mostly found in young ultrapotassic volcanic rocks and plutonic rocks [
1]. A rare example of kalsilite-bearing metamorphic rocks has been described by Sandiford and Santosh [
2]. Kalsilite is also an important material used in bodies of dental porcelains. Porcelain-fused-to-metal (PFM) is a widely used dental treatment in which several layers of porcelain are successively applied and fired in vacuum onto a metal framework which has been previously modelled and cast according to the anatomical conditions (Becerrow and Mantovani [
3] and the references therein). Hence, structural and thermal studies on synthetic and natural kalsilite were carried out by many researchers, and the results were mostly applied in material science as well as in applied mineralogy ([
3,
4] and the references therein). However, there are only few high-pressure studies of kalsilite dealing with pressure-induced phase transitions of this mineral [
5,
6,
7]. Gatta
et al. [
7] reported single crystal X-ray diffraction data on the metamorphic kalsilite, and described a possible new iso-symmetric
P31
c symmetry first-order phase transition near 3.5 GPa, due to the tilting of tetrahedral angle, which is a unique structural feature of kalsilite that contrasts with the stability of the same topology in nepheline, NaAlSiO
4.
The pressure dependence of the electrical resistivity is found to be a sensitive parameter for mineral physics investigations, in identifying any micro-structural change in minerals at high pressures, as well as to identify phase transitions [
8,
9,
10]. However, there are no high-pressure electrical resistivity measurements reported for metamorphic kalsilite. In this study, we carried out systematic electrical resistivity measurements on the metamorphic kalsilite to understand the electrical properties under pressure as well as to locate and confirm the transition pressure of the isostructural phase transition.
2. Experimental Section
The samples used in the present investigation are metamorphic kalsilite fragments from the late Neoproterozoic (
ca. 550 Ma) granulite facies metamorphic terrain of Punalur district in the Kerala State of southern India. In the Punalur region garnet-cordierite (± hypersthene, sillimanite, spinel and biotite) rich gneisses occur interlayered with khondalites, leptynites and charnockites. The horizon containing the kalsilite-leucite-hibonite association forms a layer approximately 200 m wide which can be traced for approximately 3 km near the villages of Kakkopponu and Perunthol. The studied metamorphic kalsilite sample was collected by one of the authors (MS). The size of the crystalline kalsilite is about 1.5 to 2 mm. Metamorphic kalsilite coexists with leucite, K-feldspar, hibonite spinel, corundum, titanite, perovskite and Ti-bearing phlogopite. The peak metamorphic conditions of this rock were estimated as 973–1073 K and 0.35 to 0.65 GPa [
2]. The details of the geological settings and petrographic investigations of the samples are discussed elsewhere [
2]. Some other investigators also evaluated the phase stability and XRD structural aspects of the kalsilite from this outcrop [
7,
10,
11,
12].
In the present study, high-pressure electrical resistivity measurements were carried out in an opposed anvil cell, by adopting the standard four probe method, with two probes connected to the constant current source and two probes connected to a digital multimeter to measure the voltage. High-pressure experiments were carried out in a Bridgman anvil cell using WC opposed anvils, with pyrophillite gasket, and MgO as solid pressure transmitting medium. The actual pressures on the samples were determined through the well known solid-solid phase transitions in bismuth, ytterbium, tellurium, and thallium. The details of the equipment, calibration, and uncertainties involved, procedure followed those described elsewhere [
8,
13,
14,
15]. Three independent experimental runs were made on two sets of samples of K-1 and K-2 for checking the reproducibility of the data. The composition of the samples were determined by the Electron Probe Micro Analyses (EPMA) under identical experimental conditions described elsewhere [
15,
16,
17]. FTIR spectroscopy experiments were performed in the frequency range 400–4000 cm
−1 at room temperature by using pellet method at room temperature. Typical uncertainties in measuring the wave number are ± 1.5 cm
−1 in the frequency range 400–1500 cm
−1 [
15,
17].
3. Results and Discussion
The kalsilite investigated in this study represents almost the end member KAlSiO
4. The chemical composition of the metamorphic kalsilite is determined as SiO
2 = 37.85 to 38.60 wt %; Al
2O
3 = 31.50 to 32.07 wt %; Fe
2O
3 = 1.28 to 0.08 wt %; Na
2O = 0.04 to 0.5 wt %. This composition was determined by EPMA, and has been found to be in good agreement with the data reported by Sandiford and Santosh [
2]. Powder X-ray diffraction studies on the kalsilite showed that the sample has
P63mc structure with cell parameters
a = 5.160 (3) Å and
c = 8.717 (3) Å. The calculated density is found to be 2.63 (5) g/cm
3. The electrical resistivity of the samples was determined by the standard four probe method and the value is 3.4 × 10
10 Ω·m at room temperature. The temperature dependence of the electrical resistivity was determined over a narrow temperature range 600–1070 K and the resistivity follows the well known Arrhenius equation
where
R is the electrical resistivity,
A is the pre exponential factor (in Ω·m),
T = temperature in K;
k = Boltzmann constant, and Δ
E is the activation energy for electronic conduction in eV. The activation energy of metamorphic kalsilite is found to be 0.79 eV, which is less than that of reported value for synthetic kalsilite 0.82 eV reported by Maury (1968) [
18]. The value of the pre exponential factor
A = 70.38 (5) Ω·m. The slight decrease in the value of the conductivity activation energy may be attributed to the presence of minor iron content (0.08 to 1.28 wt %) in the natural metamorphic kalsilite. The values of conductivity pre exponential factor A is found to be varying from 10
−3 to 10
−4 Ω·m for extended states electronic conduction, where the samples are pure semiconductors without any impurity. The large value of the pre-exponential factor 70.38 Ω·m observed in the studied sample indicates that the presence of impurity doped energy levels or density of sates due to the defects in the energy gap between the conduction and valence bands. The value of pre-exponential factor
A observed for the extended state conduction without impurity typically in the range of 10
−3 to 10
−4 Ω·m [
13].
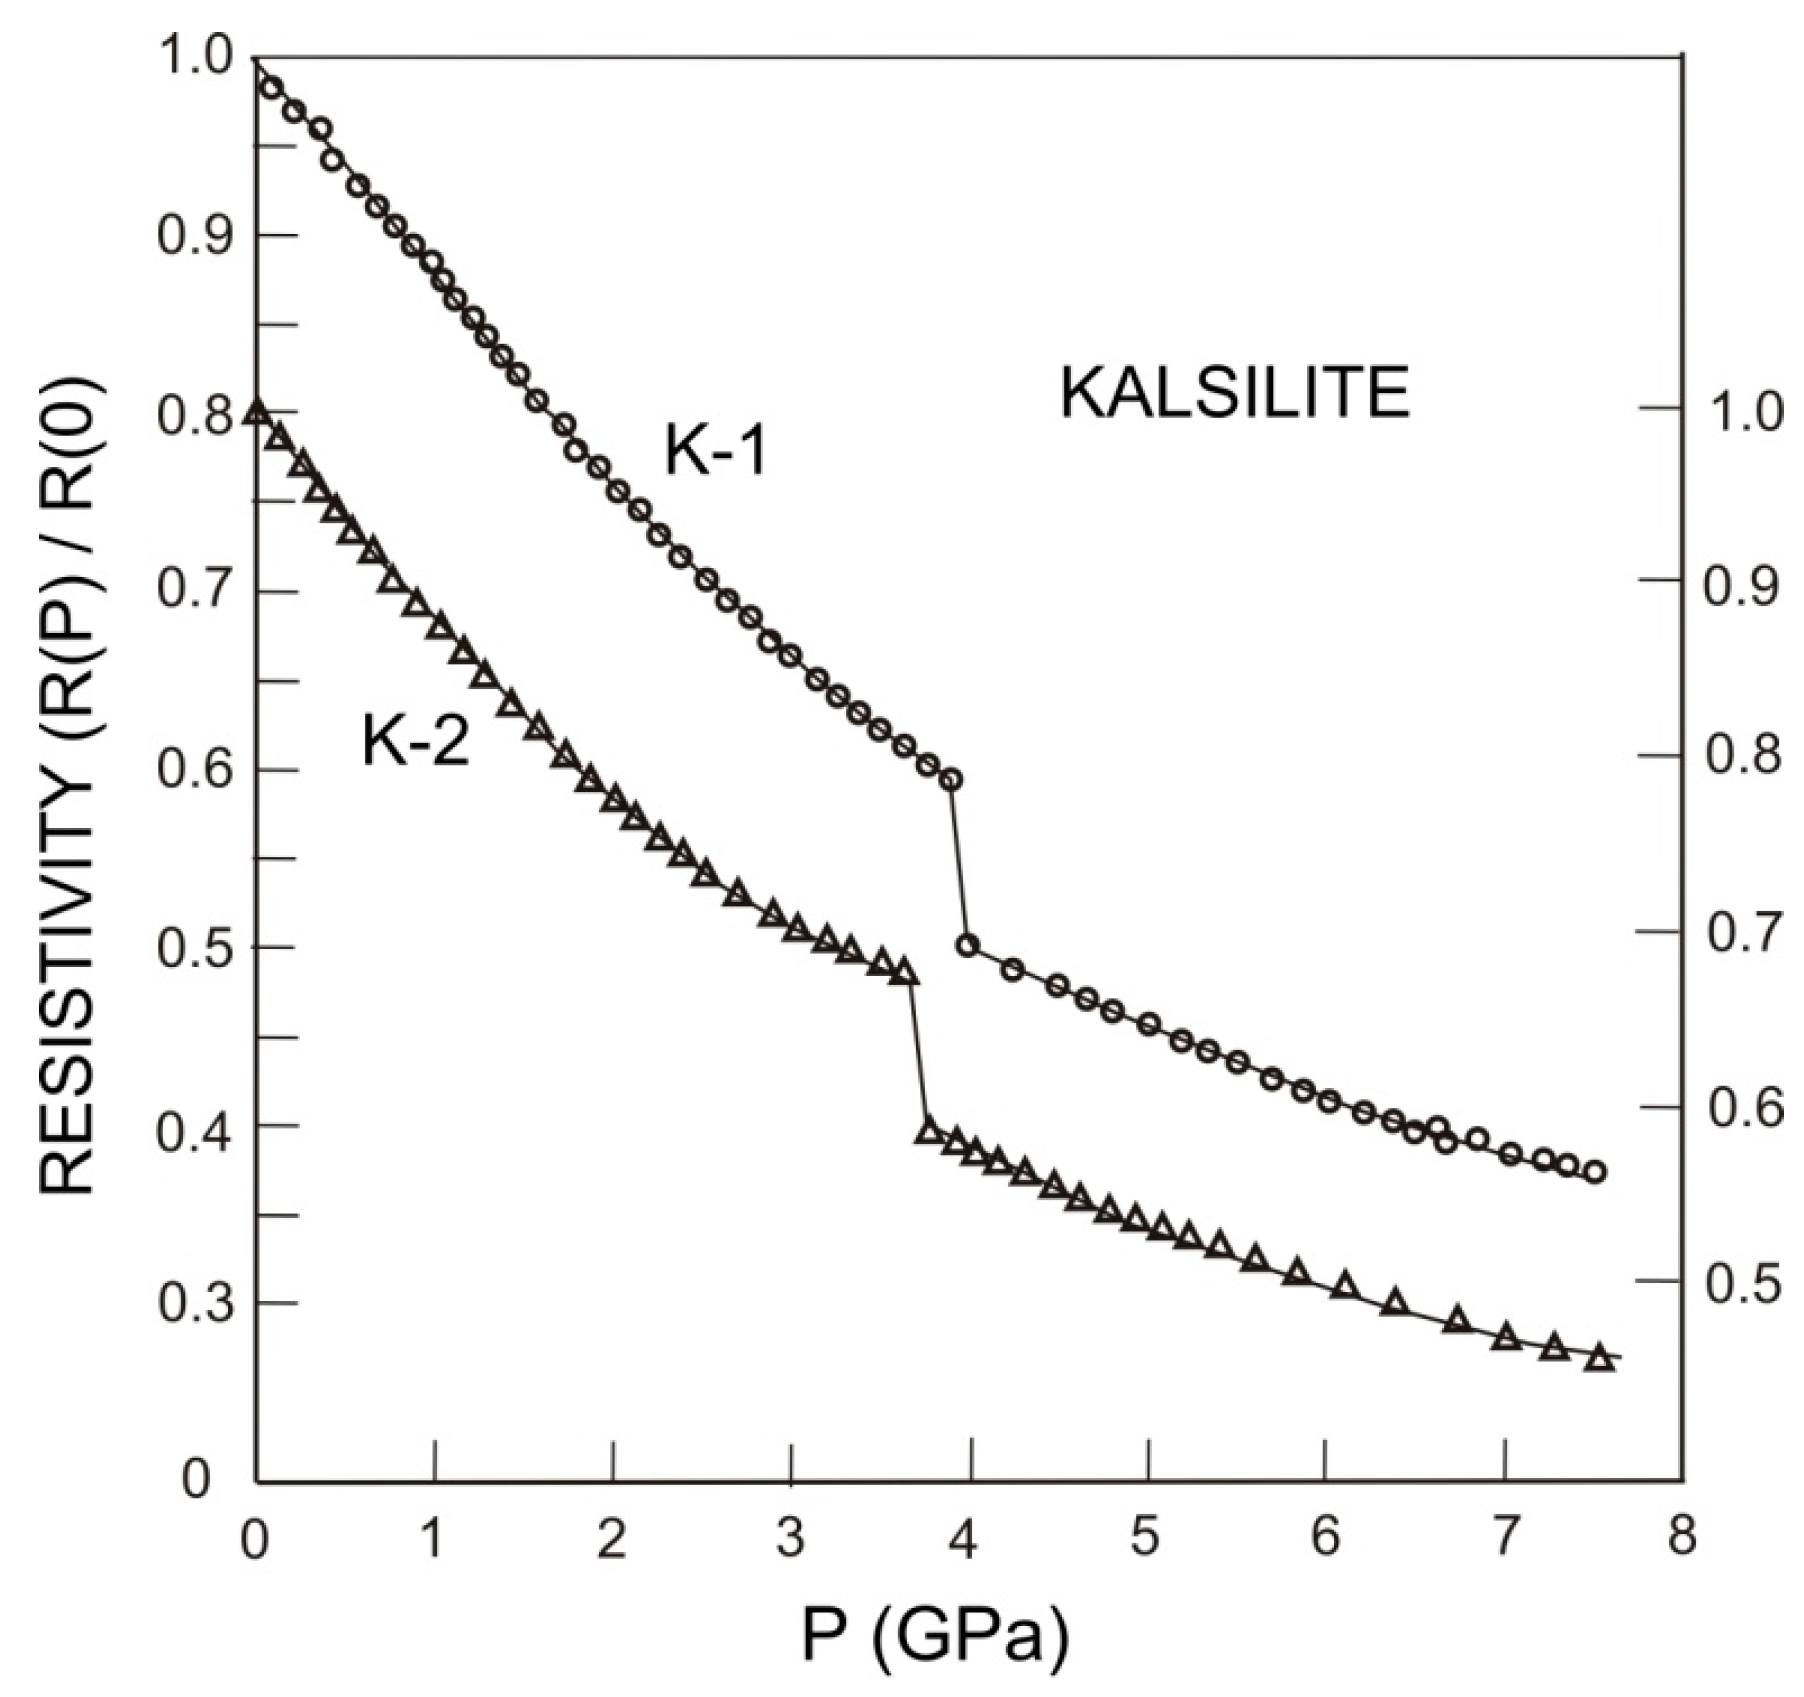
Figure 1 shows the pressure dependence of the normalized electrical resistivity [
R(
P)/
R(10
5 Pa)] of the two representative samples of kalsilite up to 7.5 GPa. The electrical resistivity of the metamorphic kalsilite has been determined and found to be 3.4 × 10
10 Ω·m at room temperature and pressure. The value is reproducible within the experimental uncertainties (± 0.5%). It is well established that for ionic conductors, the value of the electrical resistivity increases with the increase of pressure [
19,
20].
Figure 1.
Pressure dependence of the normalized electrical resistivity {R(P)/R(0)} of the metamorphic kalsilite, where R(0) is the resitivity of the sample at room pressure 105 Pa. K-1 and K-2 represent two different samples from different part of the rock samples with identical composition. The values of normalized resistivity data for the sample K-2 is mentioned in right hand side scale. Please note that right hand side scale is shifted for the sake of clarity. The first order phase transition is clearly noticed with a sudden drop in the value of the electrical resistivity.
In case of semiconductors and insulators, electrical resistivity is found to decrease with the increase of pressure. This has been observed in many semiconductors, where the electronic conduction is the dominant process. The electrical resistivity decreases with the increases of charge density and density of states [
20,
21,
22]. The sudden drop of electrical resistivity by 14%–15% at 3.5 GPa, indicates that the high pressure phase is slightly denser than the room pressure phase as further supported by the decrease of stretching frequency (
Figure 2 and
Table 1). However, the high pressure phase remains electrically insulating/semiconducting phase. Pressure induced insulator-to-metal transitions usually accompany resistivity decreases by several orders of magnitude [
20,
21,
22]. The electrical resistivity of metamorphic kalsilite decreases by 35% to 40% with the increase of pressure up to 3.5 GPa, indicating the dominance of electronic conduction in the sample and the ineffectiveness of traces of sodium (K/Na molar ratio is determined to be about 350–360).
The structure of the metamorphic kalsilite has been reported as
P31c symmetry at room pressure and temperature [
23,
24]. Carpenter and Cellai [
11] showed that the metamorphic kalsilite undergoes irreversible phase transition from
P63mc to
P63 upon heating at 773 K [
11]. Kremenovic and Vulic [
25] have synthesized kalsilite at 1273 K, and found its crystal structure [
a = 5.197 (1) Å and
c = 8.583 (5) Å] to be characterized by systematic disappearance of
h0l and
hhl reflections with
l = 2n + 1, and considered it as disordered kalsilite. It has a different structure compared to the known kalsilite (space group
P63) synthesized at 1373 K [
a = 5.160 (1) Å and
c = 8.632 (6) Å]. The configuration of the high T phase is driven by tetrahedral rotation.
Gatta
et al. [
7] carried out systematic single crystal X-ray diffraction structural studies on metamorphic kalsilite up to 6.25 GPa [
7] and observed a remarkable softening of
c-axis between 2.5 and 3.5 GPa, and an evident first order isostructural phase transition at 3.5 GPa. Optical measurements on the samples confirmed the phase transition did not lead to further twinning of the kalsilite crystal. The present electrical resistivity measurements further confirm the earlier suggestion of the pressure induced first order phase transition of the metamorphic kalsilite at 3.5 to 3.8 GPa. It is clear from the data (
Figure 1) that the sample does not exhibit any further pressure induced phase transition up to 7.5 GPa, the experimental limit of the present investigation. The value of the cell parameter
c decreases from 8.5703 (10) Å to 8.3742 (3) Å at 3.25 GPa, indicating that the high pressure phase is different from the disordered phase reported by Kremenovic and Vulic [
25]. Hence we conclude that the high pressure phase transition in kalsilite is not an order-disorder phase transition and it could be an isostructural polymorphic transition in metamorphic kalsilite as proposed by Gatta
et al. [
7].
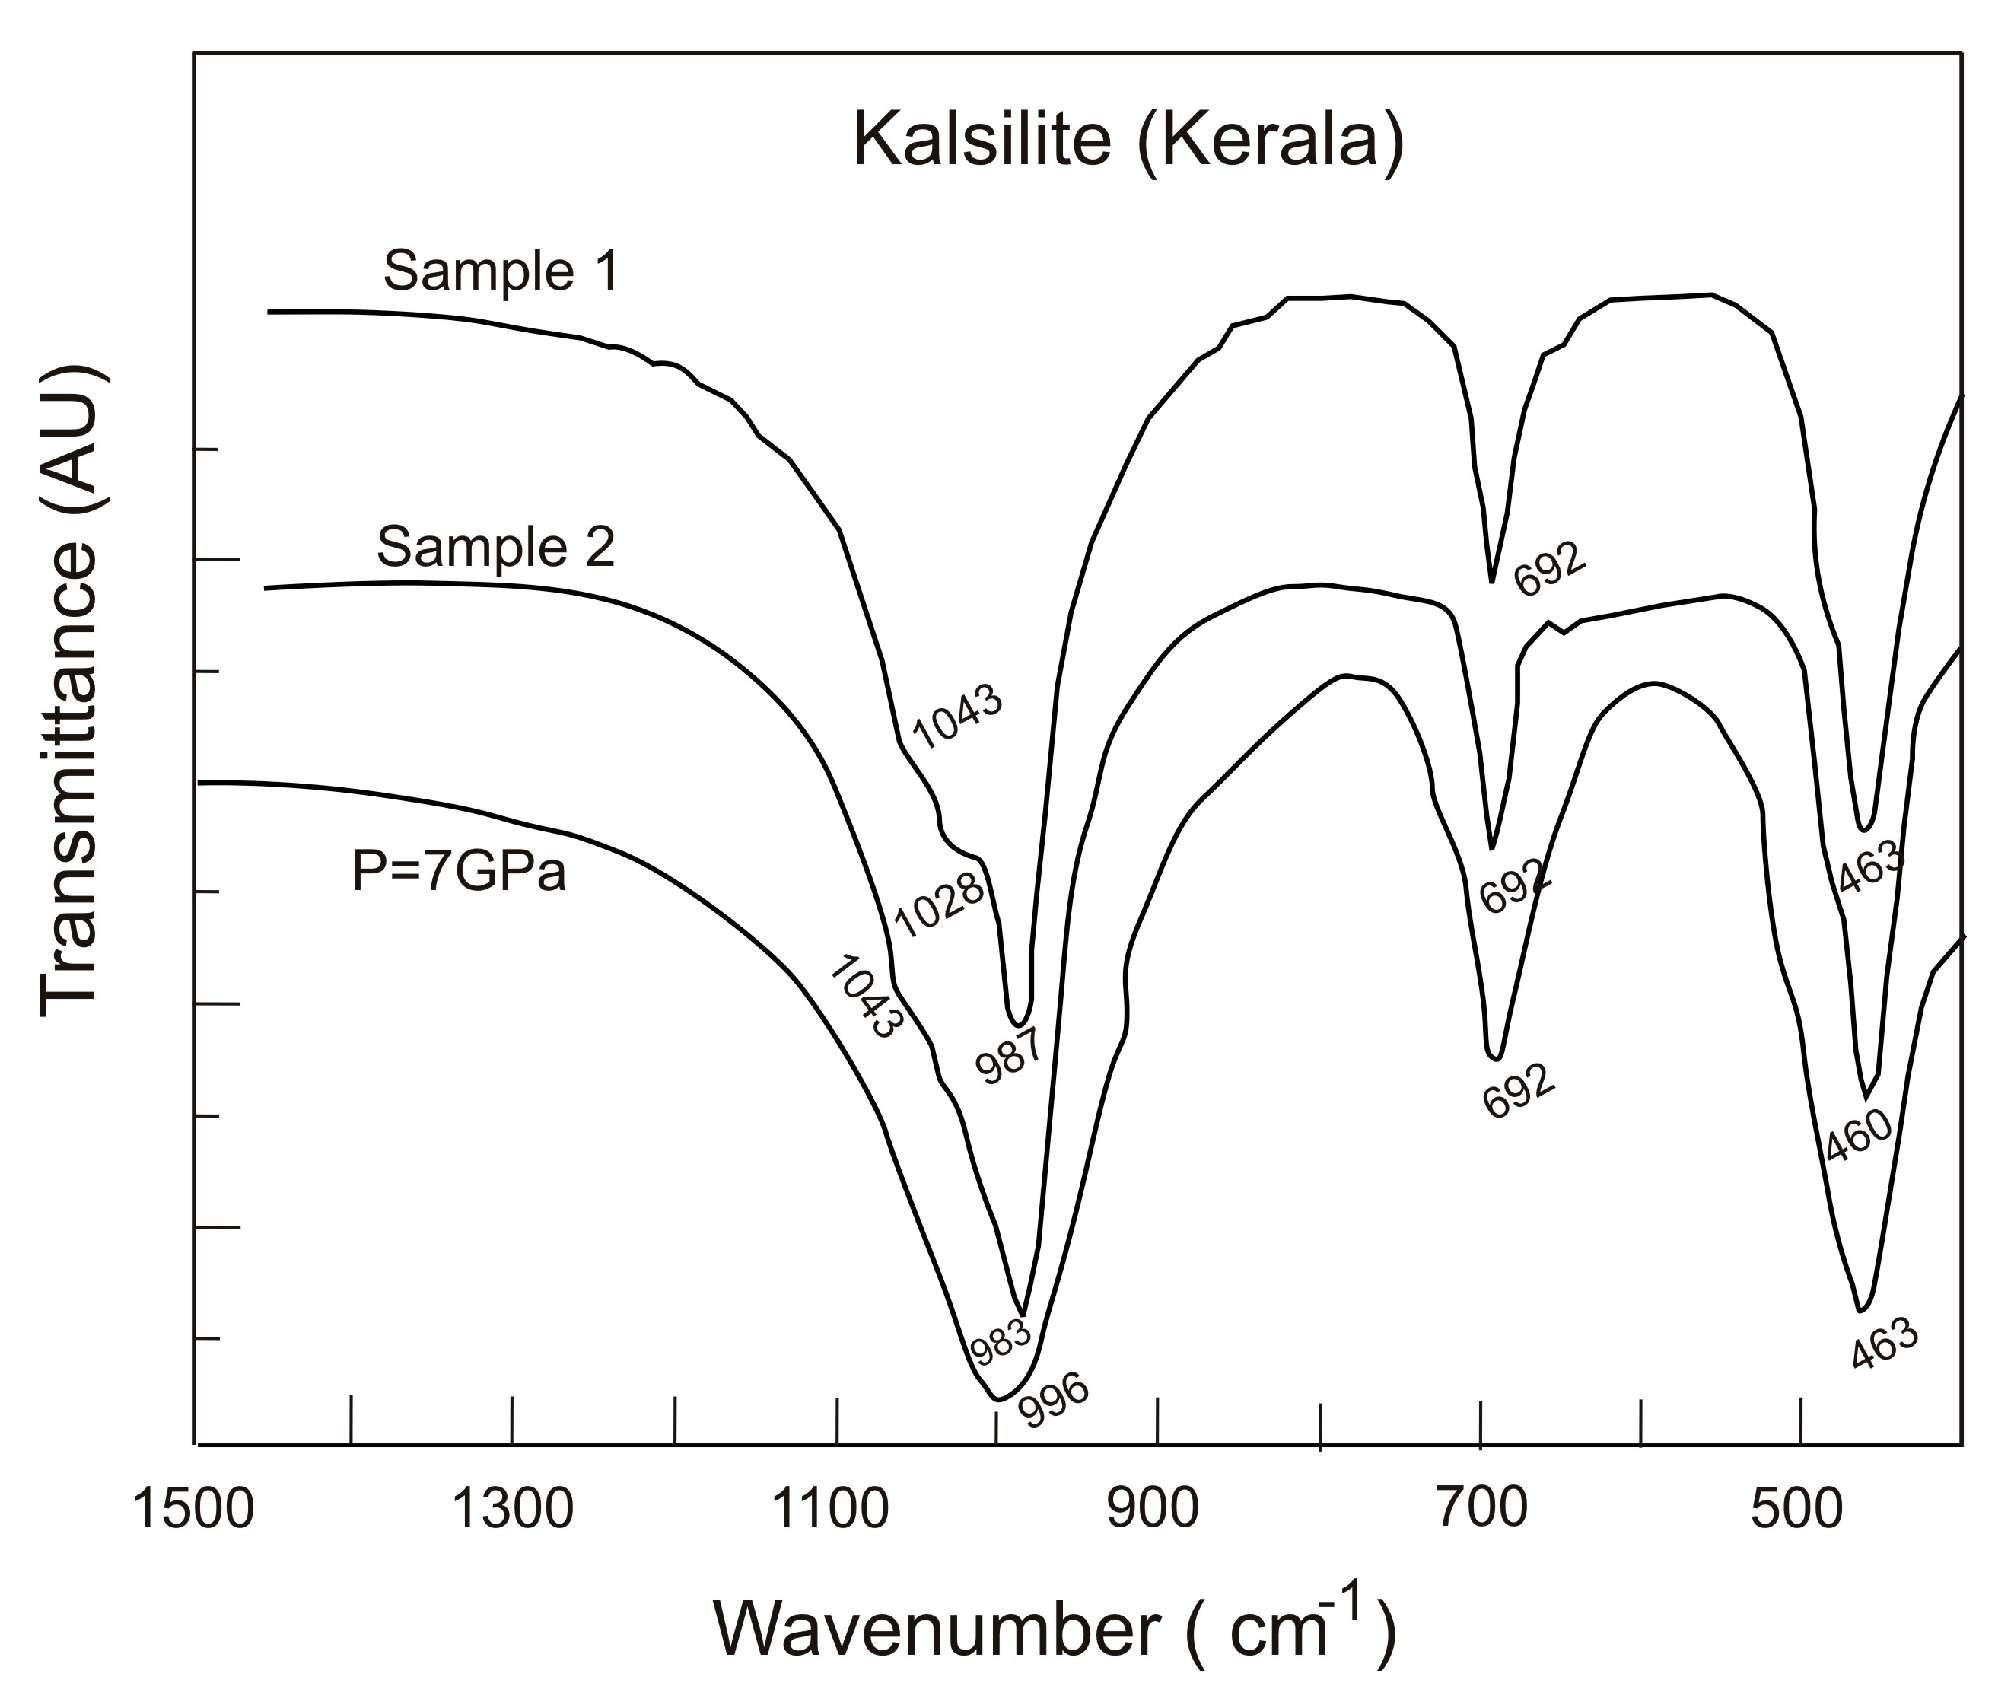
In order to check the reversibility of the phase transition, we also investigated the Fourier transform infrared (FTIR) spectrum of the starting and pressurized sample, which was subjected to 7 GPa. The spectra of the kalsilite samples are shown in
Figure 2.
Figure 2.
Fourier transform infrared spectra of metamorphic kalsilite samples 1 and 2 representing K-1 and K-2 at atmospheric pressure (10
5 Pa) and for the sample recovered from 7 GPa. Only the relevant peaks corresponding to kalsilite samples are mentioned along with the spectra and the numerical values are mentioned in the
Table 1.
We have not observed any absorption peak near 3000–3500 cm
−1 indicating the absence of any measurable hydroxyl component in the metamorphic kalsilite. The FTIR spectra of kalsilite show four major and distinct broad bands near 1043, 990, 690 and 460 cm
−1. These bands are interpreted based on the well known vibrational bands occurring in feldspathoid minerals [
24]. The absorption band values are listed along with the band assignment in
Table 1. The FTIR data of the starting sample are almost same as those of pressurized sample indicating that the observed pressure-induced phase transition is reversible. The broadening of FTIR peaks indicates that the pressure-induced transition is due to the distortion of the tetrahedra, which is in agreement with the observation of the increasing value of tilting angle of the tetrahedra with pressure, with a reversion of the tetrahedra rotations to the value found at ambient pressure [
7]. The increase in the wave number of the Si–O band (996 cm
−1 at 7 GPa) indicates that the high pressure phase is denser compared to the room pressure kalsilite.
In the K
2O-Al
2O-2SiO
2 tectosilicates [
25] system there are several polymorphs that have been identified for composition close to KAlSiO
4: viz., kalsilite, megakalsilite [
23],
O1-KAlSiO
4 [
24],
O2-KAlSiO
4,
Icmm phase, kaliophilite. The studied sample has been identified as kalsilite and the cell parameters are different from that of megakalsilite [
26] and
O1-KAlSiO
4 [
27]. Gatta
et al. [
7] have also noticed that the high-pressure behavior of metamorphic kalsilite is distinctly different from that of other alminosilicates like nepheline. The density of megakalsilite is determined as 2.58 g/cm
3 [
27], and the density of our starting material is 2.63 g/cm
3 and it should be higher for the high pressure phase and hence the observed phase transition could not be linked to megakalsilite phase.
Table 1.
Fourier transform infrared spectral bands of metamorphic kalsilite at ambient pressure and samples subjected to 7 GPa at room temperature.
Table 1.
Fourier transform infrared spectral bands of metamorphic kalsilite at ambient pressure and samples subjected to 7 GPa at room temperature.
| Band Assignments | FTIR Bands in cm−1 |
|---|
| Sample K-1 | Sample K-2 | 7 GPa |
|---|
| Si=O=Si vibration | 1043 | 1043 | - |
| Si–O band | 1028 | - | - |
| Si–O stretching band | 987 | 983 | 996 |
| Si–O (Al) tertrahedral framework affected by considerable disorder | 692 | 692 | 692 |
| Si–O–Si bending | 463 | 460 | 463 |


