3.1. X-Ray Absorption Near-Edge Structure Analysis
The XAFS spectra at the cerium K- and L
III-edges [
2] corresponding to the XANES region are shown in
Figure 1 for samples with and without grinding. Tri- and tetravalent cerium peaks at the cerium K-edge XAFS spectra were observed at 40,460 eV and 40,470 eV, respectively. The valence of cerium was already identified by the XANES analysis at the cerium L
III-edge XAFS spectra, as shown in
Table 4 [
2]. In addition, the specific surface area was already measured by a high-efficiency specific surface area and pore distribution analyzer, as shown in
Table 3 [
2]. The concentration of trivalent cerium significantly increased with grinding time, especially after 10 min of grinding. On the other hand, the specific surface area shown in
Table 3 increased by 10 min of grinding, but decreased after 10 min of grinding. Thus, it was suggested that the planetary ball milling energy to generate a new surface area by 10 min of grinding, but occur mechanochemical reaction as described in Equation (1) after 10 min grinding [
2]. It was confirmed by both the cerium K- and L
III-edge XAFS spectra that the energetic shift corresponded to the change in valence of cerium (
Figure 1a). The results of the XANES analysis using the XAFS spectra at the cerium K-edge are shown in
Table 5. Compared with the data in
Table 4, the trend, in which the concentration of trivalent cerium significantly increased with grinding time, was the same. These results showed that the XAFS spectra at the cerium K-edge were sufficient to identify the valence of cerium in samples both with and without grinding [
29,
30].
Cerium is the first element in the Periodic Table with a partially occuped f orbital: Its arrangement of electrons is [Xe core]4f
1[Xe core]5d
16s
2 (1s
22s
22p
63s
23p
63d
104s
24p
64d
104f
15s
25p
65d
16s
2). From
Figure 1b, the XAFS spectra at the cerium L
III-edge of CeO
2 had two characteristic peaks at 5730 and 5737 eV, while that of CeF
3 had only one peak at 5725 eV. The peaks of CeO
2 at 5730 eV and 5737 eV are derived from the 2p to (4f
1)5d electronic transition, which results from interactions between the cerium 4f electron and the nearest oxygen 2p electron, and from the 2p to (4f
0)5d electronic transition, respectively [
36,
37]. The peak of CeF
3 at 5725 eV is derived from the 2p to (4f
1)5d electronic transition [
36,
37]. In CeO
2, all tetravalent cerium normally leaves the host atoms and transfers into the 2p bands of two oxygen atoms; in trivalent cerium trioxide (Ce
2O
3), the cerium 4f electron is fully localized [
38]. From the above discussion, it is suggested that the structural change of cerianite in weathered residual rare earth ore during mechanochemical reduction involved localization–delocalization of the cerium 4f electron.
3.2. Extended X-Ray Absorption Fine Structure Analysis
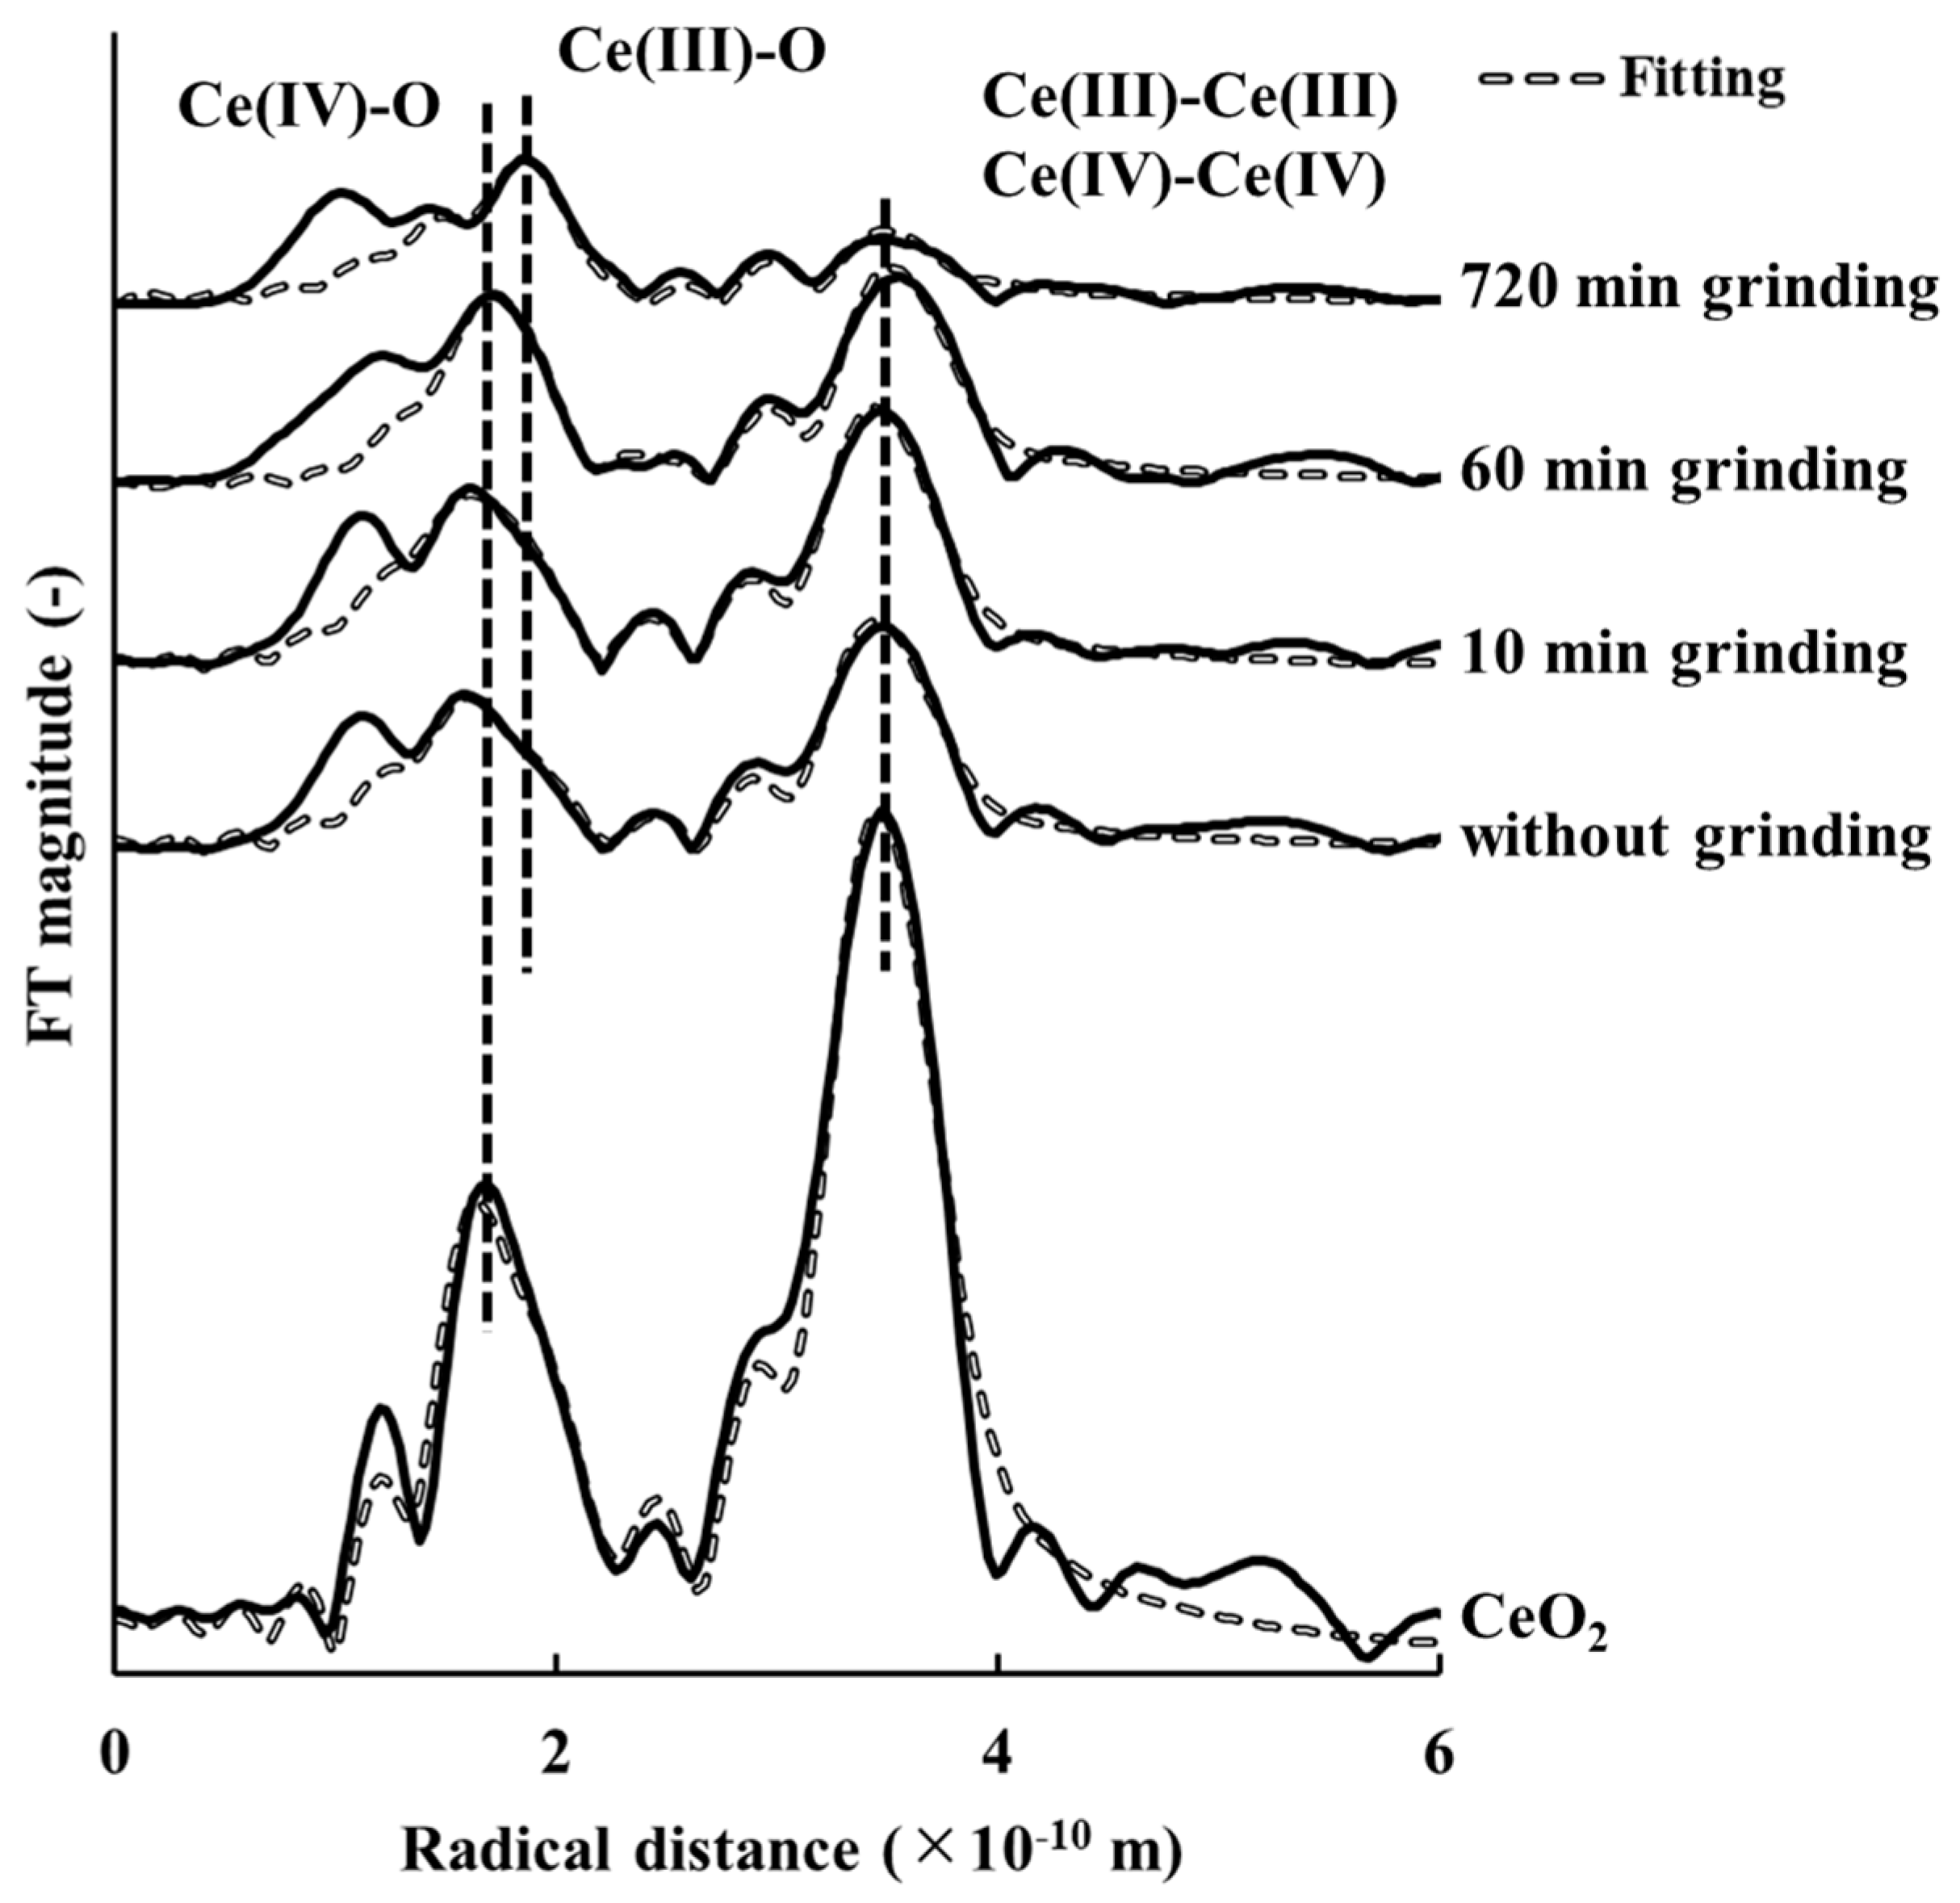
The
k3-weighted EXAFS spectra and RDF of CeO
2 of samples with and without grinding are shown in
Figure 2;
Figure 3, respectively. The curve-fitted results are plotted and the corresponding parametric values are listed in
Table 6. It should be noted that the third shell (Ce(III)–Ce(III)) contribution was quite minor relative to that of the fourth shell (Ce(IV)–Ce(IV)), and a significant overlap existed between these two shells in the RDF.
Figure 2 shows that the k
3-weighted EXAFS spectra of the sample without grinding was similar to that of the sample ground for 10 min, but these differed from those of samples ground for 60 min and 720 min. This trend is also shown in the RDF (
Figure 3). These results clearly showed that the structure of cerianite in the weathered residual rare earth ore started to change after 10 min of grinding.
The curve-fitting results in
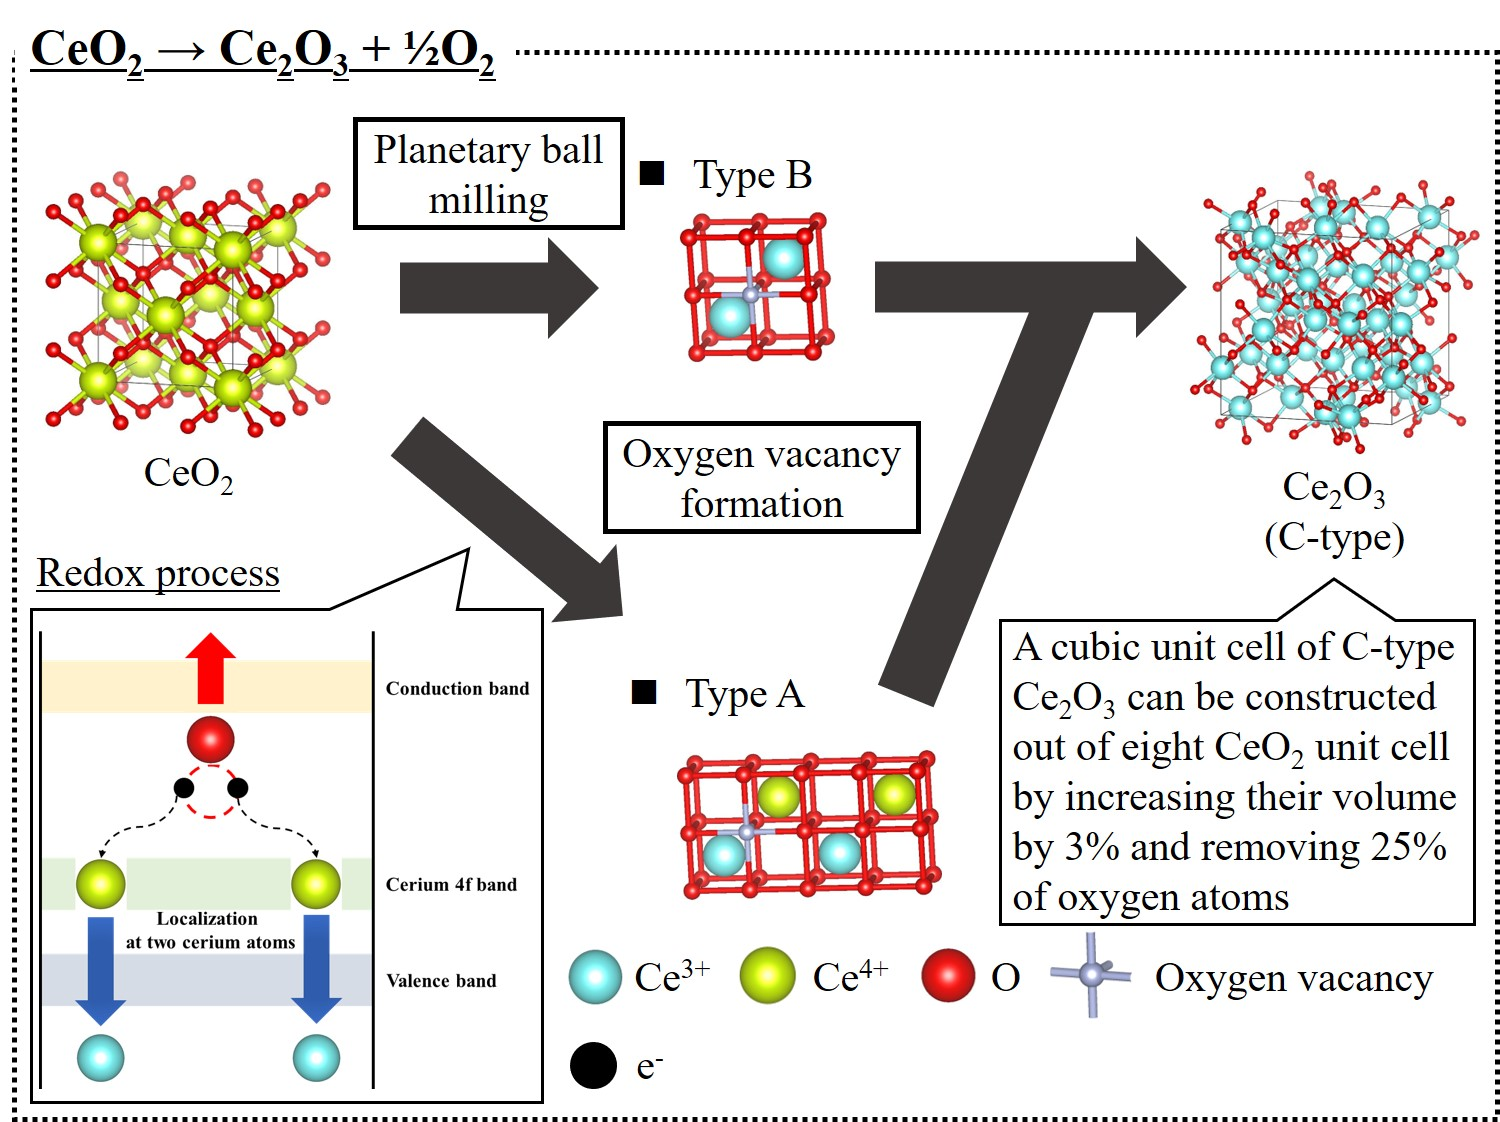
Table 6 show that the coordination numbers of Ce(IV)–O and Ce(IV)–Ce(IV) in the cerianite decreased as grinding time increased, while those of Ce(III)–O and Ce(III)–Ce(III) increased. From the above discussion, the results of the EXAFS analysis suggested that the structure of the ore changed from cerianite to Ce
2O
3 because of a mechanochemical reduction [
2]. Cerianite has the fluorite structure (space group (
)) [
1] (
Figure 4a). Skorodumova et al. [
38] reported that the C-type structure of Ce
2O
3 (space group (
)) was produced on completion of the reduction process [
39,
40] (
Figure 4b). This structure (
Figure 4b) can be constructed from eight unit cells of cerianite (
Figure 4a) with 25% oxygen vacancies ordered in a particular way [
38]. The structure change from cerianite to the C-type structure of Ce
2O
3 involves minimal reorganization of the skeleton arrangement of the cerium atoms [
38]. This structural property should facilitate the excellent reversibility of the reduction–oxidation process.
The atomic distances of both Ce(IV)–O and Ce(III)–O in cerianite also decreased as grinding time increased, as shown in
Table 6. This trend was similar to the case of Gd
2O
3-doped cerianite [
13]: Ohashi et al. reported that when gadolinium was doped at 30% in cerianite, the Ce(IV)–O and Gd(III)–O atomic distances decreased by 0.032 × 10
−10 m and 0.024 × 10
−10 m, respectively [
13]. Compared with this result, the decrease of atomic distance in the present system was large; thus, the decrease of atomic distances of Ce(IV)–O and Ce(III)–O in the cerianite represented significant structural changes.
The decreases of the Ce(IV)–O and Ce(III)–O atomic distances in the cerianite showed that oxygen vacancies occurred in the structure on grinding, and that oxygen ions surrounding these vacancies around both tri- and tetravalent cerium ions relaxed toward their adjacent vacancies [
21]. Skorodumova et al. [
38] reported that it required 4.4 × 10
2 kJ/mol to form an oxygen vacancy in pure cerianite, based on the full-potential linear muffin tin orbitals generalized gradient approximation (FP–LMTO–GGA) [
41,
42]. In our experimental system, it is suggested that this energy was mainly provided by the planetary ball milling. In addition, it is suggested that the distribution of oxygen vacancies in the stucture of cerianite is related to the valences and ionic radii of tri- and tetravalent cerium ions. In this system, the ionic radii of eight-coordinated tri- and tetravalent cerium are 1.143 × 10
−10 m and 0.97 × 10
−10 m, respectively [
43]. These ionic radii are relatively similar, so oxygen vacancies are considered to be favored near trivalent cerium ions to ensure electrical neutrality. Indeed, Skorodumova et al. [
38] reported that it required only 25 kJ/mol, which was the lowest energy among positions that could form an oxygen vacancy, to form an oxygen vacancy adjacent to trivalent cerium in pure cerianite.
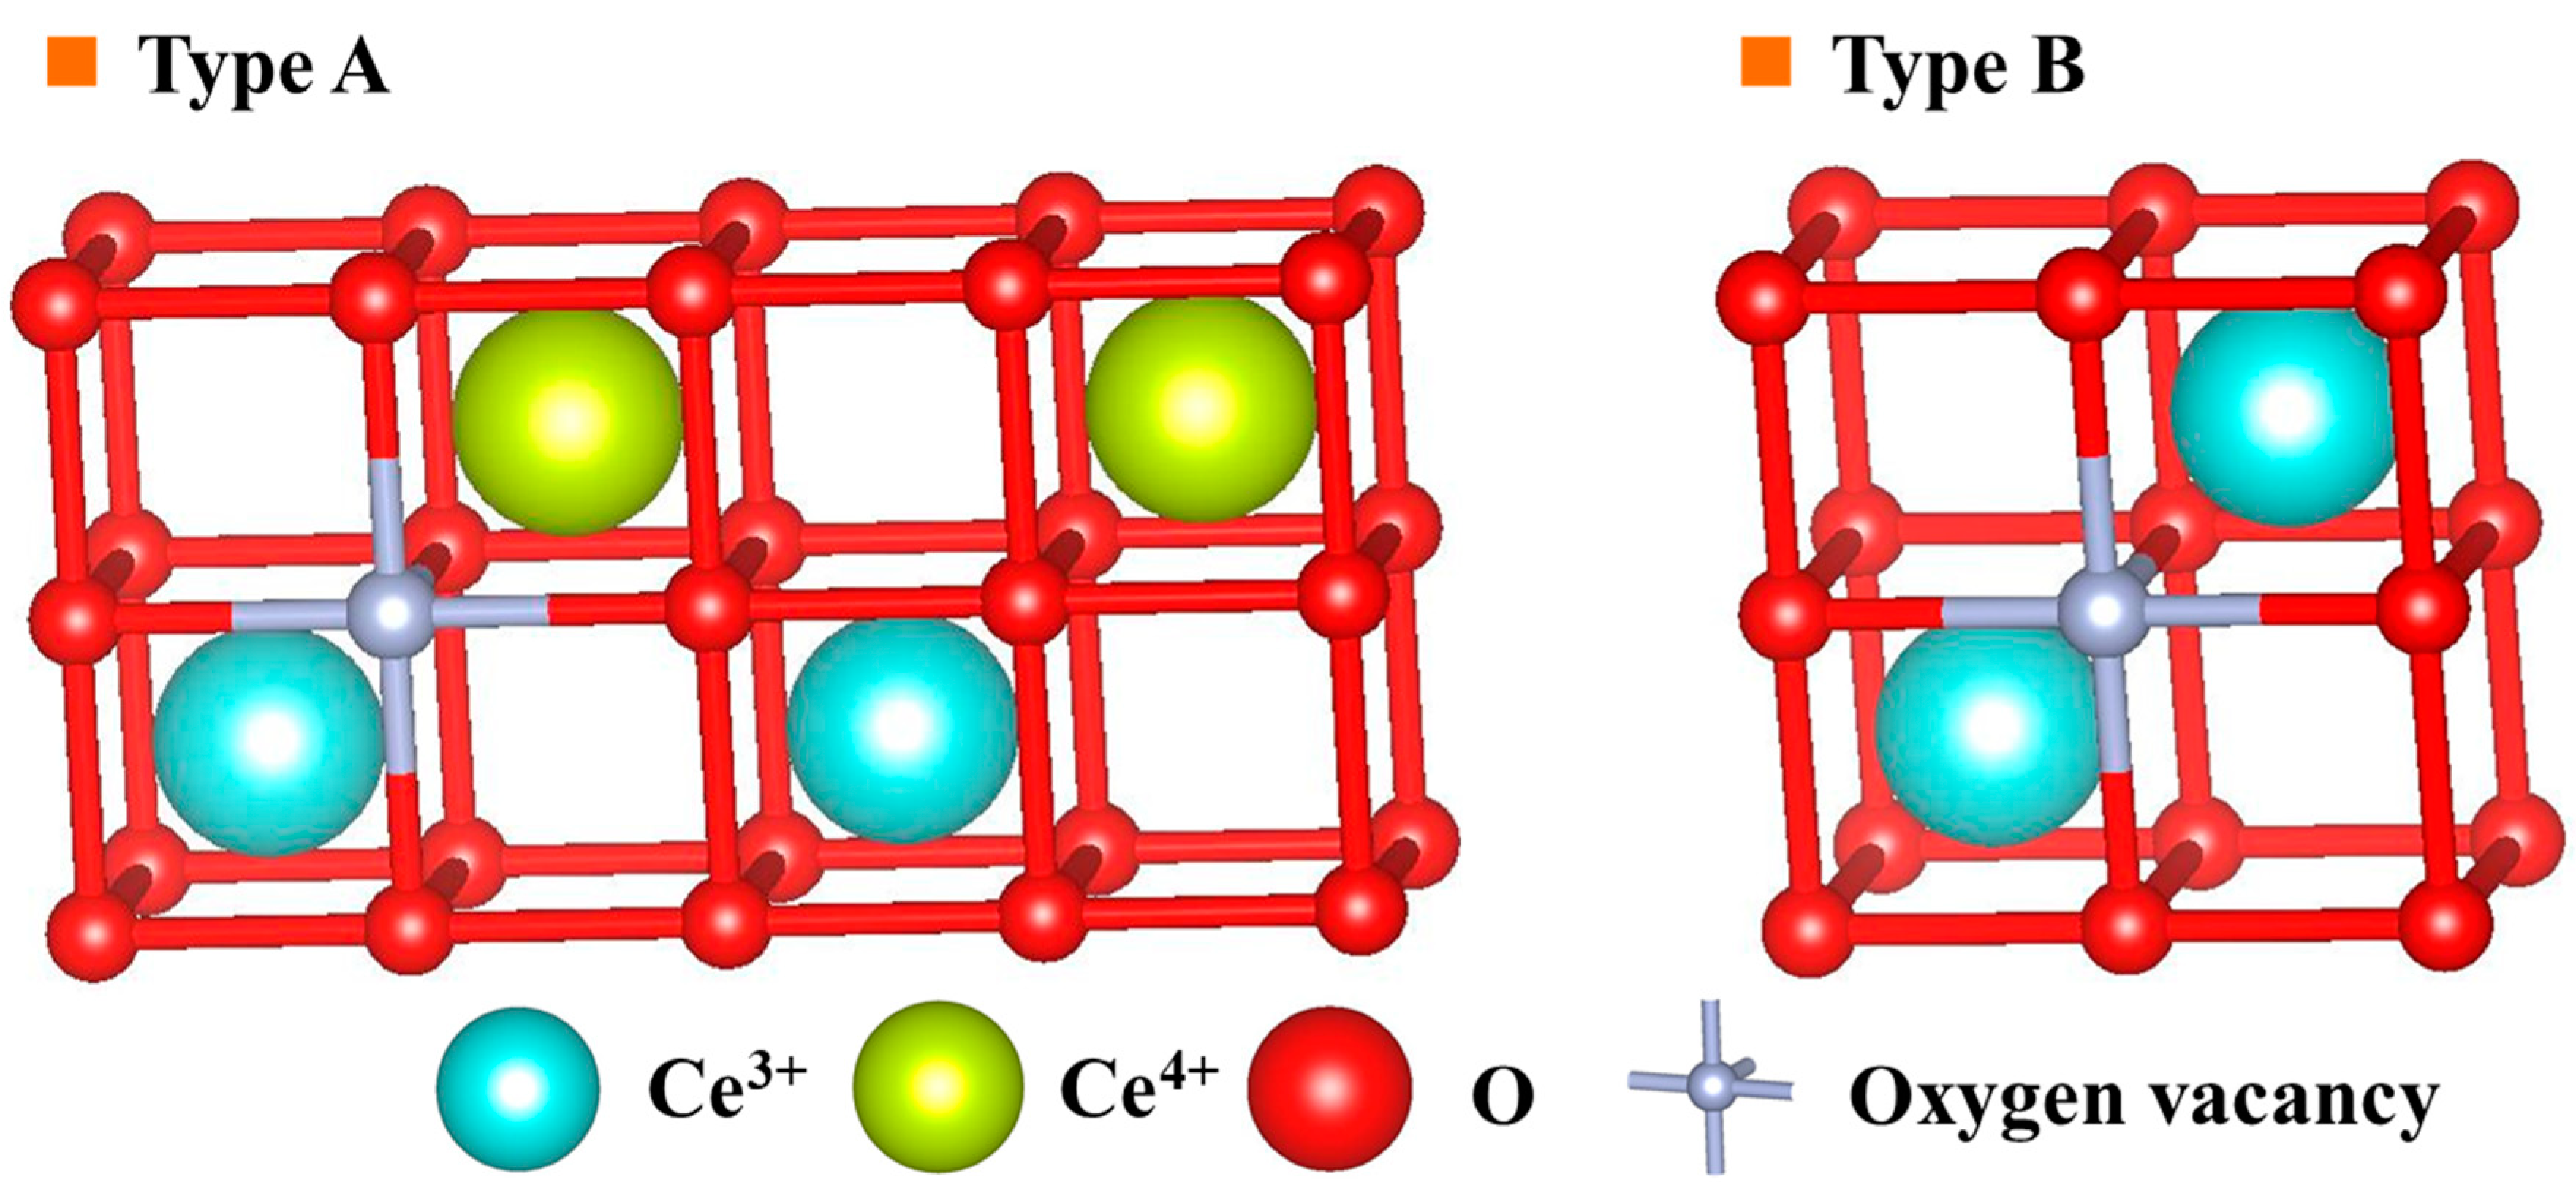
Formation of a cluster composed of oxygen vacancies and trivalent cerium ions has been proposed by some researchers, using the cluster model for the structure of cerianite, which is specified by the number of oxygen vacancies and their configuration and those of cations around the vacancies [
13,
20,
21]. According to the cluster model, two models expressing the local structures around oxygen vacancies are proposed, as shown in
Figure 5: One oxygen vacancy in the structure of cerianite is introduced for every two trivalent cerium ions, as required by the electroneutrality condition. In the type A model, one unit cell of cerianite contains one trivalent cerium and one oxygen vacancy, while the other unit cell contains one trivalent cerium and no oxygen vacancy; in the type B model, one unit cell of cerianite contains two trivalent ceriums and one oxygen vacancy. If only type A were formed, the Ce(III)–O atomic distance in the cerianite would not be expected to decrease as the concentration of trivalent cerium in the ore increased with grinding time; if only type B were formed, a similar trend would occur. If both types A and B co-existed, and the proportion of type A decreased and that of type B increased with grinding, then the Ce(III)–O atomic distance in the cerianite would decrease as the concentration of trivalent cerium in the ore increased with grinding time. From the above discussion, it is suggested that oxygen vacancies occurred in the cerianite in the weathered residual rare earth ore and changed the structure from that of fluorite to one in which types A and B co-existed and the proportion of type B increased as grinding time by planetary ball milling increased.
From the results of the XANES and EXAFS analysis, it is suggested that the process of oxygen vacancy formation was closely coupled with the quantum effect of localization–delocalization of the 4f electron of cerium. Oxygen in cerianite has two extra electrons in the p band, provided by tetravalent cerium. When an oxygen vacancy is produced in cerianite, it is suggested that these two electrons are left behind and occupy the lowest possible empty state, which is the f band of cerium. Thus, the tetravalent cerium in the cerianite is reduced to trivalent cerium (
Figure 6).


