1. Introduction
Inkjet printing is a versatile deposition technology widely utilized today [
1,
2,
3]. Originally developed for graphic arts [
4], the advantages of digital imaging moved quickly into the textiles industry [
5] and into the decoration of ceramic tiles [
6] and laminate flooring [
7]. In the meantime, inkjet printing has received huge attention for manifold electronic and functional applications, with the number of publications made in the last 20 years impressively reaching about 20,000 contributions (Google Scholar search from 13.04.2023; the search term “functional inkjet printing” delivered 19,700 results [time period: 2003–2023; excluding citations]). The scope lies in between optical, electrical, chemical, biological, and 3D printing [
8,
9,
10] applications. Functional materials, which are used for inkjet printing, provide, for instance, electrical conductivity, semi-conductivity, insulation, piezoelectricity, luminescence, or chemical sensing to create, e.g., printed antennas [
11], sensors [
12], capacitors [
13] or transistors [
14]. Most commonly, the printing substrate is flat, and the printing direction is upside down. The inkjet head is either fixed while the substrate moves, or vice versa.
A new degree of freedom is generated when an inkjet head is combined with xyz positioning or even a robot system. This enables the contact and maskless additive deposition of functional materials directly onto an object. By using standard industrial robots, a guided inkjet printhead can perform motions in any direction in 3D space and can be applied in production facilities, such as in the automotive or aviation industries. Regarding future prospects, this enables the digital and automatized production of electronic components, like parts of a wiring harness, sensors, heating elements, or antennas, to be used in wireless communication on the large-scale surfaces of cars and airplanes.
The first described systems, which were composed of an inkjet printhead and a robot multi-axis system, were meant to deposit decoration colors onto vehicles or even airplanes. Jean-Pierre Gazeau et al. reported on the development of a five-axis inkjet printing robot for the printing of images onto 3D, wide area surfaces in a publication from 2009 [
15] and a patent from 2006 [
16]. Further applications saw the decoration of shoes, bottles, or balls. Many patents have been filed for this method and for different technical improvements regarding robot-guided printing technology to colorful printing [
17,
18,
19]. The challenges in these kinds of applications are the generation of the inkjet head pathway as well as the stitching of several swathes to generate colorful images without any missing parts. The first known publication, which addresses the topic of “functional inkjet printing on 3D”, was published in 2005 [
20]. Scientists used a continuous inkjet printhead and a 2D motion system to print an antenna structure onto a glass cup. Only a few further scientific publications are known that focus on functional inkjet printing onto objects in combination with robot systems [
21,
22,
23,
24,
25]. In these publications, the setups are composed of an inkjet printhead that was mounted onto a six-axis robot manipulator. Therein, the results and properties of electrical applications were demonstrated, like conductive tracks on a microscope glass slide [
21,
22], a capacitive level sensor [
23,
24], and basic research on the flow behavior of printed conductive layers on inclined planes, including inline infrared (IR) post-treatment to facilitate electrical resistance homogeneity [
25].
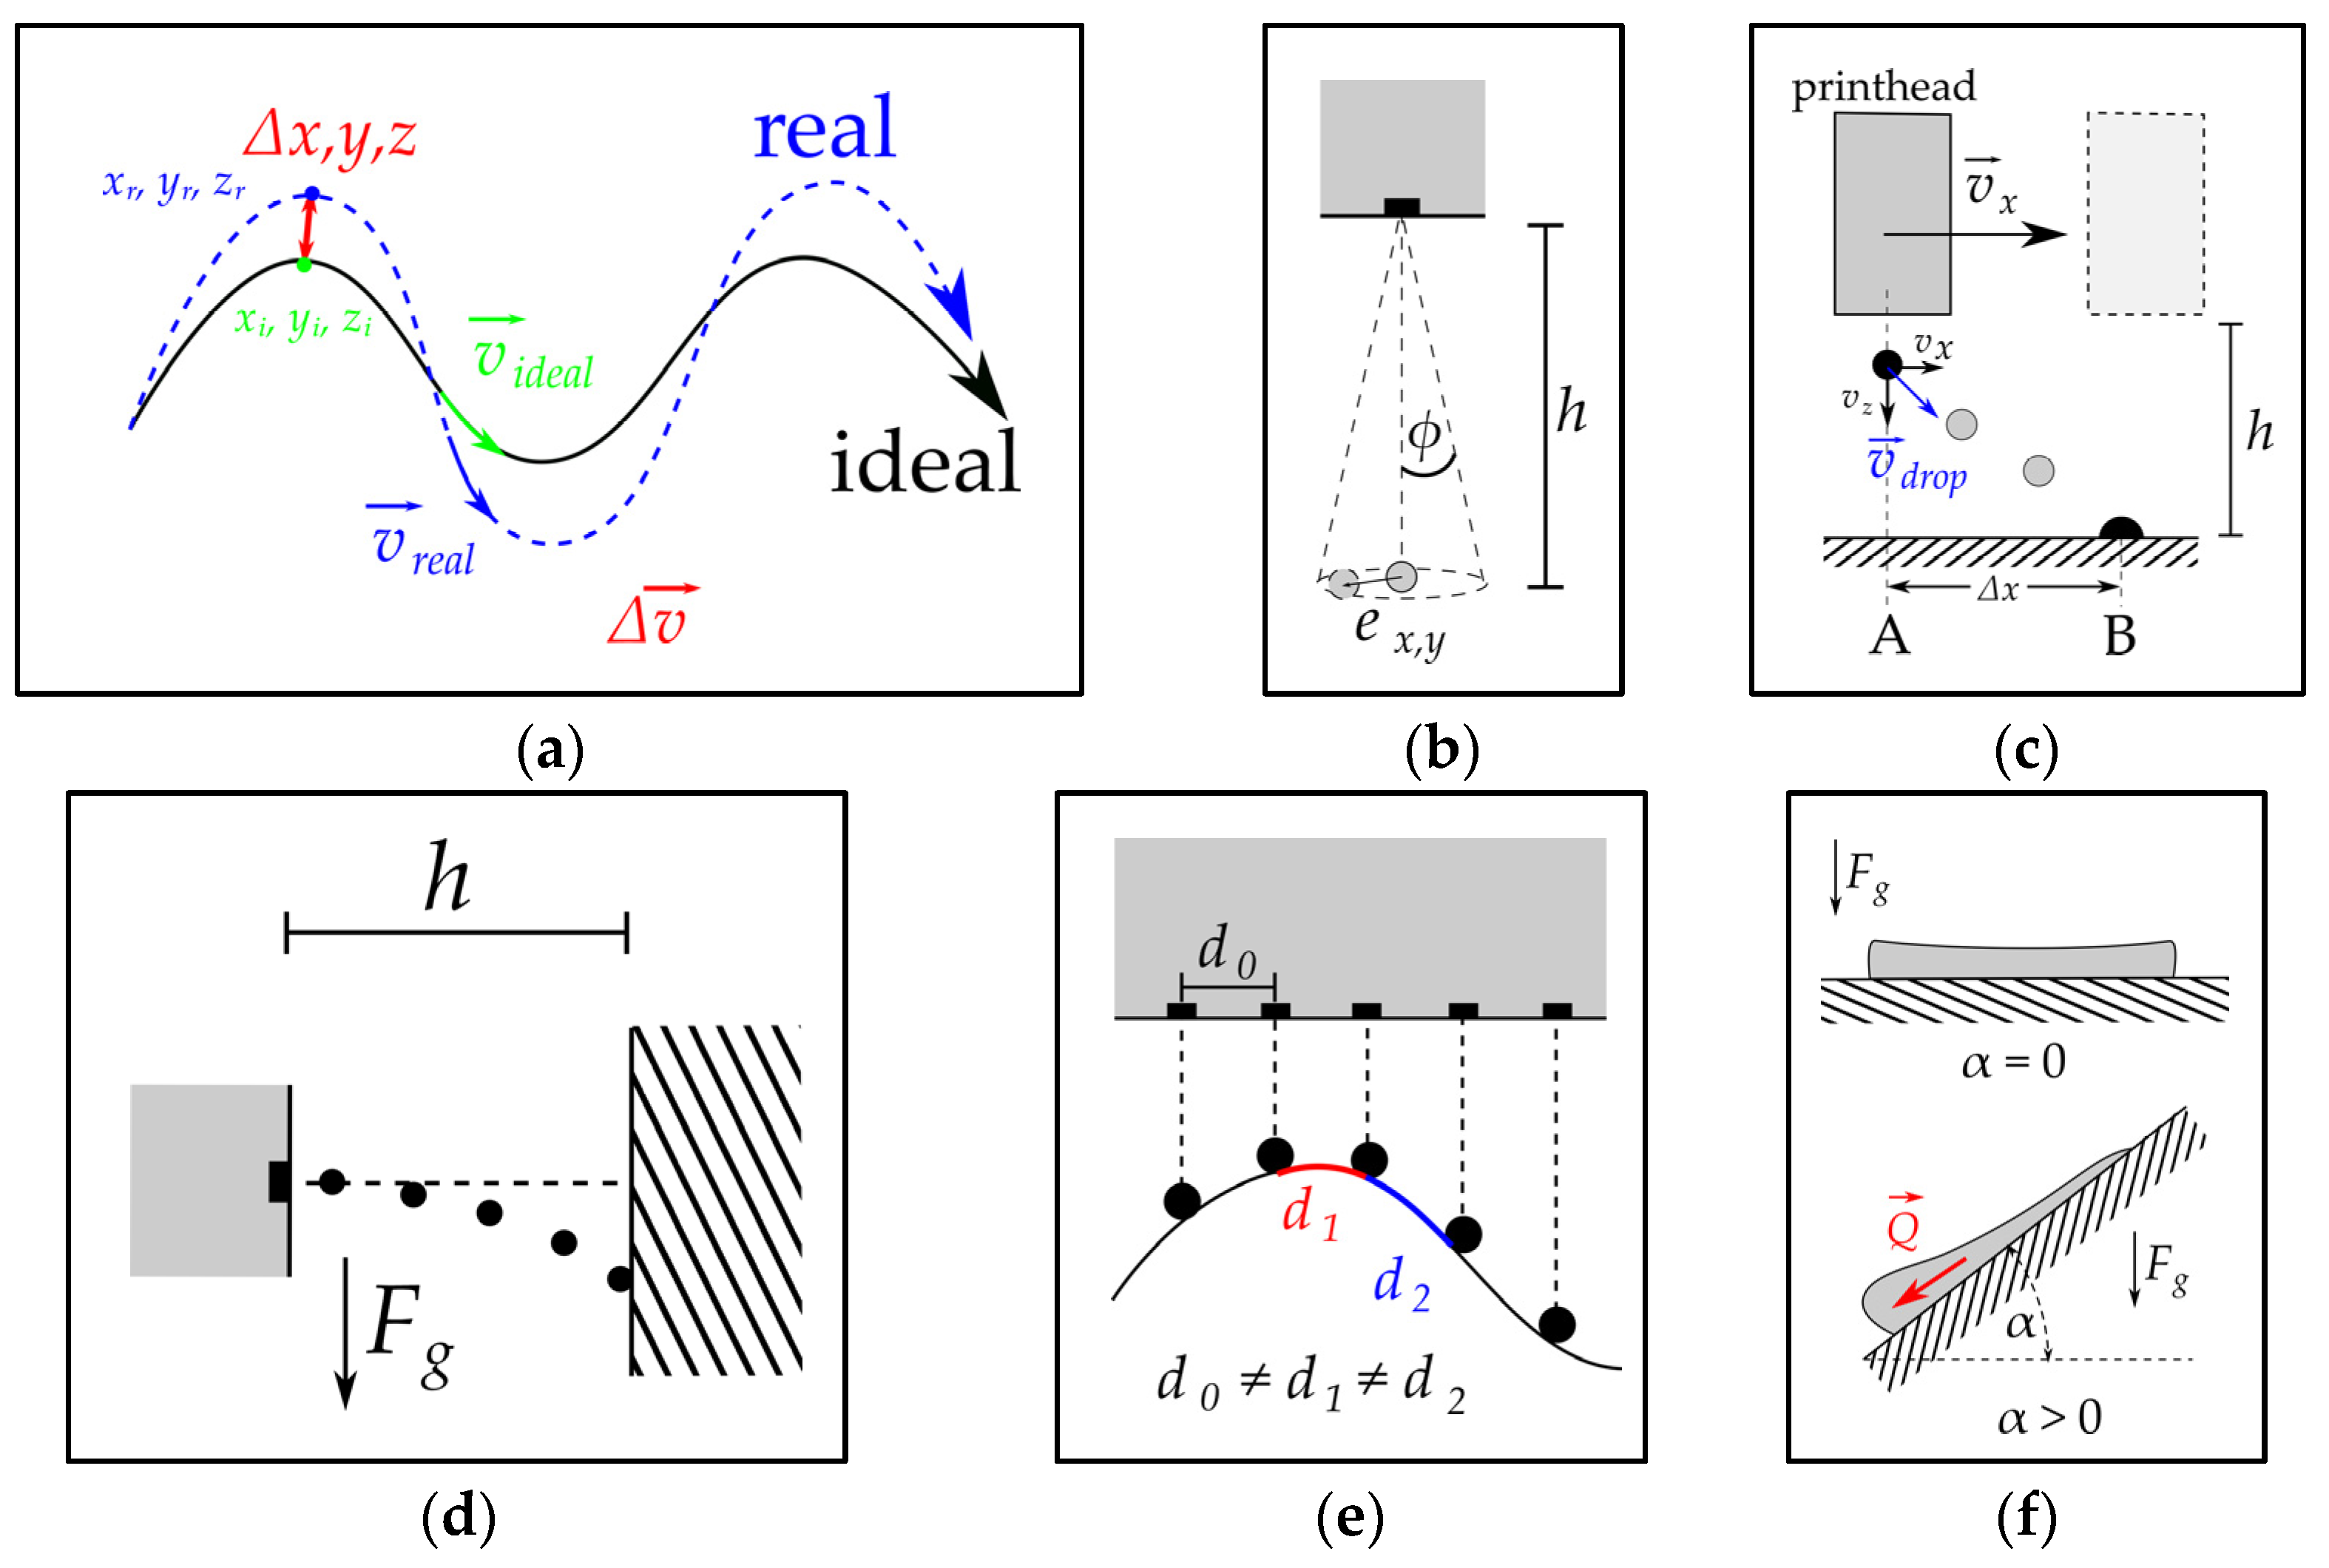
When compared to conventional functional inkjet printing on flat surfaces, major differences, and additional error sources have to be considered regarding the robot-guided inkjet approach. Firstly, the printing direction is not solely upside down but also angled with respect to the gravitational field. Additionally, the printhead, which is a 2D array consisting of hundreds of nozzles, moves over a curved 3D surface. Therefore, its throw distance is increased and differs from one nozzle to another, which has more impact. Finally, the printhead assembly has to work with a certain additional standoff to avoid a collision, especially when printing into cavities. Knowledge of the applicable process parameters, like the maximum jetting distance, is key to achieving the desired accuracy and, in the end, proper functionality of the printed functional layers.
The current investigations discussed in this paper represent fundamental experiments for understanding inkjet basics and determining the dot placement accuracy that is achievable in robot-controlled inkjet printing with respect to three-dimensional objects. The inkjet printing process was investigated down to the drop size level to understand and determine the process limits for the maximum applicable jetting distance in inkjet printing onto 3D objects. Therefore, comprehensive printing experiments were conducted on different cylinders for a solvent-based conductive silver nanoparticle ink and a dielectric solvent-free UV curable ink, as well as for different drop sizes and driving voltages. The print results were analyzed and compared to a specifically developed model, which calculates the ideal position without the deflection of single droplets on the cylinder surface according to the print configuration. Finally, out of this comparison, the placement error in relation to surface distance was determined for all parameter sets. By the reversal calculation of fitted functions, a given placement tolerance can be used to determine the maximum applicable jetting distance. Along with knowledge about the influence of the jetting distance and projection-based geometrical deviations, the robotic printing process can be improved by defining limits that can be applied to the printing process.
In the following
Section 2, we first give an overview of the error sources for placement errors in inkjet printing onto arbitrary surfaces. Following this, the robot printing system is described in
Section 3. In
Section 4, the basic experiments and the mathematical model are presented. Finally, the results are discussed in
Section 5, and in
Section 6, our conclusions are drawn, and future perspectives are given.
3. Experimental Setup and Methodology
The experiments were conducted using a setup (see
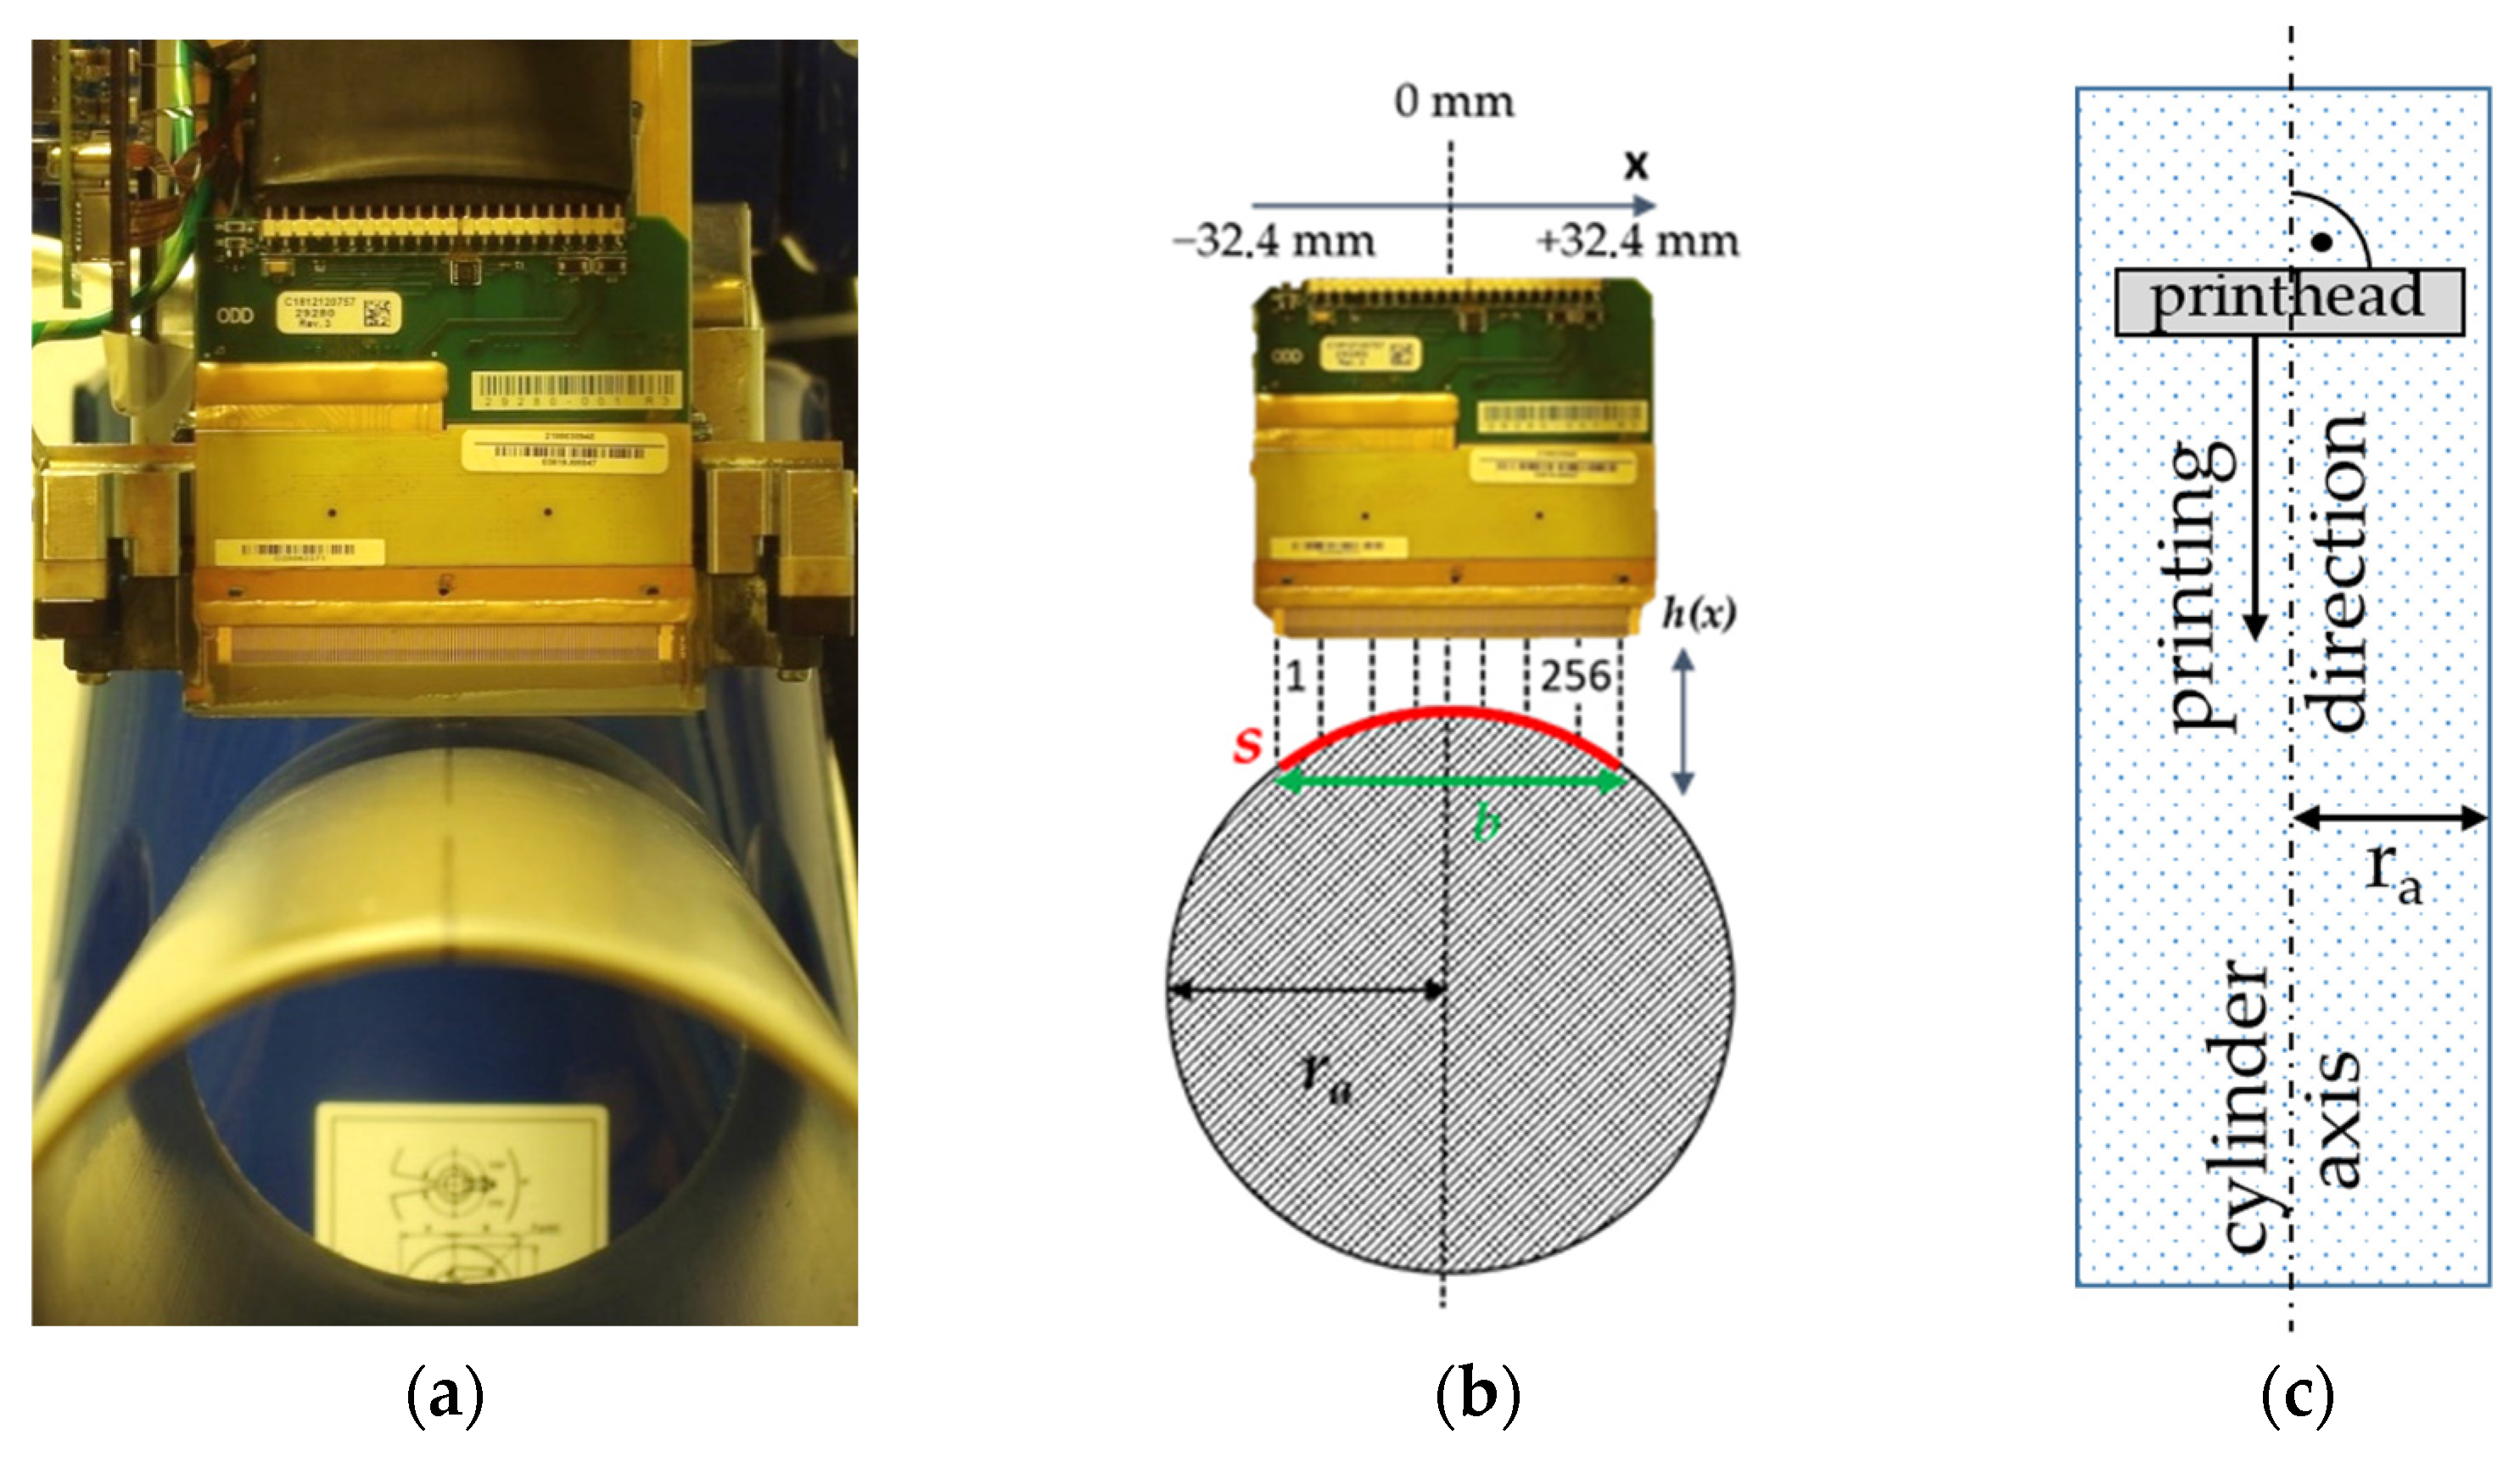
Figure 2) based on the six-axis robot arm GP8 controlled by the YRC1000 robot controller from Yaskawa (
Figure 2a). The manipulator’s repeatability is ±10 µm, with a maximum payload of 8 kg and a maximum working range (exclusive tool) of 727 mm, according to manufacturer specifications. At the flange, a mounting frame is attached, whereby different tools can be installed. For the printing experiments, the robot was guiding one out of three Q-Class piezo inkjet printheads from Fujifilm Dimatix (
Figure 2b), which consist of 256 square-shaped nozzles in one row, with a native resolution of 100 dpi (i.e., a distance of 254 µm between two nozzles), and a calibrated drop volume of 10 pL, 30 pL, or 80 pL, respectively. The diameters of the orifices are 31 µm (10 pL), 42 µm (30 pL), and approx. 60 µm (80 pL). The printhead controller (Mercury Development Kit from Fujifilm Dimatix) enables the user to drive the signal—also called a waveform—which is applied so as to electrically drive the piezo crystals. Besides the signal shape (rise, hold, and fall time), the operating piezo voltage and frequency can be altered, as well as the temperature within the printhead assembly (increasing temperature will lower the ink’s viscosity). Furthermore, a meniscus pressure pump was used to create a negative pressure within the ink reservoir in the range of 6–9 mbar to prevent the ink from leaking. The value was adjusted depending on the ink properties and level.
Two different inks were used for the experiments:
[AGF]—a black UV-curable ink from Agfa (Altamira Pack LMX) with a density of 1.09 g/cm3, 9–11 mPa·s viscosity (T = 45 °C), and 22.5 mN/m ± 1 mN/m (T = 25 °C) surface tension;
[PVN]—a silver nanoparticle ink from PV Nanocell (I40DM-106) with a density of 1.62 g/cm3, 10 mPa·s viscosity (T = 25 °C), and a silver load of 40%. The surface tension was not determined.
For the initial determination of drop volume and the velocity for both inks, the drop-watching device jetXpert OEM (ImageXperts Inc., Nashua, USA) was used (
Figure 2c). Flexible photo papers with a nanoporous layer were used as substrates mounted directly on the cylinder surfaces (three different radii: 35 mm, 45 mm, and 55 mm) for the printing experiments. Microscopic images from the print results were taken with a microscope from Zeiss (Axio Imager M2). The whole image width (up to 83 mm) was covered by multiple images, which were stitched. For image processing, the ImageJ software (developed by the National Institute of Mental Health (NIMH)) was employed. The software is available on the RSB home page (
https://imagej.nih.gov/ij/index.html, accessed on 10 February 2023). The evaluation of the displacement error was conducted by using a program that was written in Matlab (The Mathworks, Inc., Rev. R2021b).
4. Experiments and Modeling
The focus of the experiments was related to the displacement errors resulting from the surface-to-printhead distance, as described in
Section 2.2.1—Jet Straightness in Relation to Print Distance. Therefore, the printing process was investigated down to the drop size scale in two sets of experiments: In
Section 4.1—Drop Watching, the basic parameters of drop size and speed for different kinds of setups are reported. In
Section 4.2—Printing onto a Cylinder, the placement accuracy in relation to the jetting distance is determined using a method based on a comparison between the model and the experimentally observed drop positions on the cylinder surface. The influence of gravitational force, which resulted in a liquid flow within the isolated droplets used in the experiments, was assumed to be neglectable. Within this study, in total, 36 combinations of ink, drop volume, cylinder radius, and voltage were investigated.
4.1. Drop Watching
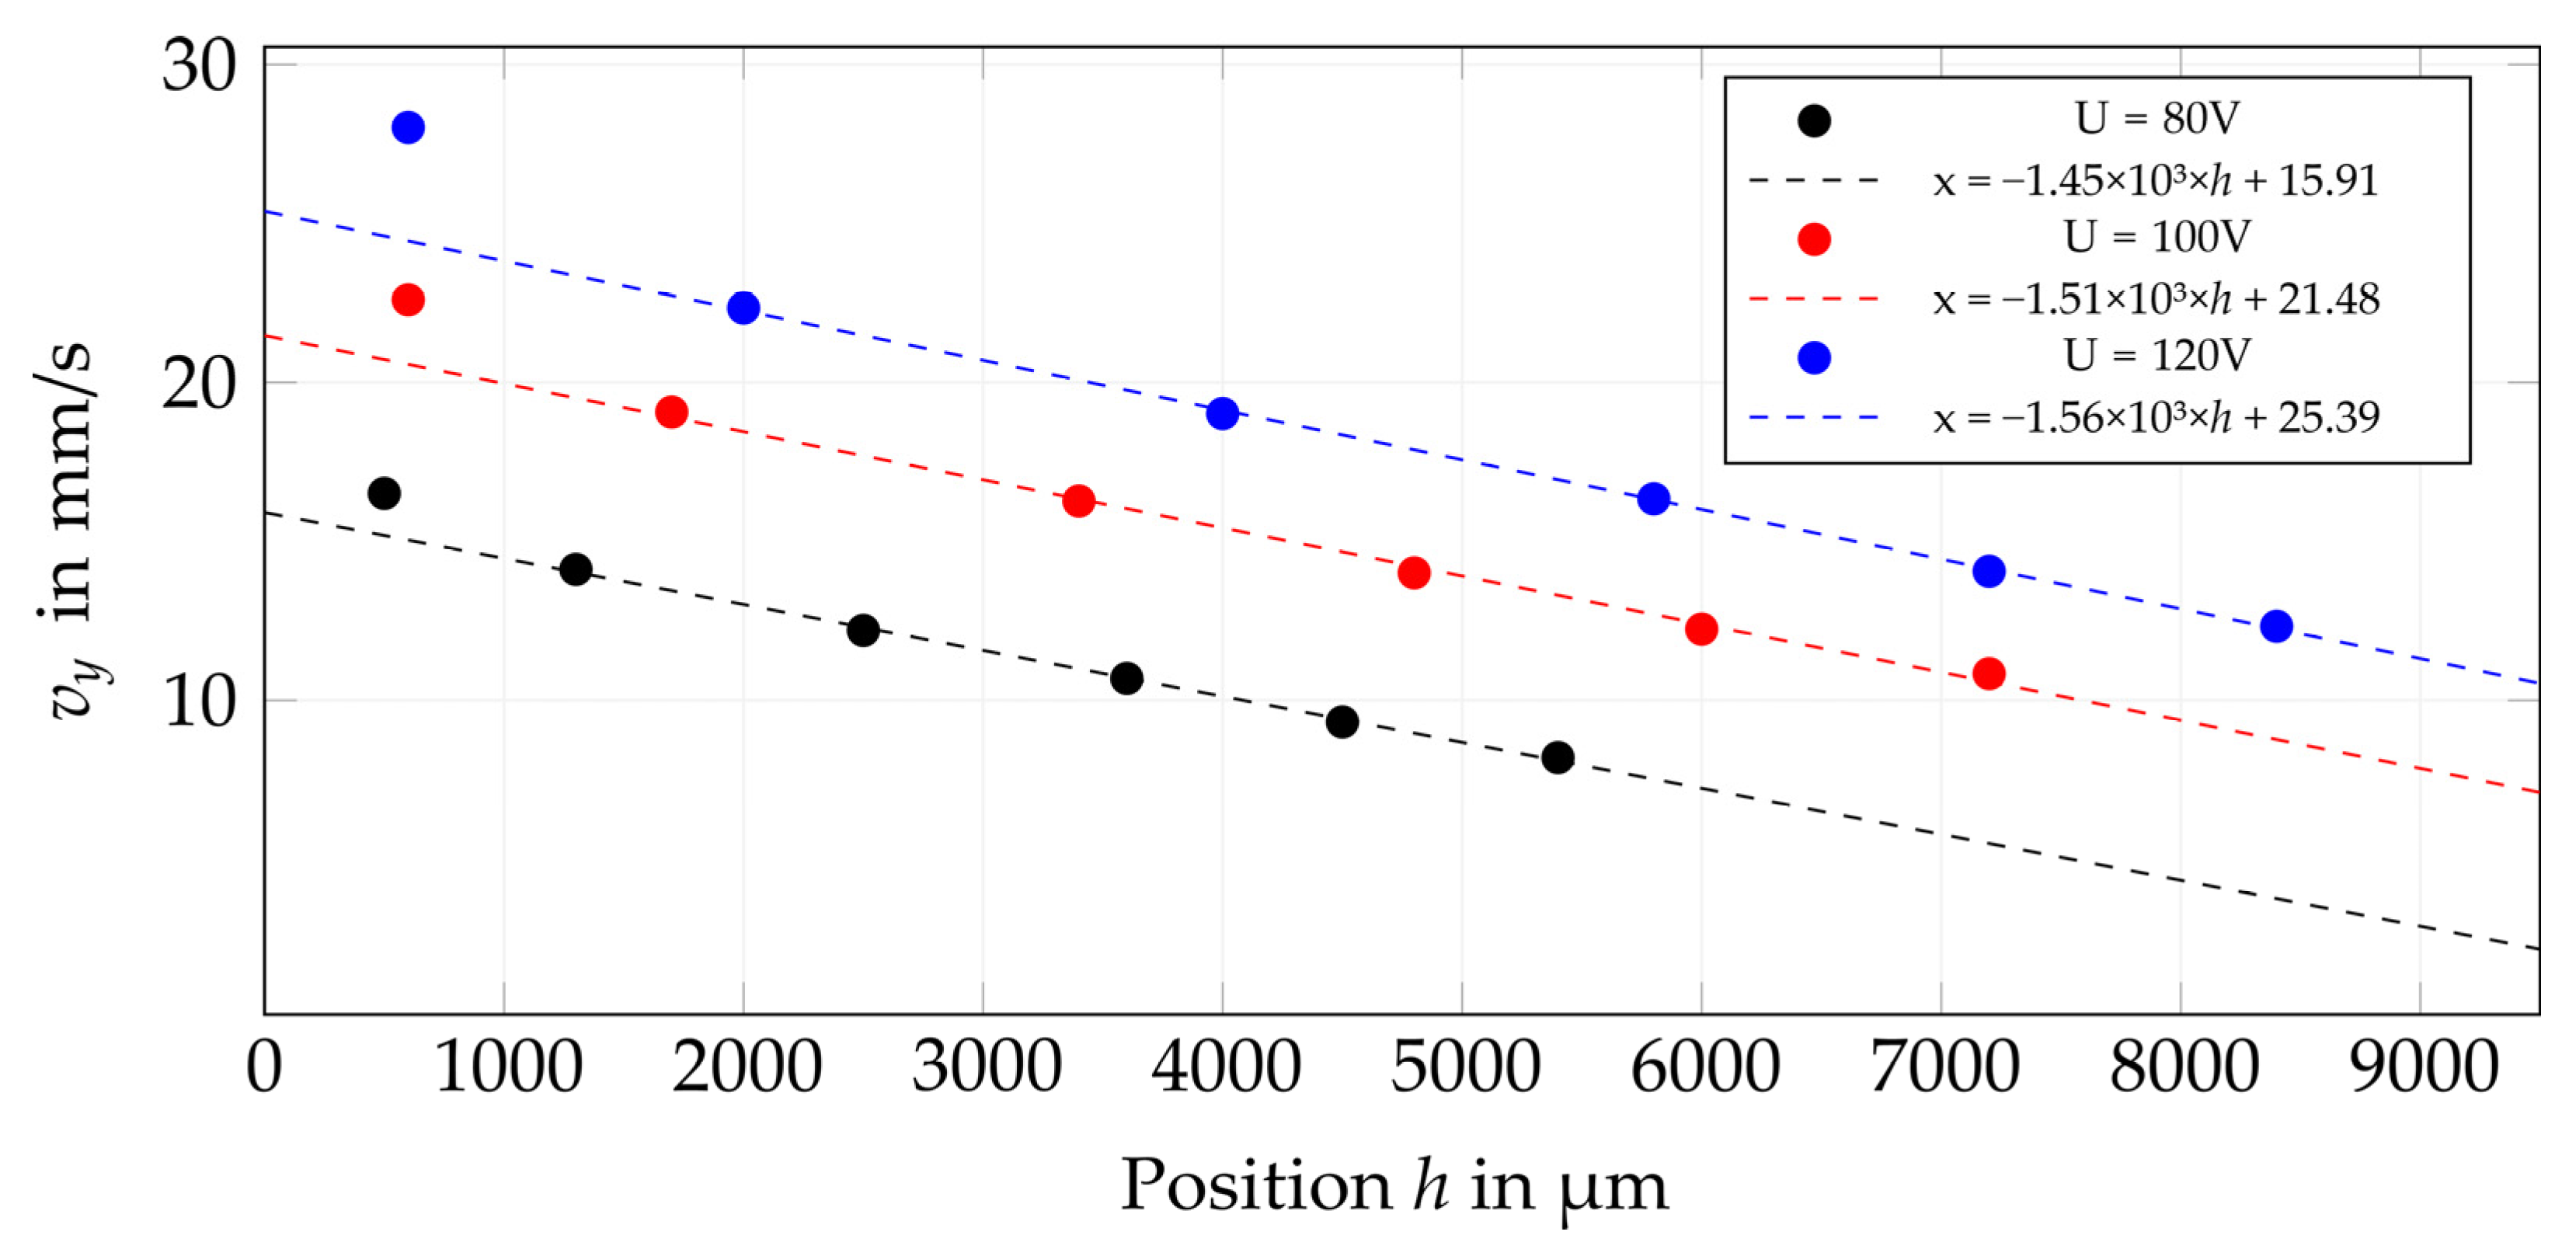
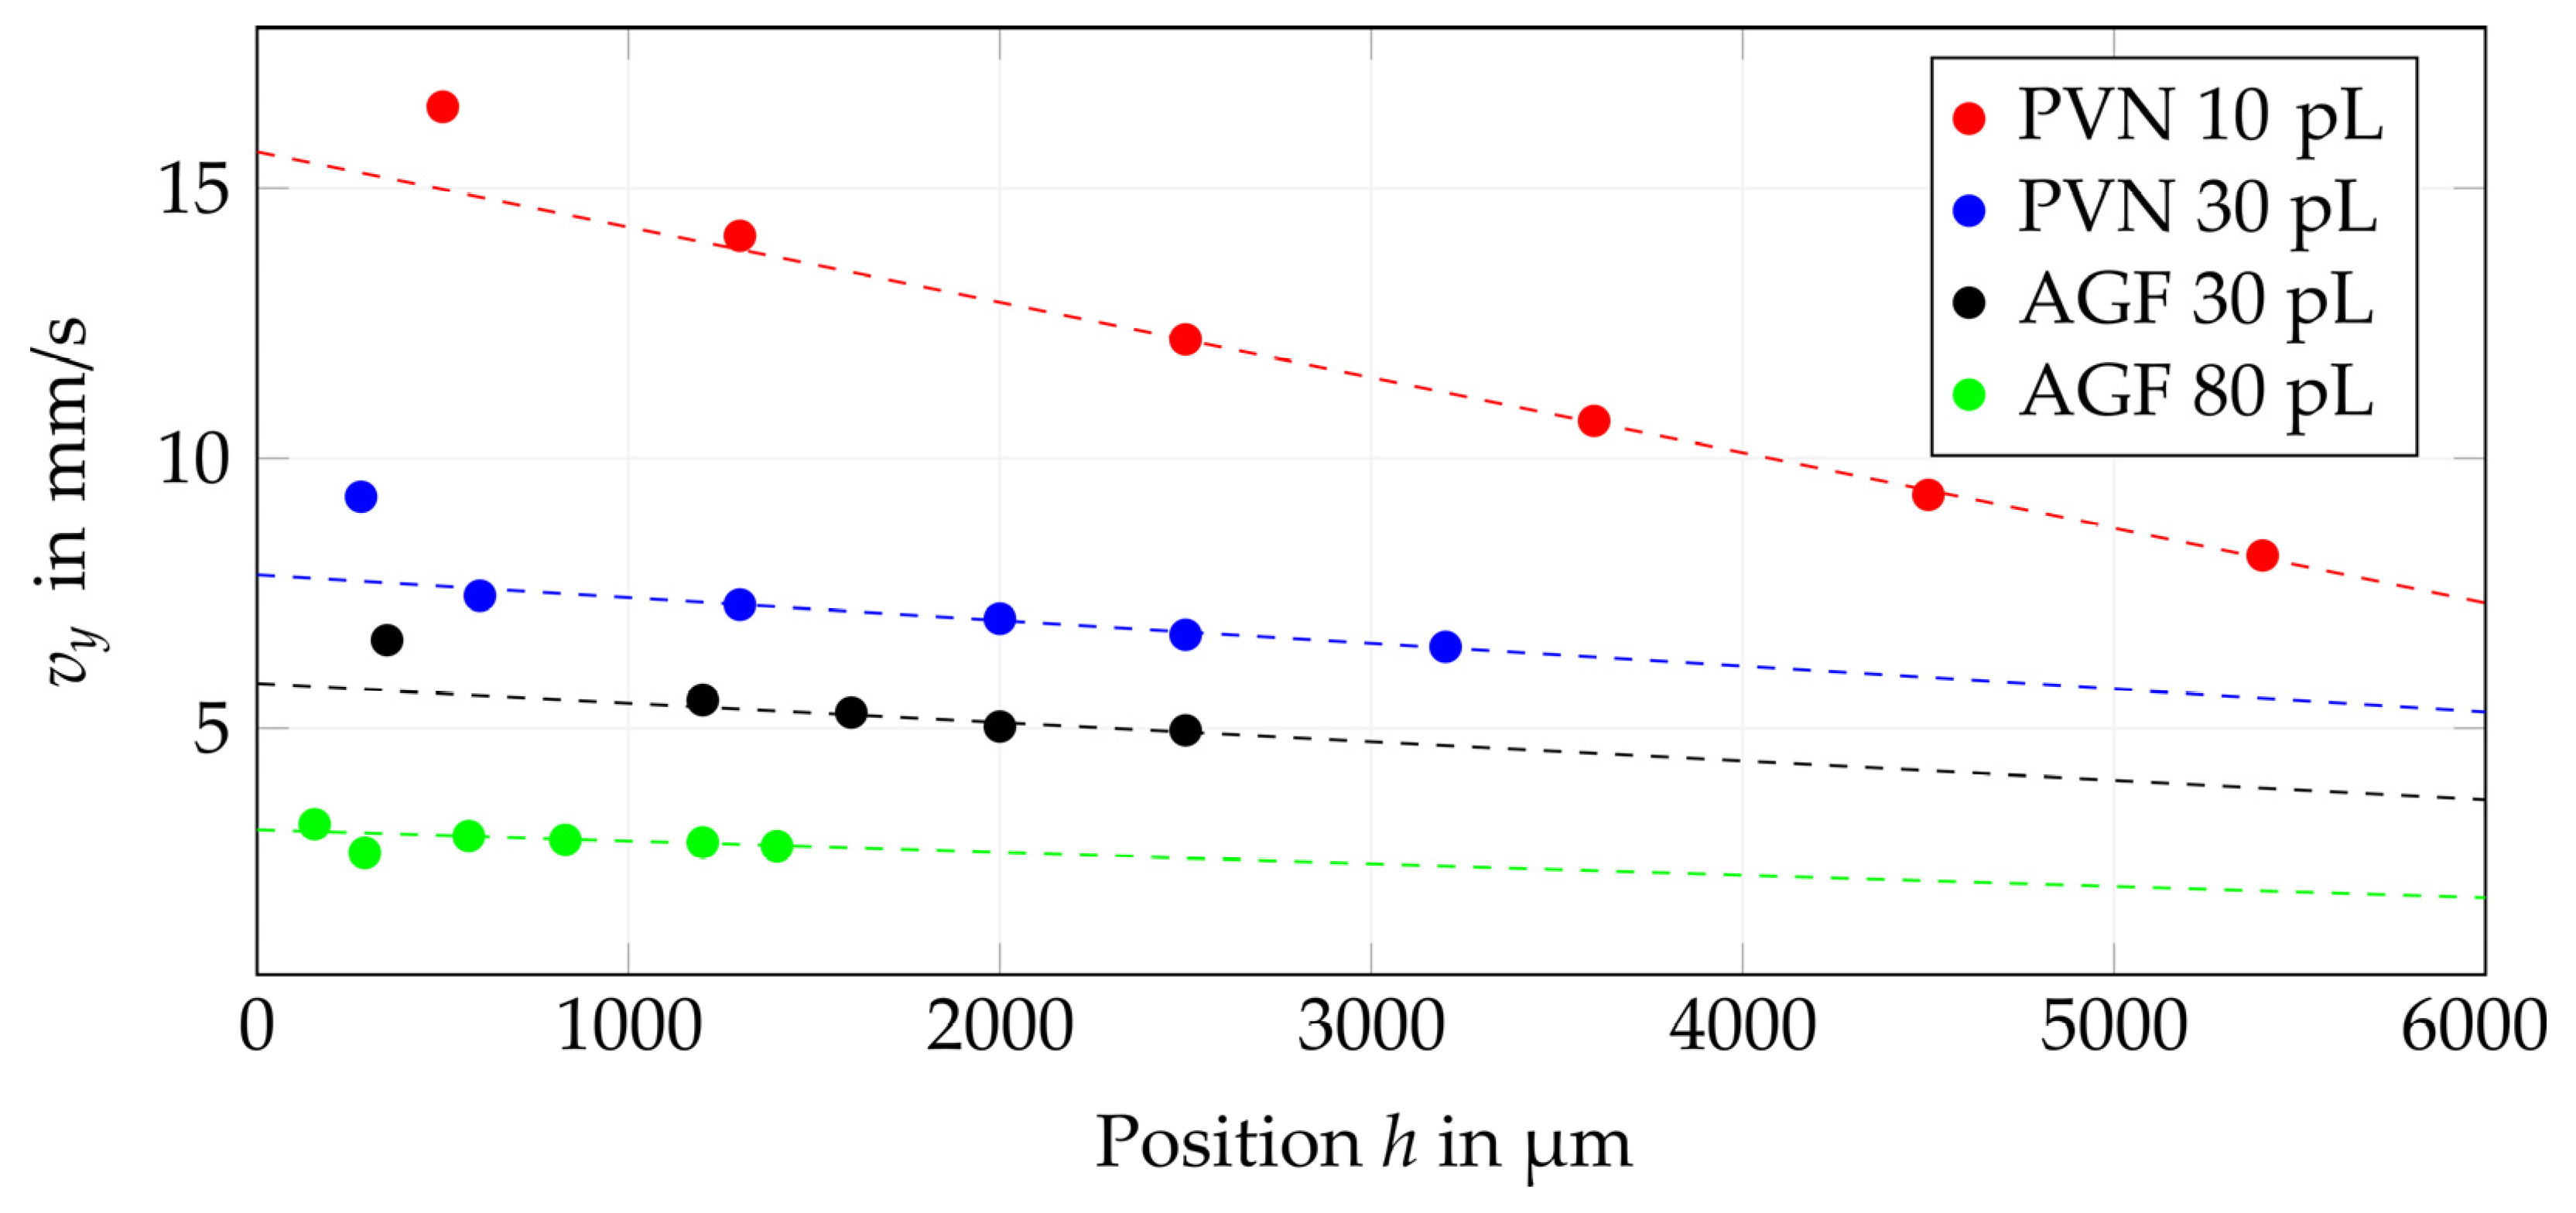
The prior characterization of inkjet droplets is essential for drop trajectory modeling and the calculation of the placement error. The nominal drop volume of each printhead is related to the nozzle geometry and its size. These values are specified by the printhead manufacturer. The actual ejected drop volume might differ and depend on certain parameters, like driving voltage, waveform, ink viscosity, and surface tension. For the current experiments, we have chosen printheads (Fujifilm Dimatix Q-Class Sapphire) with nominal volumes of 10 pL, 30 pL, and 80 pL, respectively, and tested two different inks. Additionally, three different driving voltages were used: 80 V, 100 V, and 120 V. The waveform was fixed for each parameter set of printheads, inks, and piezo voltages.
The distance,
h, between the nozzle plate and observation spot varied between 300 µm and 8400 µm, depending on the setup. At each stage, the drop velocity and volume were determined. By using the regression curve for the velocity values,
at different distances,
h, according to Equation (1),
and the slope,
m, were determined.
The results of these experiments were used for the drop position model for printing onto a cylinder.
4.2. Printing onto a Cylinder and Modeling
4.2.1. Print Setup
For the investigation of the drop placement accuracy in relation to the jetting distance, a setup was deployed with a printhead above a cylinder. The printhead was oriented perpendicular to the cylinder axis, and its motion was directed along this axis (see
Figure 3a,b). The center of the printhead was aligned with the axis of this cylinder. In this setup, the center of the printhead has the smallest distance to the cylinder surface while the outermost nozzles have the largest. For these experiments, cylindrical plastic tubes with three different radii
(
= 55 mm,
= 45 mm, and
= 35 mm) were covered with photo paper. The robot was programmed to guide the printhead in a linear motion with a constant speed of 152 cm/min and constant minimum distance of approx. 1 mm between the center nozzle and the cylinder surface (
Figure 3c). The fire frequency of the printhead was 0.1 kHz (i.e., a distance of 253 µm between two droplets in the printing direction and of 254 µm across the printing direction). The printing was performed using both inks and different native drop volumes (PVN = 10 pL and 30 pL; AGF = 30 pL and 80 pL) and three different driving voltages (80 V, 100 V, and 120 V). Following the printing process, no post-treatment (temperature, UV) was applied. The samples were dried in a laboratory environment.
4.2.2. Modeling
Following the print setup description, the mathematical modeling of printing onto the cylinders was performed.
Print Distance
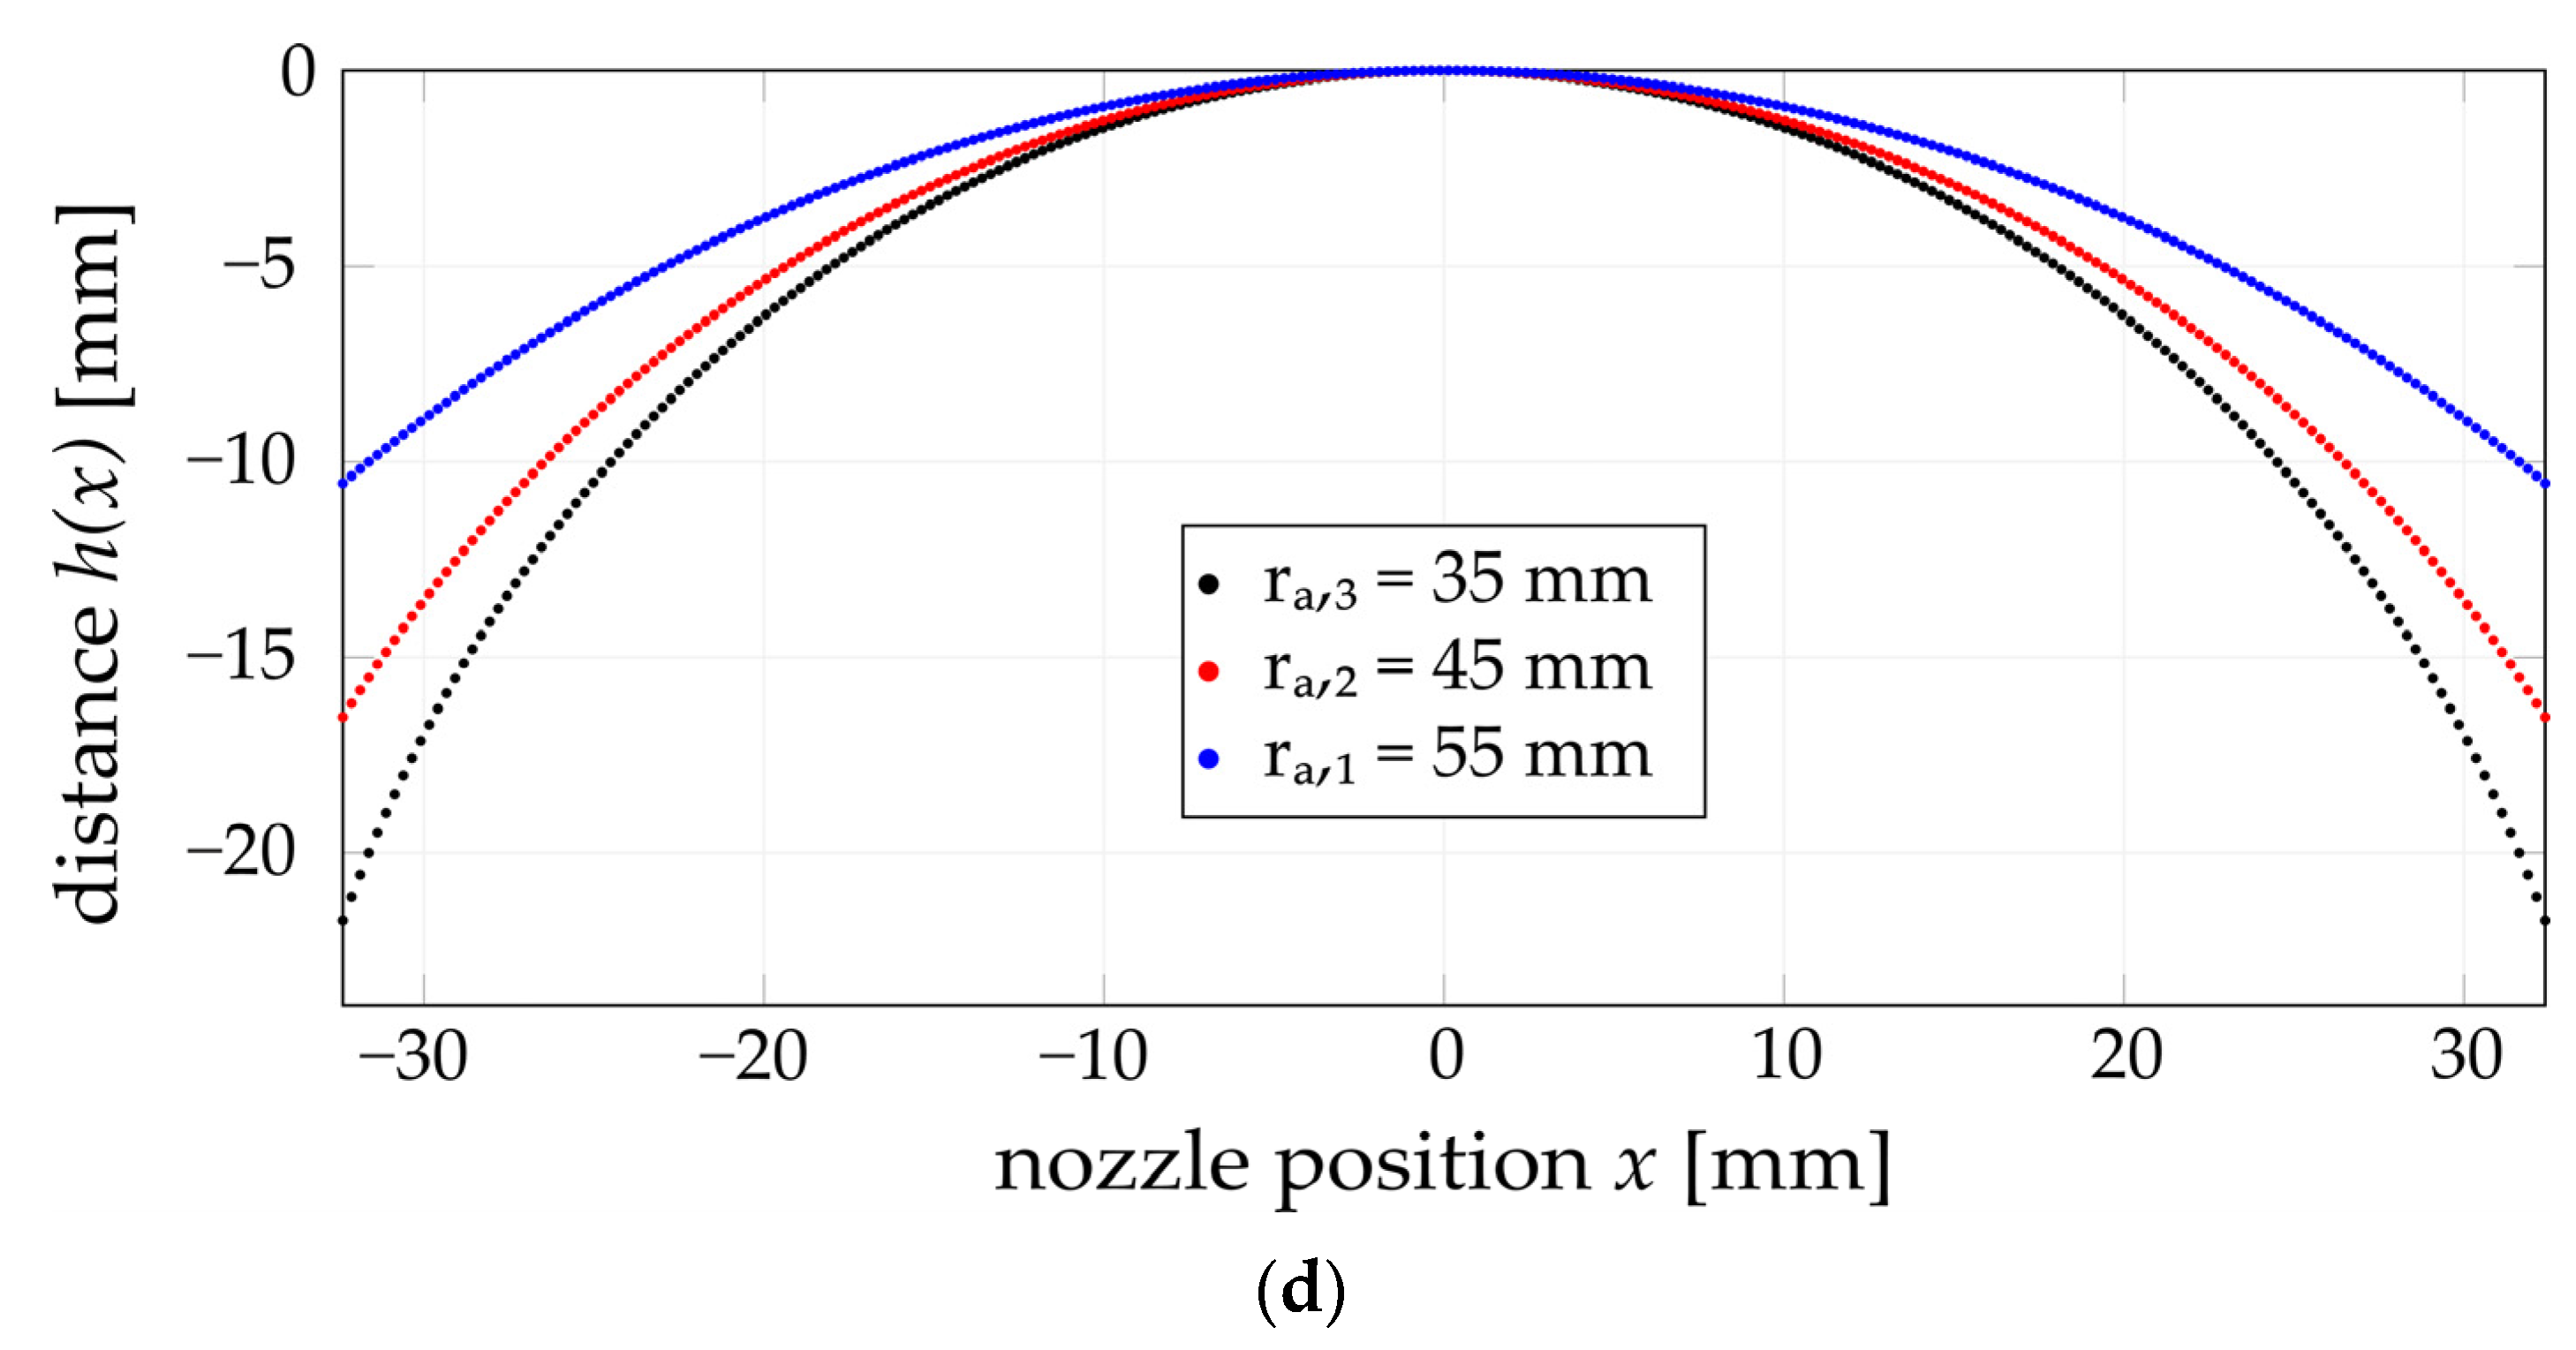
In relation to the cylinder radius,
, and the printhead nozzle (
Figure 3b) at position
x, the distance,
hi(
x), towards the cylinder surface can be calculated using Equation (2) based on the Pythagorean theorem:
For
= 55 mm, the distance,
h1(
x), of the outermost nozzle at
x = ±32.385 mm is approx.
h1(±32.385)
= −10.5 mm. At
= 35 mm,
h3(
x) is nearly
h3(±32.385)
= −21.7 mm, as shown in the diagram in
Figure 3d. Assuming the jetting occurs in an ideal, static pose without any deviation, a simple projection occurs and reveals the ideal position of the resulting dots on the surface.
Deviation in Relation to Print and Drop Speed
In a dynamic printing process, both motion,
, and ejection,
, speed will lead to a distorted print image regarding this cylinder setup (see
Section 2.2). Equation (3) describes the deviation,
Δy, in print respective to the
motion direction.
According to [
26], the drop velocity,
, is constantly reduced by the drag force and buoyancy. Moreover, the drop volume, cross-section, and density, as well as the drag coefficient, determine the reduction in speed and the maximum jetting distance. Instead of using a numerical approach to calculate the drop velocity,
, our model relies on empirical data from the observation of the drop flight via a drop watcher in different height positions according to Equation (1) (see
Section 4.1—Drop Watching).
In relation to the distance,
hi, between the nozzle plate and the surface, the average velocity,
(Equation (4)), was used for the calculation of
Δy,
i. For the model, the movement speed,
, was assumed to be constant.
For assessing the print quality, we obviously needed to compare the ideal projection with the real position of single dots on the printout. For the calculation of the ideal projection, it was necessary to consider line elongation according to the cylinder radius.
Image Distortion
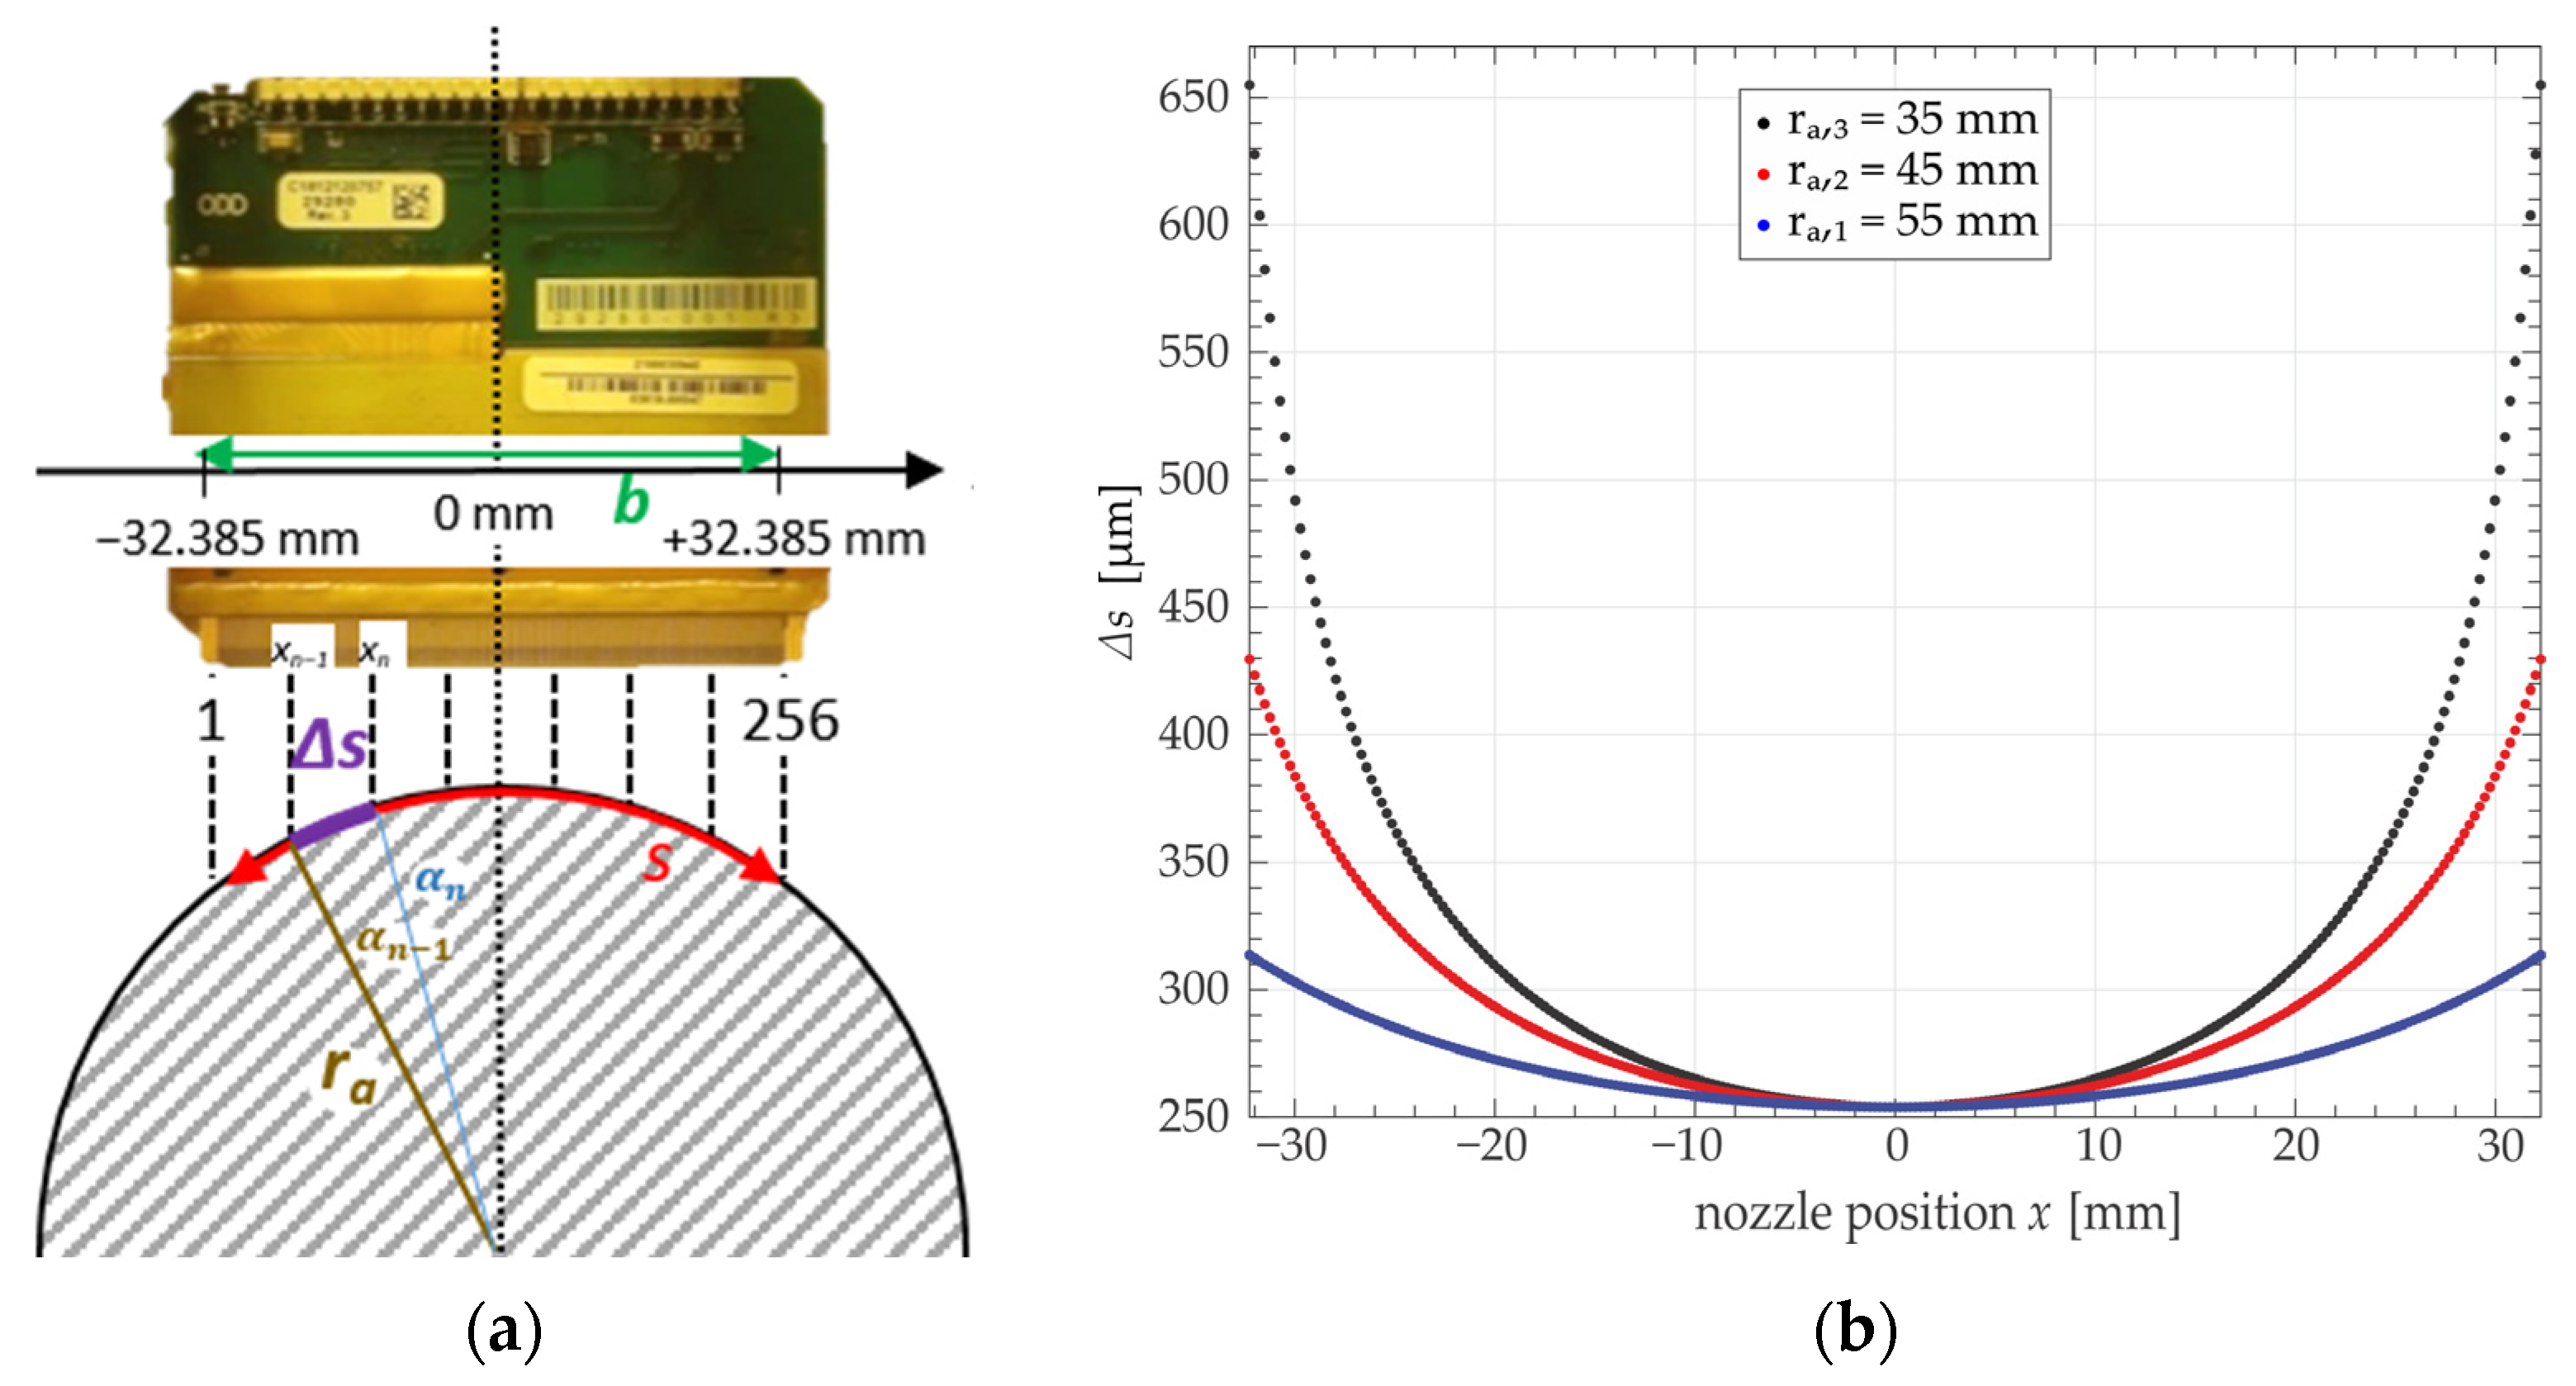
In relation to
, the overall length,
si, of the arc (see
Figure 4a) between the first (#1) and last dot (#256) on the cylinder surface is calculated using Equation (5).
The print width, b, for a Q-Class printhead, is 64.77 mm. According to Equation (5), the print image width is elongated to a total arc length of s1 = 69.26 mm ( = 55 mm), s2 = 75.48 mm ( = 45 mm), and s3 = 82.73 mm ( = 35 mm), respectively.
The distribution of a grid of dots resulting from the ideal projection on the cylinder surface should result in an equal distance between the subsequent dots in the print direction (at constant print speed and frequency) and an increase in distance,
Δsn,i, across the print direction. According to the position of a nozzle,
(2 <
n ≤ 256), with regard to the position of its next neighbor,
, the distance,
Δsn,i, is calculated as follows:
In relation to the radius, the length,
Δsn,i, will increase on the cylinder surface the further away the position,
and
, of the nozzles is located from the center point. The impact locations of two neighboring drops on the cylinder surface are correlated to the angles
(see
Figure 4a). The results of Equation (6) are shown in
Figure 4b. The minimum value is 254 µm, which is the distance of the nozzles, according to a print resolution of 100 dpi.
Summarized Model Equation
By combining Equations (1)–(6), the calculation of the model position,
and
, on the cylinder surface is summarized by Equations (7) and (8). In Equation (7), the lateral position,
, is dependent on the printhead nozzle position,
, and the cylinder radius,
. The y position,
(Equation (8)), equals the deviation,
Δy, from the ejection origin with respect to the print motion speed,
, and initial drop ejection speed,
. The coefficient
c represents the intercept of the linear equation for drop velocity development and can differ from the true ejection drop speed,
, at the nozzle surface when only the linear aspect of drop speed development is considered for the linear regression.
4.2.3. Determination of Displacement and Maximum Height
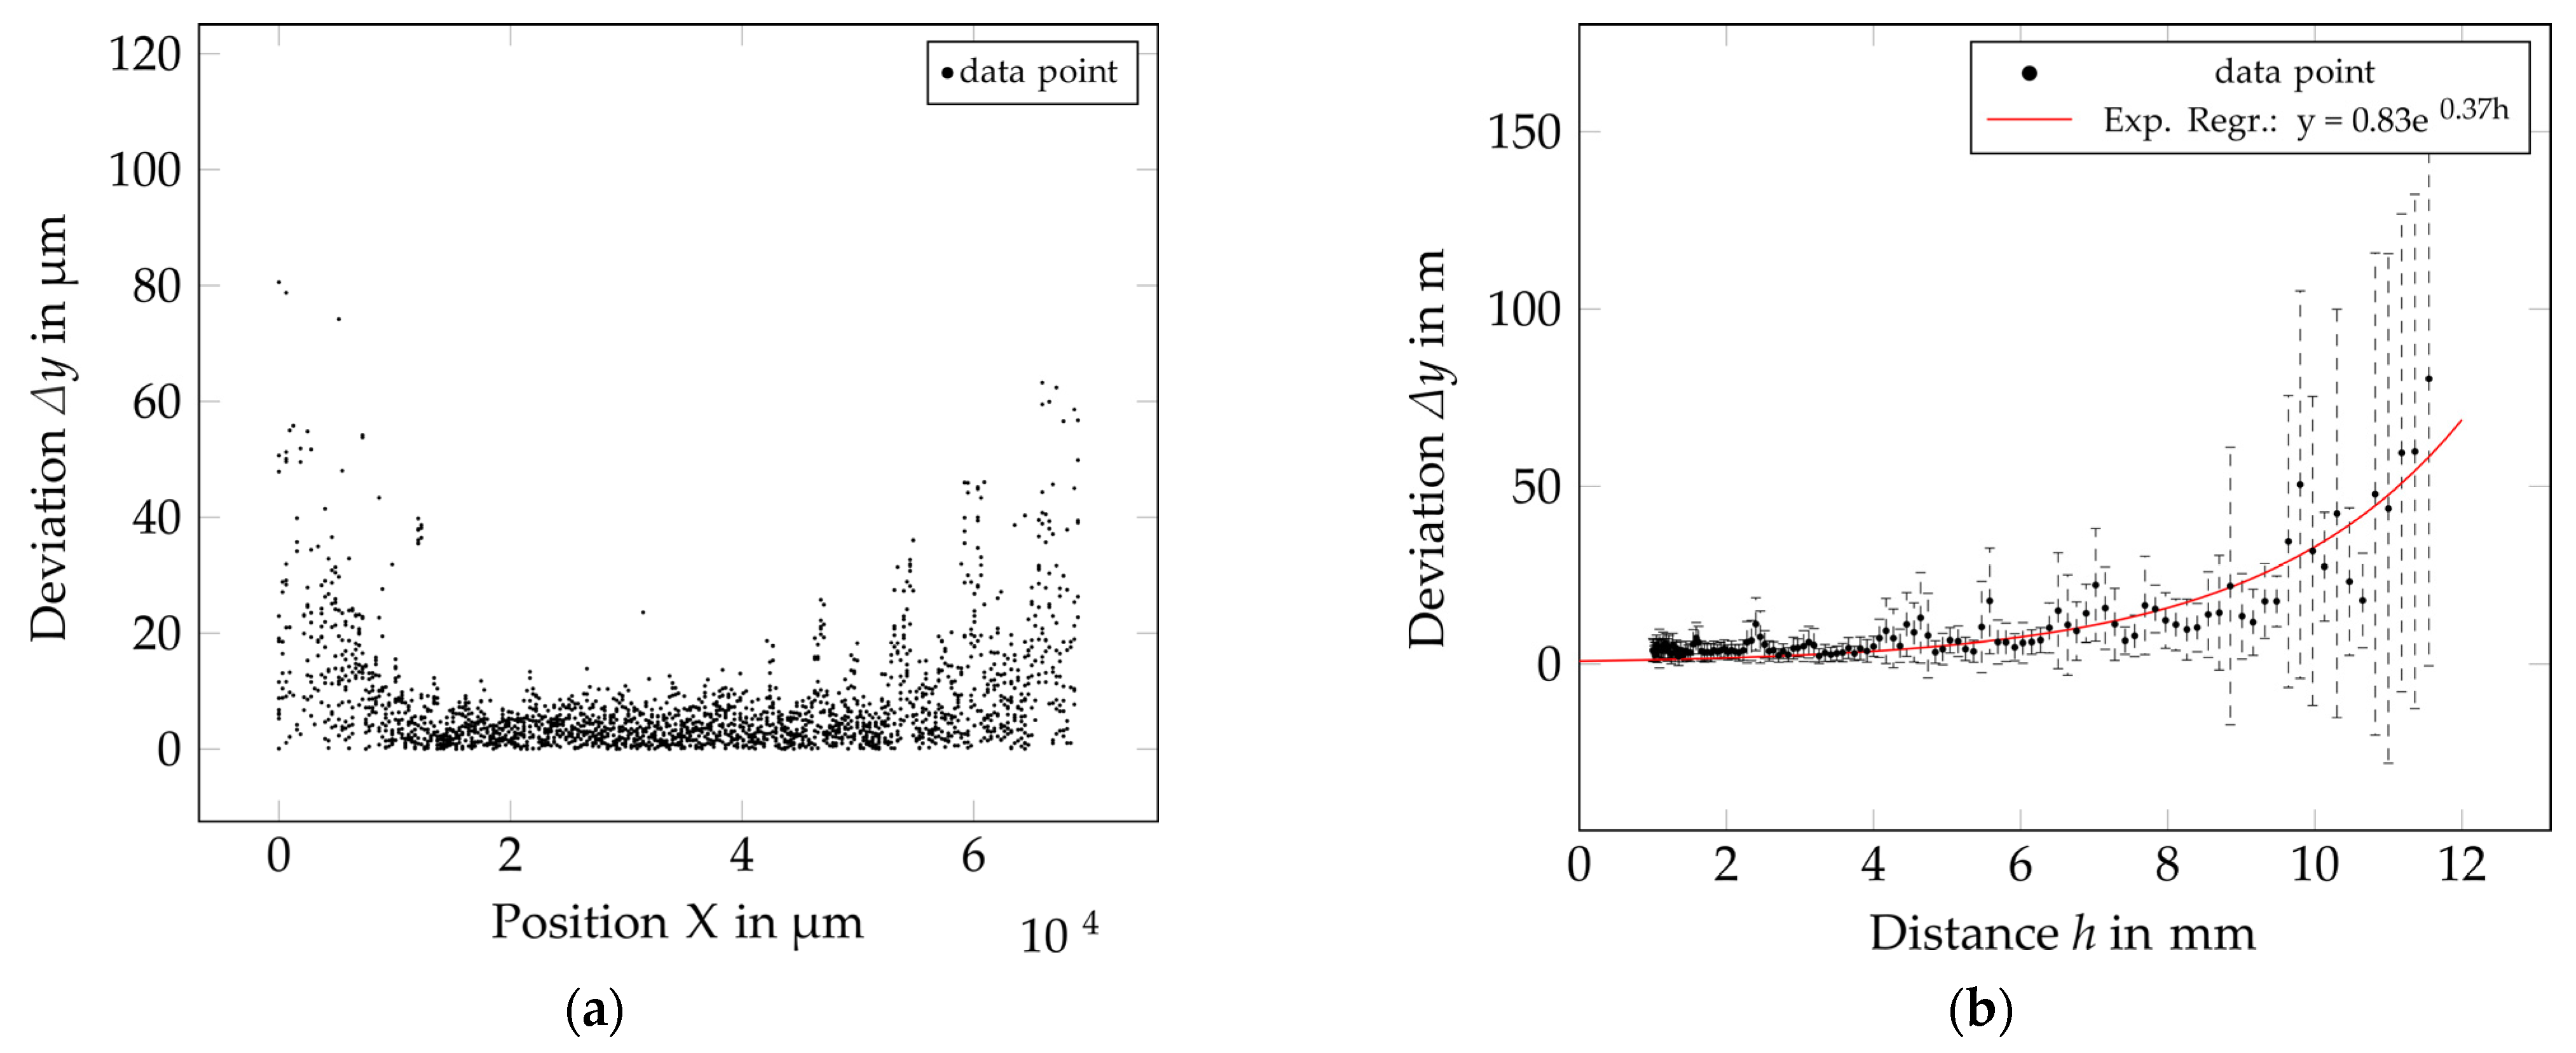
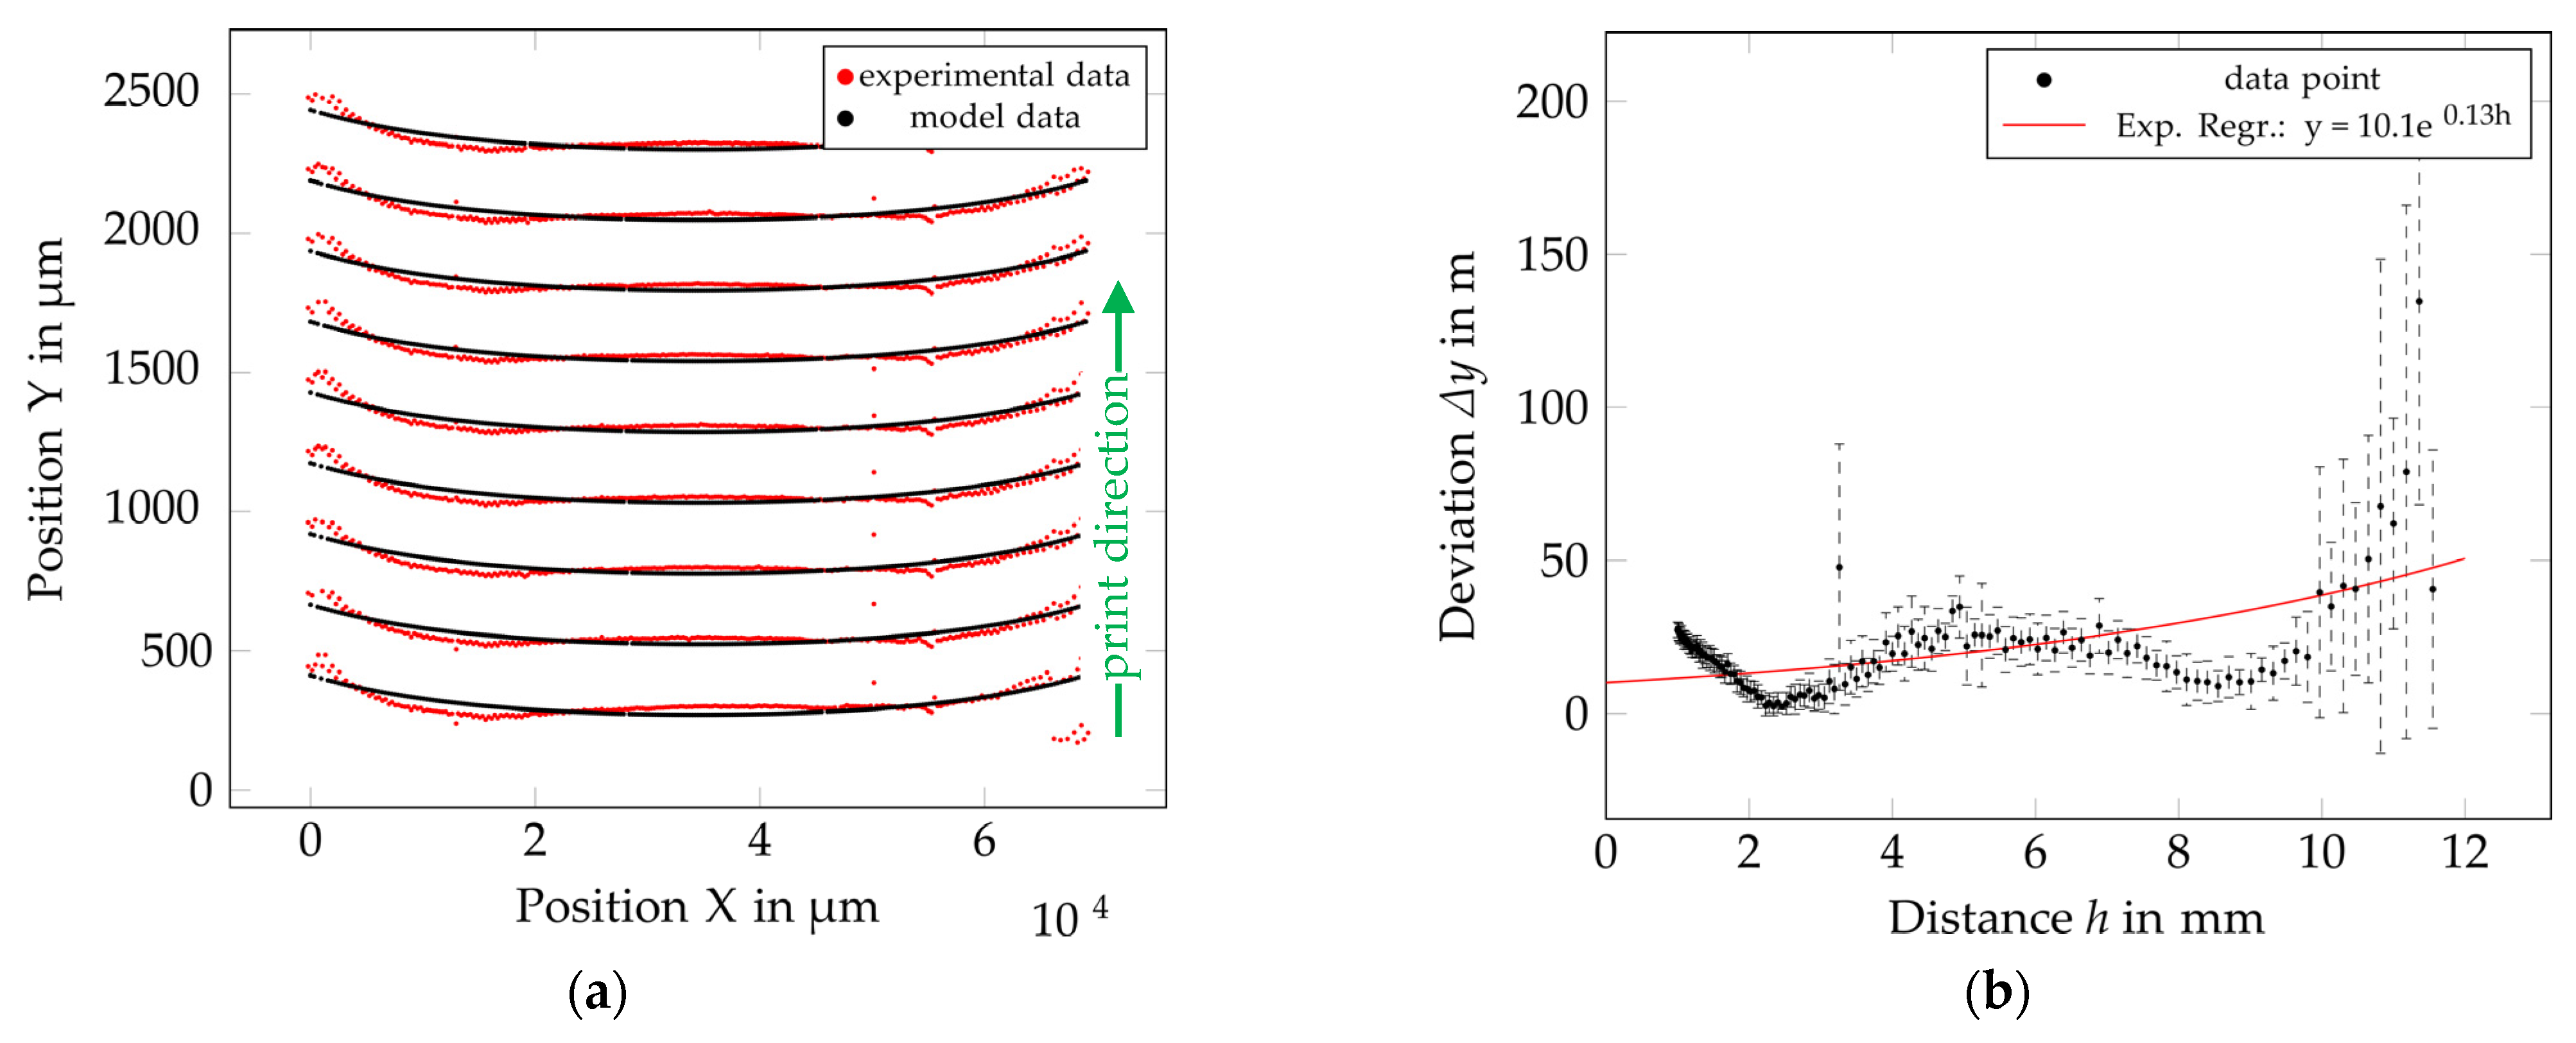
The printing results were analyzed through stitched microscopic images covering the full print area. Based on image processing using ImageJ, the
xd and
yd coordinates of single dots within the digital image were detected by a procedure. Firstly, threshold binarization was applied, following an analyzing step, to determine the center of mass (CM) of the individual drops. One image usually covers nine printed lines in the print direction and a maximum of 2304 dots. A Matlab program (see
supporting information matlab files) was developed to compare the experimental dataset with the model dataset, which was calculated based on empirical data from the drop watching experiments. Prior to further processing, an iterative, closest point (ICP) algorithm [
27] was applied to converge both datasets. Within the following step, the drop positions from the experimental dataset were compared to the positions calculated in the model dataset, according to the k-nearest neighbor algorithm, to determine a pair of associated dots. The position of each pair, along with information about the distance between the printhead and surface, was then used to calculate the displacement error in the print direction in relation to the travel distance. Furthermore, an exponential function was fitted to the averaged values of displacement in relation to height, according to the following equation:
The displacement,
Δy, is dependent on the distance,
hi, and the regression coefficients
a and
f. By rearranging Equation (9), the maximum distance can be calculated in relation to deviation
Δy using Equation (10).
6. Conclusions and Outlook
The investigations discussed in this paper represent fundamental experiments that can help to understand the achievable accuracy of robot-controlled inkjet printing onto 3D objects. By observing different positions from the nozzle plate, the development of the drop speed and the influence of the piezo voltage and drop volume were determined for a conductive silver and an insulating UV ink. The results of extensive printing experiments on cylinder targets showed that the deviation of droplets from their ideal position (according to the model) is highly dependent on the distance between the nozzle and the surface. Furthermore, the tuning of printing parameters (piezo voltage) allows for an increase in the throw distance and achievable accuracy. For the different parameter sets, a method was described to calculate either the resulting placement deviation in relation to the distance or vice versa, allowing us to calculate the distance limits.
The comprehensive investigations showed that the prediction of droplet positions regarding cylinder geometries is difficult. The unexpected appearance of printed vertical lines for a number of parameter sets was observed. For slow (<16 m/s) and big drops (30 pL and 80 pL), the resulting line shape especially differed from the modeled lines. Within the investigated parameters, the silver ink printed with a 10 pL printhead (nom. drop volume) achieved the best match to the model and also showed the highest drop speed.
While a robot-guided inkjet printing process is able to perform printing in all room directions, future research should address the influence of the spatial orientation of the printhead on drop trajectory and placement accuracy. For this case, the proposed method can be used by simply rotating the cylinder to another orientation to realize sideways or bottom-up shooting. In addition, the effect of geometric distortion and position accuracy on layer formation in coherent functional layers is of great importance and should also be investigated.
This research is a contribution toward the improvement of the robot-guided inkjet printing approach in terms of productivity and the efficient determination of drop placement accuracy. The benefit of a cylinder setup is a line of nozzles ejecting drops under the same working condition while allowing for different distances to the print surface. With this setup, the placement accuracy of one parameter set in relation to the jetting distance can be investigated with one single print run. In combination with automated image acquisition and processing, the proposed method can dramatically decrease the effort needed to determine the drop placement error of different sets of print settings (printhead, drop volume, ink, driving voltage, and movement speed). The implementation of the information regarding deviations in jetting distance in relation to surface curvature for image preparation allows the user to compensate for image distortion and improve print and functional layer quality.


