Article

Verification of a Body Freedom Flutter Numerical Simulation Method Based on Main Influence Parameters

China Aerodynamics Research and Development Center, Mianyang 621000, China
*
Author to whom correspondence should be addressed.
Machines 2021, 9(10), 243; https://doi.org/10.3390/machines9100243
Submission received: 1 August 2021 / Revised: 1 October 2021 / Accepted: 9 October 2021 / Published: 18 October 2021
(This article belongs to the Special Issue Dynamic Stability Analysis of Aerospace Structures)

Abstract

:
The body freedom flutter characteristics of an airfoil and a fly wing aircraft model were calculated based on a CFD method for the Navier–Stokes equations. Firstly, a rigid elastic coupling dynamic model of a two-dimensional airfoil with a free–free boundary condition was derived in an inertial frame and decoupled by rigid body mode and elastic mode. In the fluid–solid coupling method, the rigid body was trimmed by subtracting the generalized steady aerodynamic force from the structural dynamic equation. The flutter characteristics were predicted by the variable stiffness method at a fixed Mach number and flight altitude. Finally, validation of the predicted body freedom flutter characteristics was performed through a comparison of theoretical solutions based on a Theodorsen unsteady aerodynamic model for airfoil and experimental results for a fly wing aircraft model. The mechanism of the influence of the bending mode stiffness and the position of the center of gravity on the body freedom flutter characteristics were briefly analyzed.

1. Introduction

Flying wing aircraft have inherent advantages in terms of the aerodynamic lift–drag ratio, stealth performance and structural efficiency, and have gradually become the preferred configuration for high-altitude long endurance UAVs [1]. However, an unconventional flutter phenomenon has become a killer limiting the envelope of most large-aspect ratio flexible flying wing aircraft, which is called body freedom flutter. Body freedom flutter is a dynamic instability phenomenon caused by the coupling of rigid body motion and elastic deformation. The critical flutter velocity is about half of the traditional bending and torsional coupling flutter velocity [2,3]. Therefore, the problem of body freedom flutter seriously threatens the flight safety and limits the aircraft’s performance.
Body freedom flutter has attracted considerable attention [4,5]. In 2005, a Lockheed Martin team used Nastran and the flight dynamics/aeroelastic coupling analysis program ASWings to carry out a body freedom flutter analysis for the high aspect ratio SC005 wing proposed for the SensorCraft project [6]. They also carried out a body freedom flutter wind tunnel experiment for a half-mode flying wing model. Later, Lockheed Martin also carried out a BFF flight verification experiment and a BFF suppression experiment on the X-56A platform [7,8,9,10,11]. Using the Nonlinear Aeroelastic Trim and Stability of HALE Aircraft (NATASHA), Richards and Mardanpour studied the effects of propeller position, structural inertia and stiffness parameters on the body freedom flutter of a flying wing [12,13]. The University of Minnesota has launched the Performance Adaptive Aeroelastic Wing (PAAW) project. The flutter analysis, flight experiments and flutter suppression experiments of mAEWing1 were carried out using the Nastran aeroelastic module [14]. Huang and Yang have used the commercial software ZAERO to carry out a body freedom flutter analysis of a semi-modal flying wing under symmetrical constraints, and also carried out wind tunnel validation experiments [15,16]. Gu et al. compared the results of Nastran and ZAERO commercial software, and studied the effects of loop gain value and the center of gravity on body freedom flutter characteristics [17,18].
At present, commercial software such as Nastran and ZAERO are often used in body freedom flutter analyses and studies of the influence of parameters. Aerodynamic models are mostly lifting surface models or strip theory models based on binary unsteady aerodynamic forces, which are still insufficient for high-precision simulation of subsonic and complex shapes. In this study, a body freedom flutter simulation was carried out based on a CFD method using the Navier–Stokes equations. For the stability problem, a rigid-elastic coupling dynamics model was established in the inertial system under the linear small disturbance hypothesis [19,20]. The calculation results were compared with a theoretical solution based on the Theodorsen unsteady aerodynamic model and experimental results.

2. The Rigid–Elastic Coupled Dynamic Modeling Method: Taking a Two-Dimensional Airfoil as an Example

Body freedom flutter is usually for the whole aircraft, but a two-dimensional airfoil model that can obtain analytical solutions is helpful for illustrating the rigid–elastic coupling modeling method and verifying the reliability of a numerical simulation program of the body freedom flutter.
The two-dimensional airfoil rigid–elastic coupling dynamic model established in this research considers four degrees of freedom (DOF): pitch, plunge, bending and torsion, as shown in Figure 1. The reference points of the generalized coordinates of the four-DOF system are established at the connection of the elastic axis [21,22]. In the inertial system [23,24], H is the plunge displacement of the rigid body, where downward displacement is positive. θ is the pitch displacement of the rigid body, where the nose-up attitude is positive. h is the bending displacement relative to the fuselage, where downward displacement is positive. α is the torsional displacement relative to the fuselage, where the nose-up attitude is positive. Xθ is the distance from the fuselage centroid to the elastic axis, and the centroid in front is positive; is the distance from the wing centroid to the rigid axis, and the centroid in front is positive. Note that the mass of the fuselage and wing are M and m, respectively. The pitching moment of the inertia of the fuselage wing are Iθ and Iα. Kh and Kα are the bending stiffness and torsional stiffness of fuselage wing connection, respectively.
The dynamic model considers the trim state and ignores the influence of gravity. It is assumed that the aerodynamic force only come from the wing. The fuselage is simulated as a particle, which only acts as inertia and has no effect on aerodynamic force. The rigid rod (without mass) drawn in the figure is to represent the connection mode of the fuselage wing and the modal vibration mode of the fuselage. The dynamic equations are established by the Lagrange equation under the inertial system [25,26,27].
d d t ( T q ˙ i ) T q i U q i = Q i ( i = 1 , 2 , 3 , , n )  
The kinetic energy of the system is:
T = 1 2 M ( H ˙ 2 + 2 X θ H ˙ θ ˙ + X θ 2 θ ˙ 2 + R θ 2 θ ˙ 2 ) + 1 2 m ( h ˙ 2 + 2 X α h ˙ α ˙ + X α 2 α ˙ 2 + R α 2 α ˙ 2 )
Considering the trim state, the lift and gravity are balanced, and the influence of the gravitational potential energy is ignored. The potential energy of the system is the elastic potential energy only:
U = 1 2 K h ( h H ) 2 + 1 2 K α ( α θ ) 2
[ M M X θ 0 0 M X θ I θ 0 0 0 0 m m X α 0 0 m X α I α ] [ H ¨ θ ¨ h ¨ α ¨ ] + [ K h 0 K h 0 0 K α 0 K α K h 0 K h 0 0 K α 0 K α ] [ H θ h α ] = [ 0 0 F l i f t M c e ]
where I θ = M ( R θ 2 + X θ 2 ) , I α = m ( R α 2 + X α 2 )
The Equation (4) is a linear equation, and the structural dynamic equation can be solved by the modal decoupling method. Because of the existence of two rigid-body degrees of freedom, the eigenvalue equation has two overlapping zero-frequency solutions. The rigid body model can be treated according to the reference [28]. The elastic modes are still processed according to the conventional structural dynamics method, and the mode shape vectors of the whole structural system are finally obtained. The obtained mode shape vectors convert the generalized displacement ξ = [ H θ h α ] T into a modal coordinate: ξ = Φ q , where Φ represents the modal shapes of the rigid–elastic coupling dynamic model described in the structural models and q is the generalized displacement vector. We bring them into (4) to obtain:
[ M r i g 0 0 M f l e x ] [ q ¨ r i g q ¨ f l e x ] + [ 0 0 0 M f l e x ω f l e x 2 ] [ q r i g q f l e x ] = Φ T [ 0 Q ]  
It can be seen that the rigid body motion part and the elastic motion part of the whole dynamic equation are decoupled.

3. CFD and Fluid–Solid Coupling Calculation Method

When solving turbulent flow problems in computational fluid dynamics, unsteady N-S equations are usually homogenized to obtain time-averaged N-S equations as the basic governing equations. In this study, the three-dimensional conservation-type compressible RANS equations based on time-average processing were used as the basic governing equations for flow field calculation. Neglecting the bulk force and the external heat source, the unsteady N-S equation in the general curvilinear coordinate system is:
V Q ¯ t + E ¯ ξ + F ¯ η + G ¯ ζ = n v R e ( E v ¯ ξ + F v ¯ η + G v ¯ ζ )  
where V is the Jacobian reciprocal; n v is the viscosity switch parameter (when n v = 0, Equation (6) is a Euler equation, and when n v = 1, Equation (6) is an N-S equation); Q ¯ is a conservation variable; E ¯ , F ¯ and G ¯ are inviscid convection fluxes; and E v ¯ , F v ¯ and G v ¯ are viscous diffusion fluxes. The Spalart–Allmaras turbulence model was chosen. The mesh deformation is calculated by using RBF combined with the TFI method [29,30].
The wing surface pressure distribution is solved by the N-S equation, and the structural dynamics equation is obtained:
[ M r i g 0 0 M f l e x ] [ q ¨ r i g q ¨ f l e x ] + [ 0 0 0 M f l e x ω f l e x 2 ] [ q r i g q f l e x ] = q   [ Θ i T ] [ 0 c p ( x , y ) ] d x d y  
where Θ represents the mode shapes of the rigid–elastic coupling dynamic model represented by the aerodynamic grid coordinate point. Θ is obtained by modal interpolation according to the mode shape under the modal coordinates. For the model in this study, the conversion relationship between the modal coordinates and aerodynamic grid coordinates is:
Θ i T = [ Φ i , 1 Φ i , 2 ( x c e x ) Φ i , 3 Φ i , 4 ( x c e x ) ]   i = 1 , 2 , 3 , 4  
where i is the modal order, x is the aerodynamic grid points’ x-coordinate position, x c e is the position of the x-coordinate of the elastic axis in the aerodynamic grid point and Φ represents the modal shapes described in Section 2. The rigid–elastic coupling model is added to the fluid–structure coupling model by Equation (8). Letting [ M r i g 0 0 M f l e x ] = M *   [ 0 0 0 M f l e x ω f l e x 2 ] = K * , and writing Equation (7) as a state space form, we obtain:
[ q ¨ q ˙ ] = [ M * 0 0 I ] 1 [ 0 K * I 0 ] [ q ˙ q ] + [ M * 0 0 I ] 1 [ Φ T Q 0 ]  
The second-order predictor-corrector method is used to solve the difference equation, and the tightly coupled iterative calculation of rigid body dynamics and structural dynamics equations is realized.
By letting [ M * 0 0 I ] 1 [ 0 K * I 0 ] [ q ˙ q ] + [ M * 0 0 I ] 1 [ Φ T Q 0 ] = f ( x ) and [ q ˙ q ] = x , the prediction and correction formats can be described as follows:
x ˜ n + 1 = x n + Δ t [ 3 2 f ( x n ) 1 2 f ( x n 1 ) ] x n + 1 = x n + Δ t [ 3 2 f ( x ˜ n + 1 ) + 1 2 f ( x n ) ]

4. CFD and Fluid–Solid Coupling Calculation Method

4.1. Results and Discussion of the Two-Dimensional Model

4.1.1. Model Parameters

The physical model parameters selected for computation are shown in Table 1.

4.1.2. Numerical Solution by the CFD Method

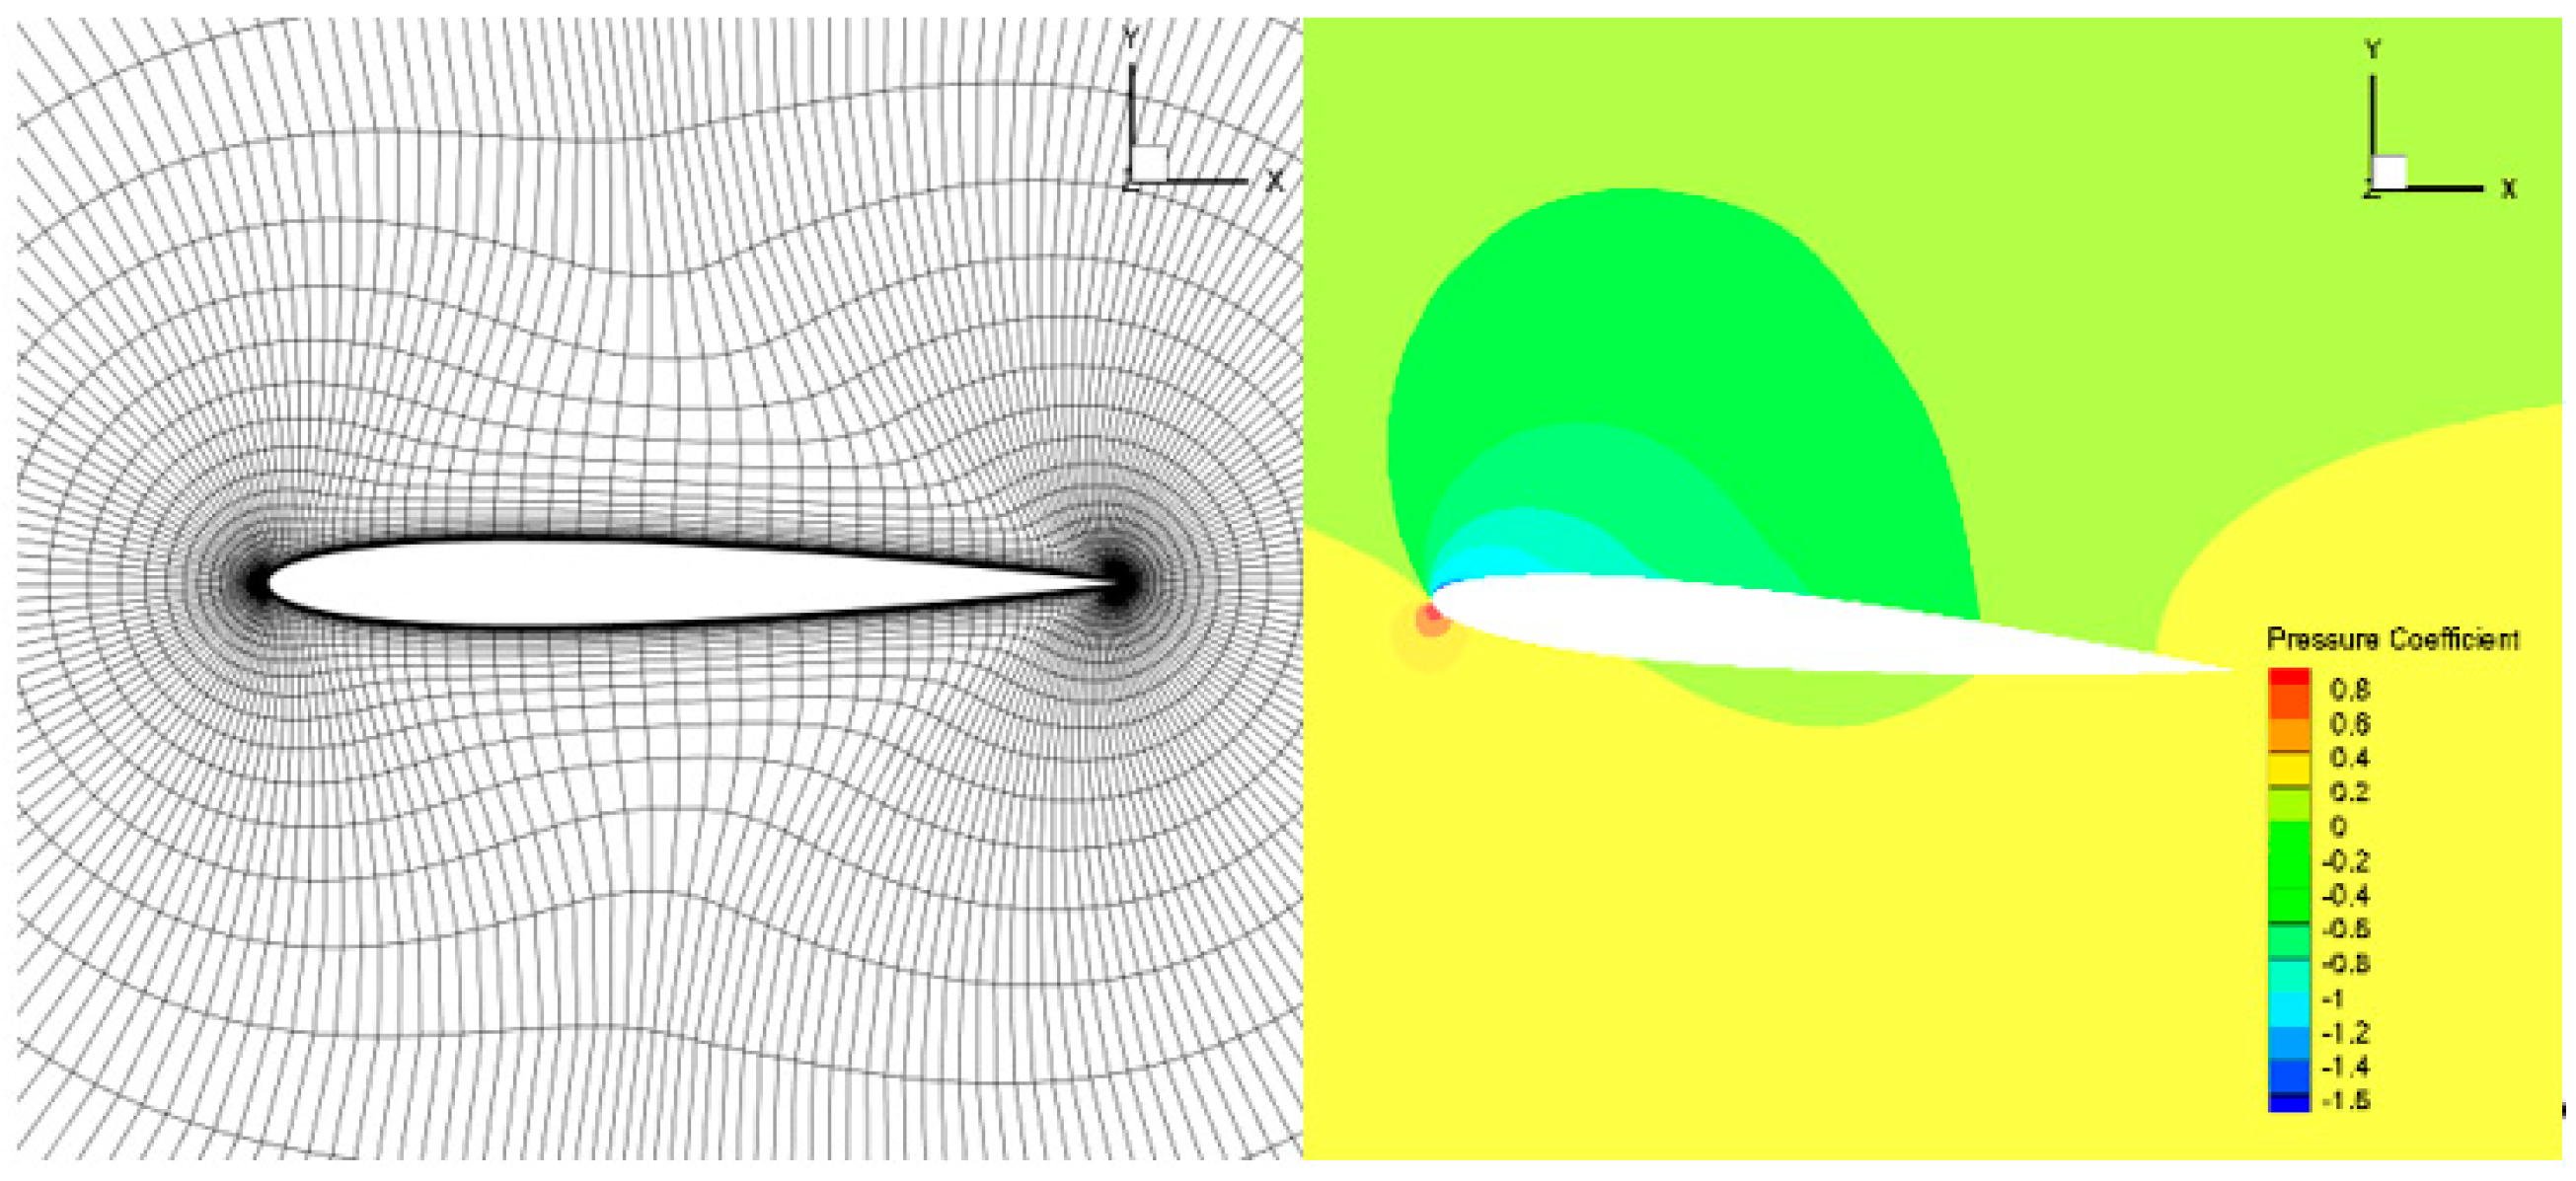
The computational grid of CFD is shown in Figure 2. The NACA0010 airfoil was chosen, and the 211 × 49 (flow direction × normal direction) O-grid was used. Let Y+ ≈ 1 and the calculated height of the first layer of the grid Ymin ≈ 0.00001. The inflow static temperature was 300 K, the density was 1.225 kg/m3, the angle of attack was 0° and Δt = 0.001 s. The Mach number and Reynolds number were obtained according to different incoming flow velocity.
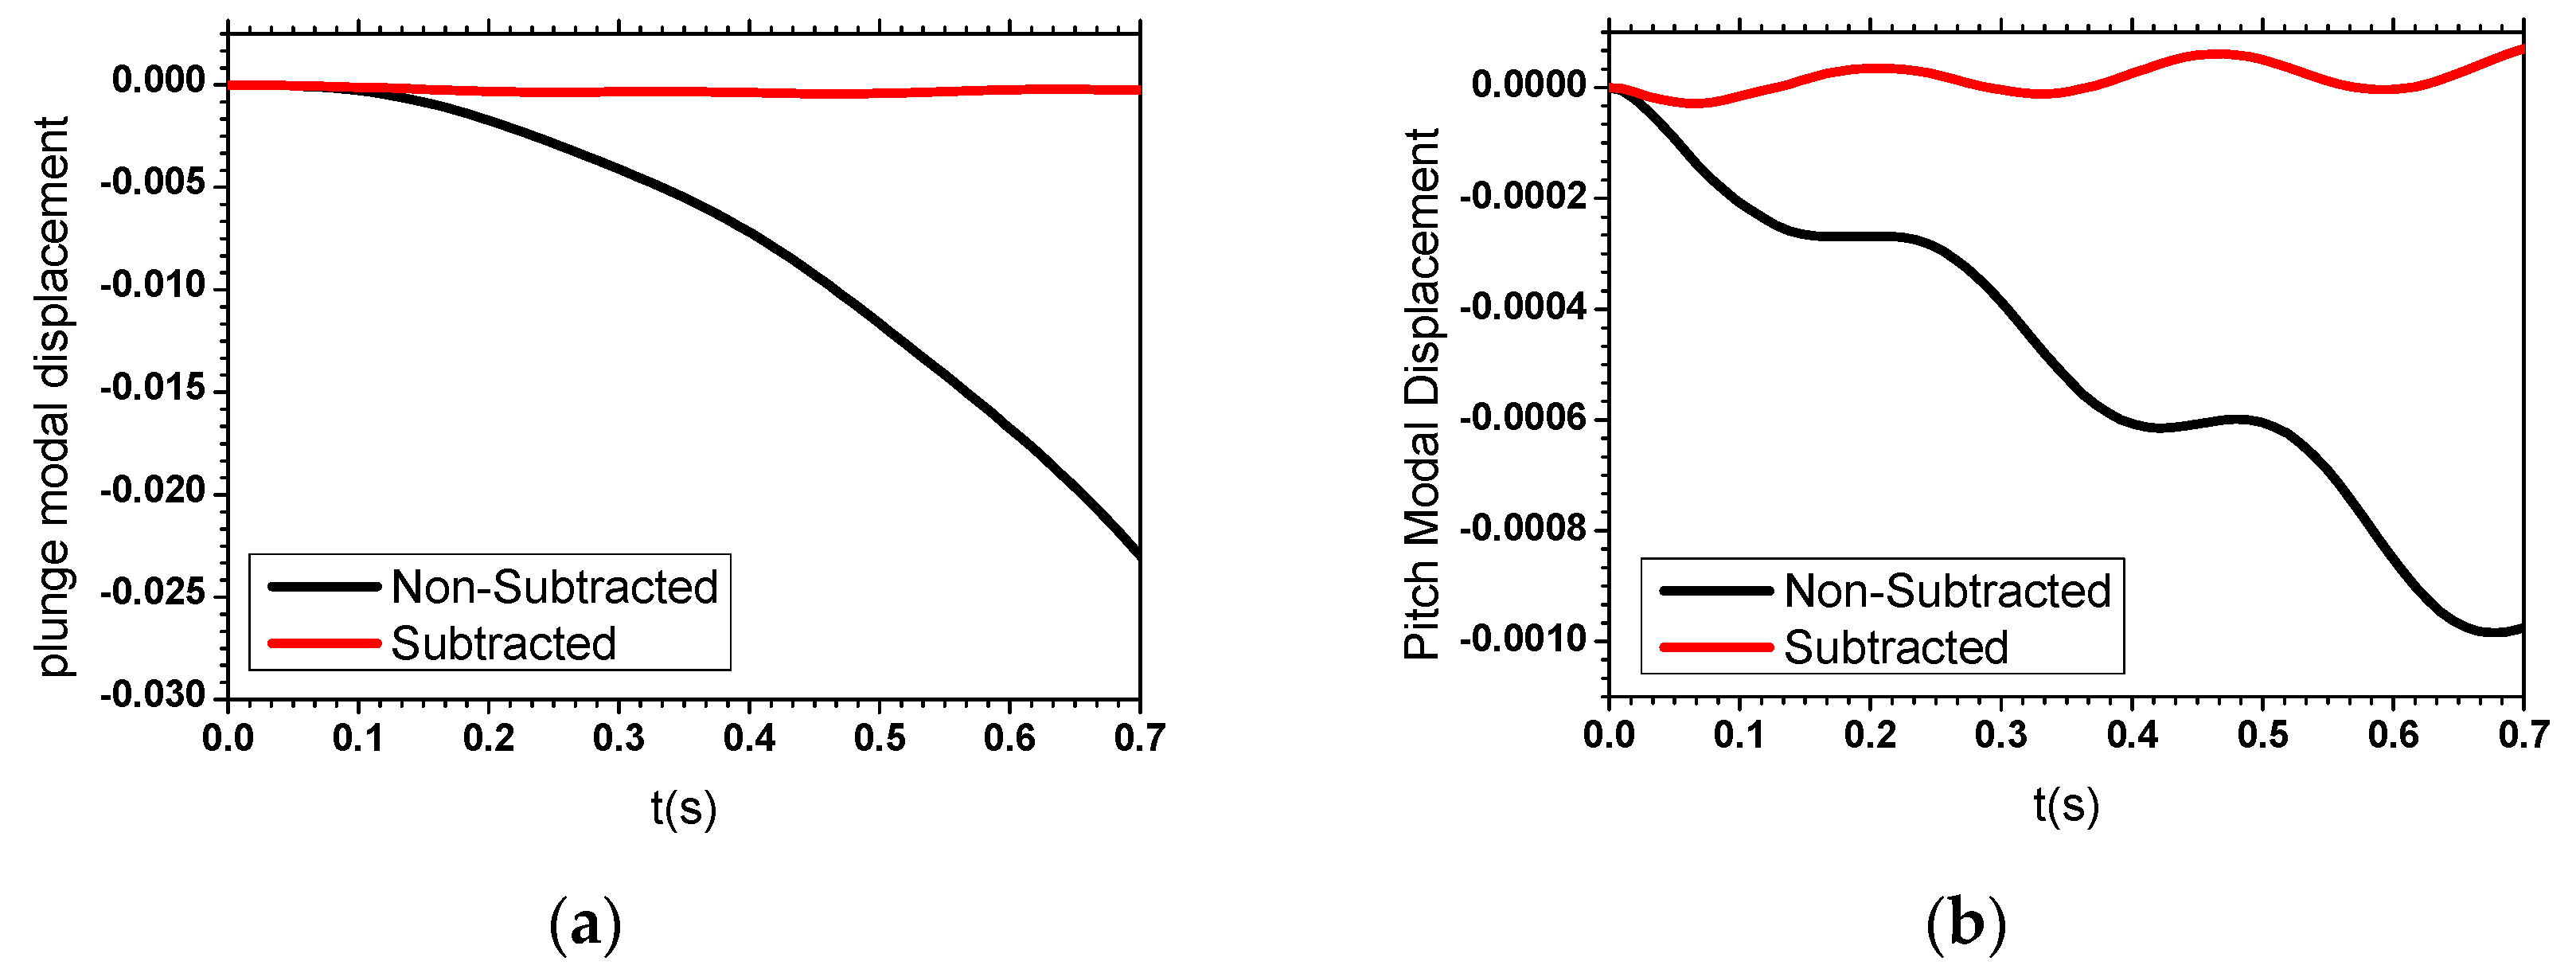
Because the model had two rigid-body degrees of freedom, the rigid-body attitude could not be trimmed by the angle of attack only. Thus, the steady generalized aerodynamic force was subtracted from the computation to trim the model. Figure 3 shows the rigid body’s modal response with the steady generalized force subtracted or not subtracted from the computations. It can be seen that the rigid body’s attitude was basically stable after subtracting the steady generalized aerodynamic force.
The attenuation coefficient η of the response (defined in Equation (11)) was calculated from the response curve of the bending mode, and the stability of the system was judged. The flutter frequency and velocity were obtained by interpolating the attenuation coefficient. Figure 4 shows the displacement response curves of the bending modes under two typical bending stiffnesses.
η = ln ( X i / X i + 1 ) / T ξ = η η 2 + 4 π 2

4.1.3. Theoretical Solution by the Theodorsen Unsteady Aerodynamic Model

As an alternative, the Theodorsen unsteady aerodynamic model was also used to determine flutter in order to verify the CFD results. The Theodorsen unsteady aerodynamic model is:
Q h = L = π ρ b 2 ω 2 { L h h + [ L α ( b 2 + X α ) L h ] α } Q α = M e = π ρ b 2 ω 2 { [ M h b ( b 2 + X α ) L h ] h + [ M α b 2 b ( b 2 + X α ) ( L α + M h ) + ( b 2 + X α ) 2 L h ] α }
L h = 1 i 2 k [ F ( k ) + i G ( k ) ] L α = 1 2 i 1 k { 1 + 2 [ F ( k ) + i G ( k ) ] } 2 k 2 [ F ( k ) + i G ( k ) ] M h = 1 2 M α = 3 8 i 1 k k = b ω V
After incorporating it into Equation (4), we have:
[ ω 2 M f + K h ω 2 M X θ K h 0 ω 2 M X θ ω 2 I θ + K α 0 K α K h 0 ω 2 m + K h π ρ b 2 ω 2 L h ω 2 m X α π ρ b 2 ω 2 [ L α ( b 2 + X α ) L h ] 0 K α ω 2 m X α π ρ b 2 ω 2 [ M h b ( b 2 + X α ) L h ] ω 2 I α + K α π ρ b 2 ω 2 [ M α b 2 b ( b 2 + X α ) ( L α + M h ) + ( b 2 + X α ) 2 L h ] ] [ H 0 θ 0 h 0 α 0 ] = [ 0 0 0 0 ]  
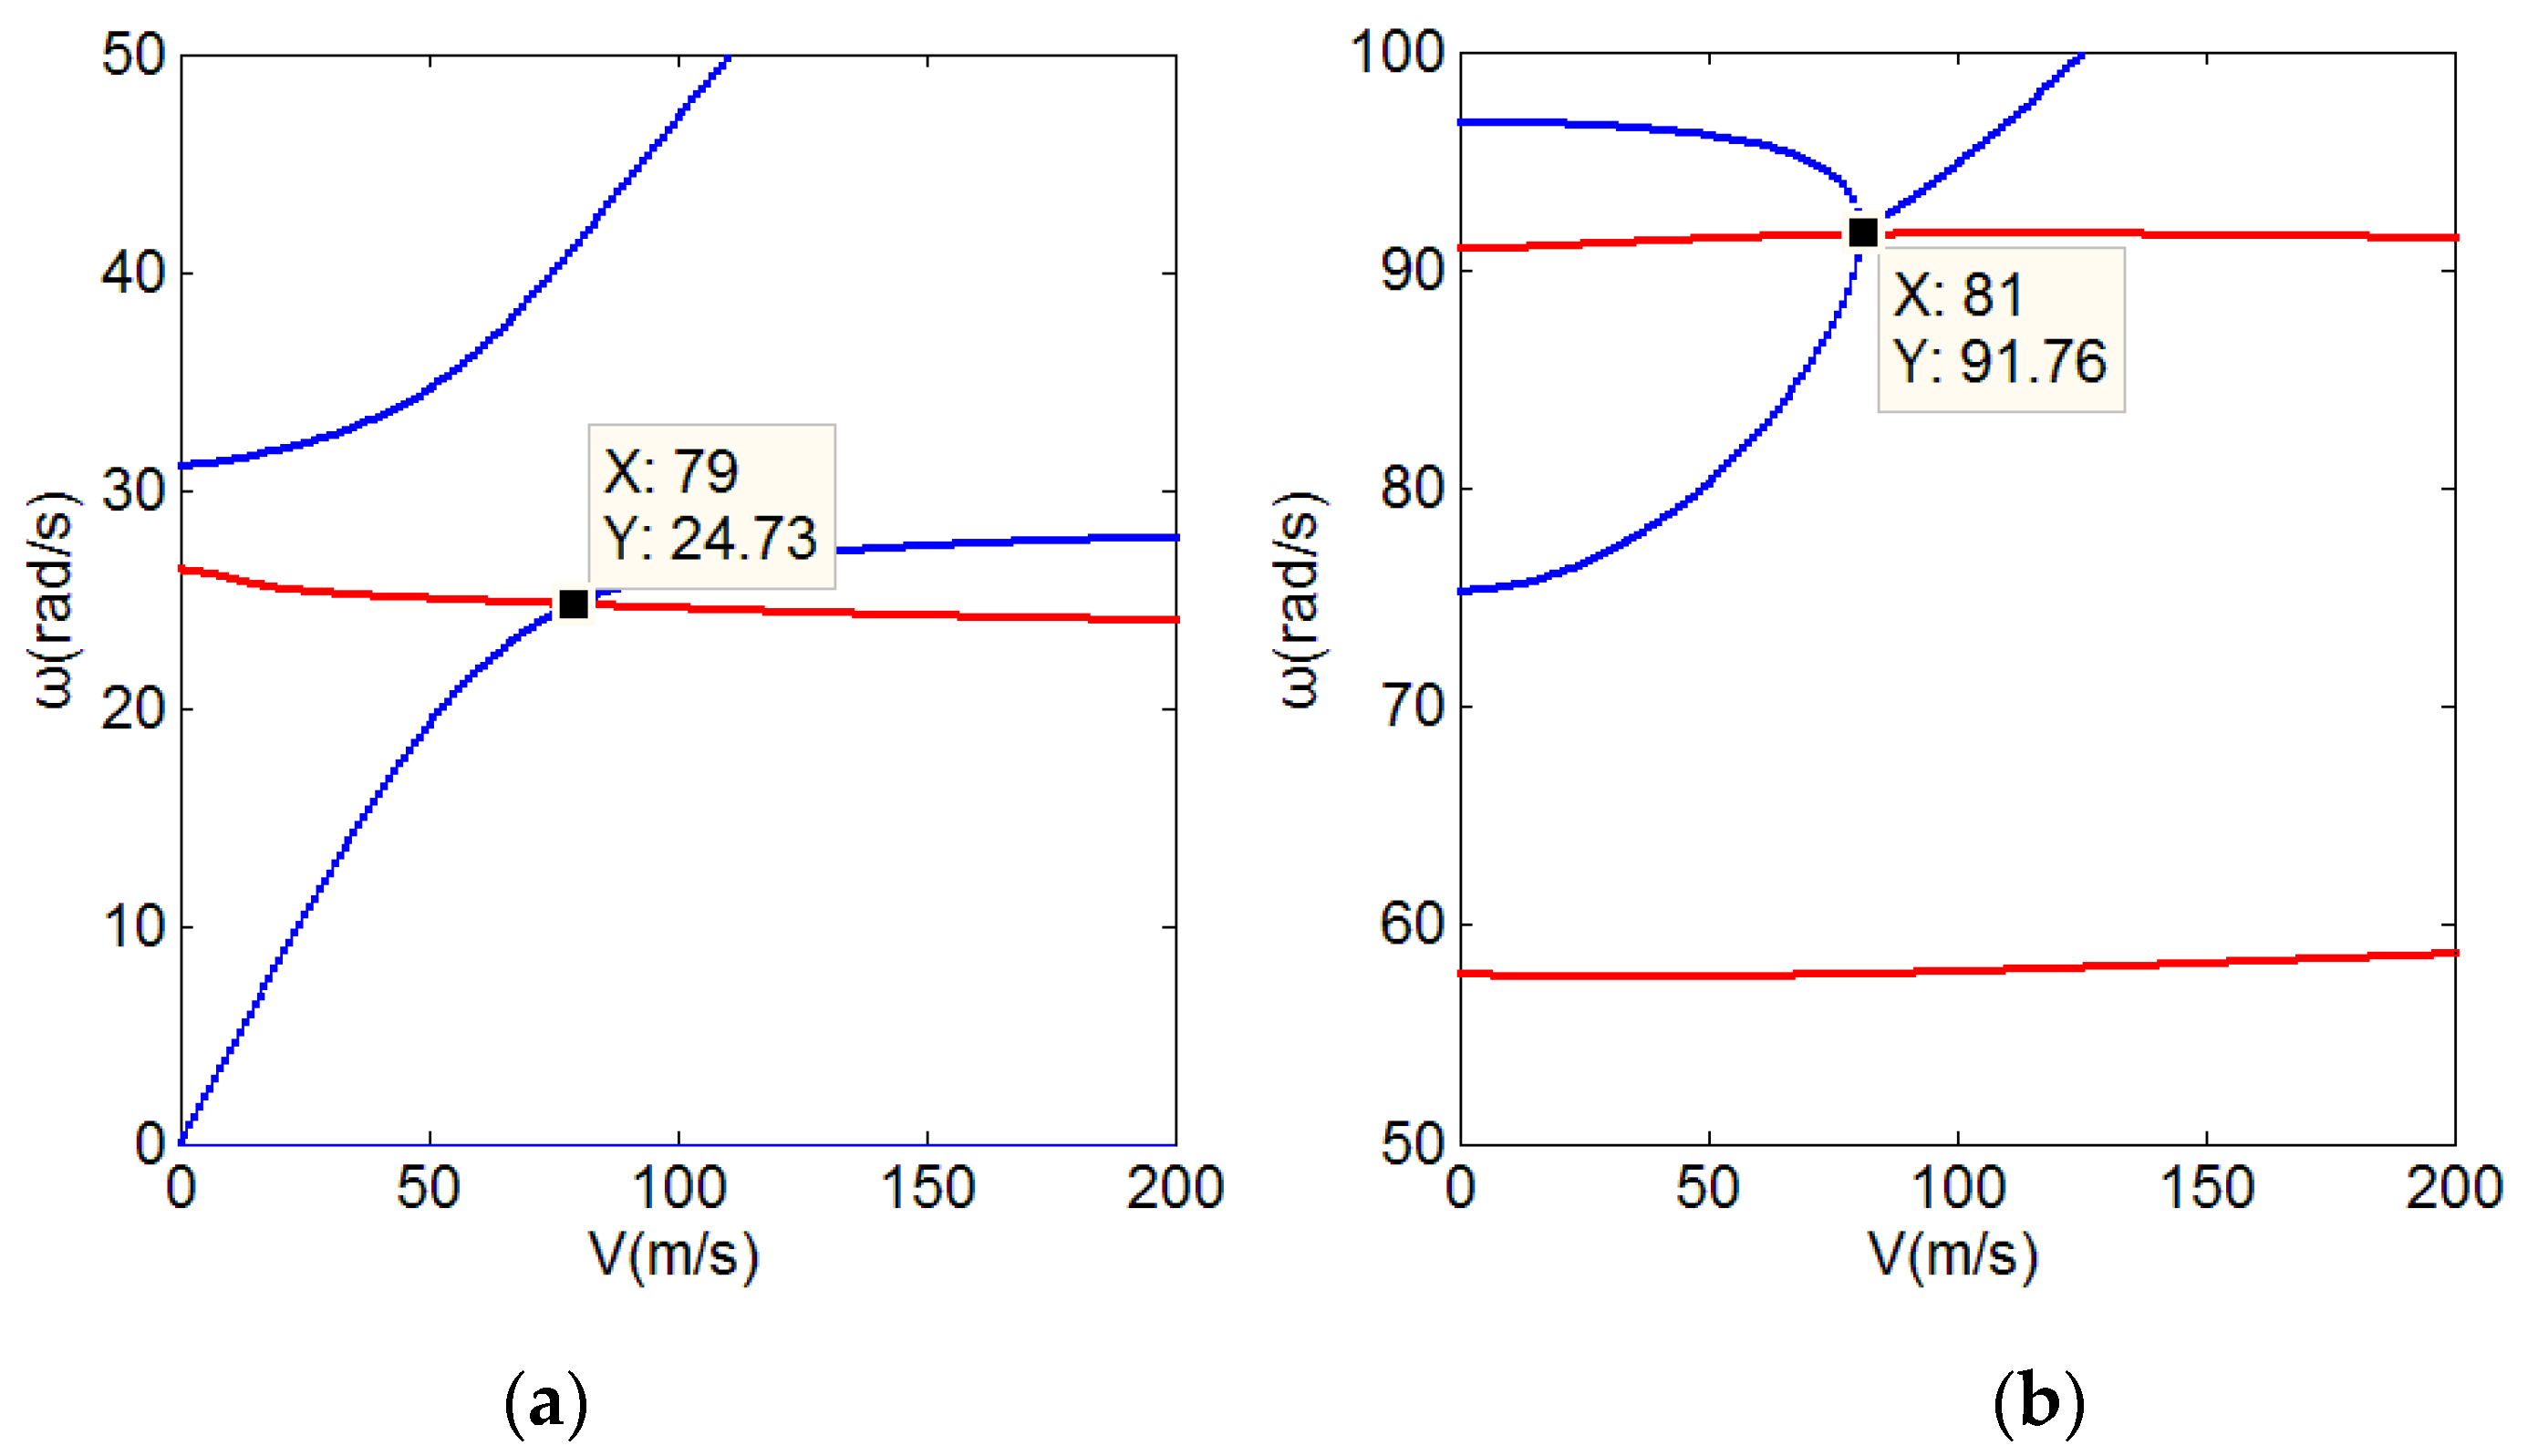
The results of the flutter determinant calculation are shown in Figure 5. The blue line is the real part of the solution curve of the flutter determinant and the red line is the imaginary part of the solution curve. The minimum value of the intersection points of the two groups of curves is the flutter point. When Kh = 2 N/mm (shown in the left-hand figure), the flutter point was 79 m/s and the flutter circle frequency was 24.73 rad/s, i.e., 3.94 Hz. In this case, body freedom flutter occurred. In the right-hand figure, the results are shown for a higher bending stiffness. In this case, the bending mode frequency was relatively high and bending torsional flutter occurred through with the torsional mode coupling with the bending mode. The flutter velocity was 81 m/s and the flutter circle frequency was 91.76 rad/s, i.e., 14.6 Hz.

4.1.4. Discussion and Validation of the BFF Calculation Method Using a Navier–Stokes Fluid Model

Validation of the BFF calculation method using a Navier–Stokes fluid model and the BFF characteristics with bending stiffness are discussion in this section. Because of the incompressibility of the Theodorsen unsteady aerodynamic model, the aerodynamic model could be modified by compressibility to make sure the two aerodynamic models were consistent. The comparison results can verify the correctness of the structural modeling and the fluid structure coupling method used in this study.
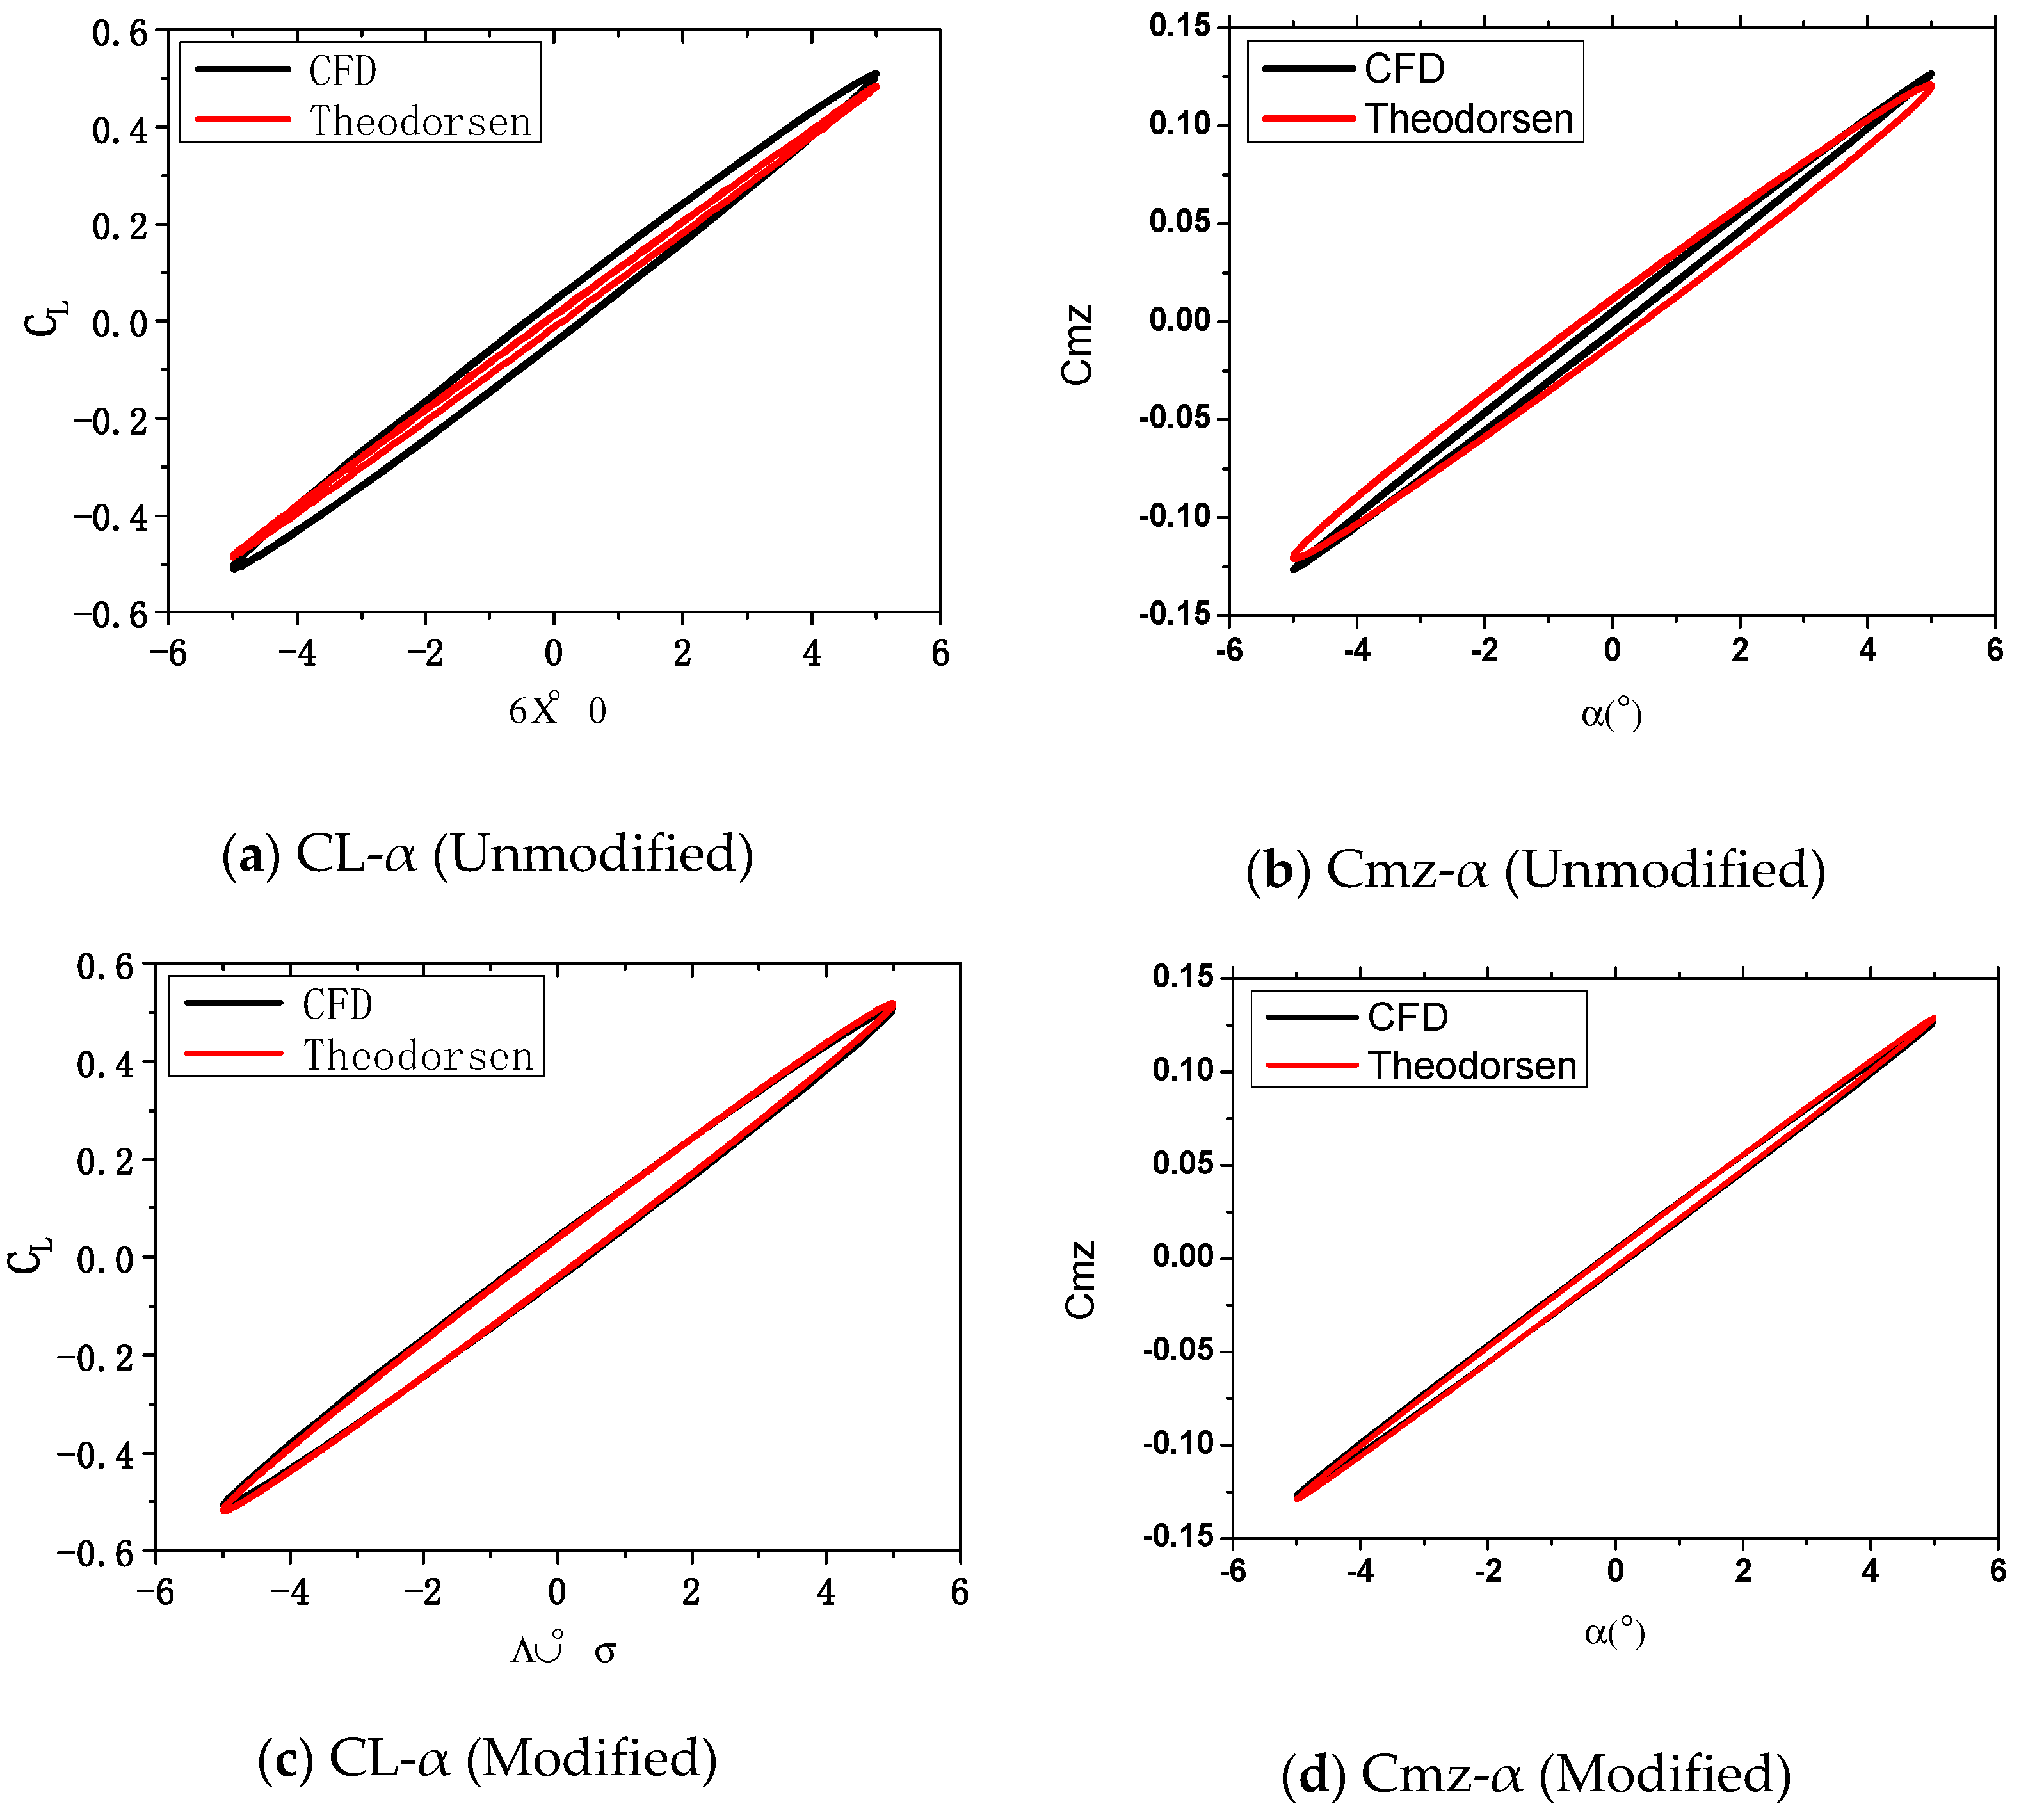
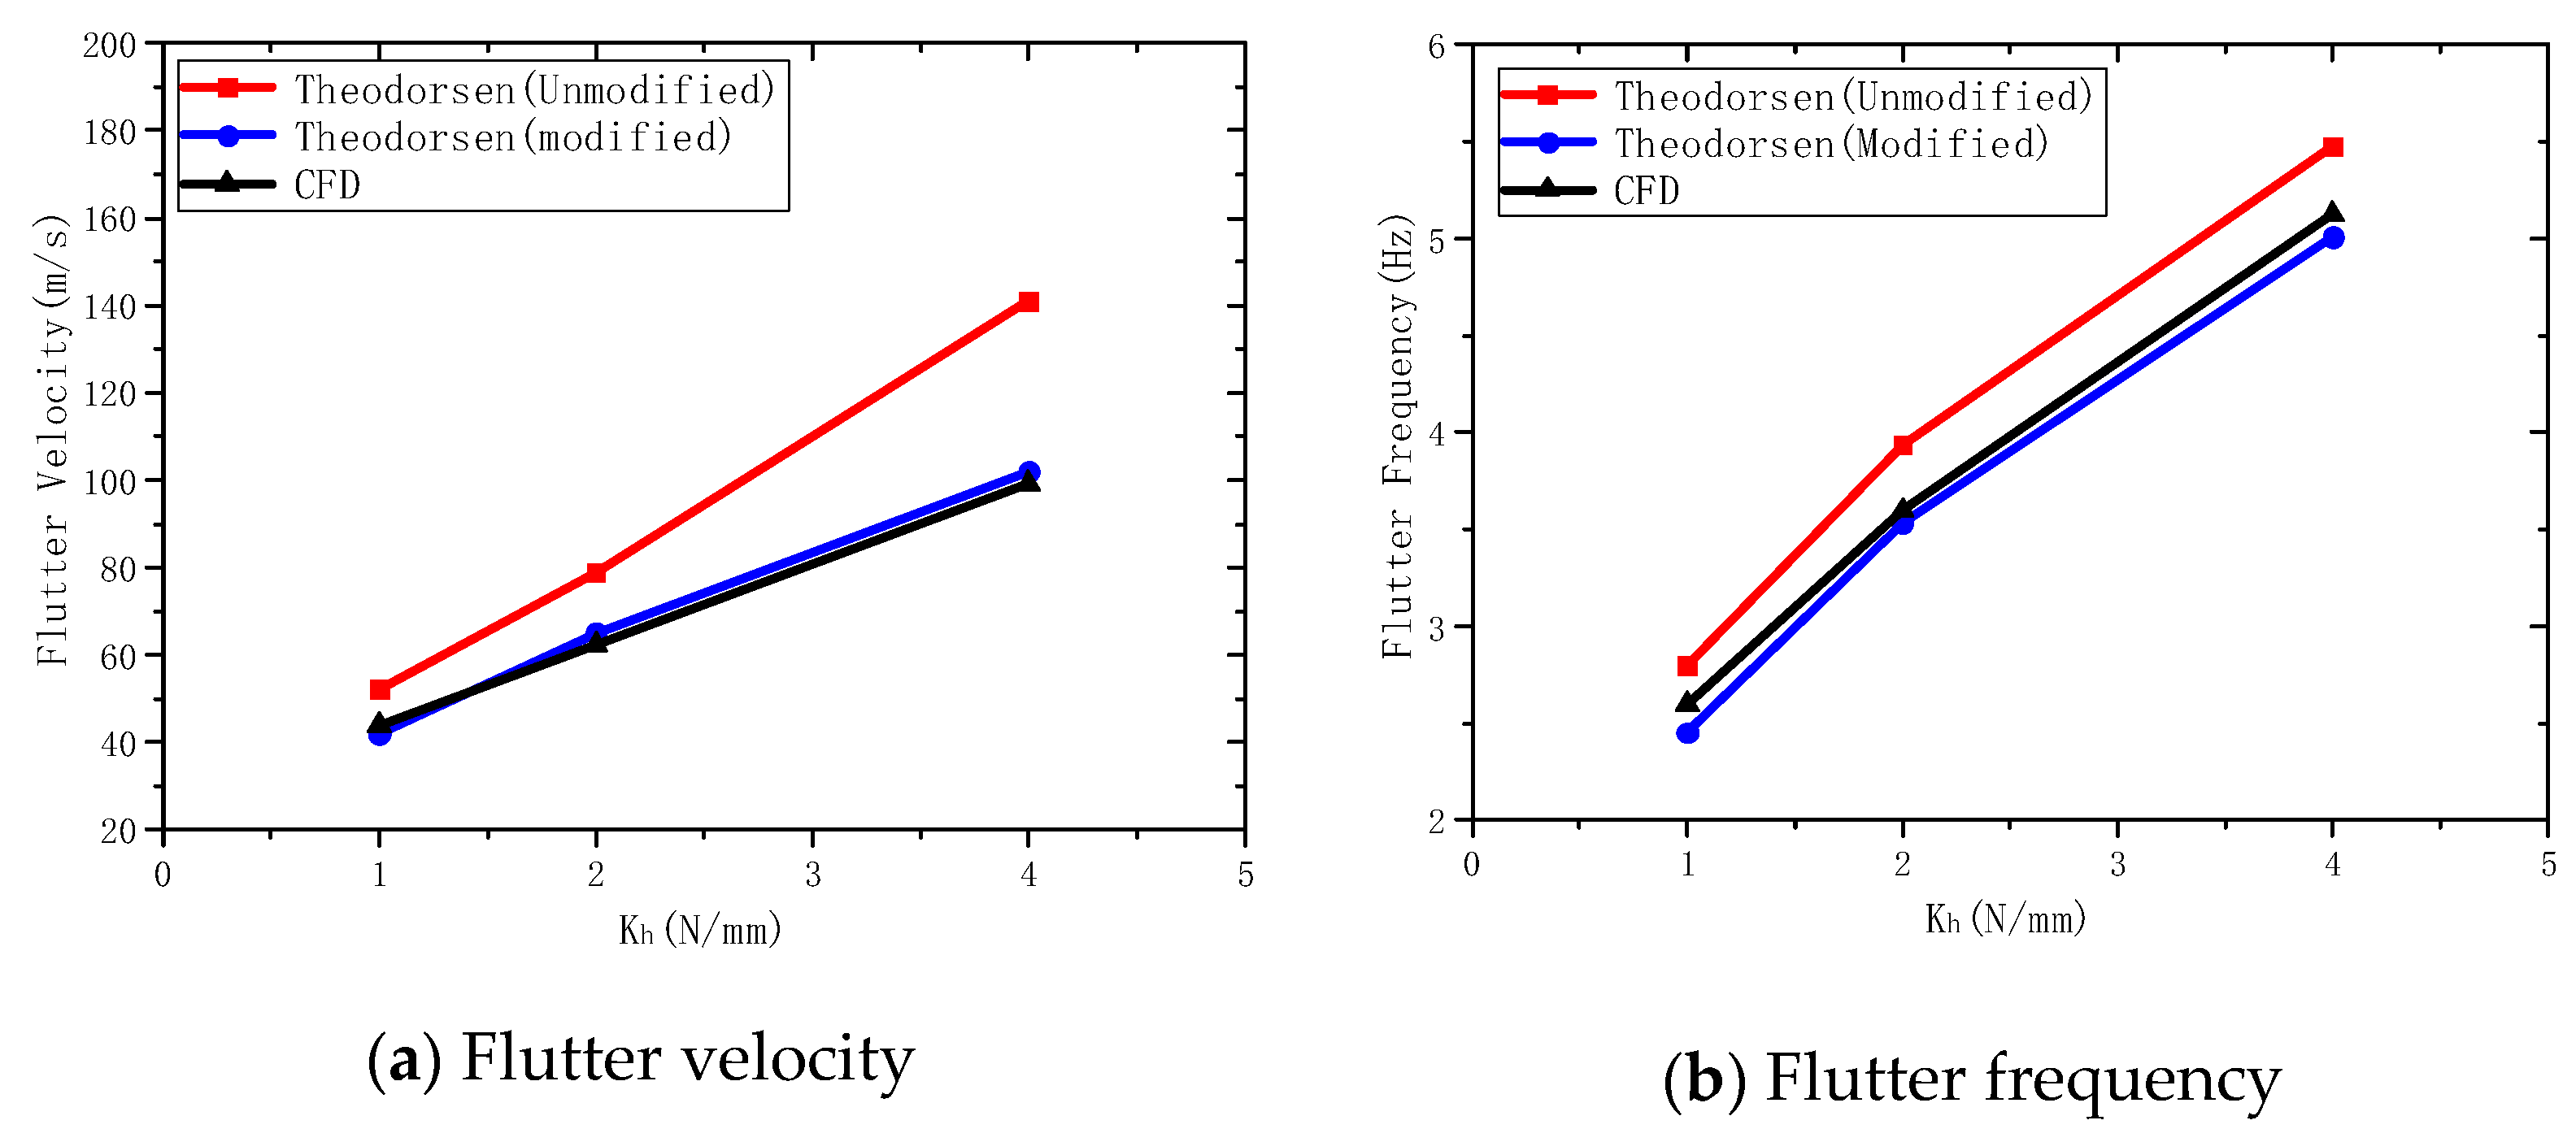
In order to modify the Theodorsen unsteady aerodynamic models, the aerodynamic response curves of pitch force vibration at the flutter velocity and frequency were calculated, with an amplitude of 5°. The aerodynamic response hysteresis curves are shown in Figure 6 with three different bending stiffness values. It can be seen that the modified and unmodified aerodynamic response hysteresis curves are very different. The area surrounded by the lift coefficient hysteresis curve calculated by CFD was larger than that for the Theodorsen unsteady aerodynamic model, which would make the flutter velocity reduce. The flutter velocity results are shown in Figure 7. It can be seen that the modified solutions were basically consistent with the CFD method, and the deviation was less than 4%. As shown in Figure 7, increasing the bending stiffness increases the natural frequency of the bending mode, making it far away from pitching mode’s frequency which makes it more difficult for body freedom flutter to occur. Therefore, increasing the bending stiffness increased the body freedom flutter velocity and frequency.

4.2. Results and Discussion of the Three-Dimensional Model

In this section, the CFD/CSD numerical simulation method was verified based on the wind tunnel test results of the flying wing in reference [31]. In the reference study, a half-mode flutter wind tunnel test was carried out.
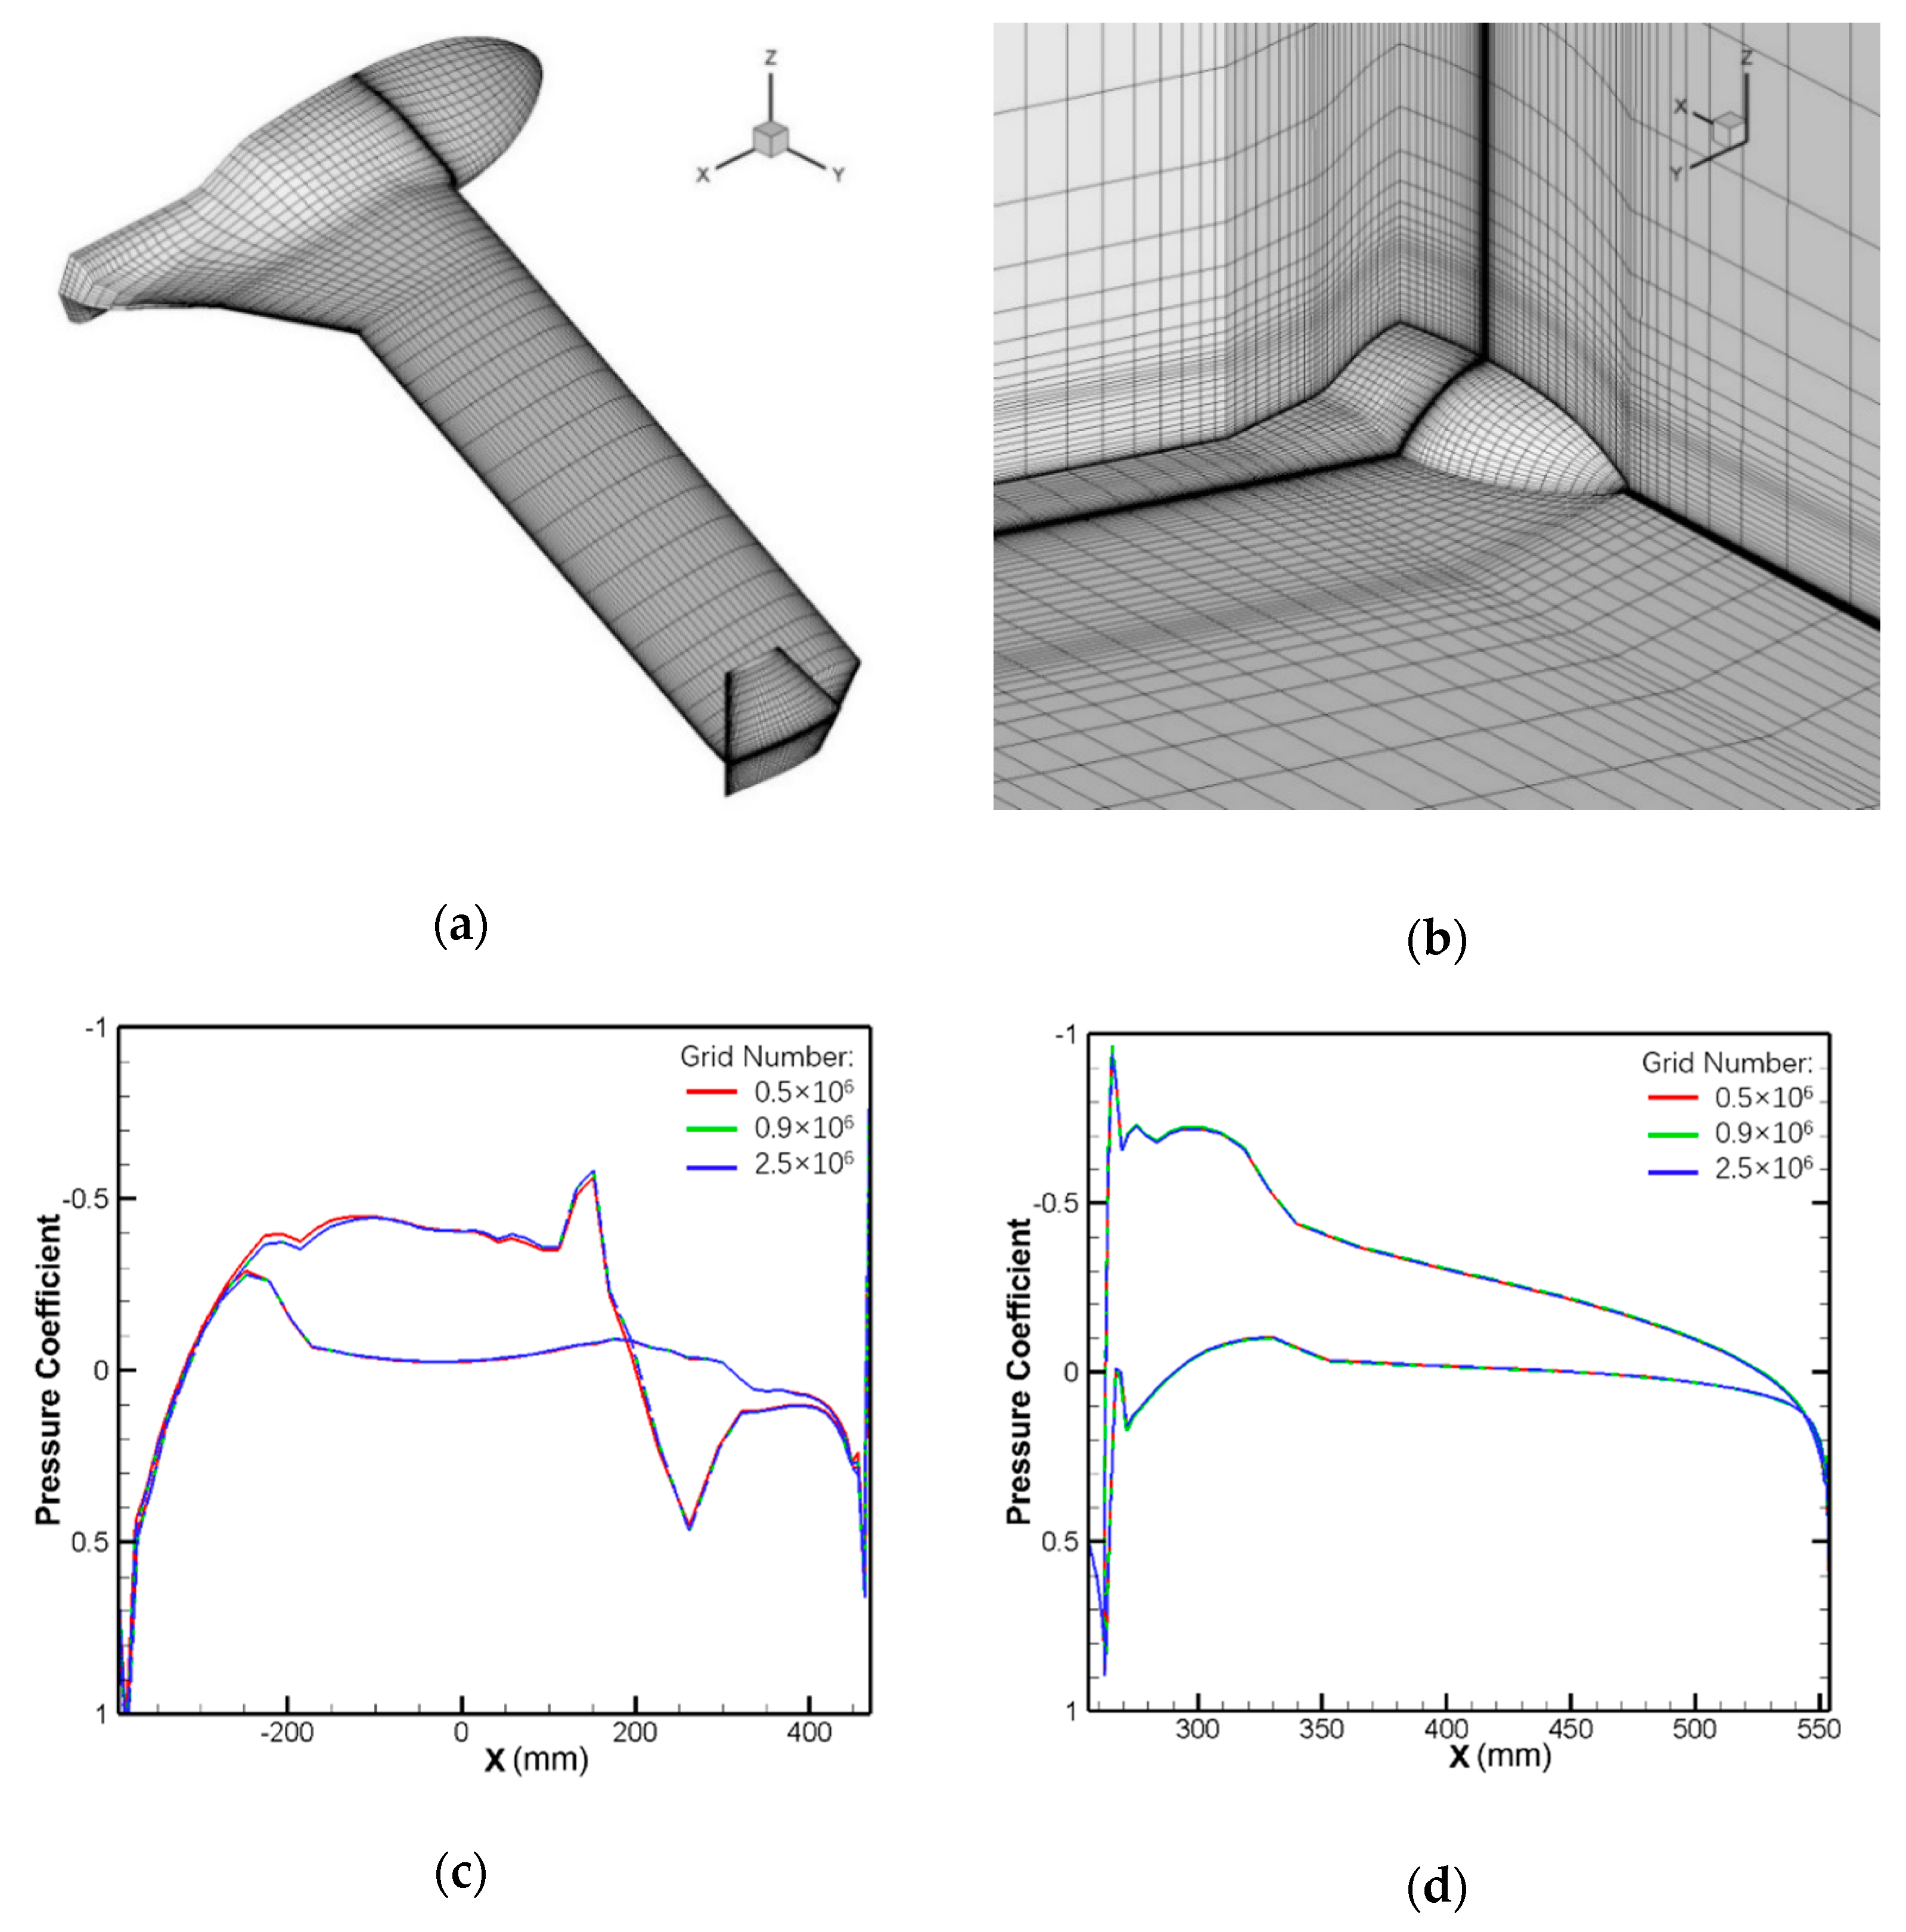
A semi-model was used in the calculation, which was consistent with the experiment. The grid is shown in Figure 8. The calculation grid adopted a multi-block structure grid without considering the viscous effect. The height of the first layer grid was 0.001 c0 (c0 was the root chord length). The calculation Mach number was 0.0547, the angle of attack was α = 0°, with Δt = 0.001 s. Five Euler grids were generated and the number of grids was 0.5 × 10⁶, 0.9 × 10⁶, and 2.5 × 10⁶. The lift coefficients CL were 0.2925, 0.2856 and 0.2856, respectively. The pressure distribution curves of the fuselage and wing are also shown in Figure 8. The results show that increasing the number of grids has no effect on the calculation results when the number of grids is greater than 0.9 × 10⁶.
Firstly, the Euler equation was used to calculate the steady aerodynamic force. In order to avoid repeated calculation of the steady aerodynamic force under different incoming velocities, the flutter characteristics were predicted by using the variable stiffness method [32]. The calculation model of the variable stiffness method kept the mass of the original aircraft and dynamic pressure unchanged, and the stiffness gradually decreased to a series of multiples of the original aircraft stiffness Nj until the stiffness multiple N at the time that flutter occurred. Therefore, given the flight Mach number and flight altitude, only one steady aerodynamic calculation was performed. The theoretical derivation showed that the stiffness of the calculation model was N times the original stiffness, the flutter dynamic pressure of the calculated model was QF,m and the flutter frequency was ωF,m. The flutter velocity pressure QF,a and flutter frequency ωF,a of the original stiffness aircraft at a given Mach number were, respectively:
Q F , a = Q F , m / N  
ω F , a = ω F , m / N
In the incompressible range, the results of the variable stiffness method were consistent with those of the incompressible flutter calculation.
The steady flow field was taken as the initial field and the effect of the steady aerodynamic force was deducted. The time domain-coupled CFD/CSD analysis of body freedom flutter characteristics was carried out by using the variable stiffness method.
The structural modes were the rigid-body pitching mode and the first four symmetric elastic modes, which were the symmetric first bend, symmetric second bend, symmetric first twist and symmetric third bend. The mode shape is shown inFigure 9. The modal frequencies of the first five modes obtained from the finite element model used in the calculation are given in Table 2 and compared with the GVT results in the reference.
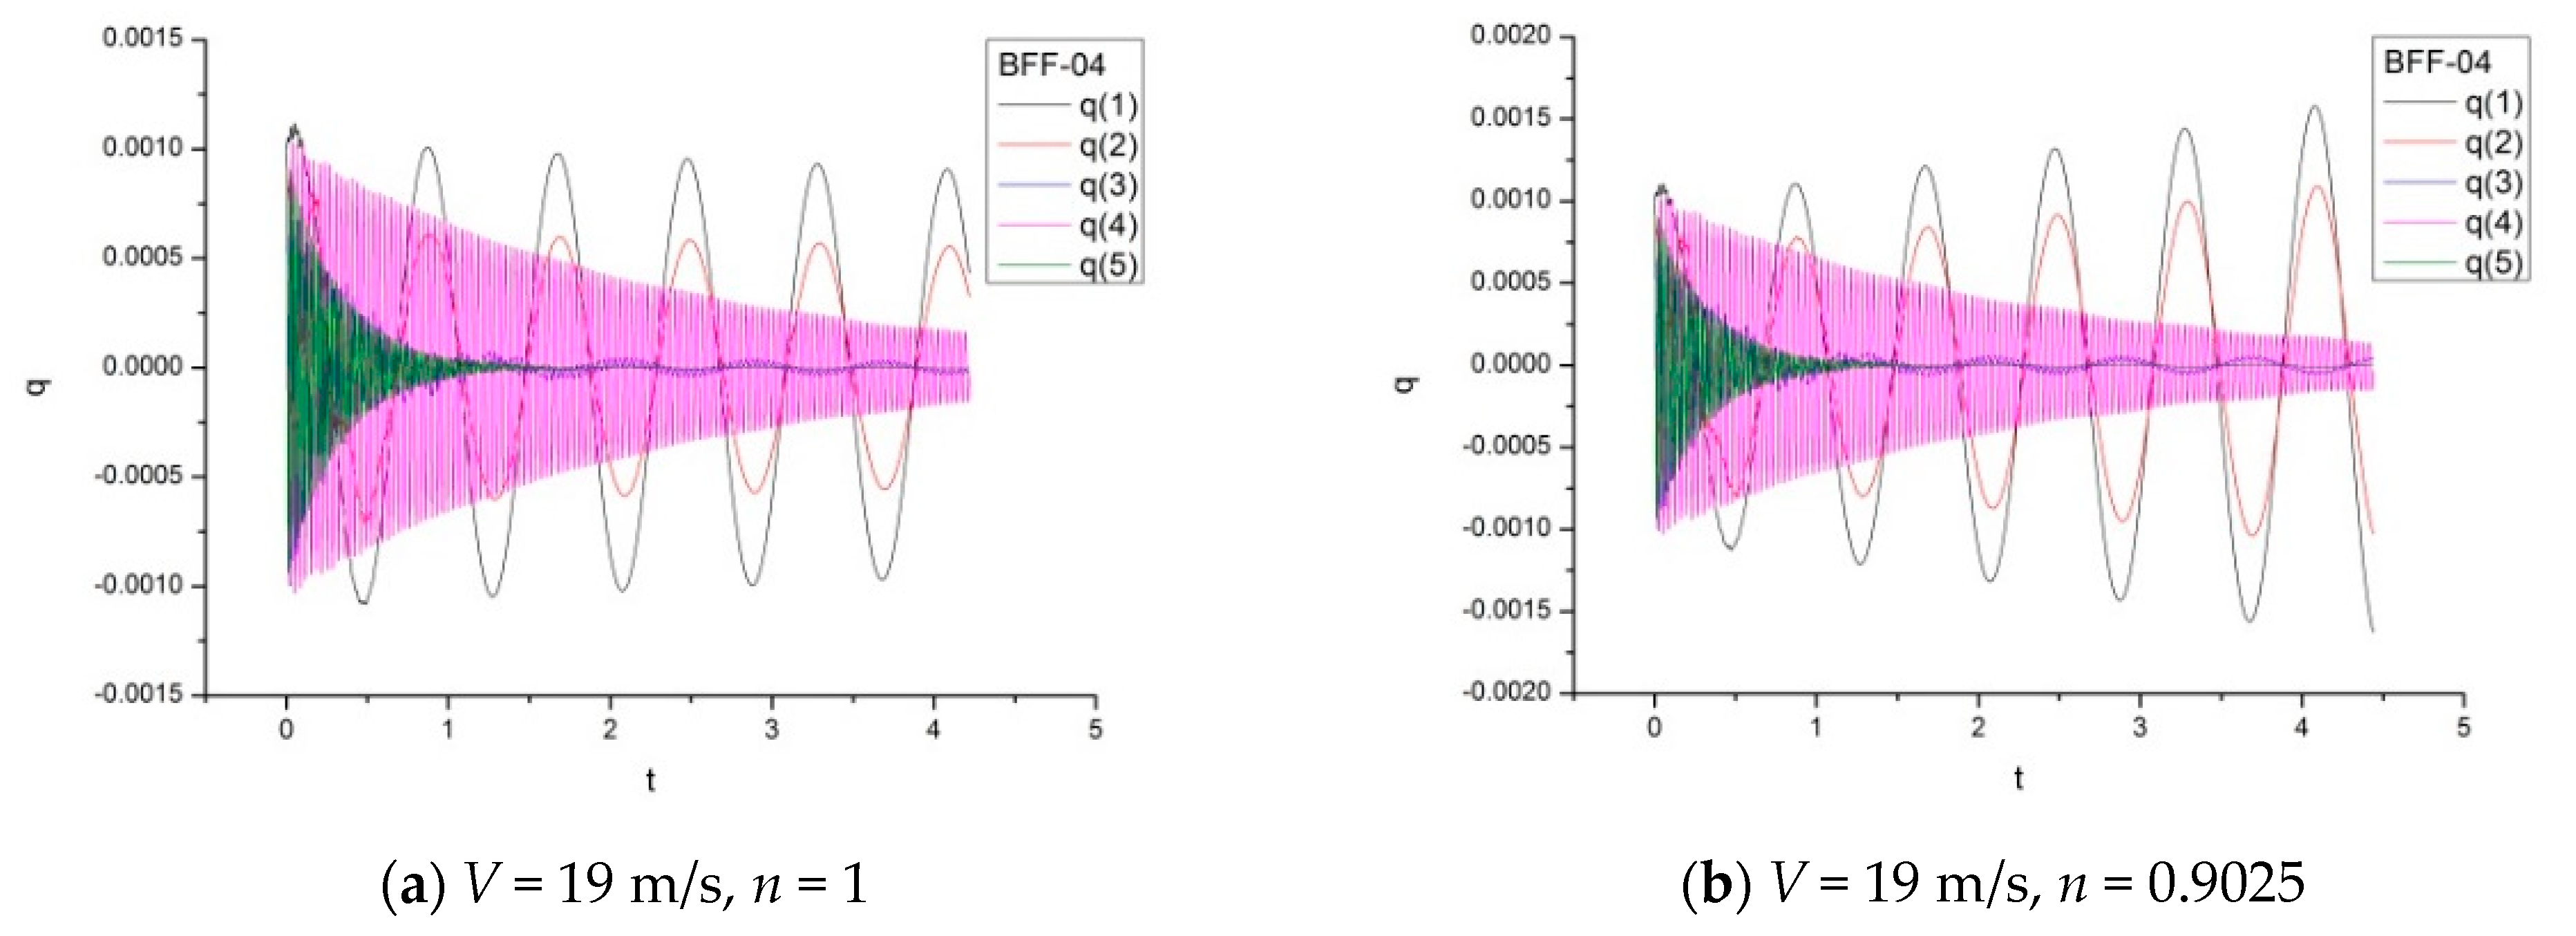
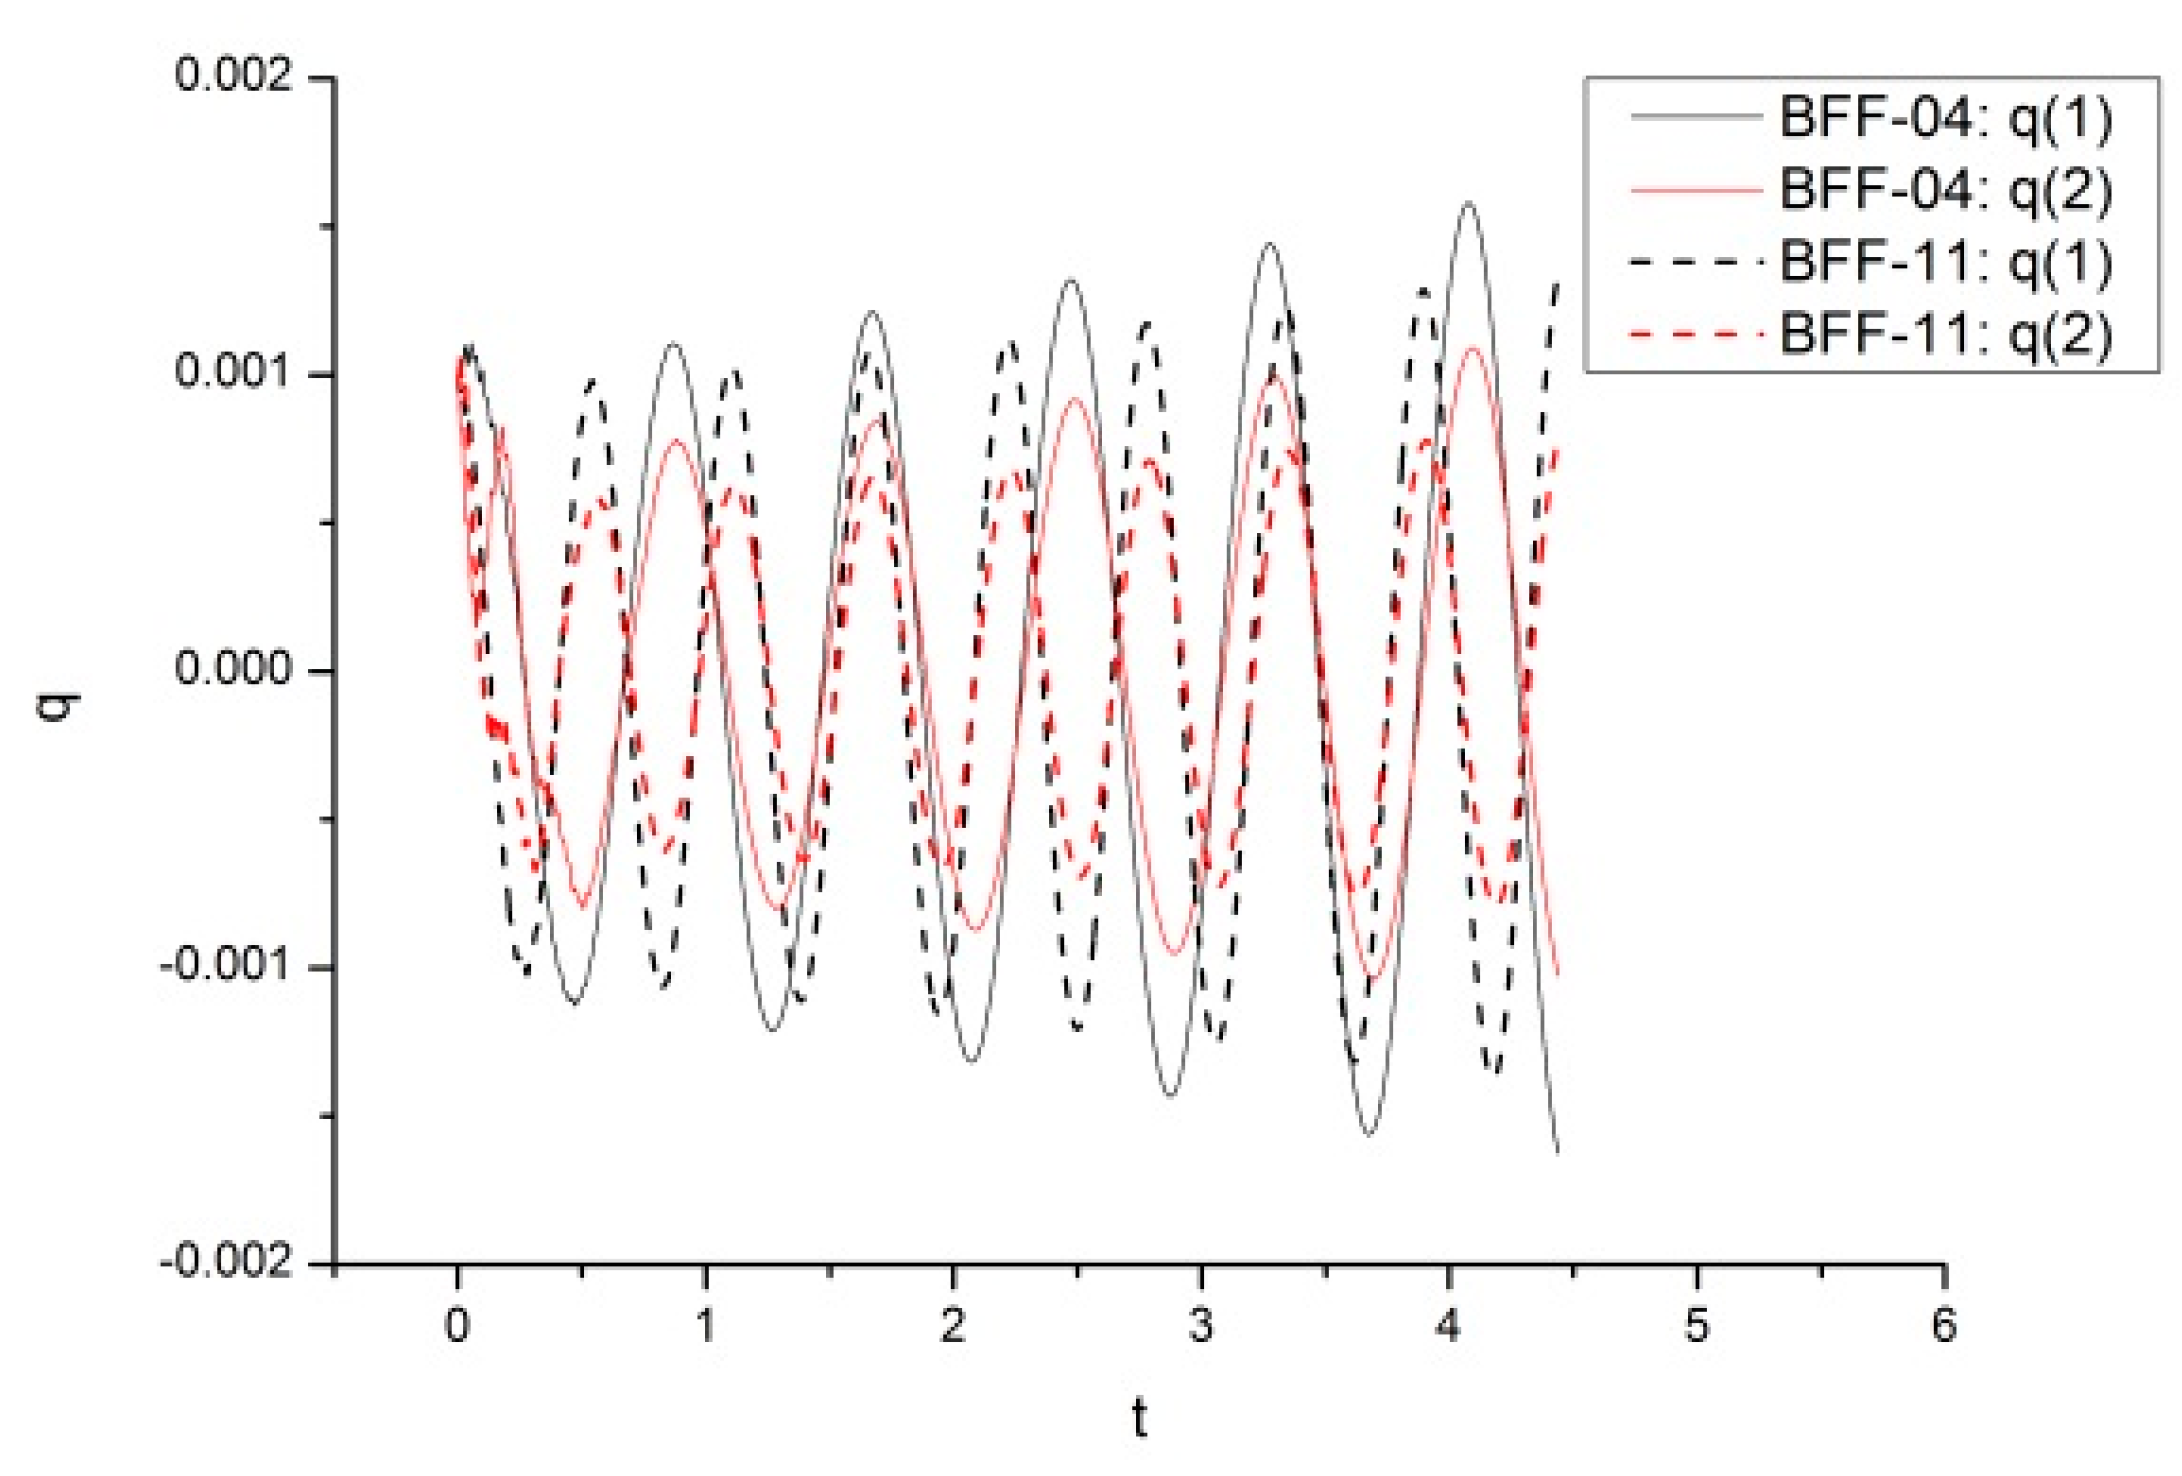
Figure 10 and Figure 11 show the generalized coordinate time response of the benchmark status (BFF-04) and the forward state of the center of gravity (BFF-11) under different stiffness multiples N. A comparison between the calculated and experimental results is given in Table 3. The calculated velocity was 19 m/s~20 m/s (corresponding to the stiffness coefficients n = 1 and n = 0.9025), and the flutter frequency was 1.31 Hz and 1.88 Hz, respectively. According to Figure 12, it can be seen that the divergence trend slows down after moving the center of gravity forward when n = 0.9025. This indicates that the critical flutter velocity had improved.
The numerical simulation results are consistent with the experimental results, but there are some errors in the numerical values because the flutter frequency mainly depends on the frequency of the pitch mode, and the pitch mode frequency is greatly affected by the incoming flow velocity (or dynamic pressure). Considering the single degree of freedom pitching vibration, the differential equation is:
I y y α ¨ 2 C M z a ˙ Q S c r e f α ˙ C M z a Q S c r e f α = 0  
where Iyy is the pitching moment of inertia, α is the angle of attack, CMZα is the static derivative of the pitching moment, C M z a ˙ is the dynamic derivative of the pitching moment, Q is the dynamic pressure, S is the reference area and cref is the reference length. The solution of the equation is:
α = α 0 cos ϕ e η t cos ( ω d t + ϕ ) = α 0 cos ϕ e η t cos ( ω n 1 ξ 2 t + ϕ )  
The vibration frequency ω d is:
ω d = C M z a Q S c r e f I y y ( 1 ξ 2 )  
According to Equation (19), when there is an error in the flutter velocity, it will significantly affect the pitch mode frequency and then affect the flutter frequency. As a comparison, the time domain responses of the experimental model were simulated under the experimental flutter velocity. The vibration frequency was basically consistent with the experimental results. Moreover, the modal damping ratio obtained by numerical simulation was less than 5% (calculated by Equation (11)), resulting in a flutter velocity error of about 10~20%. Considering the error of the experiment itself, the flutter velocity obtained by numerical simulation is reasonable.
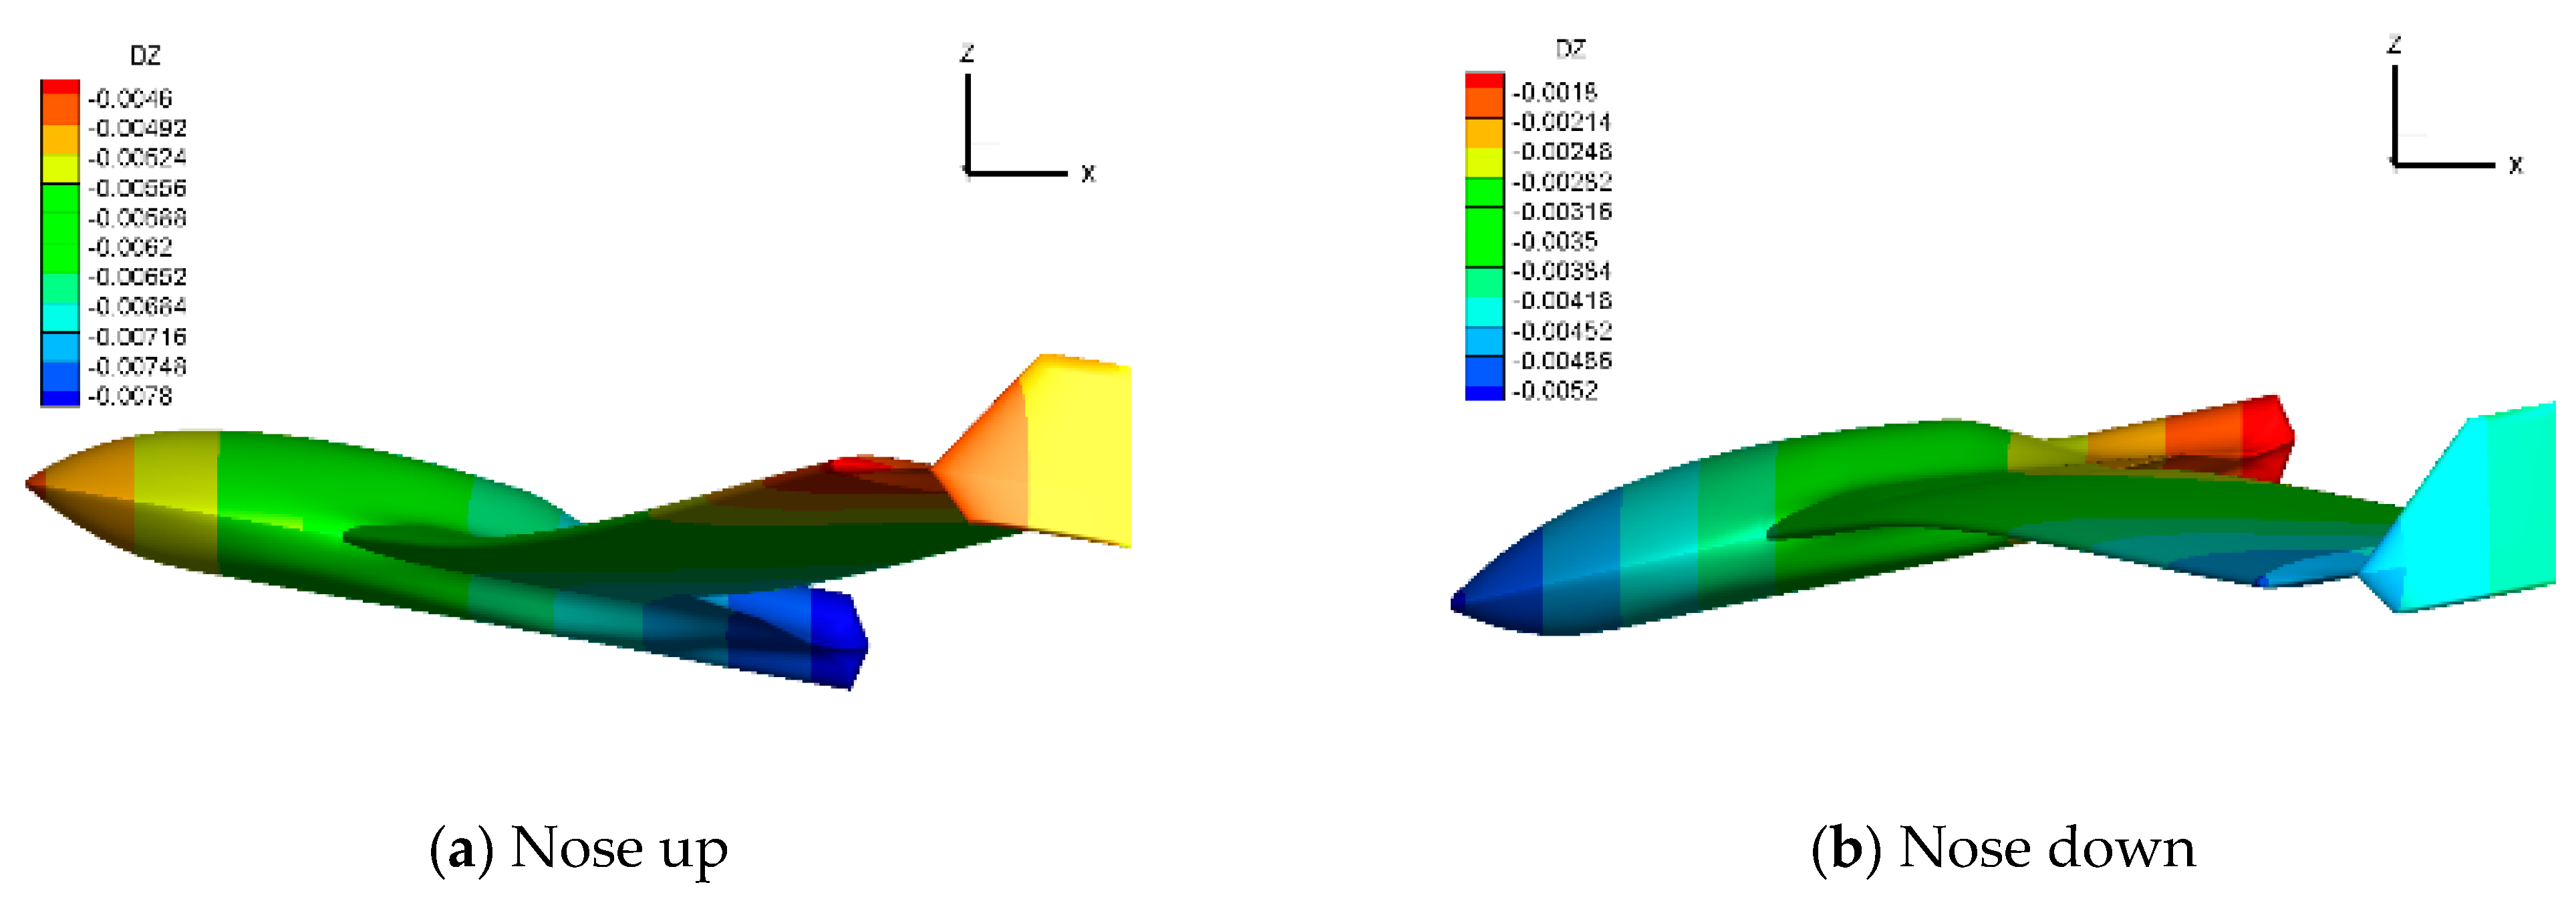
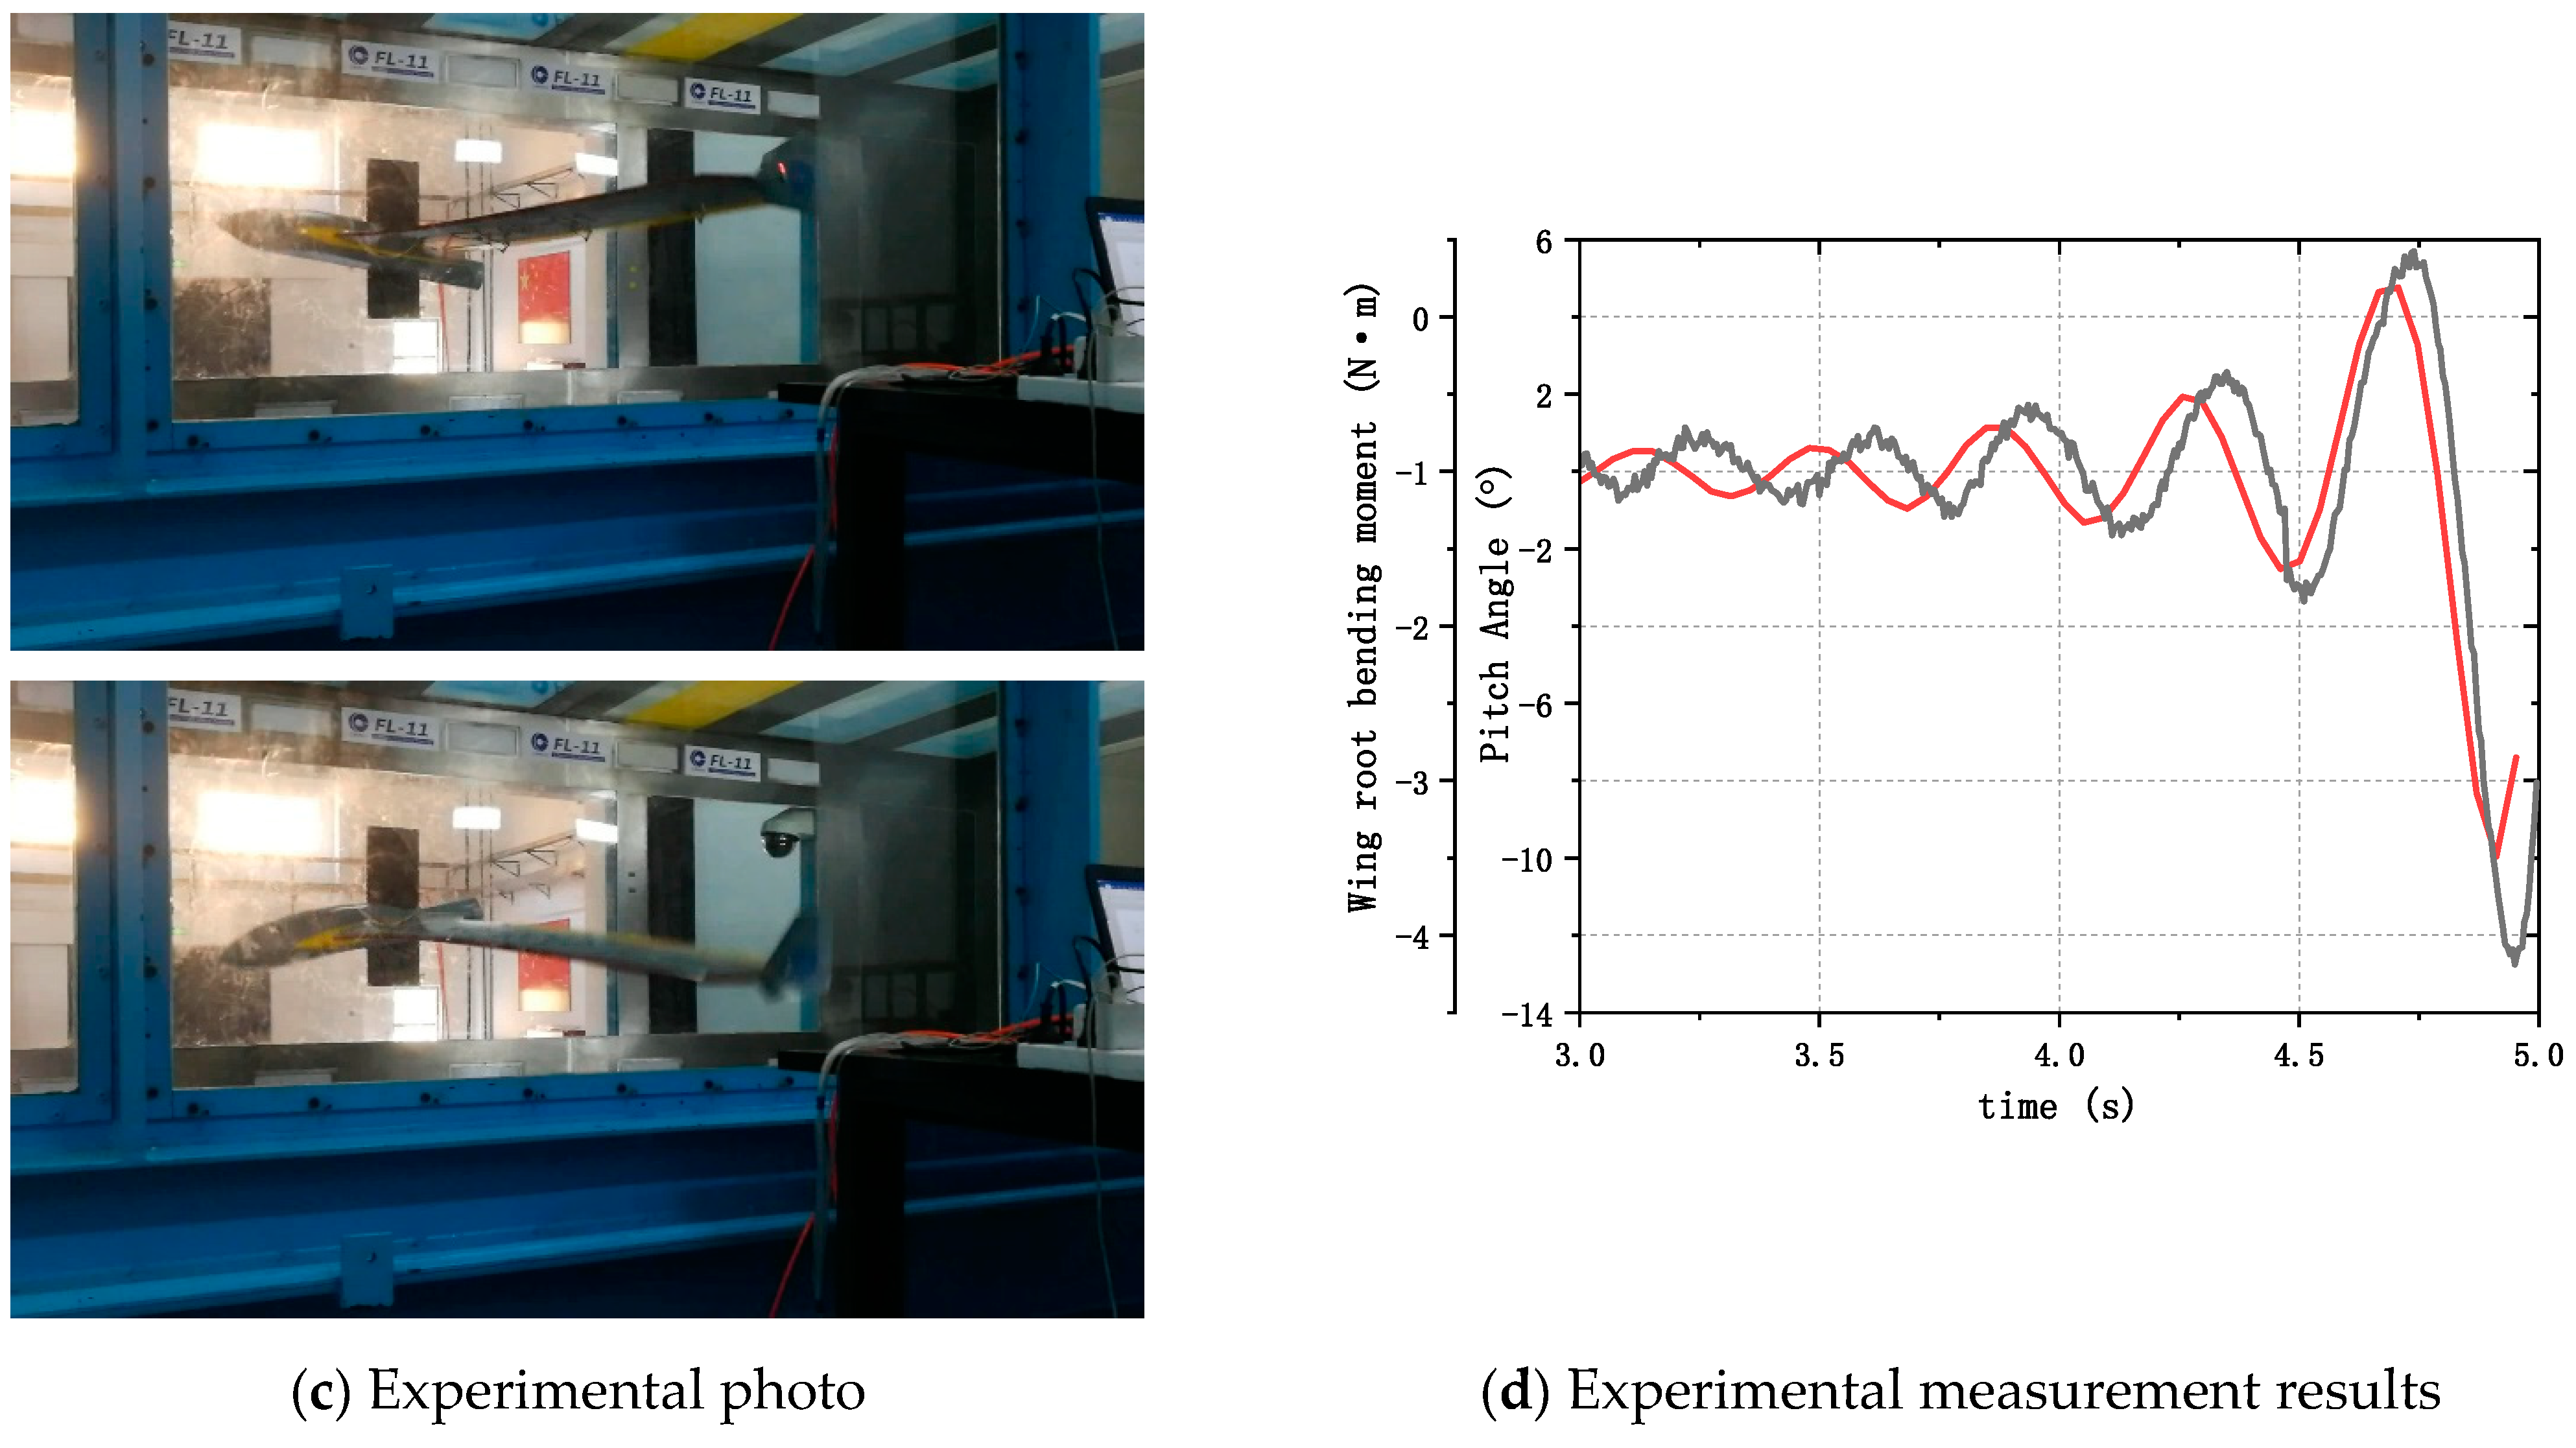
The static/dynamic derivative of the pitching moment of the aircraft increased when the center of gravity moved forward. With the increase in the dynamic derivative, the damping of pitching mode increased, which led to the increase in the body freedom flutter velocity. With the increase in the static derivative, the pitching modal frequency increased, which led to the increase in the body freedom flutter frequency. Furthermore, Figure 13 shows the vibration pattern of flutter obtained by the CFD calculation. It can be seen that when the nose of the fuselage lifts up, the wing tip will also deform upward. When the nose of the fuselage moves down, the wing tip will also deform downward. This indicates that the phase of the two main modes (pitching mode and first wing bending mode) of the flutter were almost the same. This was different from the bending–torsional flutter, in which the phase difference between the bending mode and the torsion mode was close to 90°. A similar phenomenon was reported in [33]. Figure 13c,d show photos of the wind tunnel test and experimental measurement results. It can be seen that the vibration pattern calculated by CFD is consistent with the test results. When flutter occurs, the phases of the pitch mode and bending mode are basically the same.

5. Conclusions

The body freedom flutter characteristics of a two-dimensional airfoil and a fly wing aircraft model were analyzed based on the CFD method. Rigid–elastic coupling dynamic models were established in an inertial coordinate system under the linear small disturbance hypothesis. Based on the theoretical solutions of an airfoil and the experimental results of a flying wing aircraft model, the numerical simulation method was verified. Because the increasing bending stiffness made the bending mode frequency far away from the pitching mode frequency, this made it more difficult for body freedom flutter to occur. Therefore, increasing the bending stiffness increased the body freedom flutter velocity and frequency. The predicted flutter velocity and frequency were in good agreement with the theoretical solution, and the maximum error was less than 4%.
A forward shift of the center of gravity resulted in an increase in the pitching static/dynamic derivative and finally led to an increase in the flutter velocity and frequency. The numerical simulation was consistent with the experimental results, but there was a deviation in the value, which needs further study. Furthermore, the numerical simulation and experimental results showed that the phase of the two main modes (pitching mode and first wing bending mode) of the flutter were almost the same. This was different from the bending–torsional flutter, in which the phase difference between the bending mode and the torsion mode was close to 90°. The mechanism of body freedom flutter also needs further study.

Author Contributions

Data curation and writing—original draft, P.L. and H.G.; supervision, D.C. and L.Y.; writing—review and editing, B.L. All authors have read and agreed to the published version of the manuscript.

Funding

This research received no external funding.

Institutional Review Board Statement

Not applicable.

Informed Consent Statement

Not applicable.

Data Availability Statement

Conflicts of Interest

The authors declare no conflict of interest.

References

  1. Goh, G.D.; Agarwala, S.; Goh, G.L.; Dikshit, V.; Sing, S.L.; Yeong, W.Y. Additive manufacturing in unmanned aerial vehicles (UAVs): Challenges and potential. Aerosp. Sci. Technol. 2017, 63, 140–151. [Google Scholar] [CrossRef]
  2. Lv, B.B.; Lu, Z.L.; Guo, T.Q.; Tang, D.; Yu, L.; Guo, H.T. Investigation of winglet on the transonic flutter characteristics for a wind tunnel test model CHNT-1. Aerosp. Sci. Technol. 2019, 86, 430–437. [Google Scholar] [CrossRef]
  3. Delfrate, J.H. Helios Prototype Vehicle Mishap: Technical Findings, Recommendations, and Lessons Learned; Non-Linear Aeroelastic Tools Workshop: Alexandria, VA, USA, 2008. [Google Scholar]
  4. Guo, S.; Jing, Z.W.; Li, H.; Lei, W.T.; He, Y.Y. Gust response and body freedom flutter of a flying-wing aircraft with a passive gust alleviation device. Aerosp. Sci. Technol. 2017, 70, 277–285. [Google Scholar] [CrossRef] [Green Version]
  5. Yang, C.; Huang, C.; Wu, Z.G.; Tang, C.H. Progress and challenges for aeroservoelasticity research. Acta Aeronaut. ET Astronaut. Sin. 2015, 36, 1011–1033. [Google Scholar] [CrossRef]
  6. Love, M.H.; Wieselmann, P.; Youngren, H. Body Freedom Flutter of High Aspect Ratio Flying Wings. In Proceedings of the 46th AIAA/ASME/ASCE/AHS/ASC Structures, Structural Dynamics and Materials Conference, AIAA Paper 2005-1947, Austin, TX, USA, 18–21 April 2005. [Google Scholar] [CrossRef]
  7. Burnett, E.L.; Atkinson, C.; Beranek, J.; Sibbitt, B.; Holm-Hansen, B.; Nicolai, L. NDOF Simulation Model for Flight Control Development with Flight Test Correlation. In Proceedings of the AIAA Modeling & Simulation Technologies Conference, Toronto ON, Canada, 2–5 August 2010. [Google Scholar] [CrossRef]
  8. Moreno, C.P.; Seiler, P.J.; Balas, G.J. Model Reduction for Aeroservoelastic Systems. J. Aircr. 2014, 51, 280–290. [Google Scholar] [CrossRef] [Green Version]
  9. Pak, C.-G.; Truong, S. Creating a Test-Validated Finite-Element Model of the X-56A Aircraft Structure. J. Aircr. 2015, 52, 1644–1667. [Google Scholar] [CrossRef] [Green Version]
  10. Jones, J.; Cesnik, C.E. Nonlinear Aeroelastic Analysis of the X-56 Multi-Utility Aeroelastic Demonstrator. In Proceedings of the Dynamics Specialists Conference, San Diego, CA, USA, 4–8 January 2016. [Google Scholar] [CrossRef] [Green Version]
  11. Li, W.W.; Pak, C.-G. Mass Balancing Optimization Study to Reduce Flutter Speeds of the X-56A Aircraft. J. Aircr. 2015, 52, 1359–1365. [Google Scholar] [CrossRef]
  12. Mardanpour, P.; Hodges, D.H.; Neuhart, R.; Graybeal, N. Engine Placement Effect on Nonlinear Trim and Stability of Flying Wing Aircraft. J. Aircr. 2013, 50, 1716–1725. [Google Scholar] [CrossRef]
  13. Richards, P.W.; Yao, Y.; Herd, R.A.; Hodges, D.H.; Mardanpour, P. Effect of Inertial and Constitutive Properties on Body-Freedom Flutter for Flying Wings. J. Aircr. 2016, 53, 756–767. [Google Scholar] [CrossRef]
  14. Regan, C.D.; Taylor, B.R. mAEWing1: Design, Build, Test. In Proceedings of the AIA Atmospheric Flight Mechanics Conference, San Diego, CA, USA, 4–8 January 2016. [Google Scholar] [CrossRef]
  15. Huang, C.; Wu, Z.G.; Yang, C.; Dai, Y.T. Flutter Boundary Prediction for a Flying-Wing Model Exhibiting Body Freedom Flutter. In Proceedings of the 58th AIAA/ASCE/AHS/ASC Structures, Structural Dynamics, and Materials Conference, Grapevine, TX, USA, 9–13 January 2017; p. 0415. [Google Scholar] [CrossRef]
  16. Huang, C.; Yang, C.; Wu, Z.; Tang, C. Variations of flutter mechanism of a span-morphing wing involving rigid-body motions. Chin. J. Aeronaut. 2018, 31, 490–497. [Google Scholar] [CrossRef]
  17. Li, Y.D.; Zhang, X.P.; Gu, Y.S.; Yang, Z.C. Body Freedom Flutter Study and Passive Flutter Suppression for a High Aspect Ratio Flying Wing Model. Appl. Mech. Mater. 2014, 608–609, 708–712. [Google Scholar] [CrossRef]
  18. Gu, Y.; Yang, Z.; He, S. Body Freedom Flutter of a Blended Wing Body Model Coupled with Flight Control System. Procedia Eng. 2015, 99, 46–50. [Google Scholar] [CrossRef] [Green Version]
  19. Gao, C.; Zhang, W.; Ye, Z. Reduction of transonic buffet onset for a wing with activated elasticity. Aerosp. Sci. Technol. 2018, 77, 670–676. [Google Scholar] [CrossRef]
  20. Sodja, J.; Roizner, F.; De Breuker, R.; Karpel, M. Experimental characterisation of flutter and divergence of 2D wing section with stabilised response. Aerosp. Sci. Technol. 2018, 78, 542–552. [Google Scholar] [CrossRef]
  21. Waszak, M.R.; Schmidt, D.K. Flight dynamics of aeroelastic vehicles. J. Aircr. 1988, 25, 563–571. [Google Scholar] [CrossRef]
  22. Buttrill, C.S.; Zeiler, T.A.; Arbuckle, P.D. Nonlinear simulation of a flexible aircraft in maneuvering flight. In Proceedings of the Flight Simulation Technologies Conference, Monterey, CA, USA, 17–19 August 1987; pp. 17–19. [Google Scholar] [CrossRef]
  23. Meirovitch, L. Hybrid state equations of motion for flexible bodies in terms of quasi-coordinates. J. Guid. Control. Dyn. 1991, 14, 1008–1013. [Google Scholar] [CrossRef]
  24. Meirovitch, L.; Tuzcu, I. Unified Theory for the Dynamics and Control of Maneuvering Flexible Aircraft. AIAA J. 2004, 42, 714–727. [Google Scholar] [CrossRef]
  25. Guo, D.; Xu, M.; Chen, S.L. Research on flight dynamic modeling of highly flexible aircrafts. Acta Aerodyn. Sin. 2013, 3, 413–419, 436. [Google Scholar]
  26. Meirovitch, L.; Tuzcu, I. The Lure of the Mean Axes. J. Appl. Mech. 2006, 74, 497–504. [Google Scholar] [CrossRef]
  27. Schmidt, D.K. Discussion: “The Lure of the Mean Axes” (Meirovitch, L., and Tuzcu, I., ASME J. Appl. Mech., 74 (3), pp. 497–504). J. Appl. Mech. 2015, 82, 125501. [Google Scholar] [CrossRef]
  28. Nastran, M.S.C. Dynamic Analysis User’s Guide; MSC Software: Newport Beach, CA, USA, 2010. [Google Scholar]
  29. Guo, H.T.; Chen, D.H.; Zhang, C.R.; Lyu, B.; Wang, X. Numerical applications on transonic static areoelasticity based on CFD/CSD method. ACTA Aerodyn. Sin. 2018, 36, 12–16. [Google Scholar] [CrossRef]
  30. Guo, H.; Li, G.; Chen, D.; Lu, B. Numerical simulation research on the transonic aeroelasticity of a high-aspect-ratio wing. Int. J. Heat Technol. 2015, 33, 173–180. [Google Scholar] [CrossRef]
  31. Lei, P.X.; Lyu, B.B.; Yu, L.; Chen, D.H. Influence of inertial parameters on body freedom flutter of flying wings. Acta Aerodyn. Sin. 2021, 39, 18–24. [Google Scholar]
  32. Lu, Z.L.; Guo, T.Q.; Guan, D. A study of calculation method for transonic flutter. Acta Aeronaut. Et Astronaut. Sin. 2004, 4, 214–217. [Google Scholar]
  33. Reasor, D.A.; Bhamidipati, K.K.; Chin, A.W. X-56A Aeroelastic Flight Test Predictions. In Proceedings of the 54th AIAA Aerospace Sciences Meeting, San Diego, CA, USA, 4–8 January 2016; p. 1053. [Google Scholar]
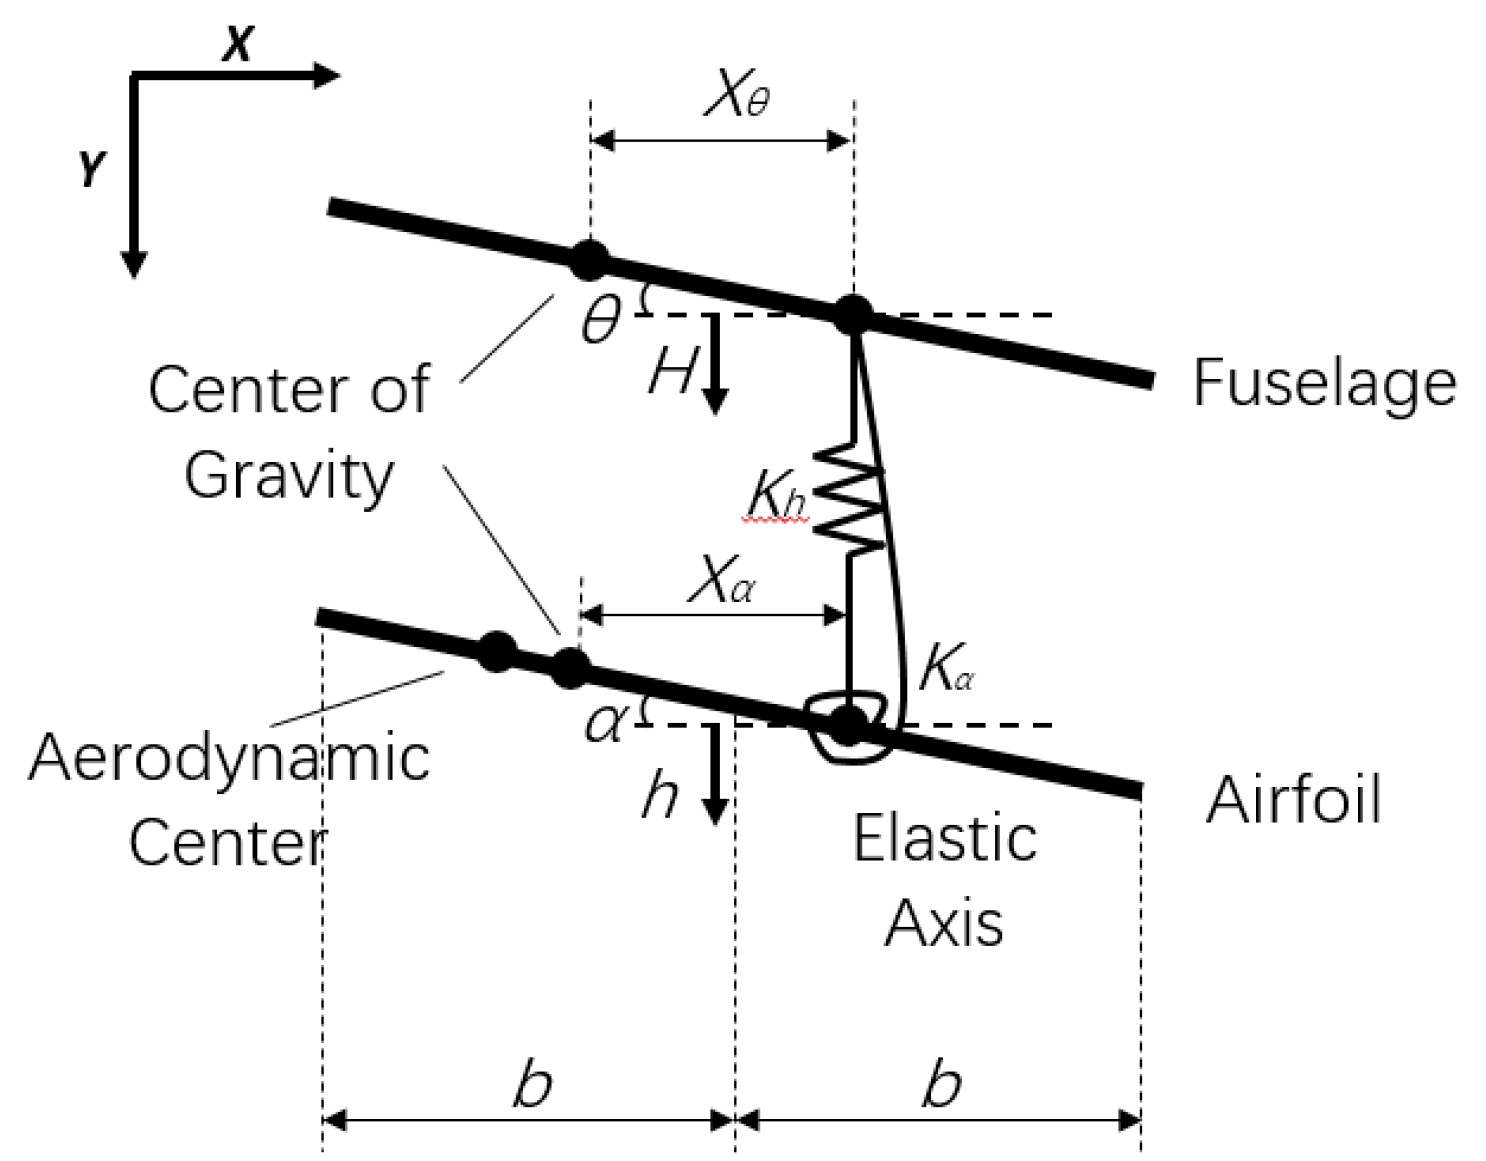
Figure 1. Diagram of an airfoil with the fuselage model in an inertial system.
Machines 09 00243 g001
Figure 2. Computing grid.
Machines 09 00243 g002
Figure 3. Modal displacement response curve of the rigid body.
Machines 09 00243 g003
Figure 4. Pitch modal response curve.
Machines 09 00243 g004
Figure 5. Flutter determinant calculation results. (a) Kh = 2 N/mm (b) Kh = 12 N/mm.
Machines 09 00243 g005
Figure 6. Comparisons of the CFD and Theodorsen unsteady aerodynamic forces (Kh = 2 N/mm; inflow velocity, 79 m/s; forced vibration frequency, 3.9 Hz).
Machines 09 00243 g006
Figure 7. Comparisons between CFD and the modified determinant results.
Machines 09 00243 g007
Figure 8. (a) Computing grid: surface grid, (b) local space grid, (c) pressure distribution on the fuselage (y = 0.0 m), (d) the pressure distributed at the wing tip (y = 1.0 m).
Machines 09 00243 g008
Figure 9. Modal shapes of the first five modes (units for the legends: m).
Machines 09 00243 g009aMachines 09 00243 g009b
Figure 10. Calculation results of the generalized coordinate time response in the benchmark status (BFF-04).
Machines 09 00243 g010
Figure 11. Calculation results of the generalized coordinate time response when the center of gravity moves forward 40 mm (BFF-11).
Machines 09 00243 g011
Figure 12. Comparison of time response of BFF-04 and BFF-11 in the first two generalized coordinates.
Machines 09 00243 g012
Figure 13. Flutter vibration patterns calculated by CFD/CSD and wind tunnel test photo.
Machines 09 00243 g013aMachines 09 00243 g013b
Table 1. Parameters of the model.
ParametersValuesParametersValues
Fuselage mass M4 kgCentroid position of the wing20%c
Wing mass m4 kgRadius of gyration of the fuselage R θ 0.18 m
Fuselage pitching moment of inertia I θ 0.1312 kg·m2Radius of gyration of the wing R α 0.18 m
Wing pitching moment of inertia I α 0.1312 kg·m2Bending stiffness K h 1, 2, 4, 12 (N/mm)
Distance between the elastic center and the centroid position of the fuselage X θ 5%cTorsional stiffness K α 600 (Nm/rad)
Distance between the elastic center and the centroid position the of wing X α 5%cElastic center position15%c
Airfoil chord length c0.4 mWing segment length1.5 m
Centroid position of fuselage20%c
Table 2. Modal frequencies.
Model NamePitching ModeSymmetric First Wing BendSymmetric Wing Second BendSymmetric Wing First TwistSymmetric Wing Third Bend
FEM0.05.1924.5547.1662.18
GVT0.05.1023.6044.17-
Error0.0%1.7%4.0%6.8%-
Table 3. Comparison of CFD/CSD and the wind tunnel test results.
Calculation or Experimental StatusFlutter Velocity (m/s)Flutter Frequency (Hz)Vibration Frequency and Damping under the Experimental Flutter Velocity
Frequency (Hz)Damping (%)
Benchmark statusExperiment22.31.67
CFD/CSD19.211.311.477.7%
Center of gravity moved forward 40 mmExperiment24.22.73
CFD/CSD19.771.882.6210.8%
Publisher’s Note: MDPI stays neutral with regard to jurisdictional claims in published maps and institutional affiliations.