1. Introduction
Parametric techniques have been widely used in the field of industrial design [
1]. The assembly of an industrial product usually requires many parametric part objects from different parametric shapes. A parametric shape is a parametric template described by a set of driven parameters, which can be instantiated as many parametric part objects [
2,
3]. For example, many common industrial products comprise a variety of screw parts and nut parts generated from the screw template and the nut template.
When we disassemble the recyclable part objects from products into the recycling bins, it is common that there is a stacked scene including parametric part objects from multiple templates. Then, the part objects from the same template are sorted into their own bins according to their parameter values. In recent years, robots guided by visual systems are often used to sort the part objects automatically. However, due to the varied templates, the frequent changes of parameter values, heavy occlusion, sensor noise, etc., the accurate 6D pose estimation and parameter values prediction in such stacked scenes are challenging.
Accurate 6D pose estimation, i.e., 3D translation and 3D rotation, is very essential for robotic grasping tasks. Existing 6D pose estimation methods based on deep learning can be roughly classified into instance-level and category-level methods. Some instance-level 6D pose estimation methods [
4,
5,
6,
7,
8,
9,
10,
11,
12] established 2D-3D or 3D-3D correspondence to solve the 6D pose with exact 3D models for each object. However, these methods cannot generalize to the unseen objects from the same category which have no exact 3D models. Category-level 6D pose estimation methods [
13,
14,
15,
16,
17] regarded the objects from the same category as a class and they had sufficient generalization ability to estimate the unseen objects’ pose. In addition, they also estimated the size of the object, e.g., Refs. [
13,
14,
15] estimated a scale value as the size, which was different from the parameter values in parametric templates. However, since a parametric template is considered as a class in this paper and the parameter values prediction is necessary for the sorting tasks, there are no existing category-level methods to jointly achieve 6D pose estimation and parameter values prediction of part objects from multiple templates in stacked scenarios. Besides, the lack of datasets for such tasks is a barrier for learning-based methods to research further.
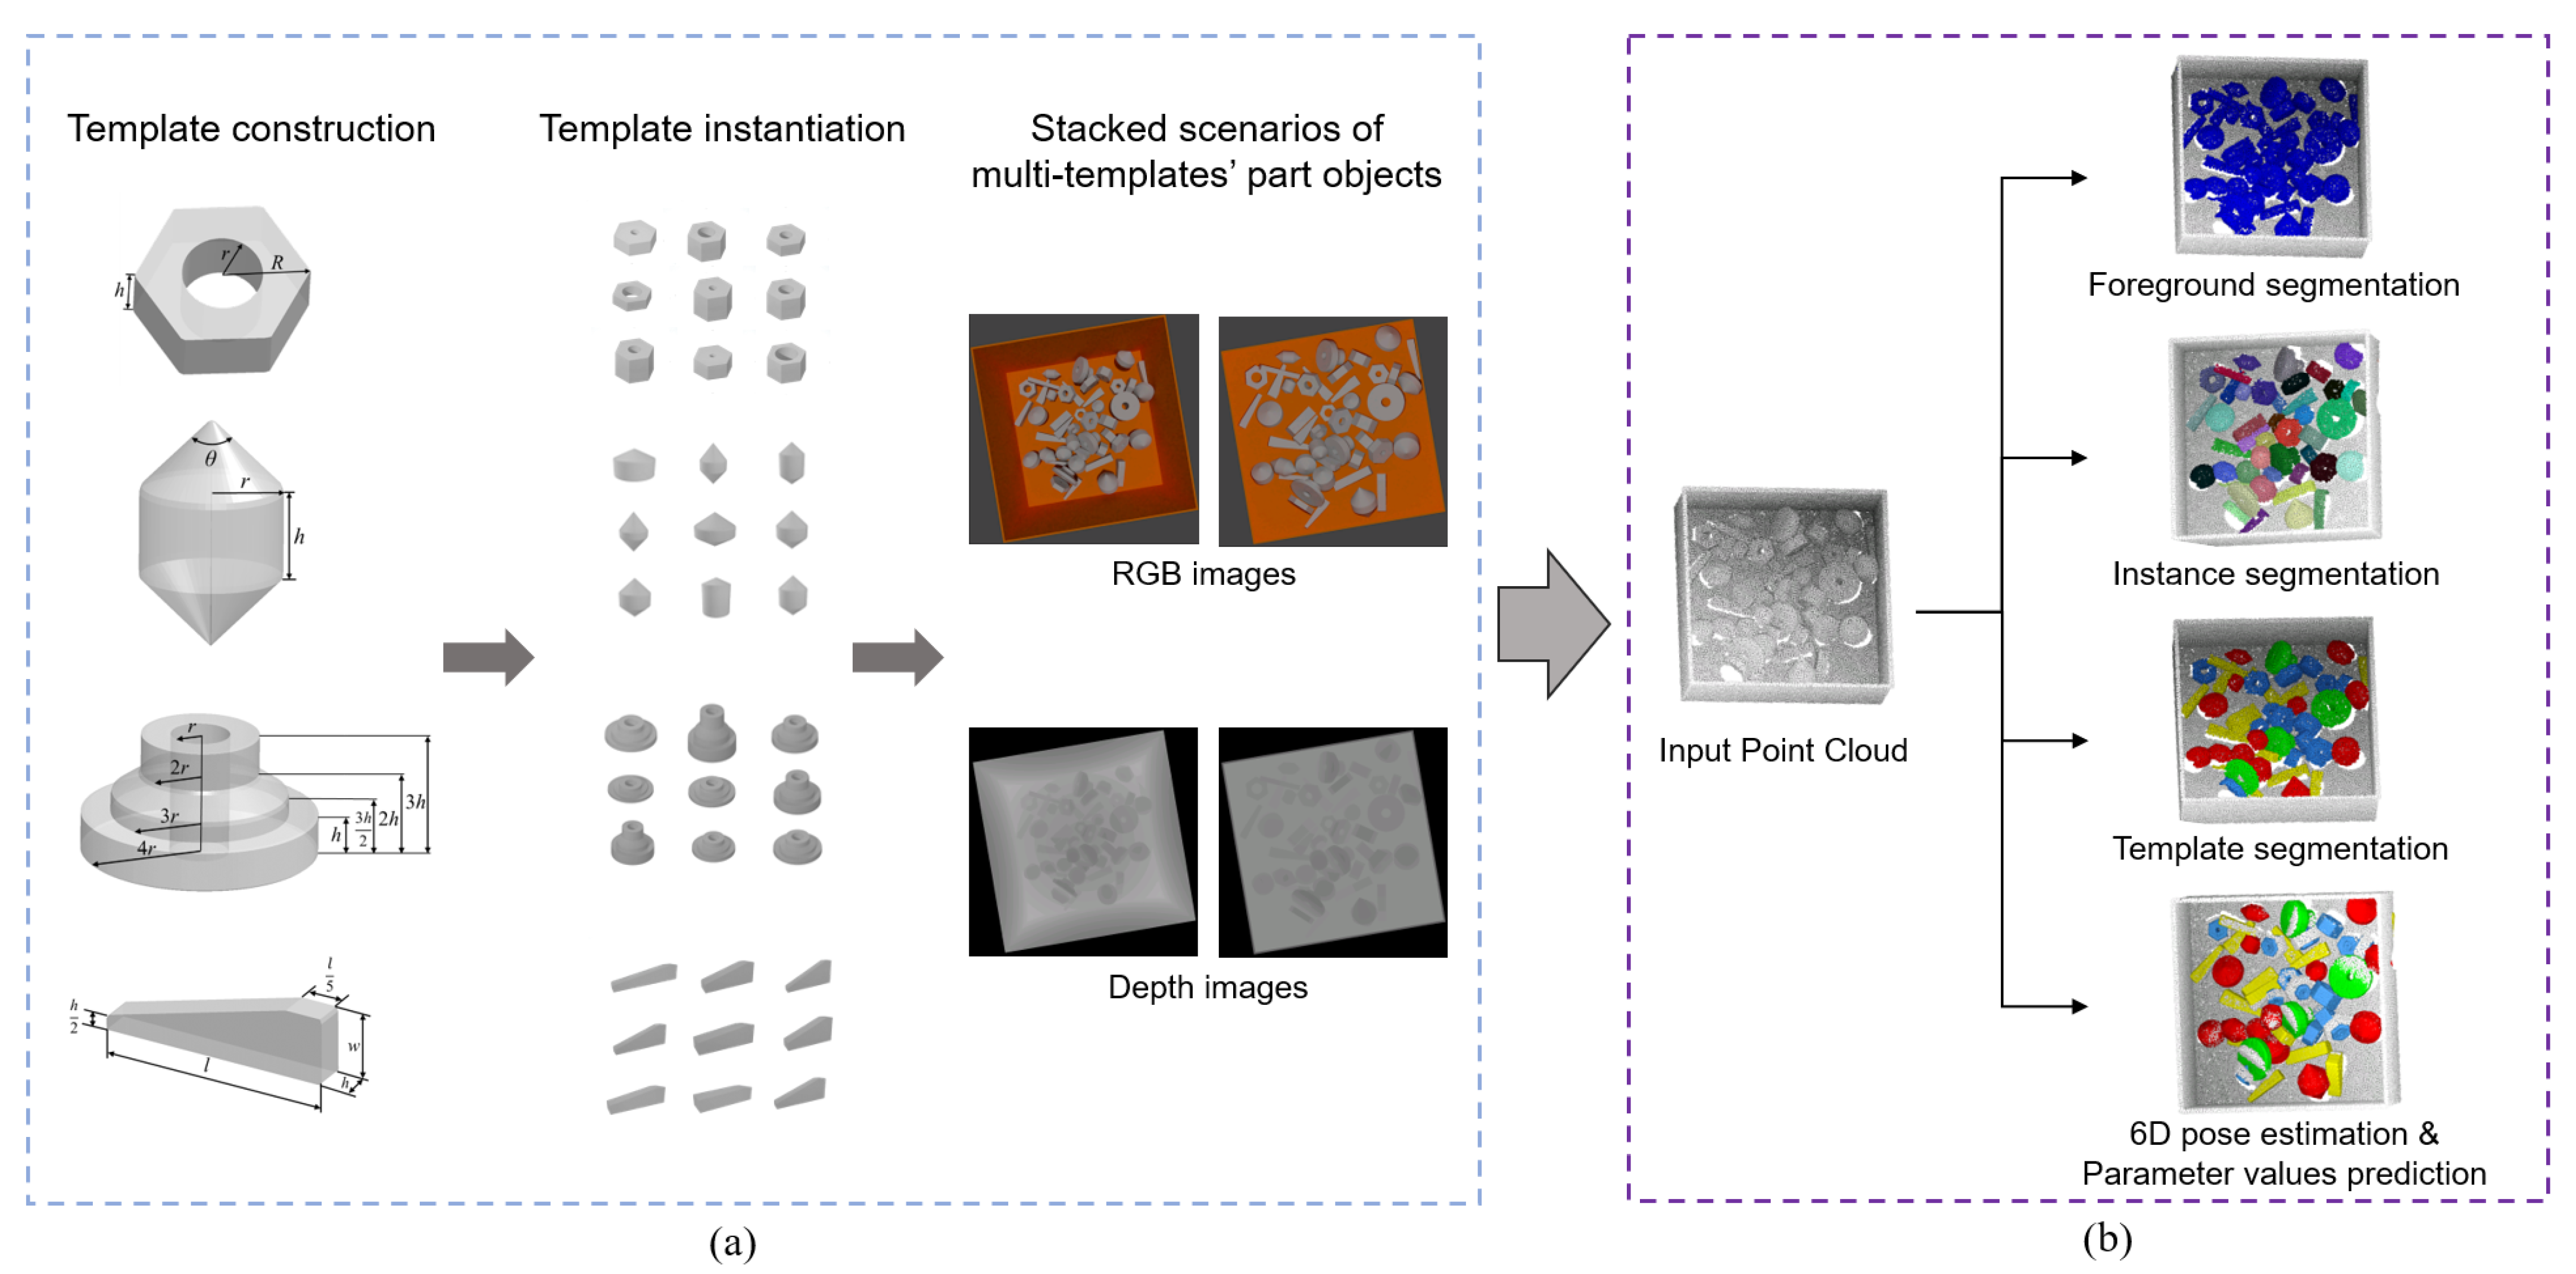
To solve the lack of dataset, we construct a new dataset for stacked scenarios of parametric part objects from multiple templates, donated as Multi-Parametric Dataset. As shown in
Figure 1a, we first select four templates from Zeng’s database [
1], which well represent the geometric features and rotation types. Then we sample the parameter values to instantiate each template into different part objects, and they are randomly selected to form a stacked scene. Through automatically labeling technique, we generate a large RGB-D dataset (50K training set, 2K test set) with ground truth annotations of each instance in the stacked scenes, including template label, segmentation mask, 6D pose, parameter values, and visibility.
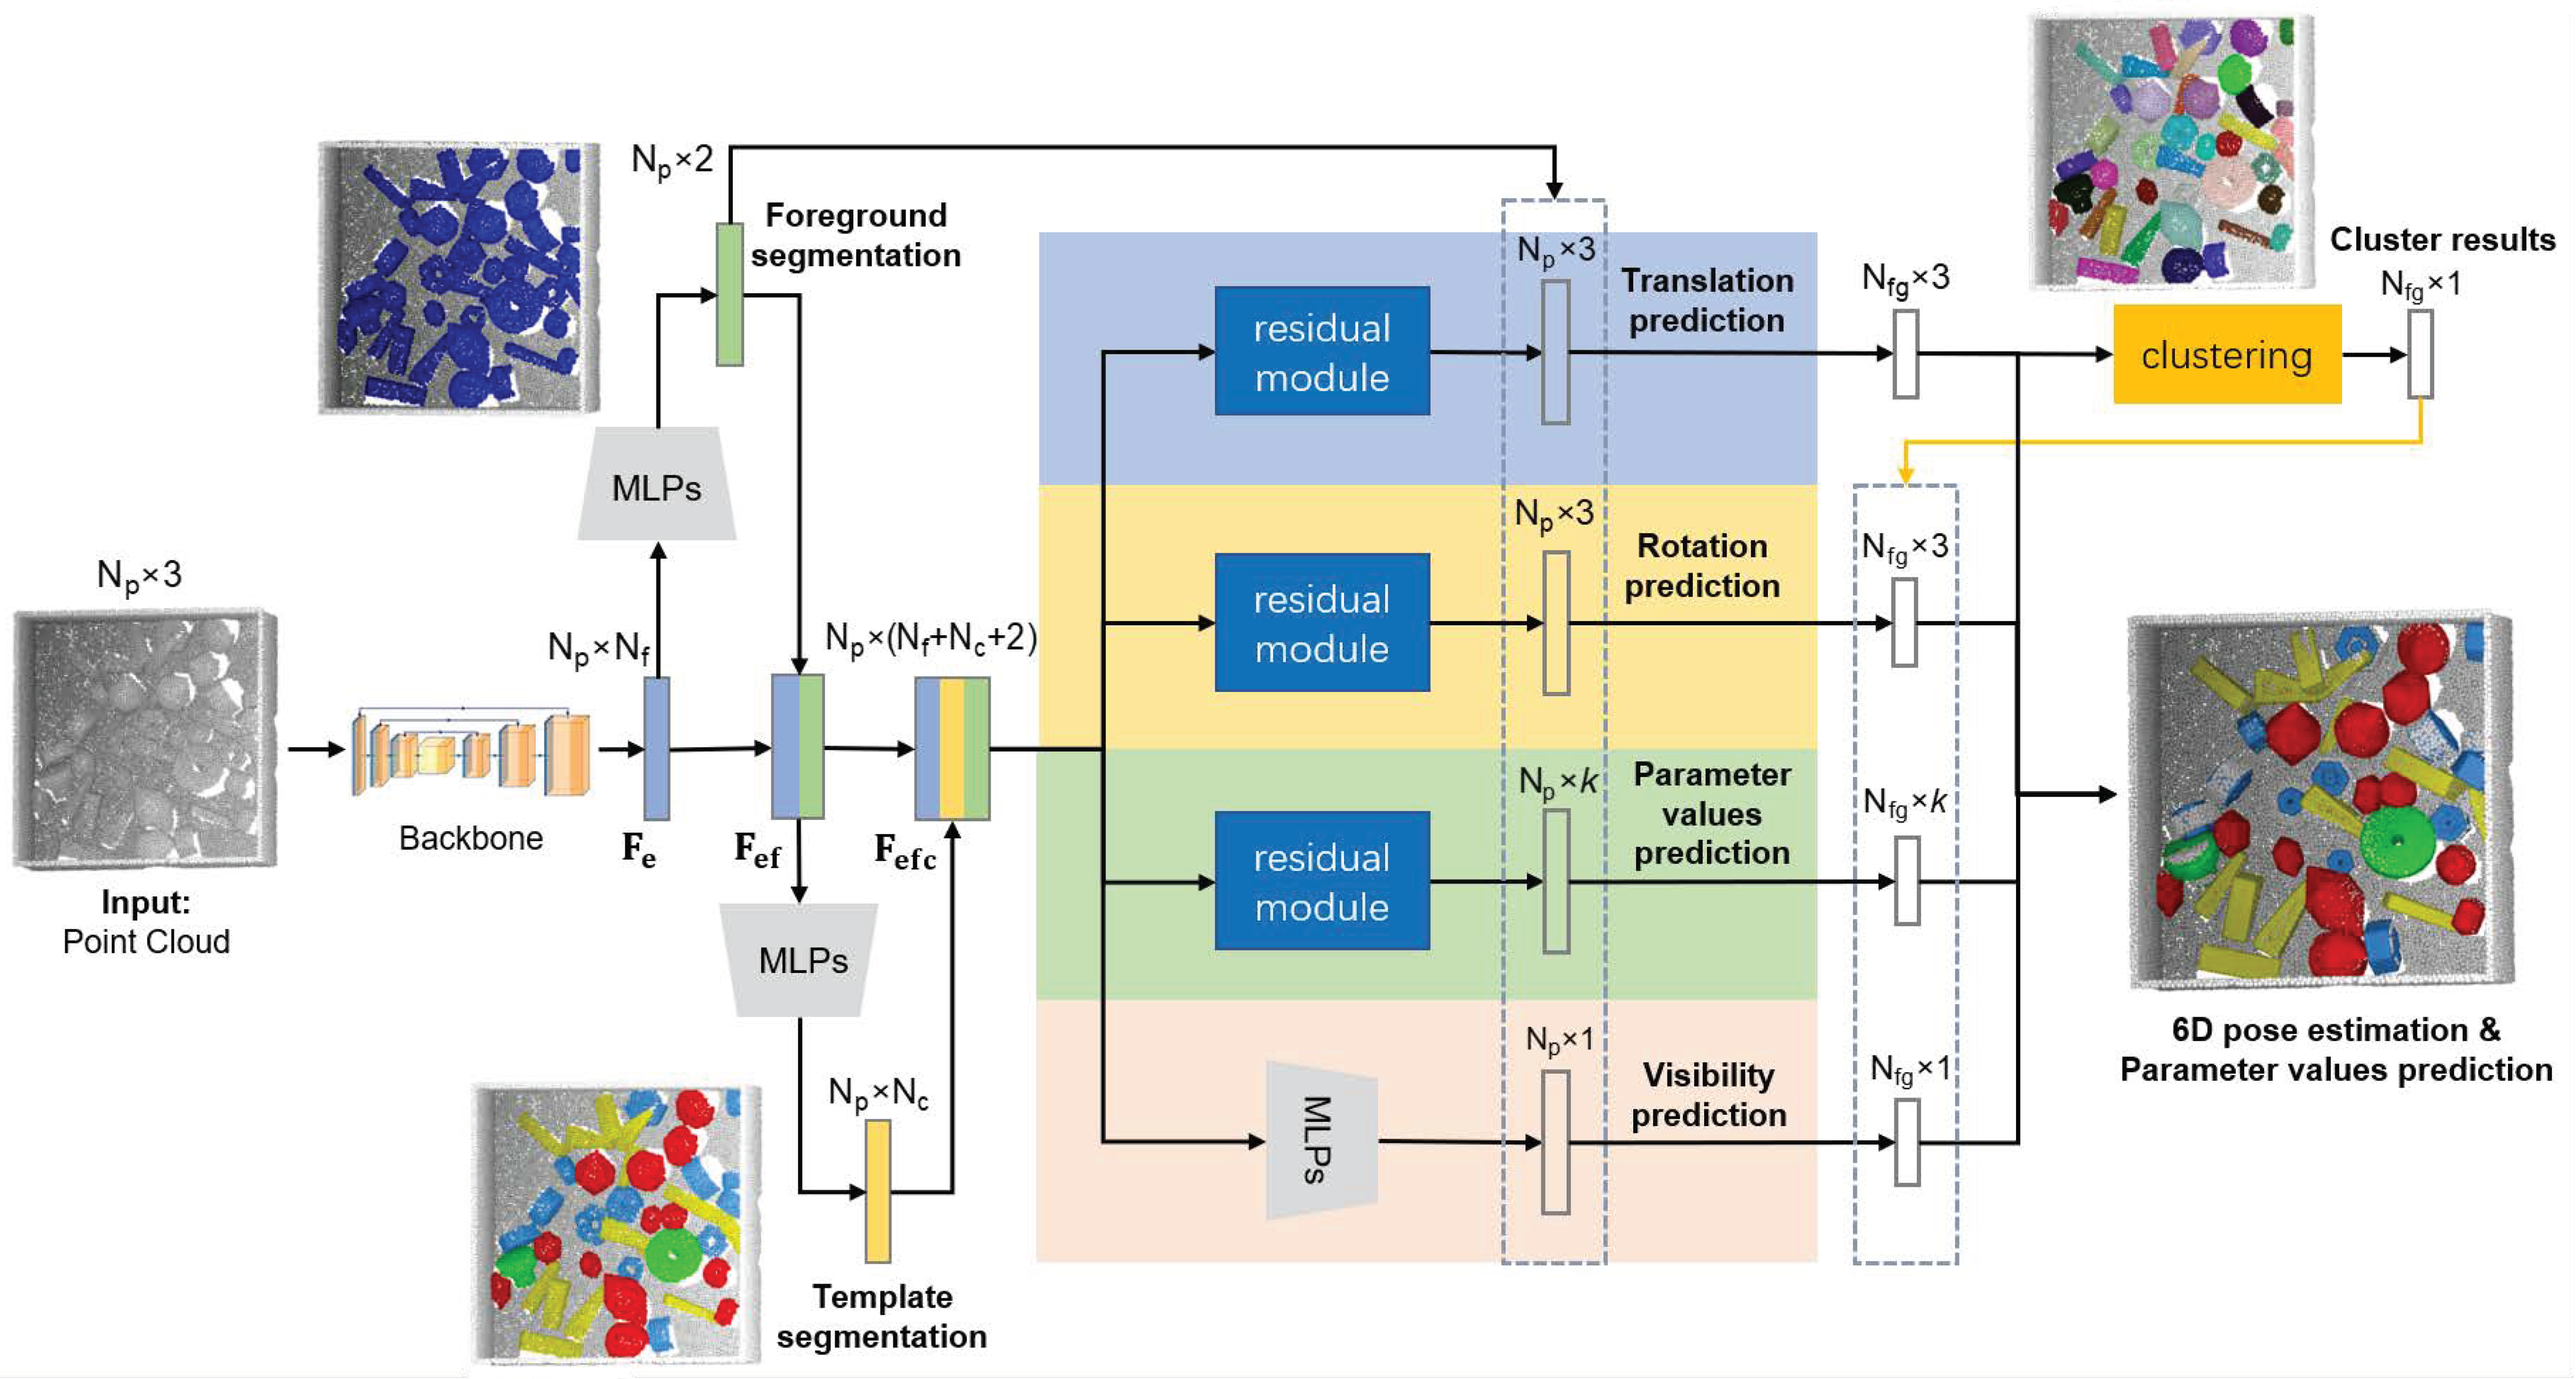
To solve the lack of method for stacked scenarios of parametric part objects from multiple templates, we propose a new network with residual modules as our baseline method, Multi-templates Parametric Pose Network, donated as MPP-Net. MPP-Net can jointly achieve foreground segmentation, instance segmentation, template segmentation, 6D pose estimation and parameter values prediction. As shown in
Figure 1b, MPP-Net takes unordered point cloud as the input, and first predicts the foreground points in the scene. Then, similar to [
3,
18,
19], we predict point-wise template, parameter values and 6D pose. To improve the accuracy of our method, we also design the residual modules for the prediction of translation, rotation and parameter values. In our experiments, MPP-Net is evaluated on our Multi-Parametric Dataset for the learning and generalization abilities evaluation, respectively.
To the best of our knowledge, compared with existing datasets and methods for 6D pose estimation, we propose the first public RGB-D dataset and the first deep learning network to jointly achieve 6D pose estimation and parameter values prediction. Besides, we set the evaluation metrics and provide the benchmark results for our dataset.
In summary, the main contributions of our work are:
We construct a new dataset with evaluation metrics for stacked scenarios of parametric part objects from multiple templates.
We propose a new network to provide benchmark results, which jointly achieves foreground segmentation, instance segmentation, template segmentation, 6D pose estimation and parameter values prediction.
3. Dataset
In this section, we will introduce our new dataset, Multi-Parametric Dataset, targeting 6D pose estimation and parameter values prediction for stacked scenarios of parametric part objects from multiple parametric templates.
3.1. Dataset Description
Our dataset is completely generated automatically by simulation techniques. The synthetic stacked scenes are constructed by the physics engine, and the annotations are obtained by the virtual camera in the rendering engine. As mentioned in [
29], the simulation dataset can perform well on the real test set through the domain transfer.
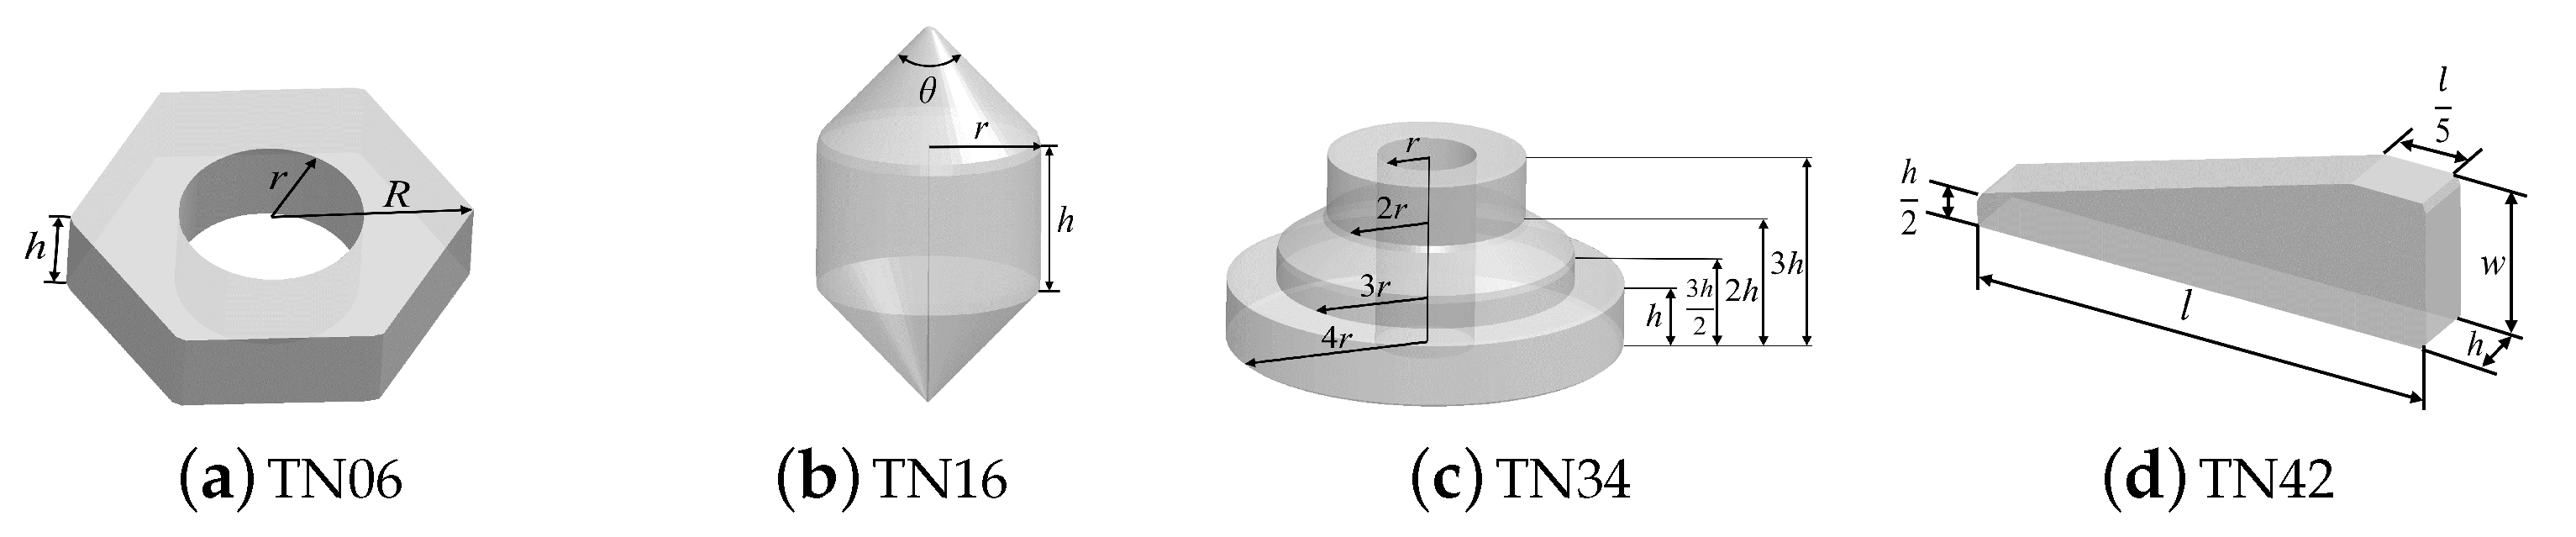
We select four parametric templates in Zeng’s database [
1], including TN06, TN16, TN34, and TN42, as shown in
Figure 2. They represent the symmetry types commonly existing in industrial scenarios. For a parametric template with
p parameters, we sample
k (
) values for each one within a certain range. Then we instantiate it into
different part objects to construct a 3D model library where the models are selected to construct our synthetic stacked scenes.
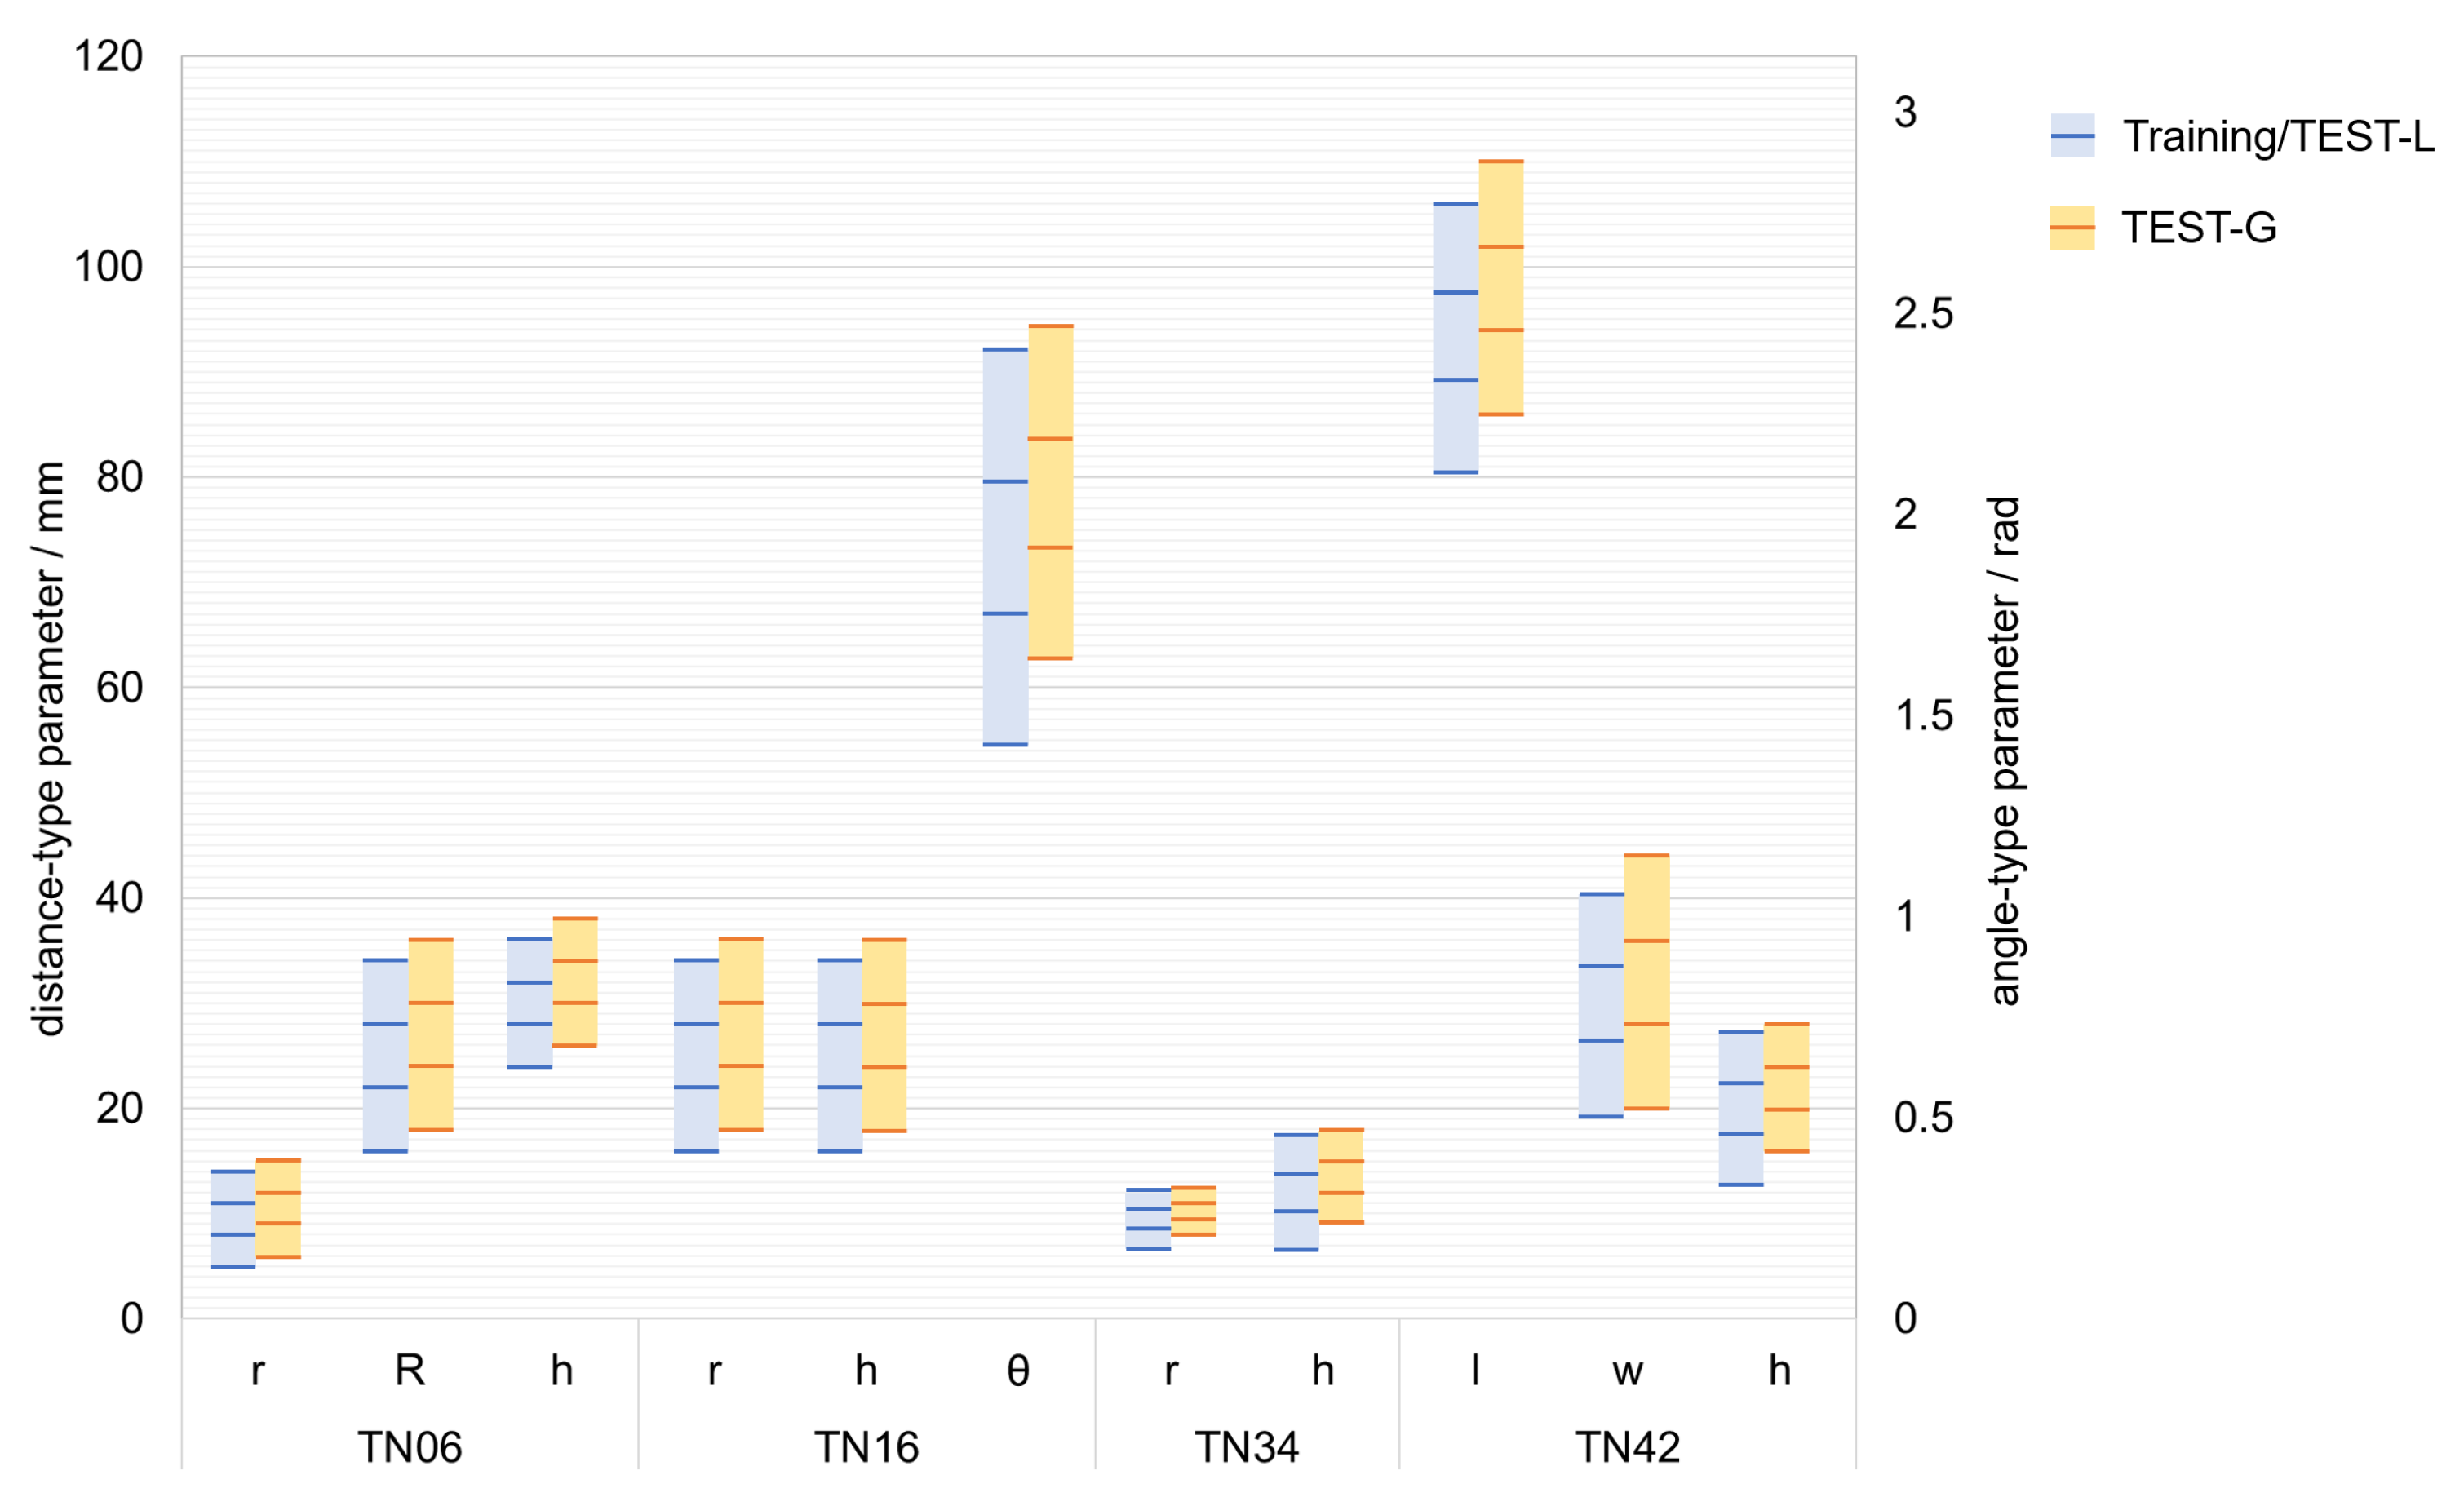
The dataset is divided into a training set (50K scenes) and a test set (2K scenes). The test set comprises TEST-L (1K scenes) where part objects’ parameter values are the same as those of the training set and TEST-G (1K scenes) where part objects’ parameter values are different from those of the training set. The two test datasets are set up to evaluate the learning ability and generalization ability, respectively. The parameter values distribution of part objects in the dataset is shown in
Figure 3. The rectangular regions represent the sampling ranges of the parameter values, and the lines represent the sampled parameter values.
The ground truth annotations comprise template labels, segmentation masks, translation labels and rotation matrix labels relative to the camera frame, visibility labels , and parameter values labels, for each instance in a scene.
3.2. Synthetic Data Generation
We build a 3D model of the bin with a size of 50 × 50 × 15 cm which is randomly rotated at an angle around the axis perpendicular to the ground in each scene to increase the variety of the dataset. Then we extract randomly one part object from the model library
n (
) times with the place back. So the number of objects in a scene is
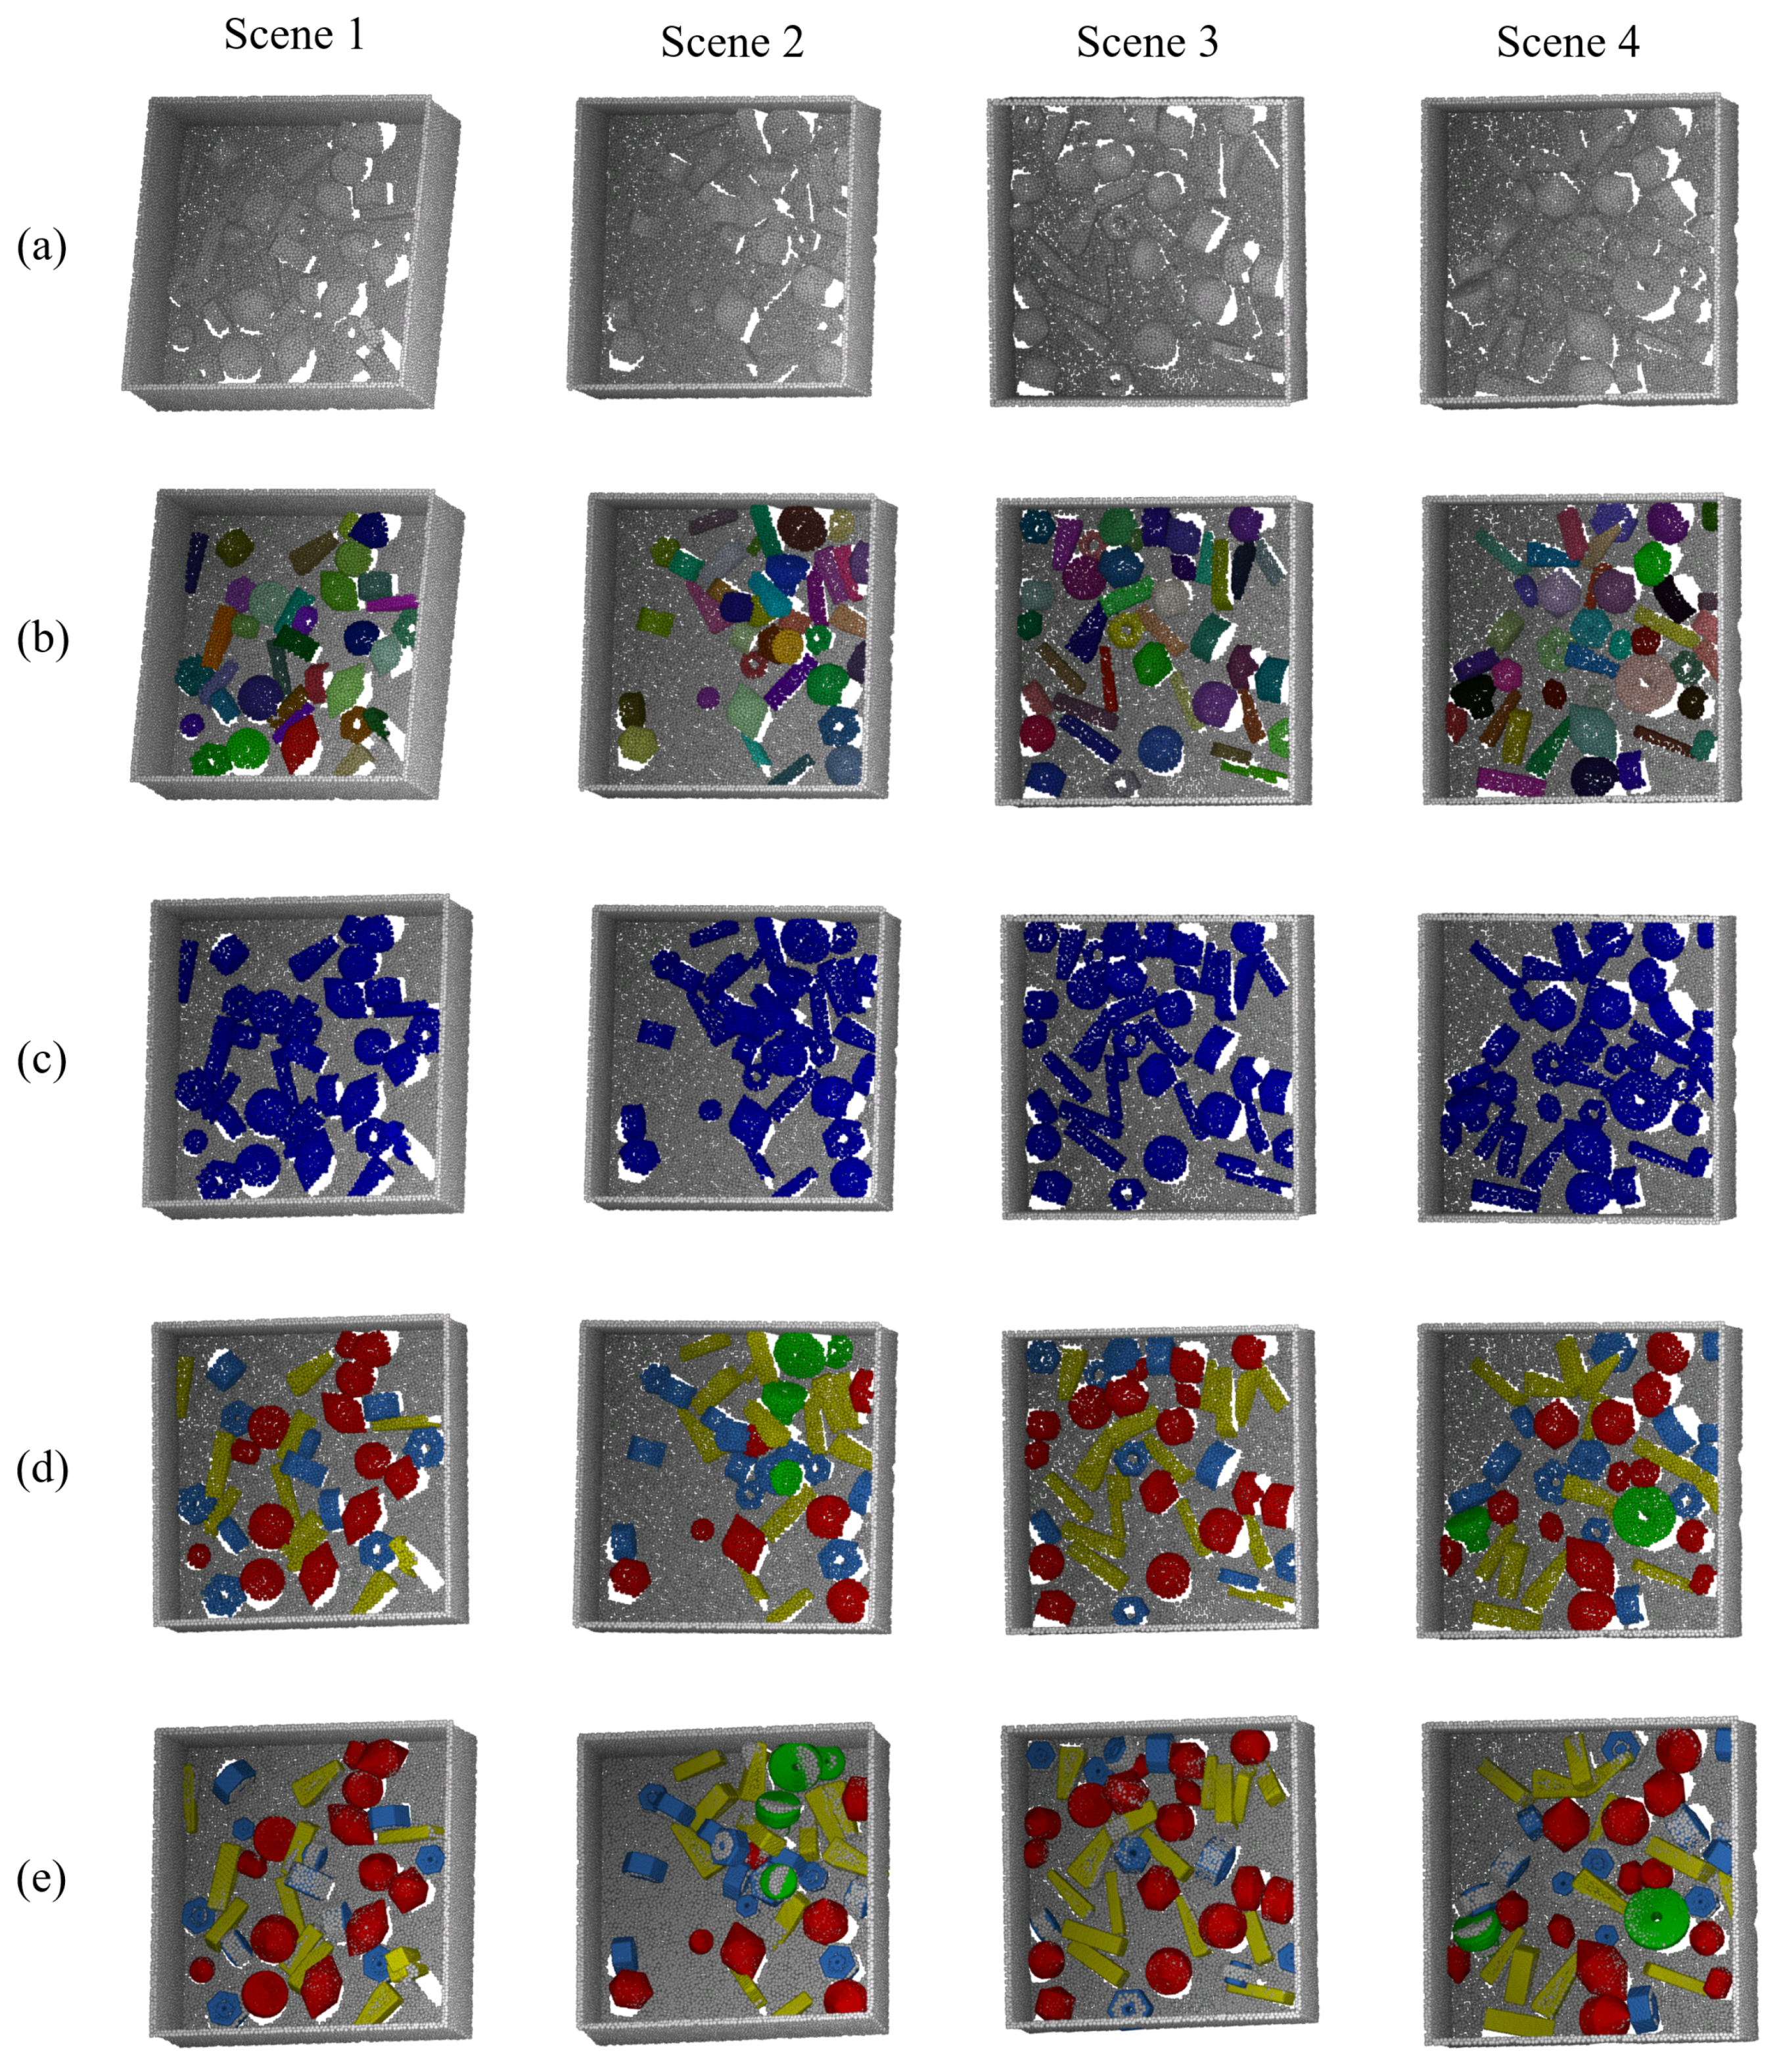
n and the number of each part object in a scene may be more than one. A physical simulation engine, i.e., Bullet, is used to simulate the free fall motion and collision of the objects to generate a typical stacked scene, where the labels of the bin and part objects are obtained automatically. Repeating the above process, we can generate different synthetic scenes. After rendering each scene through the render engine, i.e., Blender, we obtain an RGB image, a depth image, a segmentation image, and a set of images with each individual object for each scene. All the results are saved for the perspective and orthogonal version, as shown in
Figure 4.
The RGB information of the synthetic scenes is stored in the RGB images. The depth information of each pixel is stored in the depth image as 16 bit unsigned integer format (unit16). The segmentation images store the instance information to its corresponding pixels. In addition, we save a set of mask images for each individual instance without occlusion in a scene to calculate their corresponding pixel number. Intuitively, we regard the degree of visible surface of the
ith (
) instance in the scene as its visibility
:
where
is the pixel number of the
ith instance in the segmentation image, and
is the pixel number of the
ith instance in its own mask image.
3.3. Evaluation Metrics
Our dataset is designed for the evaluation of foreground segmentation, template segmentation, 6D pose estimation, and parameter values prediction.
For evaluation of foreground segmentation and template segmentation, we use mean Intersection over Union (mIoU) as the evaluation metric, which is calculated by the ratio between the intersection and the union of ground truth and predicted segmentation results. The IoUs are calculated on each class and averaged to get mIoU as follows:
where
is the number of the class,
is the point which is predicted as
jth class and the ground truth is
ith class.
For evaluation of 6D pose estimation, we regard the instances as true positive, whose error is less than
m cm for translation and
for rotation similar to [
33,
34]. Given the rotation label
and translation label
, and the predicted rotation
and translation
, the error of rotation and translation
and
can be, respectively, computed by:
In particular, for the template with finite symmetry,
can be computed by:
where
is the set of rotation matrix
that has equivalent effect on a object. For the template with revolution symmetry, we assume that the object is symmetric on the
z axis of the object’s local frame. So we can abstract it as a unit vector
along the
z axis, and
can be computed by:
For evaluation of parameter values prediction, we regard the instance as true positive whose relative error of all the parameter values are less than
. Given the ground truth of the
sth parameter
, and the predicted
sth parameter
, the error of the
sth parameter
can be computed by:
For 6D pose estimation and parameter values prediction, only the poses of objects that are less than 60% occluded are relevant for the retrieval. The metric breaks down the performance of a method to a single scalar value named average precision (AP) by taking the area under the precision-recall curve. Then the mean average precision (mAP) is adopted as the final evaluation metric computed by the average of the APs of all the parametric templates.
4. Baseline Method
In this section, we propose a new network with residual modules, Multi-templates Parametric Pose Network, donated as MPP-Net. This baseline method can jointly achieve foreground segmentation, instance segmentation, template segmentation, 6D pose estimation, and parameter values prediction. The architecture of our network is shown in
Figure 5. Firstly, the point-wise features of the point cloud are extracted by a backbone network, e.g., Pointnet [
35], Pointnet++ [
36], and PointSIFT [
37]. The backbone network takes unordered point cloud of the scene with size of
as input to produce a point-wise feature
with size of
. Then foreground segmentation and template segmentation are achieved with
and
, respectively. Furthermore, the 4 branches which consume the enhanced feature
with shared multi-layer perception (MLP) and residual modules, can jointly obtain foreground segmentation result, template segmentation result, translation prediction, rotation prediction, parameter values prediction, and visibility prediction for each point. Thus, the loss function of our network is the sum of each part loss with their own weight:
where
,
,
,
,
,
are the loss of the parts, and
,
,
,
,
,
are the loss weights for different parts.
4.1. Foreground Segmentation
For stacked scenes consisting of the bin and part objects, the point cloud in the scene need to be divided into foreground and background, since only the foreground point cloud are what we concern. We feed the embedded feature
into MLPs to produce point-wise foreground segmentation result
with size of
. The elements
,
are the probability of the
ith point belonging to background and foreground, respectively. The loss
is the binary cross entropy softmax loss:
where
represents foreground segmentation label of the
ith point:
4.2. Template Segmentation
It is one of the important tasks for recycling scenarios to distinguish parts belonging to different templates, which is also an important prerequisite for 6D pose estimation and parameter values prediction. Therefore, we design a template segmentation branch to identify templates to which the point belongs. Since the foreground segmentation information might be useful for other tasks, so we concatenate
and
to produce a feature
with size of
as the input of the template segmentation branch. Then we feed
into MLPs to produce point-wise template segmentation results
with size of
. The element
represents probability of the
ith point belonging to the
jth template. In order to avoid the influence of background points during training phrase, only the foreground points are considered when applying the cross entropy softmax loss
:
where
is the number of the foreground points,
is the number of the templates, and
represents the template label of the
ith point:
Due to segmentation information may be beneficial to other tasks, so we concatenate and to produce a feature with size of as the input of the following branches.
4.3. Translation Branch
This branch is used to predict the translation of instances and achieve instance segmentation. Since the local frame origin of the object is its centroid in our dataset, the translation is the centroid coordinate in the scene. We feed
into MLPs to regress the point-wise offsets to the centroid of the instance to which each point belongs. Then the predicted centroids with size of
is calculated by adding the offsets to the point cloud. The loss
considering foreground points only is
loss between predicted centroids and centroid labels:
where
and
are point-wise labels and predicted centroids of the instance to which the
ith foreground point belongs. To make the most of the information we extract from the backbone network, we add MLPs which consume
to regress the residual
between predicted centroids and centroid labels to improve our prediction results. However, in fact, ground truth of the residual is unknown. Similar to [
38], we set the optimal target of the residual
by online learning and the loss
is
loss:
Furthermore, the total loss of the translation branch is the sum of two loss:
The residual module comprises two independent MLPs to jointly regress the coarse prediction and the residual prediction to obtain the accurate prediction
, as shown in
Figure 6.
Similar to [
3,
18,
19], we believe that if the points belong to the same instance, then the centroid predictions of these points will be close in the centroid space. During inference, we cluster the points in the centroid space into
D clusters, i.e.,
D instances, by the unsupervised learning clustering method. Finally, the final centroid of each instance with the final size of
is obtained by Hough voting in each cluster.
4.4. Rotation Branch
Similar to the translation branch, we feed
into the residual module to regress the point-wise rotation prediction of the instance to which each point belongs. There are many representations for rotation, such as quaternion, rotation matrix, Euler angles, and axis-angle. Gao et al. [
39] proposed that the axis-angle representation is a better choice for rotation, and Dong et al. [
18] proved that their point-wise pose regression framework has almost the same results by learning Euler angles and axis-angle. Therefore, Euler angles are chosen to learn which is more intuitive for humans.
The loss function for rotation prediction adopts the pose distance proposed by Romain Brégier et al. [
40], which is calculated by the pose vectors with at most 12 dimensions in Euclidean space for different types of object symmetry. Let the set
represents the vectors (at most 9 dimensions) of the equivalent poses of the rotation matrix
. The distance between two rotation vectors, i.e.,
, can be represented as follows:
The rotation of the instances are obtained by a residual module which comprises of two MLPs. One MLPs aims to regress point-wise Euler angles
,
,
directly, and then they are converted into the coarse predicted rotation matrix:
Therefore, the loss
is the sum of rotation distance of different templates between the coarse predicted rotation and the rotation labels:
where
is the number of the foreground points belonging to the
jth template. The other one MLPs aims to regress the residual Euler angles
,
,
, and then they are converted into the accurate rotation matrix by adding them to
,
,
:
The loss
is the sum of rotation distance of different templates between the accurate predicted rotation and the rotation labels:
Furthermore, the total loss of the rotation branch is the sum of the two loss:
During inference, the foreground point-wise rotation results with size of are divided into D clusters according to the instance segmentation result. Then, the final predicted rotations with size of is obtained by Hough voting in each cluster.
4.5. Parameter Values Branch
When we recycle the parametric part objects, we need to sort them according to the different parameter values. So we need to predict the value of each parameter for each part object. The feature
is fed into the residual module to regress
k parameter values of the instance to which each point belongs. The two loss considering only the foreground points
,
are
loss and the sum is the total loss of this branch:
where
,
,
are coarse predicted parameter vectors, ground truth parameter vectors, and the residual parameter vectors with
k parameter values for the instance to which the
ith foreground point belongs. Furthermore, we can obtain the accurate parameter values
. During inference, the foreground point-wise parameter values are divided into
D clusters in the parameter space according to instance segmentation result. Then, each cluster’s points votes for the final predicted parameter values for each instance with size of
.
4.6. Visibility Branch
In typical stacked scenarios, we are not interested in the instances with heavy occlusion since they are difficult for robots to grasp. In addition, severely occluded instances only have very limited local information, which is likely to damage the performance of the network. So we filter out these instances by a visibility threshold
. Similar to other branches, we feed
into MLPs to regress the visibility result with size of
of each point, and divide the foreground point-wise results into
D clusters. Then each cluster’s points votes for the final predicted visibility for each instance with size of
. The loss
for the visibility branch is
loss:
where
and
are the point-wise visibility labels and predicted visibility.


