Article

Surface Integrity of Austenitic Manganese Alloys Hard Layers after Cavitation Erosion

by
Ion Mitelea
1,
Ilare Bordeașu
2,
Daniel Mutașcu
1,
Corneliu Marius Crăciunescu
1 and
Ion Dragoș Uțu
1,*
1
Department of Materials and Fabrication Engineering, Politehnica University Timisoara, Bulevardul Mihai Viteazul nr.1, 300222 Timisoara, Romania
2
Department of Mechanical Machines, Equipment and Transports, Politehnica University Timisoara, Bulevardul Mihai Viteazul nr.1, 300222 Timisoara, Romania
*
Author to whom correspondence should be addressed.
Lubricants 2024, 12(10), 330; https://doi.org/10.3390/lubricants12100330
Submission received: 29 August 2024 / Revised: 19 September 2024 / Accepted: 25 September 2024 / Published: 26 September 2024

Abstract

:
Cavitation erosion, as a mechanical effect of destruction, constitutes a complex and critical problem that affects the safety and efficiency of the functioning of engineering components specific to many fields of work, the most well-known being propellers of ships and maritime and river vessels, seawater desalination systems, offshore oil and gas drilling platforms (including drilling and processing equipment), and the rotors and blades of hydraulic machines. The main objective of the research conducted in this paper is to experimentally investigate the phenomenology of this surface degradation process of maritime ships and offshore installations operating in marine and river waters. To reduce cavitation erosion of maritime structures made from Duplex stainless steels, the study used the deposition by welding of layers of metallic alloys with a high capacity for work hardening. The cavitation tests were conducted in accordance with the American Society for Testing and Materials standards. The response of the deposited metal under each coating condition, compared to the base metal, was investigated by calculating the erosion penetration rate (MDER) through mass loss measurements over the cavitation duration and studying the degraded zones using scanning electron microscopy (SEM), the energy-dispersive X-ray analysis, and hardness measurements. It was revealed that welding hardfacing with austenitic manganese alloy contributes to an approximately 8.5–10.5-fold increase in cavitation erosion resistance. The explanation is given by the increase in surface hardness of the coated area, with 2–3 layers of deposited alloy reaching values of 465–490 HV5, significantly exceeding those specific to the base metal, which range from 260–280 HV5. The obtained results highlighted the feasibility of forming hard coatings on Duplex stainless-steel substrates.

1. Introduction

The phenomenon of cavitation has been recognized since the 18th century, particularly by engineers and shipbuilders. In 1754, the Swiss mathematician Euler first noted its potential impact on the performance of hydraulic rotors [1]. This kind of process is damaging and results in large losses, particularly when it comes to the operation of marine vessels [2].
The research by Ge et al. [3] shows that, from a hydrodynamic perspective, the intensity of cavitation depends on the difference between the saturated vapor pressure and the local pressure, as well as on the degree of turbulence and the temperature of the liquid medium. In hydraulic machines, an increase in these values amplifies the intensity of cavitation by reducing energy efficiency, increasing vibration levels, and intensifying erosion [4].
Cavitation erosion is a serious issue, particularly when there are changes in flow hydrodynamics in pump and turbine rotors, as well as those induced by propellers of boats and maritime/fluvial vessels at specific speeds.
Furthermore, it can happen in the human body when there is a traumatic brain injury, which results in a pressure shift in the brain agar phantom. It can also happen when there are pressure fluctuations in the fluid that surrounds the knee and heart joints [2,5,6,7,8,9,10,11].
Maritime vessels are heavily affected by cavitation in harsh marine environments with strong chemical reactions. Therefore, numerous countermeasures are taken to avoid or reduce cavitation. The most prominent examples are maritime/fluvial vessels and boats, which can reduce the rotation speed of their propellers and, consequently, the speed of the vessel. Submarines, to raise the final pressure of the propeller above that of the liquid vapors, can make several adjustments by reducing their propulsion system or by submerging into a region with higher pressure [5,6,7].
At the same time, the cavitation erosion phenomenon has been used beneficially in certain cases. One such situation is in welding and applications. This is the case with Kaplan hydraulic turbines, which operate in an industrial cavitation regime (accepted) where the erosion created on the blades is corrected by welding after a preset number of hours. Another example is in underground drilling applications, where process mixing techniques are used, in which the turbulence associated with cavitation is advantageous [9,10].
The material selection process for constructing propellers, boats, and maritime vessels considers physical and chemical properties, manufacturing and maintenance costs, lifespan, working environment, etc. Among the mechanical properties, the most important ones are tensile strength, yield strength, hardness, toughness, ductility, and fatigue limit [8].
The first widely used materials for components such as propellers, boats, ships, etc., were cast iron, but their low mechanical properties alongside the high risk of corrosion and erosion made them less than ideal for such applications. Nowadays, the most commonly used materials are stainless steels and copper-based alloys, such as aluminum-nickel or manganese bronzes [5,6,7,8,9,10,11].
Stainless Duplex steels exhibit high corrosion resistance and significant hardening capacity through cold plastic deformation. In equilibrium state, they have a microstructure consisting of approximately 50% ferrite (F) and 50% austenite (A).
The interaction of the main alloying elements in their chemical composition is quite complex. Alongside achieving a structural balance of the two phases (F and A), the formation of hard and brittle intermetallic compounds (Sigma σ, Chi χ, Cr2N nitrides, carbides, M23C6, etc.) that affect toughness and corrosion resistance must be avoided [12,13,14,15,16]. The main characteristic of these steels, which sets them apart from ferritic or austenitic stainless steels, is the combination of properties offered by the two structural phases, austenite and ferrite. In most cases, they are harder than ferritic stainless steels, and their mechanical strength can be double that of austenitic stainless steels in some cases. Moreover, they are extremely corrosion-resistant, with high resistance to intergranular corrosion, especially due to the alloy’s nitrogen content [17]. Even in chloride and sulphur environments, Duplex stainless steels exhibit very high resistance to stress corrosion cracking, a property they “inherit” from the ferrite phase. When common austenitic stainless steels like AISI 304 L and AISI 316 L kinds are exposed to specific conditions, such as chloride, humidity, high temperatures, etc., stress corrosion cracking can become a significant issue [18,19,20].
The main alloying elements of these steels can be classified as ferrite formers (Mo and Cr) and austenite stabilizers (Ni and N). The carbon content must be low to avoid carbide precipitation.
Analyzing the individual role of each element, Cr is extremely important for corrosion resistance, as well as for mechanical, chemical, and microstructural properties. A Cr concentration of over 10.5% promotes the formation of a 10–20 nm thick film, called a passive film or layer, on the alloy’s surface, making the corrosion rate negligible. While austenitic stainless steels contain at least 18% Cr, Duplex steels have over 22% Cr. Its action in stabilizing the ferritic phase with a body-centered cubic (bcc) crystal lattice is accompanied by the promotion of harmful intermetallic compound formation, which adversely affects the usability properties [13].
Molybdenum is another significant alloying element in the chemical composition. Abreu et al. [15] found that Mo stabilizes the alloy’s passivity and enhances resistance to pitting corrosion and crevice corrosion of Duplex stainless steels in chloride-containing environments. Like Cr, Mo is also a ferrite former and increases the tendency of these stainless steels to form intermetallic phases. As a result, the amount of Mo is restricted to roughly 7.5% in austenitic stainless steels and 4% in duplex stainless steels.
Alloying with nitrogen and nickel (Ni), elements that form austenite, promotes a change in the crystalline structure of stainless steel from bcc lattice specific to ferrite to the face-centered cubic (fcc) lattice of austenite (Figure 1). In austenitic stainless steels, nickel aids in delaying the production of hazardous intermetallic phases; however, in duplex stainless steels, nitrogen is a far more effective inhibitor. Although the effectiveness of Ni in delaying the precipitation of harmful phases is lower than that of nitrogen, it is indispensable, on one hand, for obtaining austenite and, on the other hand, for compensating for the tendency of sigma phase formation.
Ferritic stainless steels do not contain nickel or have a low content of this element. In contrast, austenitic stainless steels contain at least 8% Ni, while Duplex steels have an intermediate Ni content (4–7%).
Chromium nitrides separate within ferrite grains and at their borders, as well as between ferrite and austenite grains, because of the usage of nitrogen as an alloying element in these stainless steels.
The potential applications of Duplex stainless steels, where cavitation erosion occurs, include equipment for seawater desalination, offshore drilling platforms, some installations for the chemical industry, equipment for the food industry, etc. Several research studies have shown a considerably lower resistance to cavitation erosion compared to other stainless steels [9,10,11].
Thus, Ai et al. [21] have shown that a method to improve cavitation erosion behavior in Duplex stainless steels is spinodal decomposition. They emphasized that ferrite is more susceptible to cavitation erosion than austenite, the damage initiates at the phase boundaries of the two phases, ferrite/austenite, and propagation occurs in the ferrite regions. Austenite grains act as barriers to cavitation propagation.
Escobar et al. [22] used friction stir processing to modify the microstructure of Duplex stainless steels. The enhanced resistance to cavitation erosion can be attributed to the improved microstructure that arises from recrystallization and the alteration of elongated α/γ interfaces.
Mesa et al. [23] demonstrated that applying a high-temperature gas nitriding treatment (1200 °C) followed by low-temperature plasma nitriding (400 °C) to Duplex stainless steel UNS S31803 significantly improves cavitation erosion resistance. The results, showing approximately a nine-fold increase in the minimum incubation time and reduced mass loss, were compared with those of UNS S30403 stainless steel subjected to plasma nitriding treatment.
Shuji Hattori and Ryohei Ishikura [24] analyzed data regarding the cavitation erosion resistance of ferritic, austenitic, Duplex, and martensitic stainless steels tested under different conditions. It was found that the correlation between cavitation erosion resistance and hardness was better than that achieved with other mechanical properties.
Currently, there is a wide variety of coating techniques and heat treatment, mechanical, thermochemical, and combinations thereof, being researched to improve cavitation erosion resistance. In this direction, the present study examines phenomenological issues related to pulsed current welding deposition of manganese austenitic alloys on Duplex stainless-steel substrates. According to the authors’ knowledge, there are no available reports on the use of pulsed current welding process for depositing layers of such alloys to enhance cavitation erosion resistance. The novelty of the work consists in introducing the process of manual pulsed current welding for the physical modification of the surface of parts subjected to cavitation erosion, the innovation being related to the selection and cavitation testing of a deposited material from an alloy sensitive to work hardening. The scientific contribution of this work lies in the scientific substantiation of the influence of this hardfacing welding process on the changes in chemical composition and microstructure in the first and last layer of the surface coating. Additionally, it highlights the interface reactions between the deposited coating and the substrate under the action of thermal shock induced by the welding process, which involves the complete melting of the filler material and the partial melting of the base material.

2. Materials and Experimental Details

Duplex 2205 stainless steel is the material that is being experimented with in this study. The austenite manganese alloy CITOMANGAN electrode with basic coating was used as filler material. It is advised to use this electrode when applying wear-resistant layers in situations involving severe shocks and impacts.
One, two, or three layers of this filler material were deposited on the steel substrates using the Fronius MAGIC WAVE 300 universal welding power source, which enables manual welding with pulsed current using coated electrodes. The selection of the proposed welding process was based on the advantage provided by pulsed current, namely, the ability to easily control dilution during welding through the precise regulation of the energy input. Additionally, the exceptional quality of the deposited metal and the minimized risk of lack of fusion between the base metal and the filler material, or between passes in the case of multi-layer deposits, were significant factors. These characteristics can contribute to the refinement of grain size and microstructure, thereby increasing resistance to cavitation.
Following preliminary tests, the following values of the welding conditions and technological parameters were established:
-
Basic coated electrode: CITOMANGAN
-
Electrode diameter: 3.25 mm
-
Polarity: DC+
-
Pulse current, Ip: 180 A
-
Base current, Ib: 90 A (50% of Ip)
-
Average current, Im: 135 A
-
Arc voltage, U: 22 V
-
Pulse frequency, f = 1/tc = 5 Hz
-
Cycle time, tc = 1/f = 1/5 = 0.2 s
-
Pulse time, tp = 0.5 tc = 0.1 s
-
Base time, tb = 0.5 tc = 0.1 s (tp = tb)
-
Arc length, la = 3.0 mm
-
Welding rate, v = 27–28 cm/min.
During welding, a calibrated data acquisition system was used to measure and monitor the values of current and voltage. Since the weldability of duplex stainless steels is considered inferior to that of austenitic stainless steels, the temperature between two successive passes was maintained at approximately 150–200 °C to avoid the precipitation of nitrides and other intermetallic compounds [13,14,18,19]. Most of the weldability issues in Duplex stainless steels arise from the reduction in the amount of austenite, especially in the fusion zone (FZ) and the heat-affected zone (HAZ), and from the precipitation of these embrittling phases. Due to their chemical composition, upon heating, the microstructure of these steels completely transforms into ferrite at approximately 1300–1400 °C and remains so until the melting temperature. Therefore, during the welding process, the HAZ at high temperatures transforms entirely into ferrite and undergoes a significant increase in crystalline grain size. Upon cooling, austenite re-forms, mainly at the boundaries of the ferrite grains with plate morphology (Widmanstätten austenite).
Before applying the first layer, the substrate surface was sanded with 120 grit SiC paper and cleaned with acetone. After each layer was applied, the surface was cleaned using a wire brush.
The process of applying the first layer was carried out in air, maintaining the temperature of the samples at 200 ± 10 °C. When applying the second and third layers, the deposition of layers 2 and 3 took place after the samples were introduced into a box with water, considering the welding behavior of austenitic manganese steel. Additionally, immediately after the welding deposition, the surface was hammered (struck) for 3–5 min using a pneumatic chisel. The hammering frequency of the pneumatic chisel was 2–3 Hz.
The first layer to be deposited had an average thickness of around 2 mm, but the second and third layers had average thicknesses of 1.5 to 1.8 mm for each. The surface hardness of the coating made of the considered alloy was 300–360 HV5 for the first deposited layer and 465–490 HV5 for the subsequent layers, which were not affected by dilution. The reference material exhibits hardness values ranging from 260 HV5 to 280 HV5. The hardness measurements were performed on sets of three samples for each structural state.
The next operation aimed to execute, through machining, a set of three samples with one deposited layer, two deposited layers, and three deposited layers, which were used for conducting ultrasonic cavitation tests. The geometry of the cavitation samples is shown in Figure 2.
Before starting the cavitation experiment, the attack surfaces (frontal) were polished to a roughness of Ra = 0.2 ÷ 0.8 μm.
Cavitation erosion of the sample surfaces was generated in the vibrating apparatus with piezoceramic crystals, located in the Cavitation Laboratory of the Polytechnic University of Timisoara (Figure 3). In vibratory cavitation, the erosive intensity, as specified in ASTM G32-2016, for the use of a liquid with constant temperature and a constant diameter of the experimental specimen, depends on the vibration parameters and the power of the ultrasonic generator. Throughout the experiments, the cooling of the samples was achieved using a system equipped with a coil through which water circulated. The water temperature was controlled within the range of 22 ± 1 °C by a digital refrigerator to which the cooling pipe was connected. This refrigerator was also connected to the computer that manages the experimental program and controls all the cavitation process parameters. Over the period of the study, the apparatus’s functional parameters were maintained at the design values and as prescribed by ASTM G32-2016 standards [25].
The functional parameters of the apparatus are as follows:
  • Installed power: 500 W
  • Vibration frequency: 20 kHz
  • Vibration amplitude: 50 μm ± 5%
  • Supply voltage: 220 V/50 Hz
  • Working fluid: tap water
In accordance with laboratory protocol, the time of cavitation attack was 165 min, split into periods of 5 and 10 min each, as well as 10 periods of 15 min each.
Afterward, the samples were sectioned longitudinally and prepared for metallographic examination through a series of grinding, polishing, and chemical etching processes.
Microstructural examinations were conducted with the scanning electron microscope, focusing on the marginal layer where cavitation erosion cracks initiate and propagate.

3. Discussion of the Experimental Results

3.1. Cavitation Curves

To monitor and analyze the behavior of metal alloys under cavitation attacks, specific diagrams were constructed, displaying the experimental values of the mean depth erosion rate (MDERi) as well as the MDER(t) curves for mediating/approximating these values. The relationships used have the following forms:
-
For the mean depth erosion rate during an intermediate period,
MDERi = ΔMDEi/Δti [mg/min]
-
For the analytical curve mediating of the experimental values obtained for the mean depth of erosion rate [25,26],
MDER(t) = A·(1 − e−B·t) + A·B·t·e−B·t
where ΔMDEi is the experimental value of the mean depth of erosion achieved during intermediate period “i”, determined based on the mass lost by the sample during this period; it is calculated using the following equation:
MDE i = 4 M i ρ π d p 2   [ µ m ]
where I represents the period number of testing (for i = 1, Δti = 0, ΔMi = 0); ΔMi is the mass of material lost through erosion in period i, in grams; Δti is the duration of intermediate period i of cavitation (5, 10, and 15 min); dp is the diameter of the cavitated surface (15.8 mm); ρ is the density of the steel (7.81 kg/dm3); A is the scale parameter, statistically determined based on experimental values; and B is the shape parameter of the curve, statistically determined based on experimental values.
The Cavitation Erosion Research Laboratory in Timisoara produced a model, which served as the basis for determining the values of parameters A and B in the Matchad program [24,25].
As it is known, the destructive effect of cavitation depends on both the material (morphology of microstructural constituents and physico-mechanical properties) and the values of the parameters of the apparatus that determine the hydrodynamics of vibratory cavitation. Given this dependence and the complexity of the degradation mechanism, in diagrams expressing variations in mean erosion rates, the dispersion domain of experimental values has been delimited by the curves S(t) and I(t), plotted in Figure 4, whose relationships are functions of the standard deviation σ, according to the relations published in [27,28]:
-
For the mean standard deviation,
σ = i = 0 13 MDER i MDER ( t ) i 2 n 1 1 2 , n = 13
-
For the 99%tolerance interval,
S99(t) = MDER(t) + 1·σ; I99(t) = MDER(t) − 1·σ
-
For the 90%tolerance interval,
S90(t) = MDER(t) + 10·σ; I90(t) = MDER(t) − 10·σ
From our analyses and experience, the tolerance range values, for a correctly conducted test with preciously controlled hydrodynamic regime parameters, should not be below 90% (approximation error of ±10%).
In Figure 4, for each structural state (heat-treated base material solution and deposited layers of austenitic manganese alloy), specific diagrams are presented. These diagrams represent the variation of mean depth erosion rate (MDER) with exposure duration to cavitation and contain the experimental values of sets of three samples from each structural state (points of orange, blue, and green color), the mediating/approximating curve MDER(t), and the values of statistical parameters (mean standard deviation σ and tolerance interval).
Analyzing the data from Figure 4, it can be observed that:
-
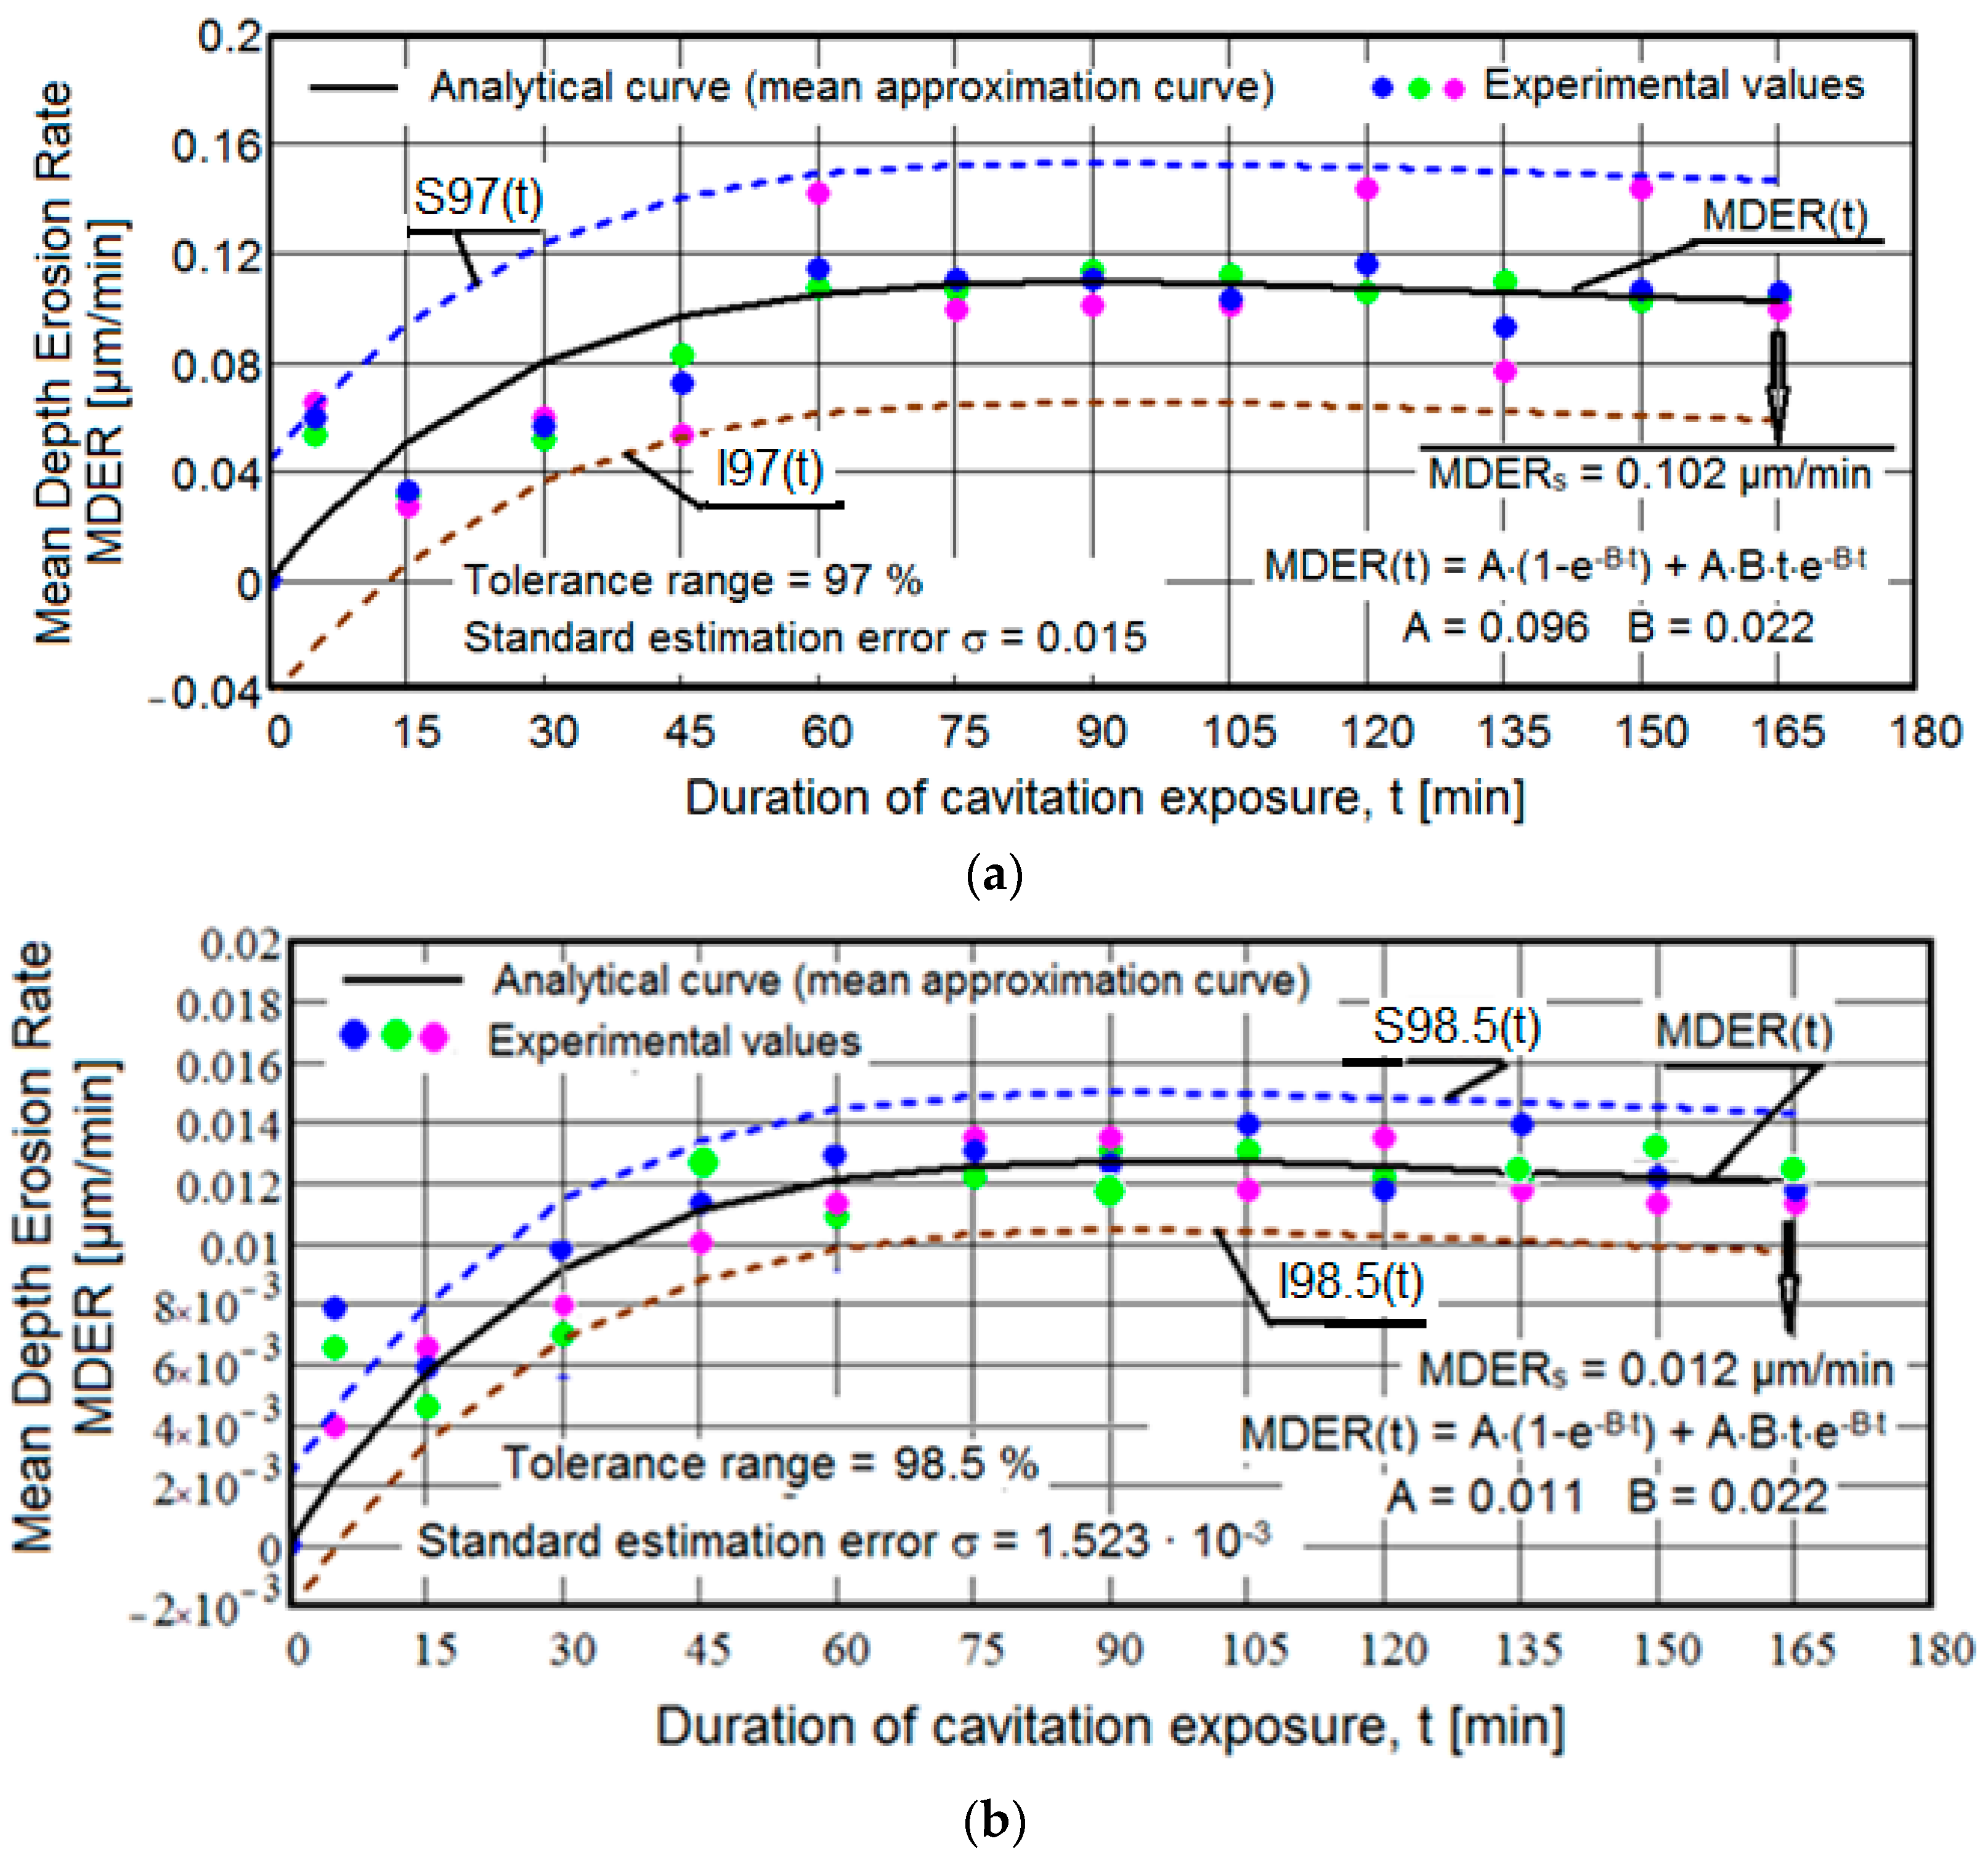
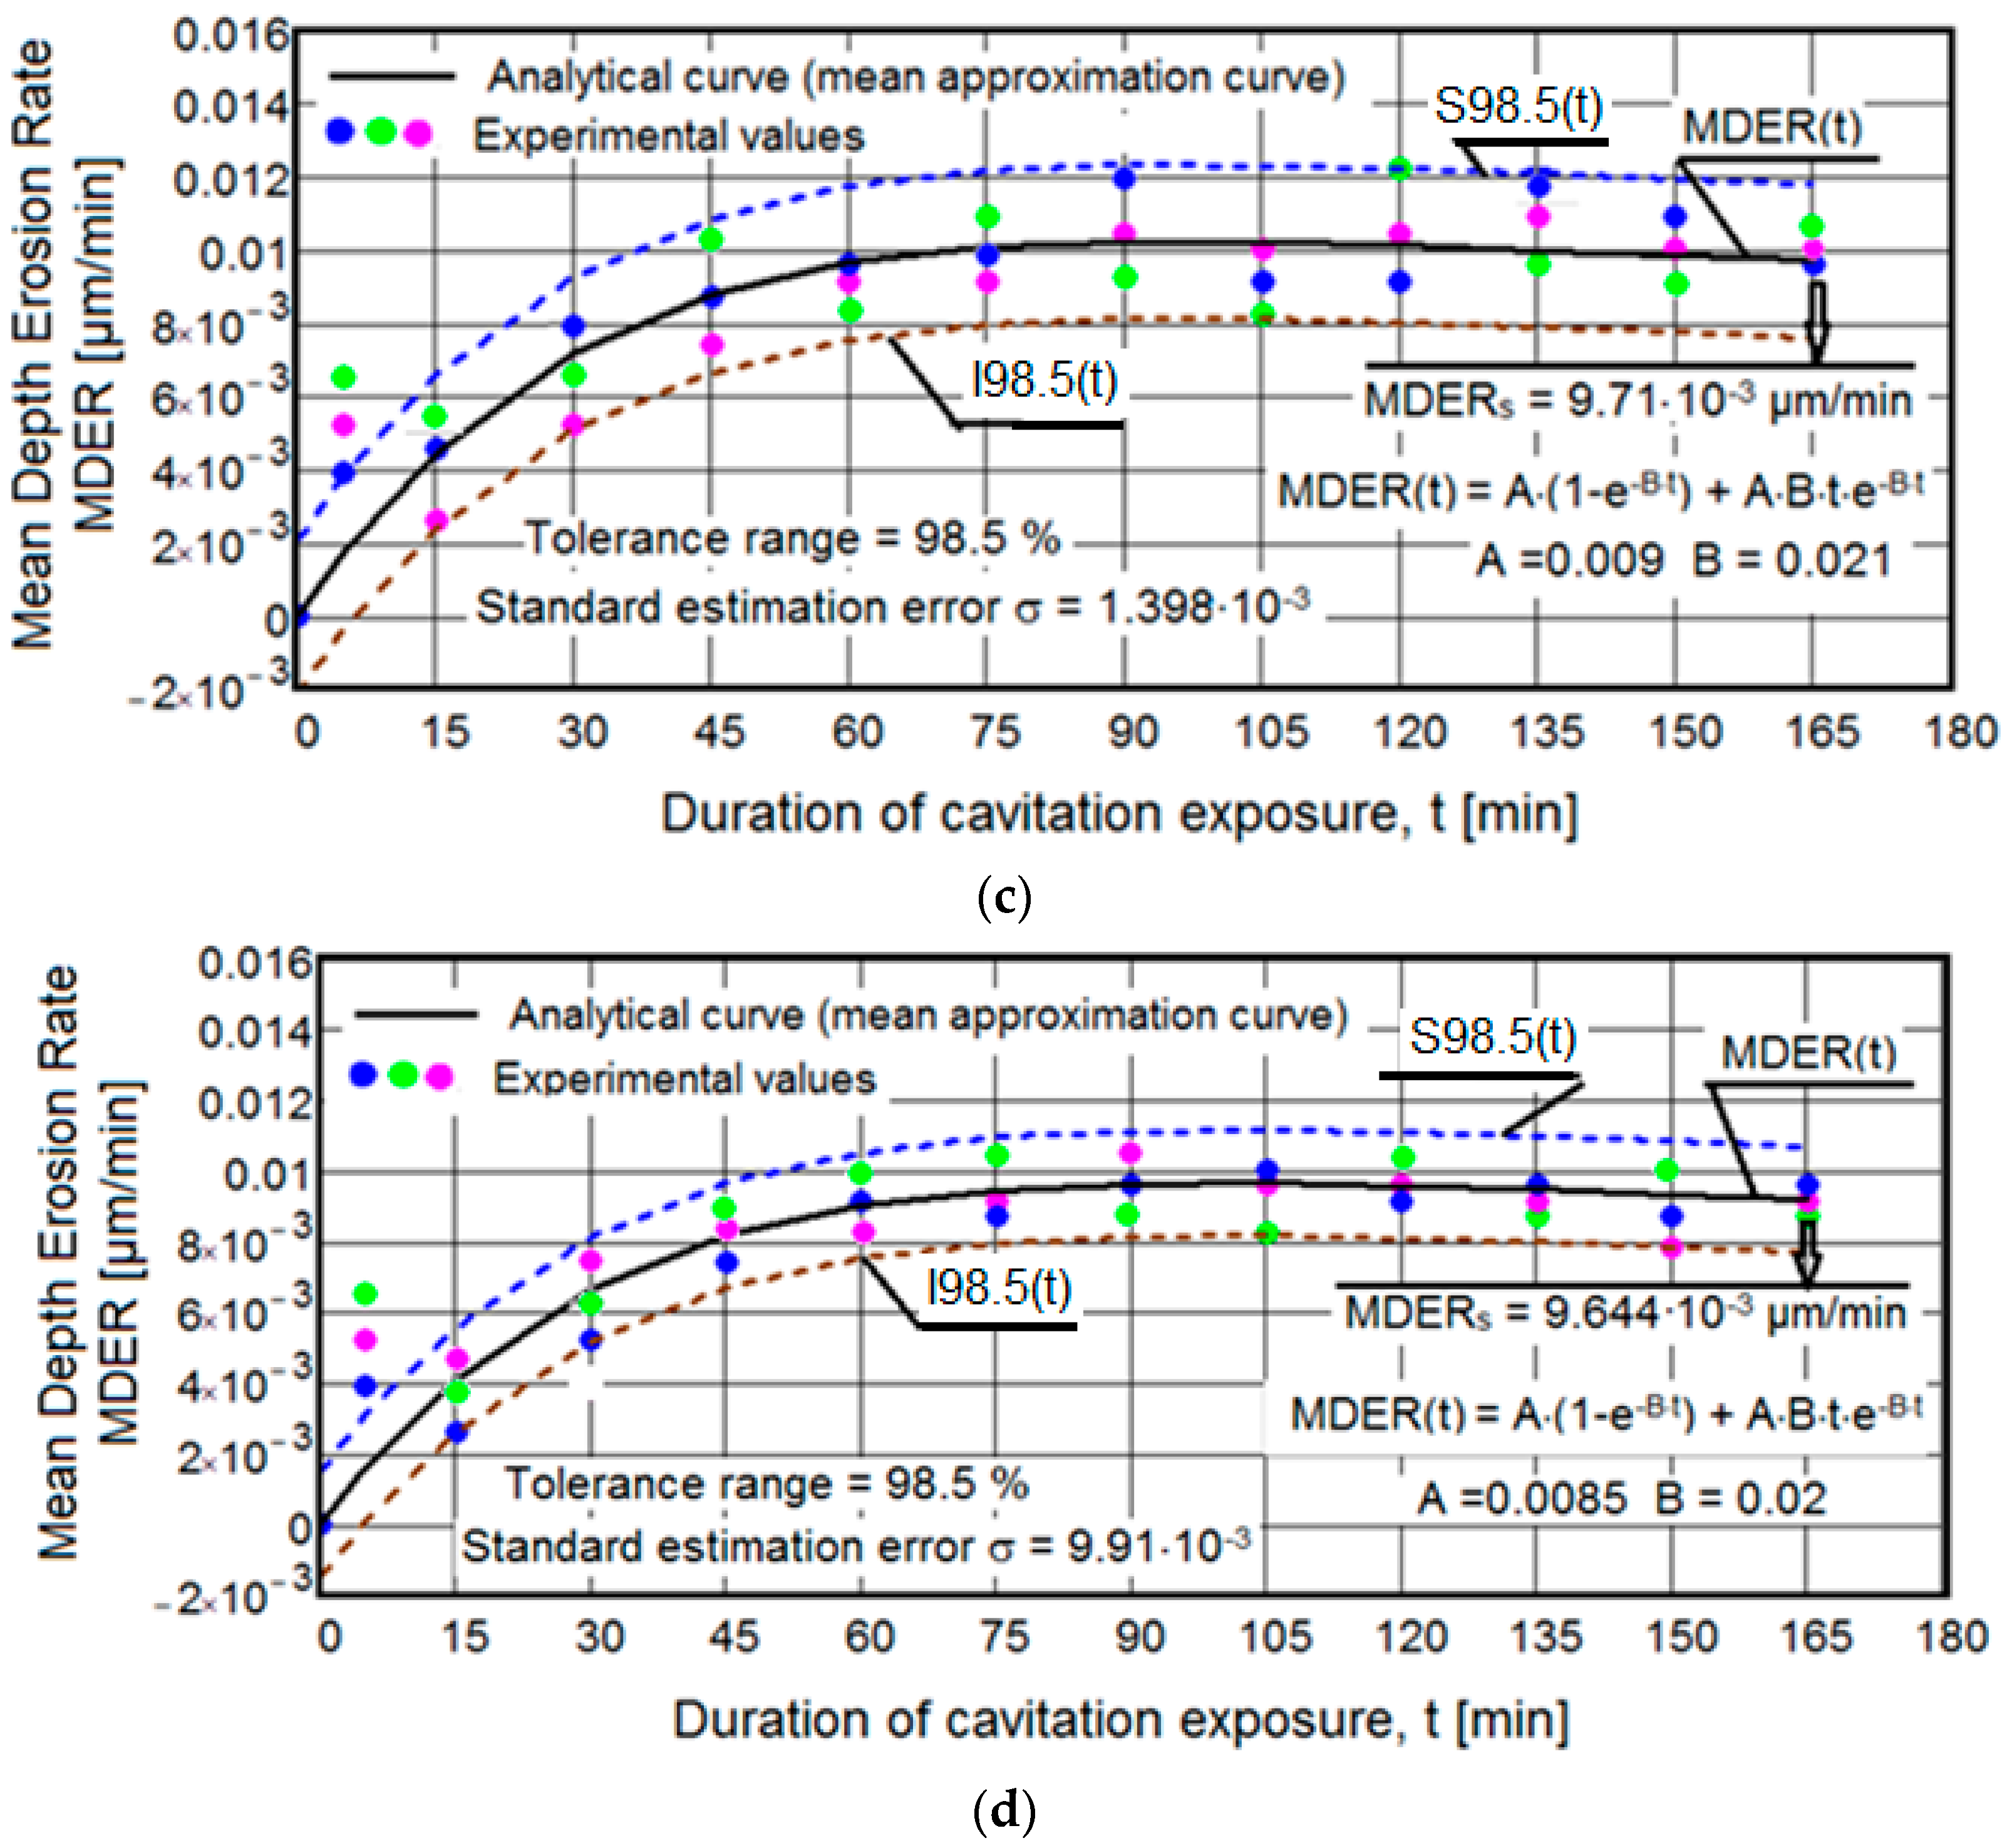
There are very small values of the mean standard deviation (maximum of 0.015) and a high tolerance interval (minimum of 97%), indicating the accuracy of the experimental program conducted on sets of three samples from each structural state. Based on our experience, we believe that these statistical parameter values are due not only to the rigorous control of the functional parameters of the vibrating apparatus but also to the heat treatment technologies and pulsed current welding deposition, which have led to high hardness values on the cavitated surface. The fact that, for samples with deposited layers, the values of the mean standard deviation are of the same order, below 0.01, and the tolerance intervals are identical (98.5%), is a confirmation of the much higher hardness of these structures.
-
Regardless of the structural state, there is interference and random arrangement of the experimental values of the three samples relative to the mediating curve MDER(t). This behavior is natural and shows that at the same cavitation duration, the sizes of the fractured and expelled grains differ, but overall, the behavior of the structures under the cyclic demands of cavitation microjets is identical.
-
For all samples, the MDER(t) mediating curve tends to decrease slightly towards the final value MDERs (9.664 × 10⁻³ µm/min. for samples with three deposited layers, 9.71 × 10⁻³ µm/min. for samples with two deposited layers, 0.012 µm/min for samples with one deposited layer, and 0.102 µm/min for samples with heat treatment). This behavior, according to our experience and the literature data, is characteristic of structures with very high resistance to the pressure forces created upon impact with microjets and shock waves generated during cavitation [1,5,6]. Also, this evolution is caused by the fact that after reaching maximum values, with the increase in cavitation duration until the end of the test, under the impact of pressure forces of microjets and shock waves, the cavities created expand in the plane, their increase in depth being much smaller, because of the damping effect of air and water penetrated into them. It should be emphasized that the cyclic cavitation load generates a significant effect of hardening by mechanical work on the layer under stress, which contributes most to the reduction in mass losses and, consequently, to the reduction in the erosion penetration rate.
-
For samples with deposited layers, the experimental values recorded after 5 min of cavitation attack are located outside the dispersion band. These high values are the effects of losses generated by the removal of abrasive dust and the tips of roughness, and do not express actual material losses.
-
Based on the mean depth erosion rate values, MDERs, the cavitation erosion resistance of the structure with deposited layers is significantly superior to the structure obtained after solution treatment. By comparison, the increase in cavitation resistance, compared to the structure obtained by the applied heat treatment, is approximately 8.5 times for samples with one deposited layer, about 10.5 times for samples with two deposited layers, and about 10.55 times for samples with three deposited layers.

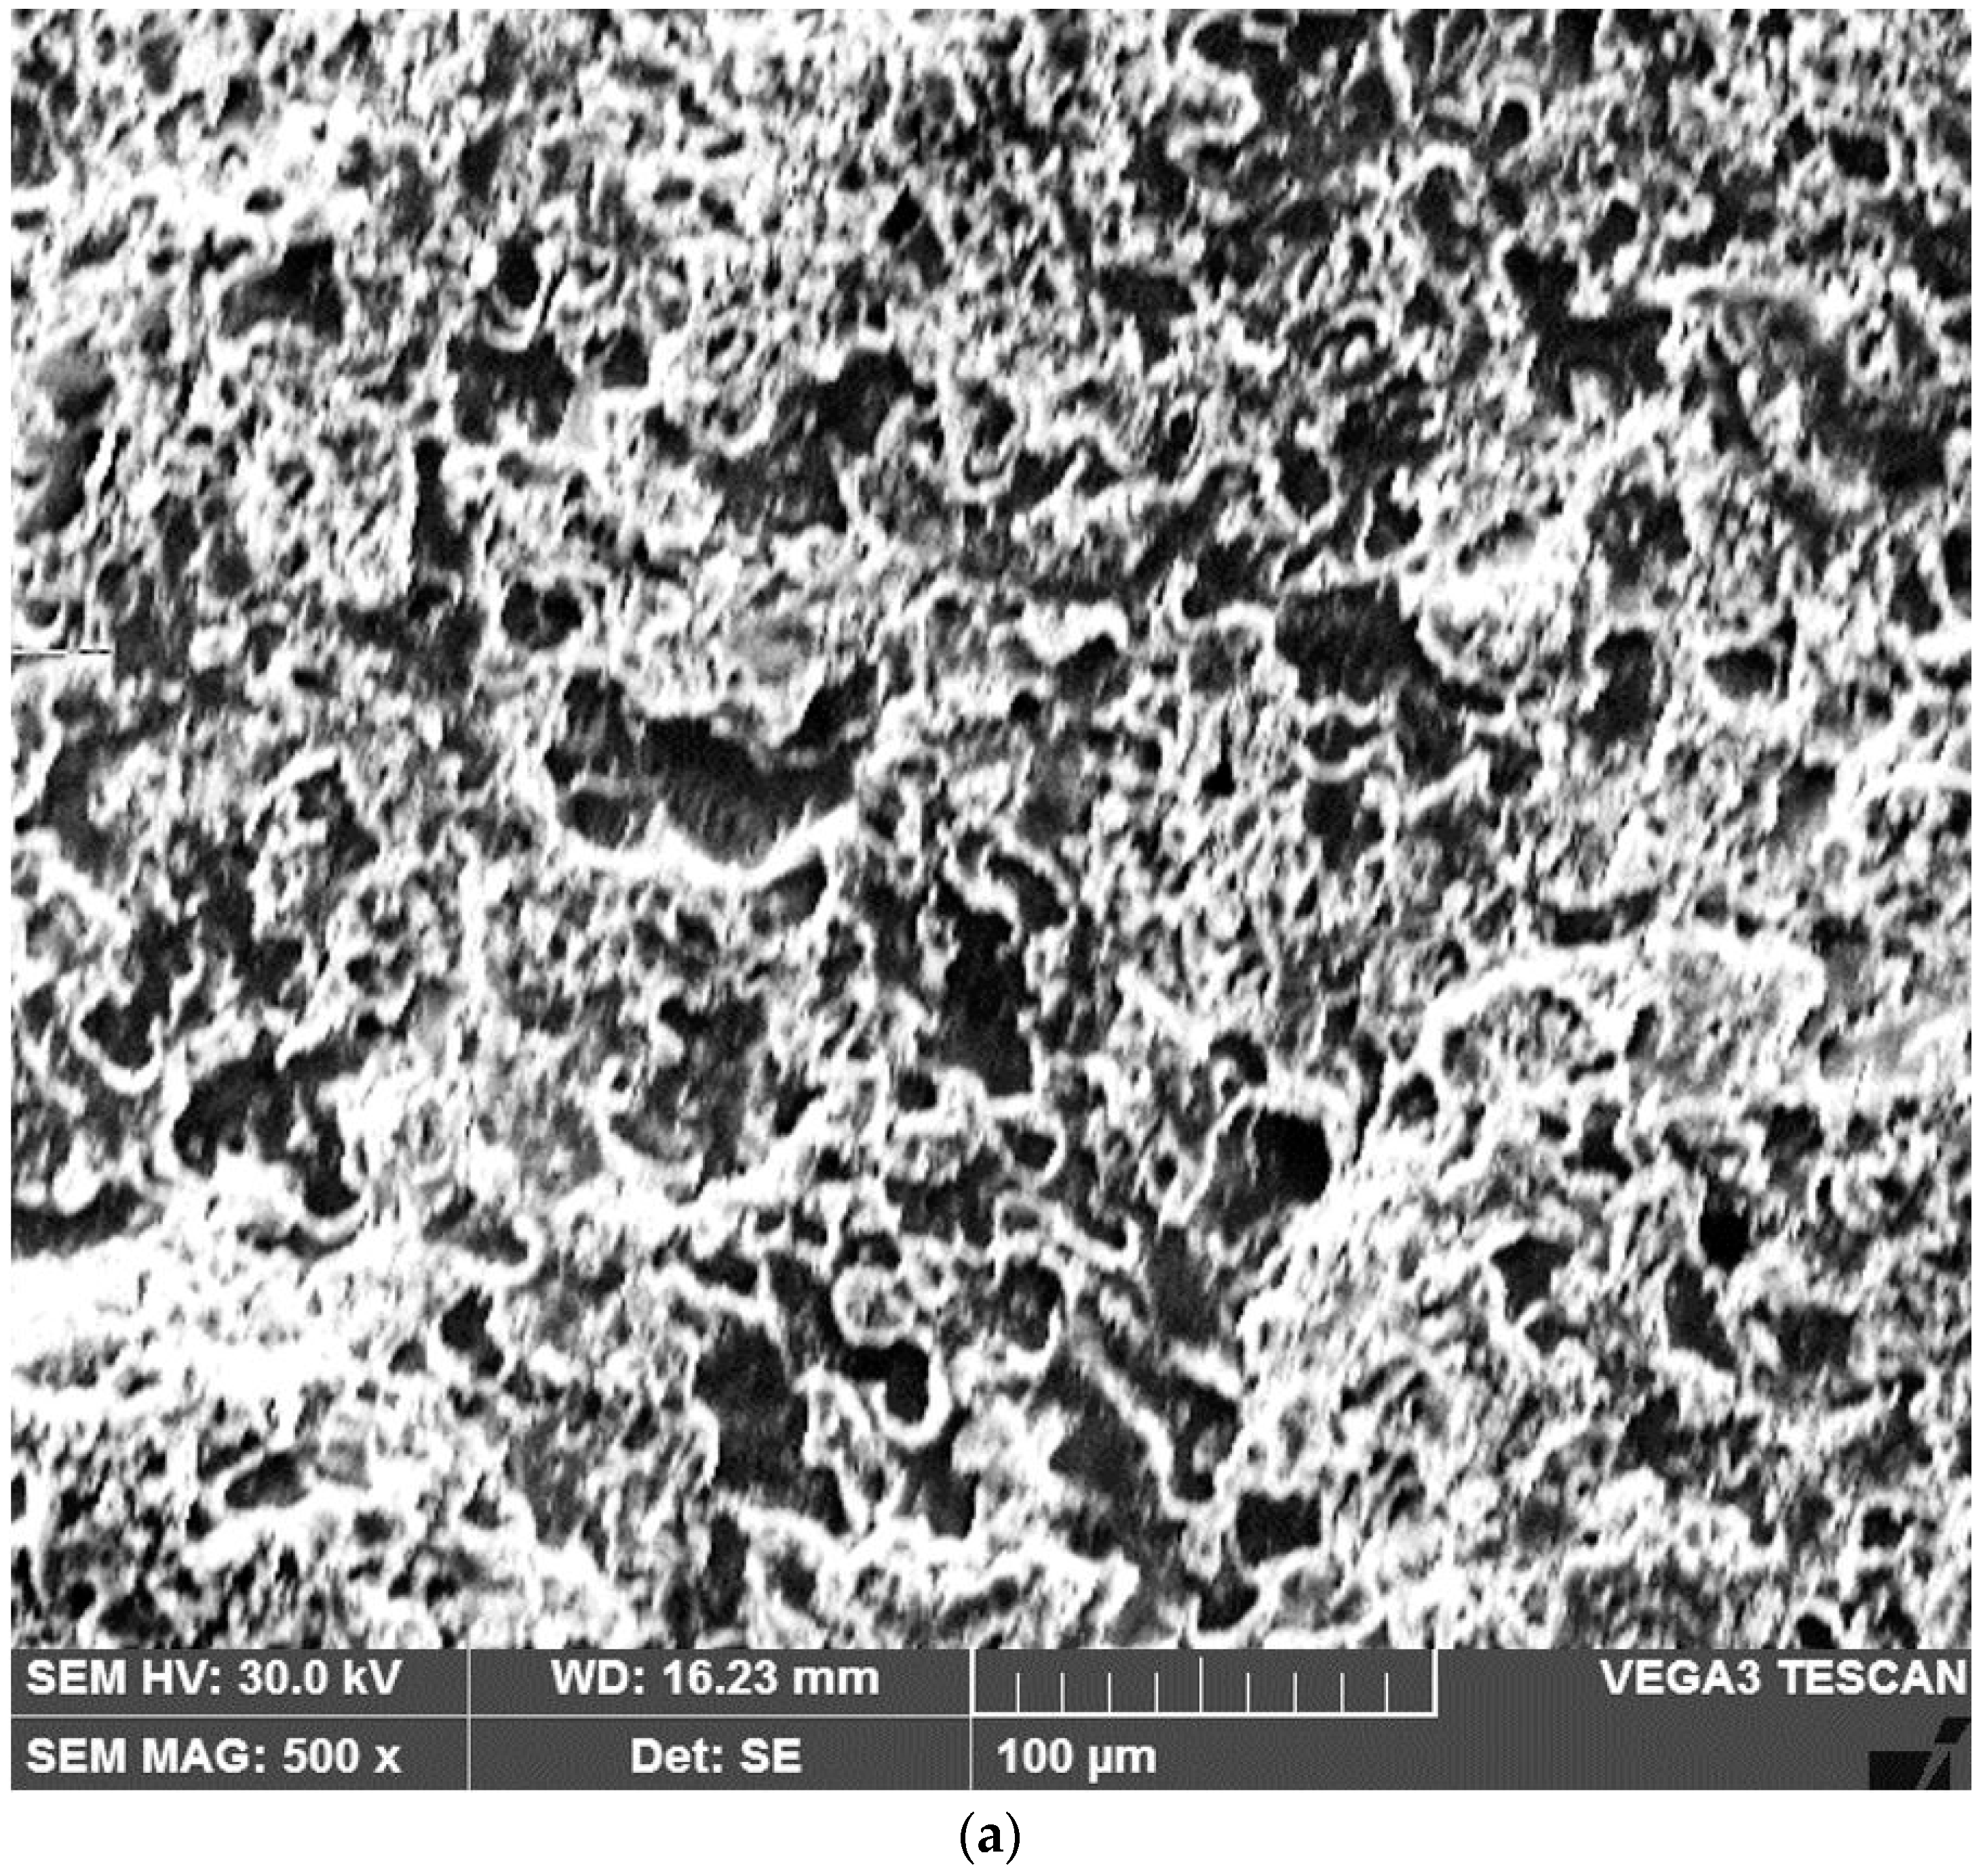
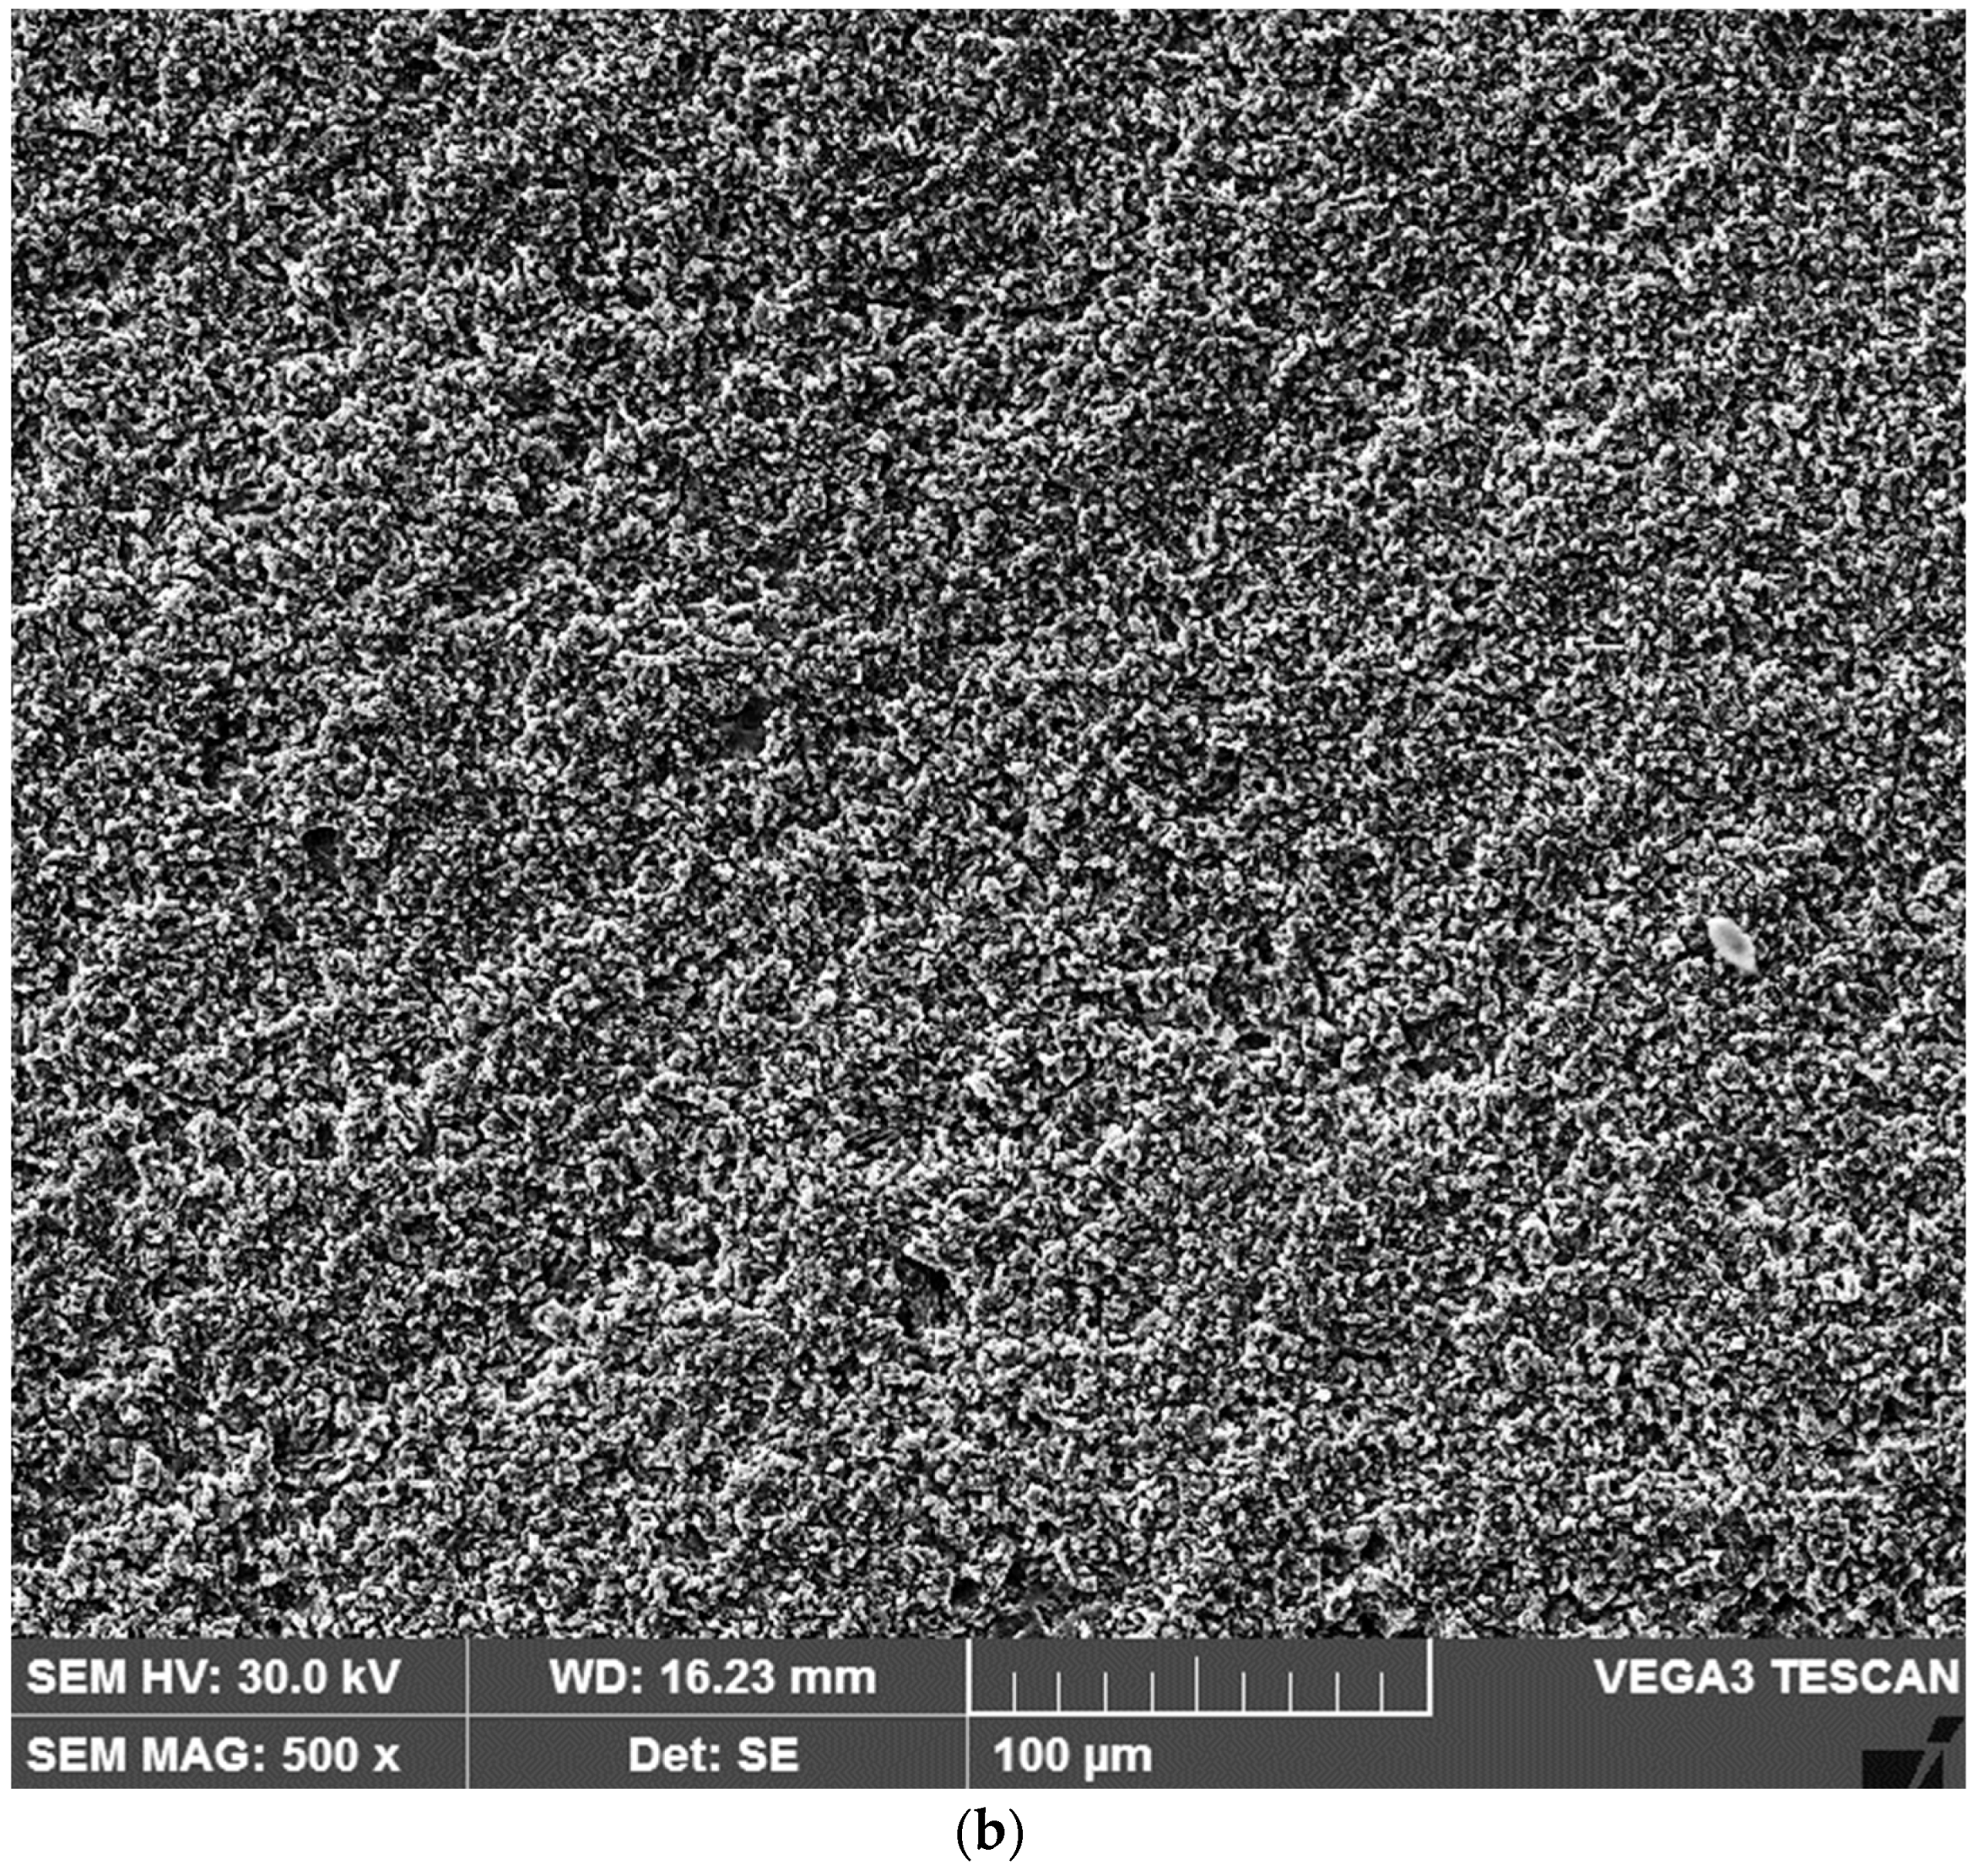
3.2. Microstructural Observations. Degree of Dilution

Figure 5 presents the duplex microstructure of the steel used for research, as observed under the scanning electron microscope. It consists of the two solid solutions, ferrite and austenite, as well as a small quantity of fine particles of complex carbide combinations type MxCy (M = Fe, Cr, Mo). These microstructural observations are in full agreement with the results of other research studies [13,14,15,16].
It is well known that the primary objective of a welding operation is to provide the continuity of the materials being assembled. In the case of metals and metallic alloys, this continuity is achieved at the level of the crystal lattice, and a certain activation energy is required to obtain it. During welding deposition, a heterogeneous joint is obtained because the chemical composition of the deposited layer differs from that of the substrate. When depositing a single layer, Figure 6 displays the micrographic profile of the cross-section of the deposited metal—the base metal system.
The pool of molten metal is surrounded by the base metal, and as it begins to cool, an immediate transformation occurs from the melting front to the solidification front. The process of primary crystallization tends to evolve in the direction of maximum thermal gradient, specifically along the solidification isotherm. Increasing the solidification rate, the conditions for dendritic growth are met, leading to more competitiveness consequently.
The assessment of the dilution degree was carried out through chemical composition analysis. Energy dispersive X-ray analyses (Figure 7 and Figure 8) highlighted the dilution phenomenon of the Citomangan coating due to mixing with the melted Duplex stainless steel substrate. For comparison, Figure 9 presents the SEM microstructural image, the dispersion spectrum, and the chemical composition of the deposited layer that has not been affected by dilution.
The obtained results regarding the chemical composition of the first (Figure 7) and the last deposited layer (Figure 9) compared to those of the base metal (Figure 8) highlight differences in the concentrations of Fe, Cr, Ni, Mn, and Mo in the three analyzed zones. These changes in chemical composition can also be observed in Figure 10, which reveals the interface between the deposited metal and the base metal and the adjacent microzones. Thus, in Figure 10, left image, the direction of measurement of the main alloying elements in the base metal and in the first zone of the dilution region is marked, and right image, their linear variation is shown. A portion of material with a thickness of 50–60 µm resulting from the mixing of the filler material with the melted base metal presents significant compositional inhomogeneities. For example, the chromium content varied from approximately 22 wt.% in the base metal to approximately 11 wt.% in the area adjacent to the interface between the first deposited layer and the base metal, and to approximately 4.5 wt.% in the last deposited layer that was not affected by dilution. The manganese content was approximately 1 wt.% in the base metal, approximately 6 wt.% in the first deposited layer, and approximately 14 wt.% in the outer layer.
The results of the Fe evaluation allowed the calculation of the dilution degree using the following equation:
Gd = (Fewm − Fefm)/(Febm + Fefm) × 100 = (75.06 − 69.10)/(67.96 + 69.10) × 100 = 4.3%
where Gd is the dilution degree; Fewm is the iron content in the deposited layer (welded metal), wt.%; Fefm is the iron content in the filler metal, wt.%; and Febm is the iron content in the base metal, wt.%.
The low values of dilution are justified by the low heat input characteristic of this welding process and demonstrate its feasibility for such applications.
Figure 11 shows the surface topography examined under a scanning electron microscope of samples collected from the base material and specimens strengthened by the deposition of three layers, which were tested for cavitation erosion for a period of 165 min. The preferred cavities in the ferrite and the more weak grain boundaries are responsible for the creation of craters with depths more than 18 µm, as seen in these pictures (Figure 11a). It is highlighted that the α/γ boundaries between the two phases and their grain boundaries erode more quickly than in the γ solid solution microstructure because they are less able to absorb deformation energy brought on by stresses in the material caused by cavitational impact waves. On the other hand, the degradation is more gradual and consistent, and the cavity depths do not surpass 6 µm on surfaces that have been hardened by the deposition of three layers (Figure 11b).

4. Conclusions

The layers of austenitic manganese alloy “CITOMANGAN” with a thickness of approximately 2–5 mm can be deposited through the manual welding process in pulsed current.
The microstructure of the coating consists of a solid solution matrix γ (austenite) and chemical combinations of alloying elements.
In the first deposited layer, the dilution of the filler material with the substrate material is very low, around 4.3%, which is justified by the low heat input characteristic of this process and demonstrates its feasibility for applications of Duplex stainless steels.
Considering the mean depth erosion rate values, MDER, it is observed that compared to the substrate material treated by solution treatment, the resistance to cavitation erosion increases by about 8.5 times for the first layer hardened by the pulsed current welding process and by about 10.5 times for two or three deposited layers.

Author Contributions

Conceptualization, I.M. and I.B; methodology, I.M., I.B., D.M., I.D.U. and C.M.C.; investigation, I.M., I.B., D.M., I.D.U. and C.M.C.; writing—original draft preparation, I.M., I.D.U., C.M.C. and I.B.; writing—review and editing, I.M., I.D.U. and I.B.; visualization, I.M., I.B., D.M., I.D.U. and C.M.C.; supervision, I.M. and I.B. All authors have read and agreed to the published version of the manuscript.

Funding

This research received no external funding.

Data Availability Statement

The original contributions presented in the study are included in the article, further inquiries can be directed to the corresponding author/s.

Conflicts of Interest

The authors declare no conflict of interest.

References

  1. Carlton, J. Cavitation, in Marine Propellers and Propulsion, 2nd ed.; Carlton, J., Ed.; Butterworth-Heinemann: Oxford, UK, 2012; pp. 209–250. [Google Scholar]
  2. Lloyd’s Register Propeller root cavitation erosion. Tech. Matters 2006, 1, 4–5.
  3. Ge, M.; Sun, C.; Zhang, G.; Coutier-Delgosha, O.; Fan, D. Combined suppression effects on hydrodynamic cavitation performance in Venturi-type reactor for process intensification. Ultrason. Sonochem. 2022, 86, 106035. [Google Scholar] [CrossRef] [PubMed]
  4. Ge, M.; Petkovšek, M.; Zhang, G.; Jacobs, D.; Coutier-Delgosha, O. Cavitation dynamics and thermodynamic effects at elevated temperatures in a small Venturi channel. Int. J. Heat Mass Transfer 2021, 170, 120970. [Google Scholar] [CrossRef]
  5. He, J.; Liu, X.; Li, B.; Zhai, J.; Song, J. Cavitation Erosion Characteristics for Different Metal Surface and Influencing Factors in Water Flowing System. Appl. Sci. 2022, 12, 5840. [Google Scholar] [CrossRef]
  6. Ghose, J.P.; Gokarn, R.P. Propeller Materials. Basic Ship Propulsion; Allied Publishers: Kharagpur, India, 2004; pp. 166–173. [Google Scholar]
  7. Fitch, E.C. Cavitation Wear in Hydraulic Systems. Machinery Lubrication. 2011. Available online: http://www.machinerylubrication.com/Articles/Print/380 (accessed on 20 June 2024).
  8. Shinde, P.; Satam, A. Cavitation Effect in Centrifugal Pump. International Journal of Researchers. Sci. Dev. 2014, 2, 20–23. [Google Scholar]
  9. Kurosawa, Y.; Kato, K.; Saito, S.; Kubo, M.; Uzuka, T.; Fujii, Y.; Takahashi, H. Basic study of brain injury mechanism caused by cavitation. Engineering in Medicine and Biology Society 2009. EMBC 2009. In Proceedings of the Annual International Conference of the IEEE, Minneapolis, MN, USA, 3–6 September 2009; pp. 7224–7227. [Google Scholar]
  10. Brennen, C.E. Hydrodynamics of Pumps—Bubble Dynamics, Damage and Noise; NREC: Pittsburgh, PA, USA, 1994; Available online: http://brennen.caltech.edu/HTMPUM/chap6.htm (accessed on 11 July 2024).
  11. Carlton, J.S. Cavitation. Marine Propellers and Propulsion; Elsevier: Amsterdam, The Netherlands, 2012; pp. 431–458. [Google Scholar]
  12. Materials for Propeller Fabrication. Rules for Classification and Construction Materials and Welding, 2nd ed.; Germanischer Lloyd Aktiengesellschaft: Hamburg, Germany, 2009; pp. 1–11. Available online: https://www.dnv.com/rules-standards/gl-rules-guidelines/ (accessed on 25 June 2024).
  13. Practical Guidelines for the Fabrication of Duplex Stainless Steels; International Molybdenum Association (IMOA): London, UK, 2014; Available online: https://www.imoa.info/download_files/stainless-steel/Duplex_Stainless_Steel_3rd_Edition.pdf (accessed on 15 June 2024).
  14. Duplex Stainless Steel: IMOA. Available online: https://www.imoa.info/molybdenum-uses/molybdenum-grade-stainless-steels/duplex-stainless-steel.php (accessed on 10 May 2024).
  15. Abreu, C.M.; Cristóbal, M.J.; Losada, R.; Nóvoa, X.R.; Pena, G.; Pérez, M.C. Comparative study of passive films of different stainless steels developed on alkaline medium. Electrochim. Acta 2004, 49, 3049–3056. [Google Scholar] [CrossRef]
  16. Wallén, B. Corrosion of Duplex Stainless Steels in Seawater. In Duplex Stainless Steels, World Conference; KCI Publishing: Zutphen, The Netherlands, 1997; Volume 5, pp. 59–71. [Google Scholar]
  17. Francis, R. Bimetallic Corrosion, Guides to Good Practice in Corrosion Control; 1982; Available online: https://www.npl.co.uk/getattachment/research/electrochemistry/corrosion-guides/Corrosion-Guide-No-5.pdf.aspx?lang=en-GB (accessed on 25 June 2024).
  18. Aribo, S. Corrosion and Erosion-Corrosion. Behaviour of Lean Duplex Stainless Steels in Marine and Oilfield Environments. Ph.D. Thesis, University of Leeds, Leeds, UK, 2014. Available online: https://etheses.whiterose.ac.uk/7170/1/PhD%20corrections-%20Thesis%20-Sunday%20Aribo.pdf (accessed on 10 July 2024).
  19. Aalco. Stainless Steel—Duplex 2205. Available online: http://www.aalco.co.uk/datasheets/Stainless-Steel_1.4462-2205_102.ashx (accessed on 24 March 2024).
  20. Stainless Steel Alloy Duplex 2205, UNS S32205. Available online: https://continentalsteel.com/stainless-steel/grades/alloy-duplex-2205-uns-s32205/ (accessed on 14 June 2024).
  21. Ai, W.; Lo, K.H.; Kwok, C.T. Cavitation erosion of a spinodally decomposed wrought duplex stainless steel in a benign environment. Wear 2019, 424–425, 111–121. [Google Scholar] [CrossRef]
  22. Escobar, J.D.; Velásquez, E.; Santos, T.F.A.; Ramirez, A.J.; Lópezp, D. Improvement of cavitation erosion resistance of a duplex stainless steel through friction stir processing (FSP). Wear 2013, 297, 998–1005. [Google Scholar] [CrossRef]
  23. Mesa, D.H.; Pinedo, C.E.; Tschiptschin, A.P. Improvement of the cavitation erosion resistance of UNS S31803 stainless steel by duplex treatment. Surf. Coat. Technol. 2010, 205, 1552–1556. [Google Scholar] [CrossRef]
  24. Hattori, S.; Ishikura, R. Revision of cavitation erosion database and analysis of stainless steel data. Wear 2010, 268, 109–116. [Google Scholar] [CrossRef]
  25. Standard G32; Standard Method of Vibratory Cavitation Erosion Test. ASTM: West Conshohocken, PA, USA, 2016.
  26. Mitelea, I.; Mutascu, D.; Karancsi, O.; Crăciunescu, C.M.; Buzdugan, D.; Utu, I.D. Microstructural Investigations of Weld Deposits from Manganese Austenitic Alloy on X2CrNiMoN22-5-3 Duplex Stainless Steel. Appl. Sci. 2024, 14, 3751. [Google Scholar] [CrossRef]
  27. Bordeasu, I. Monografia Laboratorului de Cercetare a Eroziunii prin Cavitatie al Universitatii Politehnica Timisoara, 1960–2020; Editura Politehnica: Timişoara, Romania, 2020. [Google Scholar]
  28. Bordeaşu, I.; Patrascoiu, C.; Badarau, R.; Sucitu, L.; Popoviciu, M.; Balasoiu, V. New contributions in cavitation erosion curves modeling, FME Transactions Faculty of Mechanical Engineering; University of Belgrade: Belgrade, Serbia, 2006; New Series, Volume 34, Nr.1/2006, YU ISSN 1451-2092; pp. 39–44. [Google Scholar]
Figure 1. Modification of the crystalline lattice structure through alloying with nickel.
Lubricants 12 00330 g001
Figure 2. Dimensions and appearance of the cavitation samples.
Lubricants 12 00330 g002
Figure 3. The cavitation equipment: (a)—overview image, 1—sonotrode; 2—electronic system; 3—water temperature regulator; 4—vessel with liquid and cooling coil; 5—ventilation system. (b)—detail of the sample during the cavitation process.
Lubricants 12 00330 g003
Figure 4. The specific curves of the mean depth erosion rate: (a)—base metal; (b)—1 deposited layer; (c)—2 deposited layers; (d)—3 deposited.
Lubricants 12 00330 g004aLubricants 12 00330 g004b
Figure 5. SEM microstructure of the base metal.
Lubricants 12 00330 g005
Figure 6. SEM micrograph of the layer-substrate system.
Lubricants 12 00330 g006
Figure 7. SEM micrograph (a), EDX spectrum (b), and quantitative analysis values (c) of the first deposited layer.
Lubricants 12 00330 g007
Figure 8. The EDX spectrum (a) and quantitative analysis values (b) of the base metal (marked with red square on Figure 5).
Lubricants 12 00330 g008
Figure 9. The SEM micrograph (a), EDX spectrum (b), and quantitative analysis values (c) of the last deposited layer.
Lubricants 12 00330 g009
Figure 10. Concentration profiles of the alloying elements on either side of the interface between the deposited metal and the base metal.
Lubricants 12 00330 g010
Figure 11. SEM images of the surfaces coated with three layers tested for cavitation for 165 min: (a)–base metal; (b)—hardfacing by welding.
Lubricants 12 00330 g011aLubricants 12 00330 g011b
Disclaimer/Publisher’s Note: The statements, opinions and data contained in all publications are solely those of the individual author(s) and contributor(s) and not of MDPI and/or the editor(s). MDPI and/or the editor(s) disclaim responsibility for any injury to people or property resulting from any ideas, methods, instructions or products referred to in the content.

