Article

Characteristics and Comparative Analysis of Six Mitogenomes of Genus Kiefferulus Goetghebuer, 1922 (Diptera: Chironomidae)

1
Characteristic Laboratory of Forensic Science in Universities of Shandong Province, Shandong University of Political Science and Law, Jinan 250014, China
2
National Engineering Laboratory for Lake Pollution Control and Ecological Restoration, Chinese Research Academy of Environmental Sciences, Beijing 100012, China
3
Engineering Research Center of Environmental DNA and Ecological Water Health Assessment, Shanghai Ocean University, Shanghai 201306, China
4
Shanghai Universities Key Laboratory of Marine Animal Taxonomy and Evolution, Shanghai Ocean University, Shanghai 201306, China
5
College of Water Sciences, Beijing Normal University, Beijing 100875, China
6
Research Center for Eco-Environmental Sciences, Chinese Academy of Sciences, Beijing 100085, China
*
Authors to whom correspondence should be addressed.
These authors contributed equally to this work.
Insects 2024, 15(9), 646; https://doi.org/10.3390/insects15090646
Submission received: 15 July 2024 / Revised: 25 August 2024 / Accepted: 26 August 2024 / Published: 28 August 2024
(This article belongs to the Section Insect Systematics, Phylogeny and Evolution)

Abstract

:

Simple Summary

Kiefferulus Goetghebuer, 1922 is an important genus within Chironomidae, known for its roles in aquatic ecosystems. The studies of this genus have mainly focused on morphological aspects, and the molecular data, especially high-throughput sequencing, are seriously inadequate, limiting our understanding of its evolution history. Herein, we sequenced the mitogenomes of six Kiefferulus species and analyzed the characteristics of the mitochondrial genome among these species. Furthermore, we reconstructed the phylogenetic relationship of the genus Kiefferulus based on two different methods: Maximum likelihood and Bayesian inference. In addition, the phylogenetic analysis of Kiefferulus exhibited that six newly obtained species were obviously distinguished from others. Our study provides a critical foundation for future research on the evolutionary biology of Chironomidae.

Abstract

Chironomidae is a cosmopolitan and species-rich family of insects, with many species serving as useful indicators of aquatic ecosystem health. In this study, we newly sequenced six species of Kiefferulus Goetghebuer, 1922 (Chironomidae: Chironominae) by high-throughput sequencing technology. We analyzed characters of the mitochondrial genome, including the sequence length, nucleotide composition, and evolutionary rates of this genus. The size of the newly obtained sequences ranged from 15,588 to 15,767 bp, and all of them included 22 tRNAs, 13 PCGs, 2 rRNAs, and 1 CR. The CR showed the highest AT content relative to the PCGs, rRNAs, and tRNAs. Relative synonymous codon usage analysis showed that UUA, UUU, and AUU are the preferred codons. The ratio of nonsynonymous (Ka) to synonymous (Ks) substitution rates showed that all Ka/Ks of PCGs were lower than 1, with ATP8 having the highest evolution rate, while COX1 exhibited the lowest evolution rate. We reconstructed the phylogenetic relationship of the genus Kiefferulus based on eight species (six ingroups and two outgroups), using five matrices and employing Maximum likelihood and Bayesian inference approaches. Phylogenetic analysis of the Kiefferulus showed that six species within this genus were classified into a monophyletic clade.

1. Introduction

Chironomidae, as a cosmopolitan and important aquatic insect family, have a high diversity with more than 7500 described species worldwide [1]. Some Chironomids exhibit considerable resilience and resistance to environmental stressors [1,2,3,4]. The larvae of Chironomidae inhabit a wide range of environments, including freshwater, terrestrial, and semi-aquatic habitats [4]. Many species are highly sensitive to changes in environmental conditions, such as trophic state temperature, salinity, or acidity, making them useful indicator organisms for aquatic ecosystems [5].
Kiefferulus Goetghebuer, 1922 is a genus within the tribe Chironomini of the family Chironomidae, and can be distinguished from other genera by its characteristic hypopygium of males [6]. The larvae of this genus live in sediments of small- to medium-sized waterbodies, demonstrating a high level of adaptability to various environmental conditions; species of this genus can be used to assess the environment quality of tropical aquatic ecosystems [7,8]. Despite their ecological significance, research on this group is still inadequate, particularly in terms of morphological descriptions and molecular phylogenetic studies.
Mitochondrial genomes serve as significant molecular markers and have typically been utilized in investigations about phylogeny, evolutionary history, speciation, and phylogeography within insect taxa [2,9,10]. The maternal mode of inheritance, along with a high mutation rate and the ease of obtaining mitochondrial genomes, makes them particularly advantageous for the above research [3,11]. The insect mitochondrial genome usually ranges from 14,000 to 20,000 bp in length [9], including 2 ribosomal RNAs (rRNA), 22 transfer RNAs (tRNAs), 13 protein-coding genes (PCGs), and 1 non-coding control region (CR) [12]. Furthermore, the structural characteristics of mitogenomes can offer additional insights and corroborating evidence for taxonomic classification [2,3], and the number of complete mitochondrial genomes of insects has significantly increased. This advancement, driven by the rapid development of next-generation sequencing technologies, aids in resolving structural comparisons and understanding the evolutionary history of different groups [12,13,14].
In recent times, an increasing number of studies on the mitochondrial genomes of Chironomidae have greatly advanced research in systematics and evolutionary history. Additionally, the growing availability of mitogenomes of Chironomidae offers valuable opportunities to investigate the structure and evolutionary patterns of their mitochondria [2,3,14,15]. For example, Lin and his associates utilized mitochondrial genomes to examine the taxonomic characteristics and phylogenetic relationships of Prodiamesinae within the Chironomidae [2]. Their findings revealed that Prodiamesinae is a group of Orthocladiinae, providing additional insights into the evolutionary history of this group [2]. However, resources for the mitogenomes of the genus Kiefferulus are limited. Currently, only one mitogenome is available for Kiefferulus [16], which restricts our understanding of the phylogenetic relationships and evolutionary history of this group.
In this study, we sequenced, assembled, and annotated six mitogenomes of species within the genus Kiefferulus and analyzed their mitogenomic characters including their main features, evolutionary rates, and substitutions. In addition, we used eight mitochondrial genomes to reconstruct the phylogenetic relationships of Kiefferulus species. The results not only expand our understanding of the mitogenomic features of Chironomidae and Kiefferulus but also provide new information for the definition of the genus Kiefferulus.

2. Materials and Methods

2.1. Taxon Sampling and Sequencing

In this study, six species of the genus Kiefferulus were selected for sequencing analysis (Table 1). Cranston et al. (1990) synonymized the genera Nilodorumi Kieffer and Carteronica Kieffer with the genus Kiefferulus [17].Fang et al. reported the first mitogenome of the genus Kiefferulus; however, they mistakenly used the species name Nilodorum tainanus [16]. Thus, we used our newly sequenced data of K. tainanus for our analyses. In addition, we selected two species of Chironomus (Chironomus kiiensis: NC_069311.1; Chironomus plumosus: NC_069032.1) [16,18], which were closely related to the genus Kiefferulus as outgroups, based on a prior study of Chironomidae [6].
Herein, newly obtained samples were collected from China, Namibia, and New Caledonia during 2013–2021 (see detailed information in Table 1). All samples were deposited in 95% ethanol at −20 °C firstly for morphological examination and DNA extraction. X.L.L. identified all specimens, and all vouchers were stored at the College of Fisheries and Life, Shanghai Ocean University, Shanghai, China.
Qiagen DNeasy Blood & Tissue Kit was used to extract the whole-genomic DNA based on the manufacturer’s protocol. Qubit® 2.0 Flurometer (ThermoFisher, Waltham, MA, USA) was used to measure the DNA concentration with Qubit® DNA Assay Kit, and all the whole-genome DNA was then sent to the sequencing company (Berry Genomics, Beijing, China).
Sequencing libraries were generated by the Truseq Nano DNA HT sample preparation Kit (Illumina, San Diego, CA, USA), and the Illumina NovaSeq 6000 platform was used to sequence all raw data, generating 150 bp paired-end reads with an insert size of 350 bp. Short reads, low-quality reads, and adapters were removed from the raw data by Trimmomatic v0.32 (Jülich, Germany) [19].

2.2. Assembly, Annotation, and Composition Analyses

To guarantee precision, we employed two techniques for de novo assembly: (1) NOVOPlasty v3.8.3 (Brussel, Belgium) [20] was used to assemble the mitogenome with a k-mer size of 23–39 bp and (2) IDBA-UD v1.1.3 (Boston, MA, USA) [21] was performed to assemble with a “–mink 40 –maxk 120” parameter. Geneious 2020.2.1 [22] was employed to analyze and compare the mitogenome sequences obtained through the aforementioned methods and subsequently merge them into a single sequence. Annotation and analysis for the secondary structure of tRNAs were performed by tRNAscan SE 2.0 [23] and MITOS WebServer. MEGA X [24] was used to analyze the base composition and usage of mitogenomes. SeqKit v0.16.0 (Chongqing, China) [25] was utilized to evaluate the bias of the nucleotide composition of each gene. The AT-skew and GC-skew were computed as follows: AT-skew = (A − T)/(A + T), and GC-skew = (G − C)/(G + C). MEGA X was performed to calculate the AT-skew, GC-skew, and the relative synonymous codon usage (RSCU) of the newly sequenced species.
The rates of nonsynonymous substitution (Ka) and synonymous substitution (Ks) for each PCG were calculated using DnaSP 6.0 [26]. The online server CGview (https://cgview.ca/, accessed on 22 June 2024) was utilized to create the mitogenome map, which illustrates sequence features.

2.3. Phylogenetic Relationship

To reconstruct the phylogenetic relationships of the genus Kiefferulus, we used 2 rRNA and 13 PCG genes of Kiefferulus mitogenomes. MAFFT v7.450 (Osaka, Japan) [27] was applied to align the nucleotide and protein sequences with the L-INS-I method. Trimal v1.4.1 (Barcelona, Spain) [28] was used to trim sequences under the “-automated1” strategy. Finally, we generated five matrices to reconstruct the phylogenetic relationship of Kiefferulus, and FASconCAT-G v1.04 (Santa Cruz, CA, USA) [29] was applied to concatenate matrices: the (1) cds_rrna matrix included all PCGs and two rRNA nucleotide reads; (2) cds_faa matrix contained all PCG amino acid reads; (3) cds12_fna matrix contained all PCG nucleotide reads except the third codon positions; (4) cds_fna matrix included all PCG nucleotide reads; and (5) cds12_rrna matrix contained PCG nucleotide reads which removed the third codon positions and two rRNA genes.
We used Bayesian inference (BI) and Maximum likelihood (ML) to infer the phylogenetic relationships of the genus Kiefferulus for all matrices. In all ML analyses, the best-fitting substitution models were selected via ModelFinder [30] within IQ-TREE 2 (Canberra, ACT, Australia) [31]. In addition, to minimize the impact of long-branch attraction, we used the posterior mean site frequency (PMSF) [32] model with the ‘-m − mtART + C60 + FO + R’ command to reconstruct the phylogenetic relationship of the genus Kiefferulus based on the matrix cds_faa. BI trees were implemented via PhyloBayes-MPI (Montréal, QC, Canada) [33] with the site-heterogeneous mixture model ‘-m CAT + GTR’. For the BI analysis, the Markov chain Monte Carlo (MCMC) analysis was performed twice with 10,000,000 generations, while maxdiff < 0.3 stopped the MCMC analysis. A consensus tree was created by combining the remaining trees after discarding 25% of the initial trees from each run as burn-in. Finally, we used iTOL, an online website, to beautify all trees (https://itol.embl.de/upload.cgi, accessed on 15 May 2024).

3. Results and Discussions

3.1. Mitogenomic Structure

The Illumina NovaSeq 6000 platform generated 3 Gb raw reads for each sample. A total of six newly sequenced mitogenomes of the genus Kiefferulus were obtained here, and all of them were complete. All newly sequenced mitochondrial genomes were submitted in GenBank as PP884095–PP884099 and PP972215 (Table 1). The complete mitogenome of newly obtained species ranged from 15,588 (Kiefferulus sp.1XL) to 15,767 (Kiefferulus brevipalpis) bp in length; the unstable size of the CR was the main reason for the variation in mitogenome length (Table 2). As with all published insect mitochondrial genomes, all newly obtained sequences contained 37 typical genes, including 13 PCGs, 22 tRNAs, and 2 rRNAs (Figure 1). In general, the mitogenomic structure and nucleotide composition of newly obtained sequences displayed the typical characteristics of the Chironomidae [15,34,35]. The mitogenome characters of the newly sequenced species are shown in Figure 1.
The nucleotide composition of the newly obtained species exhibited similarities (Table 2), demonstrating the characteristic AT-biased composition that is commonly observed in Chironomidae and other insects [15,17,36]. The AT content of the newly obtained sequences ranged from 75.12% (Kiefferulus sp.1XL) to 79.44% (Kiefferulus trigonum), and the GC content ranged from 20.56% (K. trigonum) to 24.88% (K. sp.1XL). The AT-skew of all newly obtained mitogenomes was positive, while GC-skew was negative. The AT-skew of the newly sequenced mitogenomes ranged from 0.019 (K. trigonum) to 0.040 (K. brevipalpis), and the GC-skew ranged from −18.62 (Kiefferulus tainanus) to −0.186 (K. trigonum) (detailed information shown in Table 2).

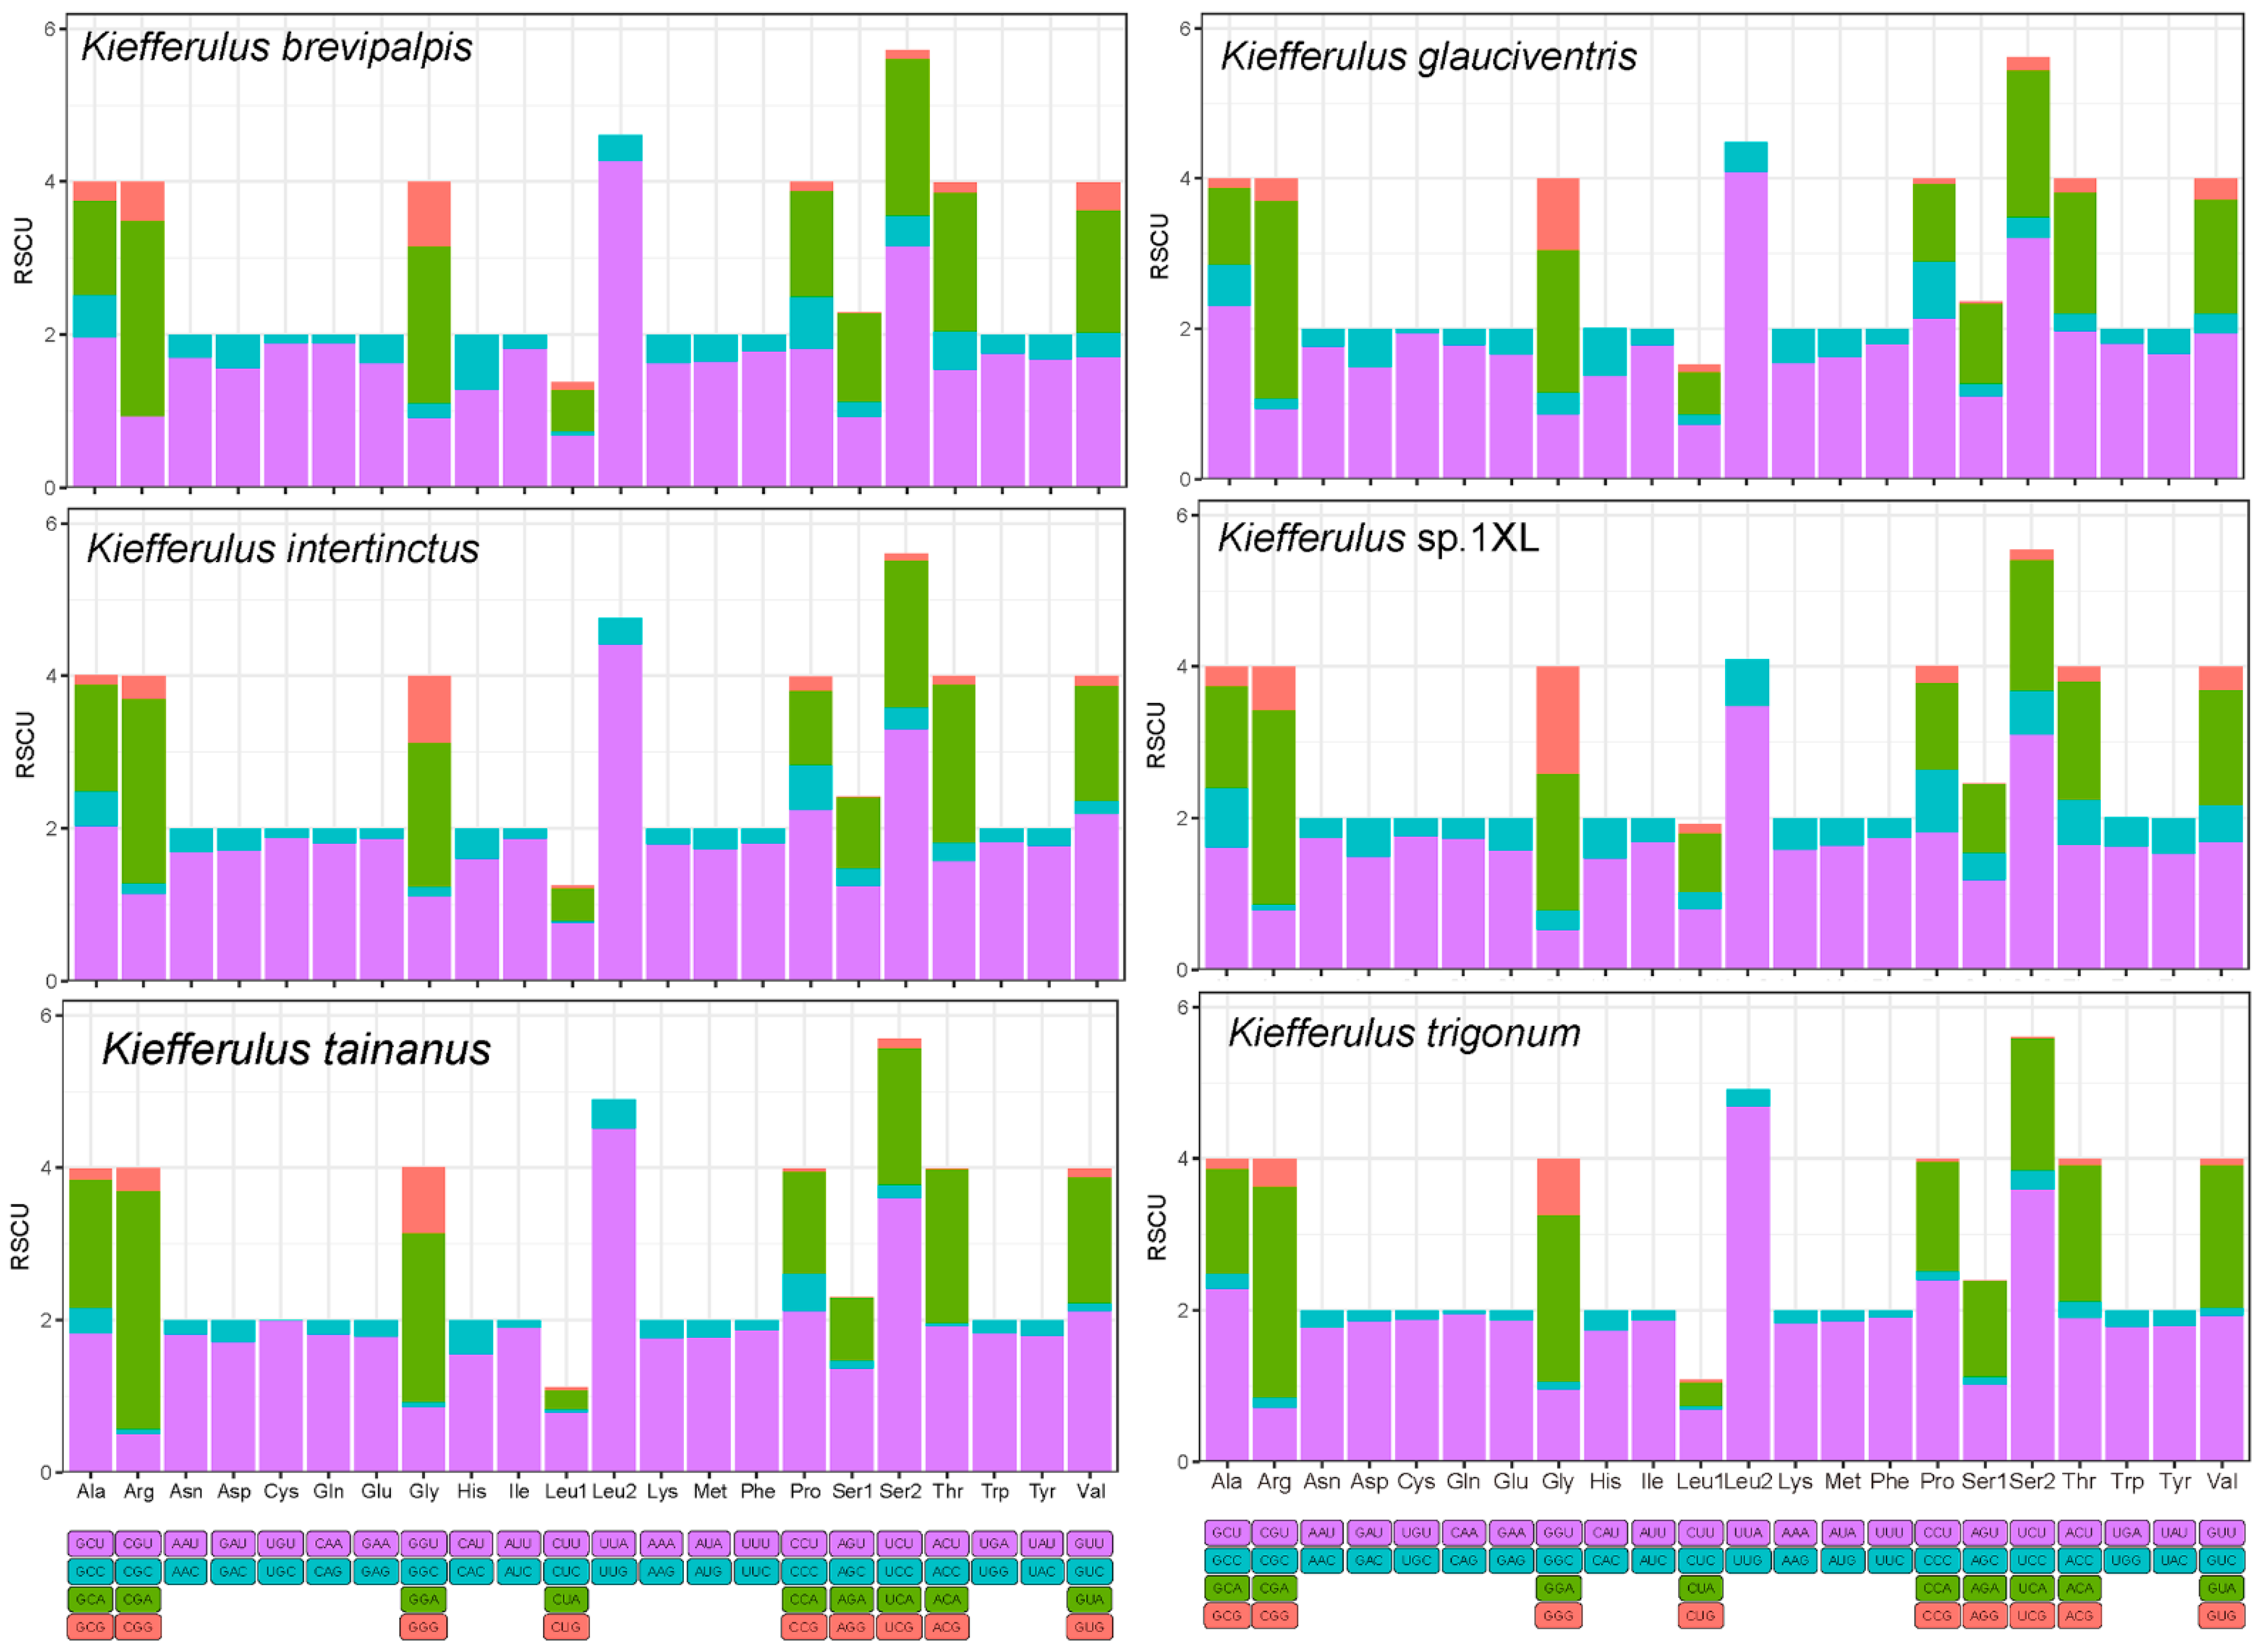
3.2. Protein-Coding Genes, Codon Usage, and Evolutionary Rates

No significant disparities were observed in the size of tRNA, PCGs, and rRNAs among each species. The length of the 13 PCGs ranged from 11,220 (K. tainanus) to 11,621 (K. trigonum) bp. The AT content ranged from 73.10% (K. sp.1XL) to 78.24% (K. trigonum), while the GC content ranged from 21.76% (K. trigonum) to 26.90% (K. sp.1XL). By comparing and integrating previous research on Chironomidae, we found that the AT content at the third site of PCGs was notably higher than at the first and second sites [15] (Table 2). The skew metrics of all PCGs showed that both the AT-skew and GC-skew were negative. The AT-skew ranged from −0.192 (K. tainanus) to −0.175 (K. brevipalpis), and K. tainanus exhibited the highest GC-skew (1.38), while Kiefferulus sp.1XL showed the lowest GC-skew (−0.084) (for detailed information, see Table 2).
The CR size of the newly reported species ranged from 518 (K. trigonum) to 674 bp (K. brevipalpis). All 13 PCGs of the newly assembled mitogenomes exhibited the start codon ATN, which was typical for insect mitogenomes [9]. However, we identified several different start codon patterns: the start codon of ATP6, COX2, COX3, CYTB, ND4, and ND4L in five species was ATG; ATP8 was ATT in two species;; ND2 and ND6 were ATT in five species; COX1 and ND1 were TTG in five species; ND5 was GTG in one species; and so on, and for detailed information, see Figure S1. Although TAG or TAA were the common stop codons for this group, there were still several special stop codon patterns: ND4 had T as the stop codon in four species, and ND3 had TAG as the stop codon in one species. More detailed information is shown in Figure S2.
The relative synonymous codon usage (RSCU) patterns for the six mitochondrial genomes were predominantly congruent, as illustrated in Figure 2. The figure shows the RSCU values for all synonymous codons corresponding to the 22 amino acids, utilizing the 62 available codons in the 13 PCGs of Kiefferulus species. For the newly obtained Kiefferulus species, we found that the UUA, UUU, and AUU were the preferred codons. At the same time, Leu2, IIe, and Phe are frequently utilized amino acids, exhibiting the nucleotide composition preference for A/T. The codons RSCU > 2 of all newly sequenced species were as follows: UUA > UCU > CGA (Figure 2, Tables S1–S6).
The ratio of nonsynonymous (Ka) to synonymous (Ks) substitutions can be employed to gauge the proportion of non-neutral alterations compared to neutral ones, offering insights into the selective pressures acting on a protein-coding gene (PCG) [37,38]. In this study, the Ka/Ks of all PCGs was significantly lower than 1, ranging from 0.031 to 0.435. The evolution rates of the 13 PCGs were as follows: ATP8 > ND6 > ND2 > ND5 > ND3 > ND4 > ND1 > ND4L > CYTB > ATP6 > COX2 > COX3 > COX1 (Figure 3). Each PCG exhibited different levels of purifying selection. ATP8, ND6, and ND2 showed higher ω values, indicating relatively relaxed purifying selection pressure. Meanwhile, COX1 and COX3 exhibited hardly purifying selection.

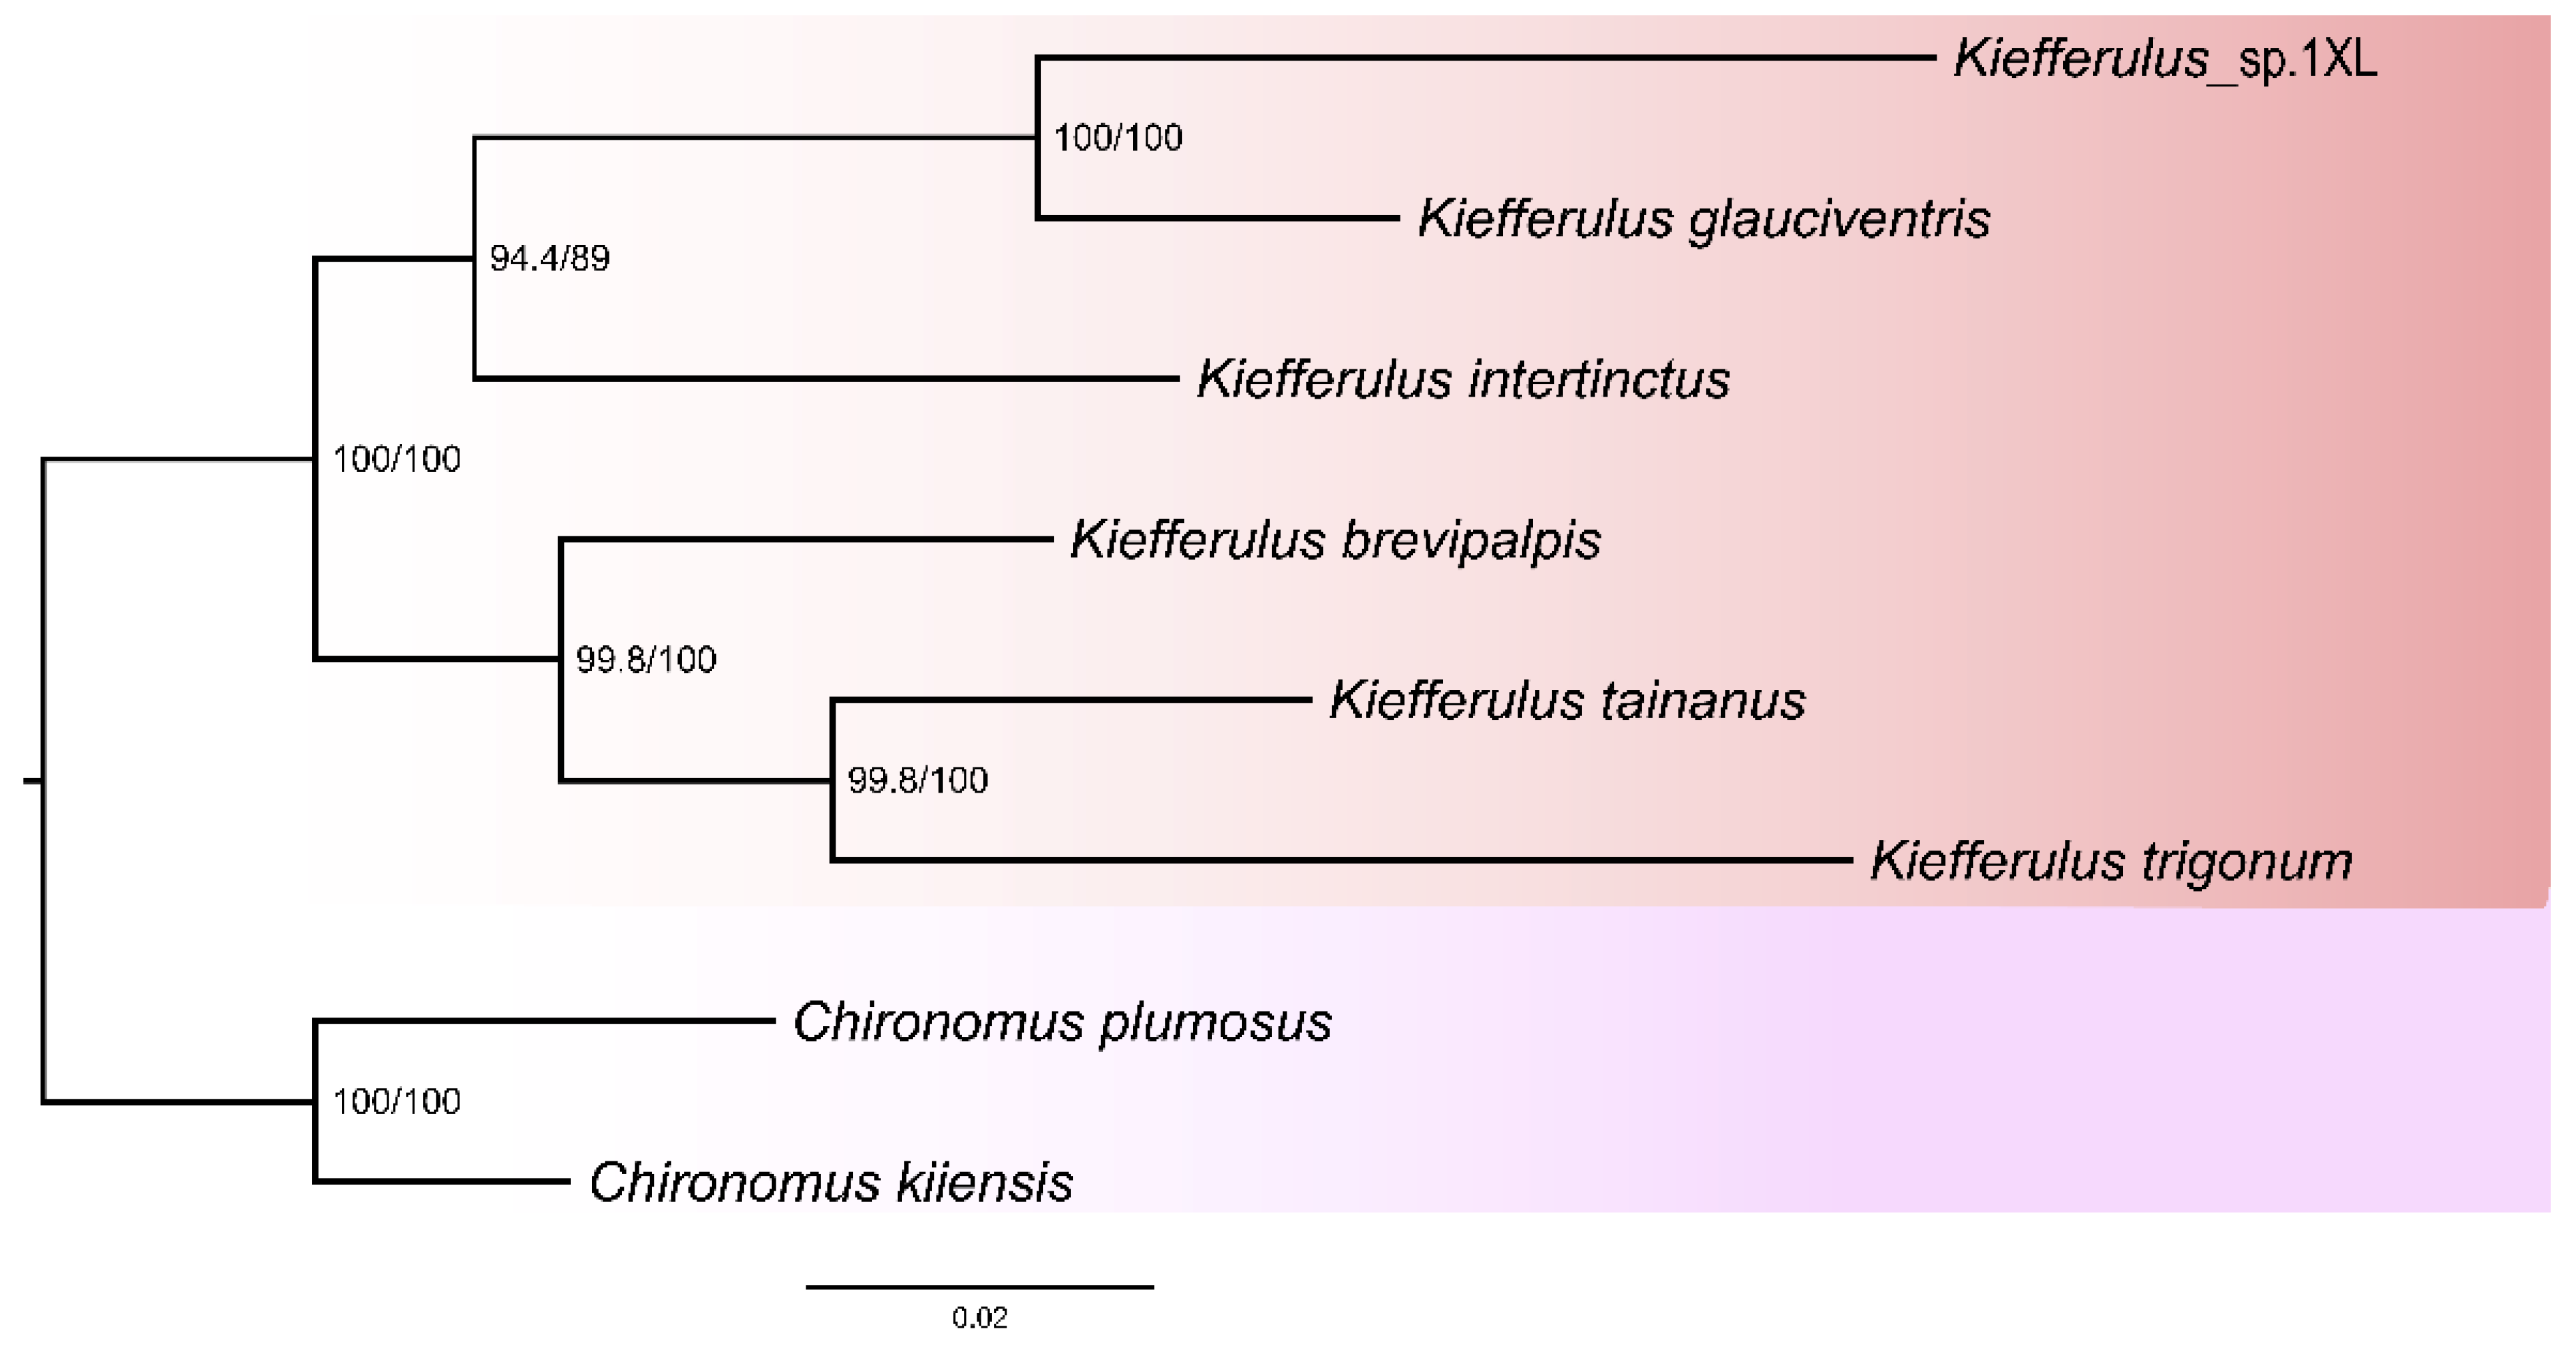
3.3. Phylogenetic Relationships

We used five matrices cds_faa (3726 sites), cds_fna (11,178 sites), cds_rrna (13,359 sites), cds12_fna (7452 sites), and cds12_rrna (9633 sites) to infer the phylogenetic relationship of the genus Kiefferulus based on ML and BI approaches. Two different methods based on five matrices yielded 11 trees (Figure 4 and Figures S3–S12). All trees exhibited highly consistent topology. In our phylogenetic results, six Kiefferulus were distinctively differentiated from others and grouped in a monophyletic clade. The phylogenetic results indicated that K. trigonum was close to K. tainanus, and K. glauciventris was close to K. sp.1XL (Figure 4 and Figures S3–S12).
The phylogenetic relationships of Kiefferulus and its close group are still controversial. Sæther [39] analyzed the phylogenetic relationships of the tribe Chironomini using the characters of females and found that the Chironomus is the sister group of Kiefferulus. Martin [40] reconstructed the phylogenetic relationship among genera closely related to Chironomus based on molecular data; the results well supported the broader Kiefferulus concept, with Einfeldia identified as the sister group of the genus Kiefferulus. Song et al. [6] used two ribosomal genes and four protein-coding gene segments to reconstruct the phylogenetic relationship of Kiefferulus. In addition, Tang et al. [41] also analyzed the relationship among Kiefferulus and its closely related genera, but their relationships have not been fully resolved. Unfortunately, due to limited sample availability, we have not yet resolved the phylogenetic relationships among Kiefferulus and its closely related groups. In future studies, researchers can include more sampling of genera, both adults and larvae, using more efficient data to explore the evolutionary history of this group, such as the low-coverage whole-genome genome, which shows great promise for resolving relations in difficult groups [42,43].

4. Conclusions

This study successfully obtained the complete mitogenomes of six Kiefferulus species: K. sp.1XL, K. brevipalpis, K. glauciventris, K. intertinctus, K. tainanus, and K. trigonum. The structural characteristics of all newly obtained sequences were similar to published Chironomidae species. The base composition calculated results showed that A and T were obviously biased for all newly obtained mitogenomes, which were also similar to other published Chironomidae species. The nonsynonymous-to-synonymous substitution ratio showed that ATP8 displayed the highest evolution rate, and COX1 had the lowest evolution rate. Thus, our study provided more available mitogenome data for the study of Chironomini and Chironomidae. Our phylogenetic results among the species of the genus Kiefferulus showed that all trees exhibited highly consistent topology, and six Kiefferulus were distinctively differentiated from others and grouped in a monophyletic clade.

Supplementary Materials

The following supporting information can be downloaded at https://www.mdpi.com/article/10.3390/insects15090646/s1, Table S1. Relative synonymous codon usages (RSCUs) of PCGs of Kiefferulus brevipalpis. Table S2. Relative synonymous codon usages (RSCUs) of PCGs of Kiefferulus glauciventris. Table S3. Relative synonymous codon usages (RSCUs) of PCGs of Kiefferulus intertinctus. Table S4. Relative synonymous codon usages (RSCUs) of PCGs of Kiefferulus sp.1XL. Table S5. Relative synonymous codon usages (RSCUs) of PCGs of Kiefferulus trigonum. Table S6. Relative synonymous codon usages (RSCUs) of PCGs of Kiefferulus tainanus. Figure S1. Start codons of protein-coding genes among Kiefferulus mitogenomes. Figure S2. Stop codons of protein-coding genes of Kiefferulus mitogenomes. Figure S3. Bayesian inference phylogenetic tree of Kiefferulus based on analysis cd_faa with GTR + CAT model in phylobayes. Support values on nodes indicate Bayesian posterior probabilities. Figure S4. Maximum likelihood phylogenetic tree of Kiefferulus based on analysis cds_faa with PMSF model in IQTREE. Support values on nodes indicate SH-aLRT/UFBoot2. Figure S5. Bayesian inference phylogenetic tree of Kiefferulus based on analysis cd_fna with GTR + CAT model in phylobayes. Support values on nodes indicate Bayesian posterior probabilities. Figure S6. Maximum likelihood phylogenetic tree of Kiefferulus based on analysis cds_fna with a partitioned model in IQTREE. Support values on nodes indicate SH-aLRT/UFBoot2. Figure S7. Bayesian inference phylogenetic tree of Kiefferulus based on analysis cd_rrna with GTR + CAT model in phylobayes. Support values on nodes indicate Bayesian posterior probabilities. Figure S8. Maximum likelihood phylogenetic tree of Kiefferulus based on analysis cds_rrna with partitioned model in IQTREE. Support values on nodes indicate SH-aLRT/UFBoot2. Figure S9. Bayesian inference phylogenetic tree of Kiefferulus based on analysis cd12_fna with GTR + CAT model in phylobayes. Support values on nodes indicate Bayesian posterior probabilities. Figure S10. Maximum likelihood phylogenetic tree of Kiefferulus based on analysis cds12_fna with partitioned model in IQTREE. Support values on nodes indicate SH-aLRT/UFBoot2. Figure S11. Bayesian inference phylogenetic tree of Kiefferulus based on analysis cd12_rrna with GTR + CAT model in phylobayes. Support values on nodes indicate Bayesian posterior probabilities. Figure S12. Maximum likelihood phylogenetic tree of Kiefferulus based on analysis cds12_rrna with partitioned model in IQTREE. Support values on nodes indicate SH-aLRT/UFBoot2.

Author Contributions

X.-L.L. and D.-Q.L. conceived and supervised this study; X.-L.L. identified specimens; D.Z., W.-D.J., X.-B.L. and H.-F.X. analyzed data; D.Z. and W.-D.J. wrote the first draft of this manuscript; Y.-W.J., X.-B.L. and H.-F.X. organized all tables and figures; X.-L.L., Y.-W.J. and D.-Q.L. reviewed and edited this paper. All authors have read and agreed to the published version of the manuscript.

Funding

This study was supported by the National Natural Science Foundation of China (31900344); Shandong Provincial Natural Science Foundation (ZR2023QH353); Sichuan Medical Law Research Center (YF23-Q08).

Institutional Review Board Statement

Not applicable.

Informed Consent Statement

Not applicable.

Data Availability Statement

The following information was supplied regarding the availability of DNA sequences: the new mitogenomes are deposited in GenBank of NCBI, and the accession numbers are PP884095–PP884099 and PP972215.

Acknowledgments

We sincerely thank Nathalie Mary and Shuang Qiu for collecting the materials.

Conflicts of Interest

The authors declare no conflicts of interest.

References

  1. Lencioni, V.; Cranston, P.S.; Makarchenko, E.J. Recent advances in the study of Chironomidae: An overview. J. Limnol. 2018, 77, 1–6. [Google Scholar] [CrossRef]
  2. Lin, X.L.; Zhao, Y.M.; Yan, L.P.; Liu, W.B.; Bu, W.J.; Wang, X.H.; Zheng, C.G. Mitogenomes provide new insights into the evolutionary history of Prodiamesinae (Diptera: Chironomidae). Zool. Scr. 2022, 51, 119–132. [Google Scholar] [CrossRef]
  3. Lin, X.L.; Liu, Z.; Yan, L.P.; Duan, X.; Bu, W.J.; Wang, X.H.; Zheng, C.G. Mitogenomes provide new insights of evolutionary history of Boreheptagyiini and Diamesini (Diptera: Chironomidae: Diamesinae). Ecol. Evol. 2022, 12, e8957. [Google Scholar] [CrossRef]
  4. Armitage, P.D.; Pinder, L.; Cranston, P. The Chironomidae: Biology and Ecology of Non-Biting Midges; Springer Science & Business Media: Berlin/Heidelberg, Germany, 2012. [Google Scholar] [CrossRef]
  5. Giłka, W.; Zakrzewska, M.; Lukashevich, E.D.; Vorontsov, D.D.; Soszyńska-Maj, A.; Skibińska, K.; Cranston, P.S. Wanted, tracked down and identified: Mesozoic non-biting midges of the subfamily Chironominae (Chironomidae, Diptera). Zool. J. Linn. Soc-Lond. 2021, 194, 874–892. [Google Scholar] [CrossRef]
  6. Song, C.; Wang, X.; Bu, W.; Qi, X. Morphology lies: A case-in-point with a new non-biting midge species from Oriental China (Diptera, Chironomidae). Zookeys 2020, 909, 67. [Google Scholar] [CrossRef]
  7. Epler, J.; Ekrem, T.; Cranston, P.J.; Cranston, P.S.; Epler, J. The larvae of Chironomidae of the holarctic region-keys and diagnoses. Insect Syst. Evol. 2013, 66, 387–556. [Google Scholar] [CrossRef]
  8. Cranston, P.S. The Chironomidae larvae associated with the tsunami-impacted waterbodies of the coastal plain of southwestern Thailand. Bull. Raffles Mus. 2007, 55, 231–244. [Google Scholar] [CrossRef]
  9. Cameron, S.L. Insect mitochondrial genomics: Implications for evolution and phylogeny. Annu. Rev. Entomol. 2014, 59, 95–117. [Google Scholar] [CrossRef] [PubMed]
  10. Ge, X.; Peng, L.; Vogler, A.P.; Morse, J.C.; Yang, L.; Sun, C.; Wang, B. Massive gene rearrangements of mitochondrial genomes and implications for the phylogeny of Trichoptera (Insecta). Syst. Entomol. 2022, 48, 278–295. [Google Scholar] [CrossRef]
  11. Boore, J.L. Animal mitochondrial genomes. Nucleic Acids Res. 1999, 27, 1767–1780. [Google Scholar] [CrossRef]
  12. Brown, W.M. The mitochondrial genome of animals. In Molecular Evolutionary Genetics; Plenum Press: New York, NY, USA, 1985; pp. 95–130. [Google Scholar]
  13. Li, X.; Yan, L.; Pape, T.; Gao, Y.; Zhang, D. Evolutionary insights into bot flies (Insecta: Diptera: Oestridae) from comparative analysis of the mitochondrial genomes. Int. J. Biol. Macromol. 2020, 149, 371–380. [Google Scholar] [CrossRef] [PubMed]
  14. Tang, L.; Yan, L.; Gao, Y.; Zhang, D. First report of mitochondrial genome from the subfamily Bengaliinae (Diptera: Calliphoridae). Mitochondrial DNA Part B 2019, 4, 1560–1561. [Google Scholar] [CrossRef]
  15. Zhang, D.; He, F.X.; Li, X.B.; Aishan, Z.; Lin, X.L. New mitogenomes of the Polypedilum generic complex (Diptera: Chironomidae): Characterization and phylogenetic implications. Insects 2023, 14, 238. [Google Scholar] [CrossRef] [PubMed]
  16. Fang, X.; Wang, X.; Mao, B.; Xiao, Y.; Shen, M.; Fu, Y. Comparative mitogenome analyses of twelve non-biting flies and provide insights into the phylogeny of Chironomidae (Diptera: Culicomorpha). Sci. Rep. 2023, 13, 9200. [Google Scholar] [CrossRef]
  17. Cranston, P.S.; Webb, C.J.; Martin, J.J. The saline nuisance chironomid Carteronica longilobus (Diptera: Chironomidae): A systematic reappraisal. Syst. Entomol. 1990, 15, 401–432. [Google Scholar] [CrossRef]
  18. Li, S.Y.; Zhao, Y.M.; Guo, B.X.; Li, C.H.; Sun, B.J.; Lin, X.L. Comparative analysis of mitogenomes of Chironomus (Diptera: Chironomidae). Insects 2022, 13, 1164. [Google Scholar] [CrossRef]
  19. Bolger, A.M.; Lohse, M.; Usadel, B. Trimmomatic: A flexible trimmer for Illumina sequence data. Bioinformatics 2014, 30, 2114–2120. [Google Scholar] [CrossRef]
  20. Dierckxsens, N.; Mardulyn, P.; Smits, G.J. NOVOPlasty: De novo assembly of organelle genomes from whole genome data. Nucleic Acids Res. 2017, 45, e18. [Google Scholar] [CrossRef]
  21. Peng, Y.; Leung, H.C.; Yiu, S.-M.; Chin, F.Y. IDBA-UD: A de novo assembler for single-cell and metagenomic sequencing data with highly uneven depth. Bioinformatics 2012, 28, 1420–1428. [Google Scholar] [CrossRef]
  22. Kearse, M.; Moir, R.; Wilson, A.; Stones-Havas, S.; Cheung, M.; Sturrock, S.; Buxton, S.; Cooper, A.; Markowitz, S.; Duran, C. Geneious basic: An integrated and extendable desktop software platform for the organization and analysis of sequence data. Bioinformatics 2012, 28, 1647–1649. [Google Scholar] [CrossRef]
  23. Lowe, T.M.; Chan, P.P. tRNAscan-SE On-line: Integrating search and context for analysis of transfer RNA genes. Nucleic Acids Res. 2016, 44, W54–W57. [Google Scholar] [CrossRef]
  24. Kumar, S.; Stecher, G.; Li, M.; Knyaz, C.; Tamura, K. MEGA X: Molecular evolutionary genetics analysis across computing platforms. Mol. Biol. Evol. 2018, 35, 1547–1549. [Google Scholar] [CrossRef]
  25. Shen, W.; Le, S.; Li, Y.; Hu, F.J. SeqKit: A cross-platform and ultrafast toolkit for FASTA/Q file manipulation. PLoS ONE 2016, 11, e0163962. [Google Scholar] [CrossRef]
  26. Rozas, J.; Ferrer-Mata, A.; Sánchez-DelBarrio, J.C.; Guirao-Rico, S.; Librado, P.; Ramos-Onsins, S.E.; Sánchez-Gracia, A. DnaSP 6: DNA sequence polymorphism analysis of large data sets. Mol. Biol. Evol. 2017, 34, 3299–3302. [Google Scholar] [CrossRef] [PubMed]
  27. Katoh, K.; Standley, D.M. MAFFT Multiple sequence alignment software version 7: Improvements in performance and usability. Mol. Biol. Evol. 2013, 30, 772–780. [Google Scholar] [CrossRef] [PubMed]
  28. Capella-Gutiérrez, S.; Silla-Martínez, J.M.; Gabaldón, T.J.B. trimAl: A tool for automated alignment trimming in large-scale phylogenetic analyses. Bioinformatics 2009, 25, 1972–1973. [Google Scholar] [CrossRef] [PubMed]
  29. Kück, P.; Longo, G.C. FASconCAT-G: Extensive functions for multiple sequence alignment preparations concerning phylogenetic studies. Front. Zool. 2014, 11, 81. [Google Scholar] [CrossRef] [PubMed]
  30. Kalyaanamoorthy, S.; Minh, B.Q.; Wong, T.K.; Von Haeseler, A.; Jermiin, L.S. ModelFinder: Fast model selection for accurate phylogenetic estimates. Nat. Methods 2017, 14, 587–589. [Google Scholar] [CrossRef]
  31. Minh, B.Q.; Schmidt, H.A.; Chernomor, O.; Schrempf, D.; Woodhams, M.D.; Haeseler, A.; Lanfear, R. IQ-TREE 2: New models and efficient methods for phylogenetic inference in the genomic era. Mol. Biol. Evol. 2020, 37, 1530–1534. [Google Scholar] [CrossRef]
  32. Wang, H.C.; Minh, B.Q.; Susko, E.; Roger, A.J. Modeling site heterogeneity with posterior mean site frequency profiles accelerates accurate phylogenomic estimation. Syst. Biol. 2017, 67, 216–235. [Google Scholar] [CrossRef]
  33. Lartillot, N.; Rodrigue, N.; Stubbs, D.; Richer, J.J. PhyloBayes MPI: Phylogenetic reconstruction with infinite mixtures of profiles in a parallel environment. Syst. Biol. 2013, 62, 611–615. [Google Scholar] [CrossRef] [PubMed]
  34. Zheng, C.G.; Liu, Z.; Zhao, Y.M.; Wang, Y.; Bu, W.J.; Wang, X.H.; Lin, X.L. First report on mitochondrial gene rearrangement in non-biting midges, revealing a synapomorphy in Stenochironomus Kieffer (Diptera: Chironomidae). Insects 2022, 13, 115. [Google Scholar] [CrossRef] [PubMed]
  35. Park, K.; Jo, H.; Choi, B.; Kwak, I.S. Complete mitochondrial genome of Stictochironomus akizukii (Tokunaga)(Chironomidae, Diptera) assembled from next-generation sequencing data. Mitochondrial DNA Part B 2020, 5, 2310–2311. [Google Scholar] [CrossRef] [PubMed]
  36. Ge, X.; Zang, H.; Ye, X.; Peng, L.; Wang, B.; Lian, G.; Sun, C.J. Comparative mitogenomic analyses of hydropsychidae revealing the novel rearrangement of protein-coding gene and tRNA (Trichoptera: Annulipalpia). Insects 2022, 13, 759. [Google Scholar] [CrossRef] [PubMed]
  37. Hurst, L.D. The Ka/Ks ratio: Diagnosing the form of sequence evolution. Trends Genet. 2002, 18, 486–487. [Google Scholar] [CrossRef]
  38. Yang, Z.; Bielawski, J.P. Statistical methods for detecting molecular adaptation. Trends Ecol. Evol. 2000, 15, 496–503. [Google Scholar] [CrossRef]
  39. Service, M. Female genitalia in Chironomidae and other Nematocera: Morphology, phylogenies, keys. Bull. Fish. Res. Board Can. 1977, 197, 1–209. [Google Scholar]
  40. Martin, J.; Blinov, A.; Alieva, E.; Hirabayashi, K. A molecular phylogenetic investigation of the genera closely related to Chironomus Meigen (Diptera: Chironomidae). In Contributions to the Systematics and Ecology of Aquatic Diptera. A Tribute to Ole A. Sæther; Andersen, T., Ed.; Caddis Press: Columbus, OH, USA, 2007; pp. 193–203. [Google Scholar]
  41. Tang, H.; Cheng, Q.; Krosch, M.N.; Cranston, P.S. Maritime midge radiations in the Pacific Ocean (Diptera: Chironomidae). Syst. Entomol. 2023, 48, 111–126. [Google Scholar] [CrossRef]
  42. Zhang, D.; Niu, Z.Q.; Luo, A.R.; Orr, M.C.; Ferrari, R.R.; Jin, J.F.; Wu, Q.T.; Zhang, F.; Zhu, C.D. Testing the systematic status of Homalictus and Rostrohalictus with weakened cross-vein groups within Halictini (Hymenoptera: Halictidae) using low-coverage whole-genome sequencing. Insect Sci. 2022, 29, 1819–1833. [Google Scholar] [CrossRef]
  43. Zhang, F.; Ding, Y.; Zhu, C.D.; Zhou, X.; Orr, M.C.; Scheu, S.; Luan, Y.X. Phylogenomics from low-coverage whole-genome sequencing. Methods Ecol. Evol. 2019, 10, 507–517. [Google Scholar] [CrossRef]
Figure 1. A mitogenome map showing the representative species from six species within the genus Kiefferulus. The arrow indicates the direction of gene transcription. We used normative abbreviations to represent PCGs and rRNAs, and single-letter abbreviations were used to represent tRNAs. The GC content of the complete mitogenome is shown in the second circle. The GC-skew of the complete mitogenome is shown in the third circle. The innermost circle shows the length of the complete mitogenome.
Insects 15 00646 g001
Figure 2. The relative synonymous codon usage (RSCU) of the mitochondrial protein-coding genes of five Kiefferulus species. The X-axis shows different amino acids, and the Y-axis shows the RSCU value (the number of times a certain synonymous codon is used/the average number of times that all codons coding the amino acid are used).
Insects 15 00646 g002
Figure 3. The evolution rate of 13 PCGs of Kiefferulus. Ka refers to nonsynonymous nucleotide substitutions, Ks refers to synonymous nucleotide substitutions, and Ka/Ks refers to the selection pressure of each PCG. The abscissa represents the 13 PCGs, and the ordinate represents Ka/Ks values.
Insects 15 00646 g003
Figure 4. Phylogenetic tree of genus Kiefferulus based on cds_faa matrix with partition model in IQ-TREE. Support values on nodes indicate SH-aLRT/UFBoot2.
Insects 15 00646 g004
Table 1. Collection information of newly sequenced species in this study.
Species LocationLongitude and
Latitude
Elevation (m)Life StageDateCollectorAccession NumberReferences
Kiefferulus sp.1XLNamibia, Otjozondjupa16.745° E, −22.111° N1220Adult4 December 2018Xiaolong LinPP884096This study
Kiefferulus brevipalpisNamibia, Otjozondjupa16.745° E, −22.111° N1220Adult4 December 2018Xiaolong LinPP884099This study
Kiefferulus glauciventrisChina, Xishuangbanna99.989° E, 22.055° N700Adult6 May 2013Xiaolong LinPP884098This study
Kiefferulus intertinctusNew Caledonia, Tontouta166.206° E, −22.008° N10Pupa11 May 2018Nathalie MaryPP884097This study
Kiefferulus tainanusChina, Guangzhou113.959° E, 23.339° N149Adult12 April 2018Xiaolong LinPP972215This study
Kiefferulus trigonumChina, Huanggang115.738° E, 31.095° N552Adult11 July 2021Shuang QiuPP884095This study
Table 2. Nucleotide composition of newly sequenced species.
SpeciesRegionsLength (bp) ATCGATGCAT-SkewGC-Skew
Kiefferulus brevipalpisWhole genome15,76740.2137.1213.649.0277.3322.660.040 −0.204
PCGs11,61931.22 44.50 12.85 11.43 75.72 24.27 −0.175 −0.059
Site 1414131.93 38.64 12.07 17.35 70.57 29.43 −0.090 0.155
Site 2373921.47 48.55 18.01 11.95 70.02 29.96 −0.385 −0.203
Site 3373940.26 46.30 8.46 4.98 86.56 13.44 −0.069 −0.233
tRNA148841.0638.648.6711.6379.7020.300.030 0.146
l-rRNA138141.2043.954.7110.1485.1614.84−0.032 0.366
s-rRNA81542.8240.615.4011.1783.4416.560.026 0.348
CR67446.4449.112.671.7895.554.45 −0.028 −0.200
Kiefferulus glauciventrisWhole genome15,64439.2437.7713.849.1577.0122.990.019 −0.204
PCGs11,61930.48 44.62 13.10 11.80 75.10 24.90 −0.188 −0.052
Site 1414131.41 37.34 13.13 18.12 68.75 31.25 −0.080 0.161
Site 2373921.45 48.57 18.04 11.93 70.02 29.98 −0.385 −0.206
Site 3373938.59 47.94 8.12 5.34 86.53 13.47 −0.108 −0.200
tRNA148741.2938.538.8811.3079.8320.170.035 0.120
l-rRNA136843.6441.084.6810.6084.7215.280.030 0.388
s-rRNA81042.1041.235.4311.2383.3316.670.010 0.348
CR56849.4745.772.642.1195.254.750.039 −0.111
Kiefferulus intertinctusWhole genome15,64439.8738.2413.058.8478.1121.890.021 −0.192
PCGs11,61931.13 45.34 12.33 11.20 76.47 23.53 −0.186 −0.048
Site 1414131.76 38.38 12.10 17.75 70.14 29.86 −0.088 0.185
Site 2373921.48 48.09 18.44 11.98 69.58 30.42 −0.379 −0.213
Site 3373940.16 49.54 6.44 3.86 89.70 10.30 −0.104 −0.235
Kiefferulus intertinctustRNA149041.0739.138.4611.3480.2019.800.024 0.146
l-rRNA137642.0843.314.659.9685.3914.61−0.014 0.363
s-rRNA81542.5841.235.4010.8083.8016.200.016 0.333
CR53343.7151.781.882.6395.504.50−0.085 0.167
Kiefferulus sp.1XLWhole genome15,58838.4236.7015.039.8575.1224.880.023 −0.208
PCGs11,61929.94 43.16 14.58 12.32 73.10 26.90 −0.181 −0.084
Site 1414131.84 36.34 13.80 18.02 68.18 31.82 −0.062 0.115
Site 2373921.19 48.13 18.61 12.06 69.33 30.67 −0.385 −0.214
Site 3373936.79 45.00 11.32 6.89 81.79 18.21 −0.100 −0.256
tRNA148840.3938.989.0711.5679.3720.630.018 0.121
l-rRNA136943.8340.325.2610.5984.1515.850.042 0.336
s-rRNA81140.5741.435.6712.3382.0018.00−0.010 0.370
CR54648.1746.343.482.0194.515.490.019 −0.267
Kiefferulus trigonumWhole genome15,65740.4738.9712.198.3779.4420.560.019 −0.186
PCGs11,62131.82 46.42 11.21 10.54 78.24 21.76 −0.187 −0.031
Site 1414132.52 39.19 11.40 16.88 71.72 28.28 −0.090 0.163
Site 2374021.28 49.01 17.84 11.87 70.29 29.71 −0.392 −0.205
Site 3374041.67 51.05 4.40 2.87 92.72 7.28 −0.101 −0.180
tRNA148441.9838.888.0911.0580.8619.140.038 0.155
l-rRNA137841.3643.904.5710.1685.2714.73−0.030 0.379
s-rRNA81244.0940.765.309.8584.8515.150.039 0.301
CR51844.9851.162.701.1696.143.86−0.064 −0.400
Kiefferulus tainanusWhole genome15,74840.1538.6712.568.6278.8221.180.018−18.620
PCGs11,22030.7745.4111.7512.0876.1823.82−0.1921.380
Site 1374031.3438.0511.918.7269.3930.61−0.09622.27
Site 2374020.4347.5118.9613.1067.9432.06−0.398−18.27
Site 3374040.5350.674.394.4191.208.80−0.1110.300
tRNA149441.538.768.4311.3180.2519.750.03414.580
l-rRNA138843.2342.514.549.7385.7314.270.00836.360
s-rRNA81443.2441.285.1610.3284.5215.480.02333.330
CR55445.6749.283.431.6294.955.05−0.038−35.710
Disclaimer/Publisher’s Note: The statements, opinions and data contained in all publications are solely those of the individual author(s) and contributor(s) and not of MDPI and/or the editor(s). MDPI and/or the editor(s) disclaim responsibility for any injury to people or property resulting from any ideas, methods, instructions or products referred to in the content.

