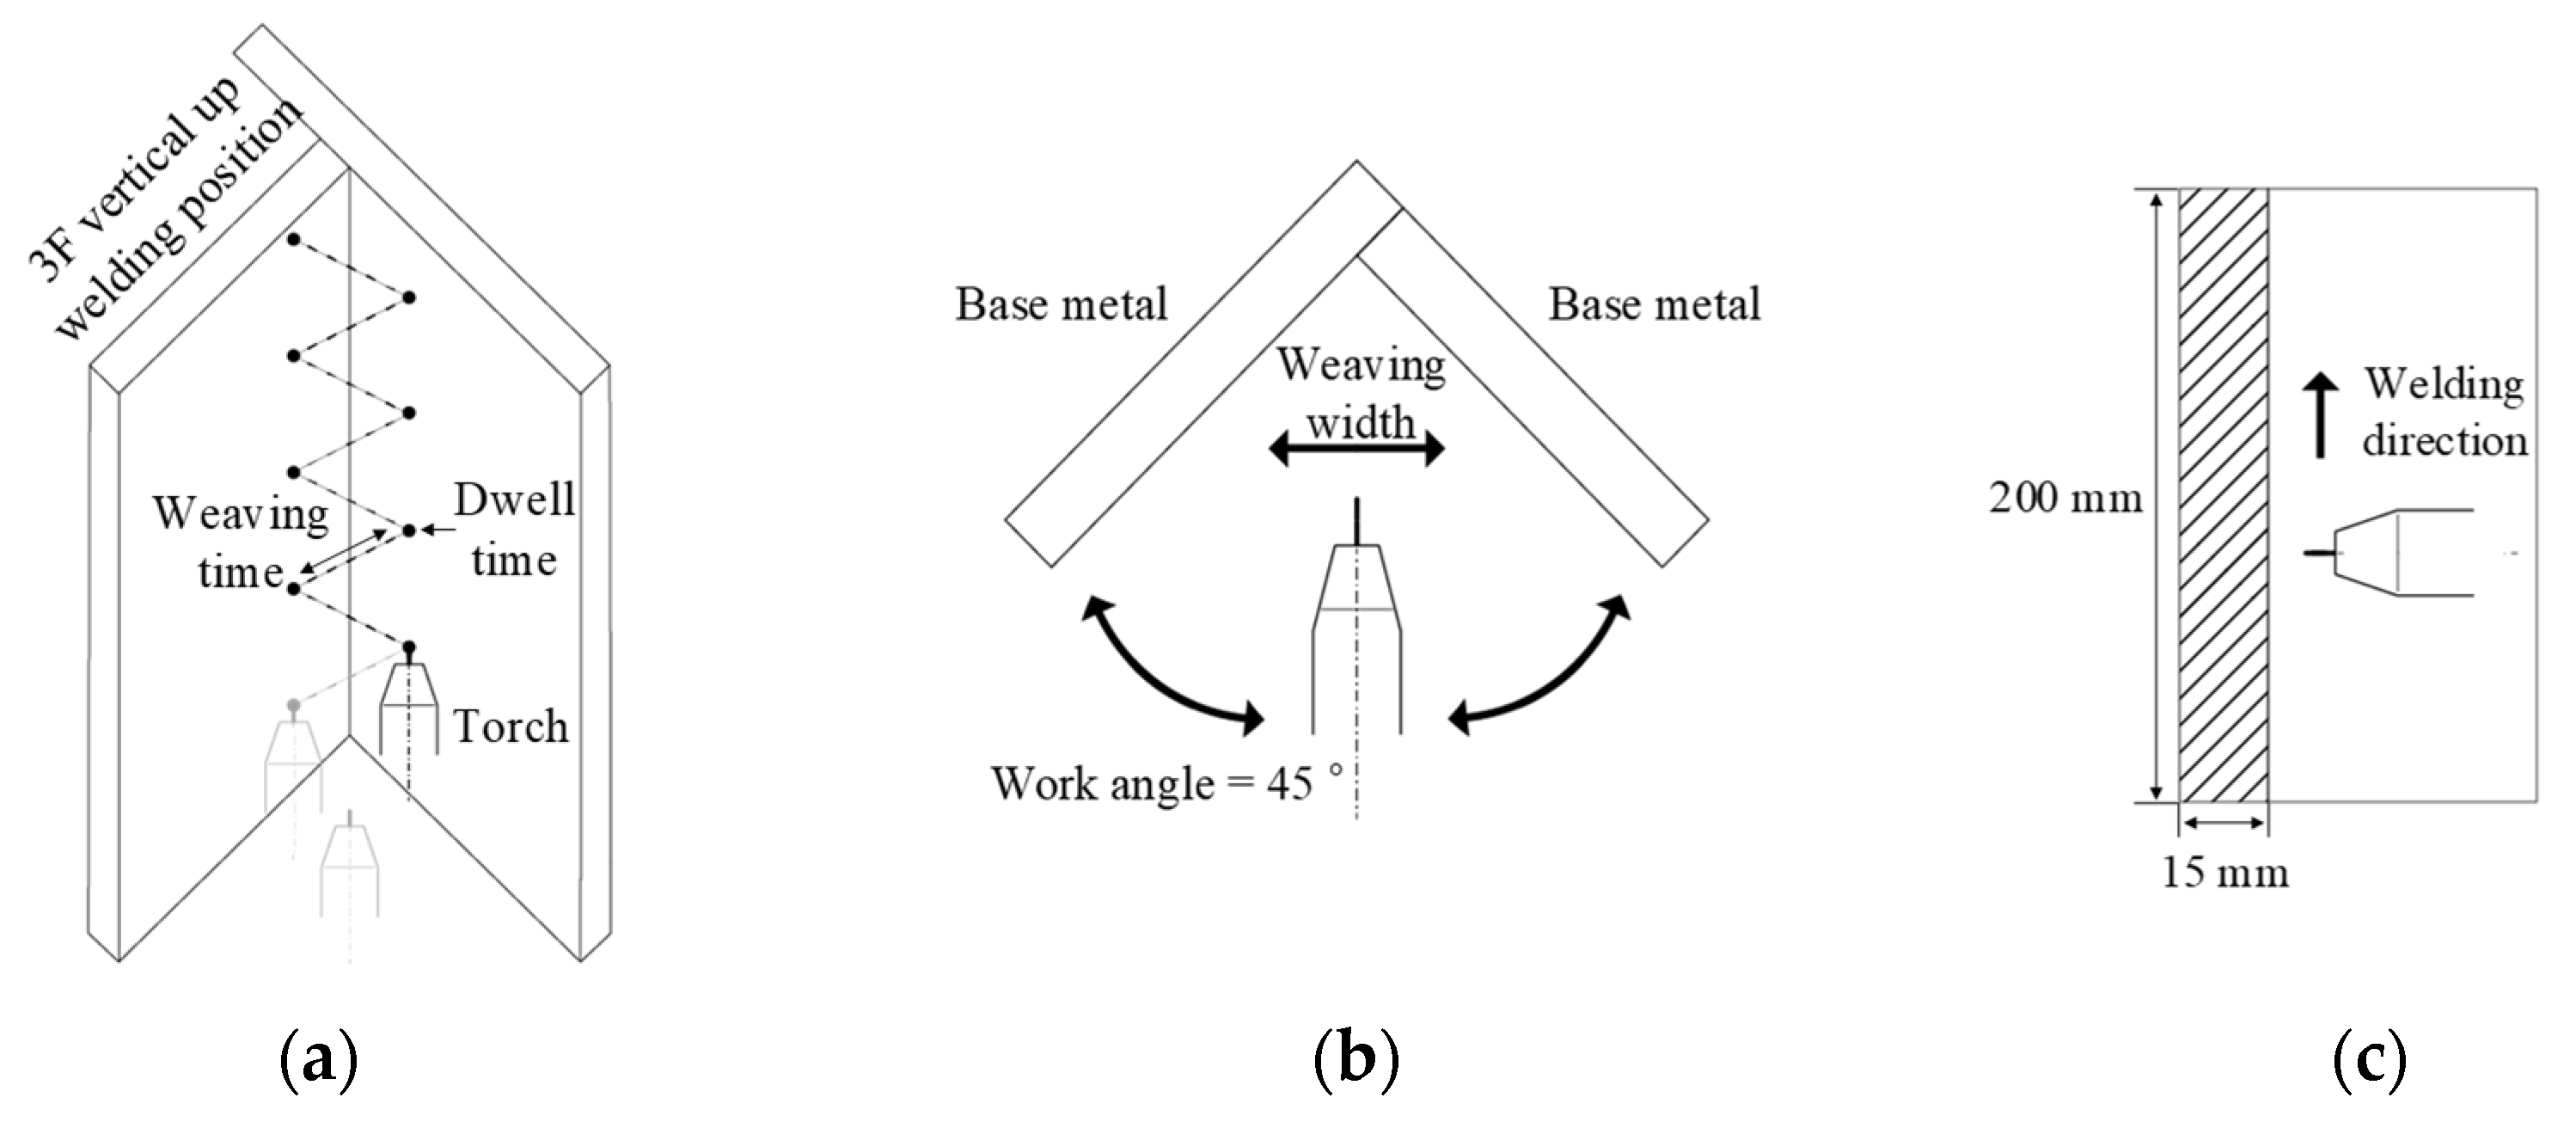
Figure 1.
Dimensions and schematic of the test plates in 3F vertical up welding position: (a) overview, (b) top view, and (c) side view.
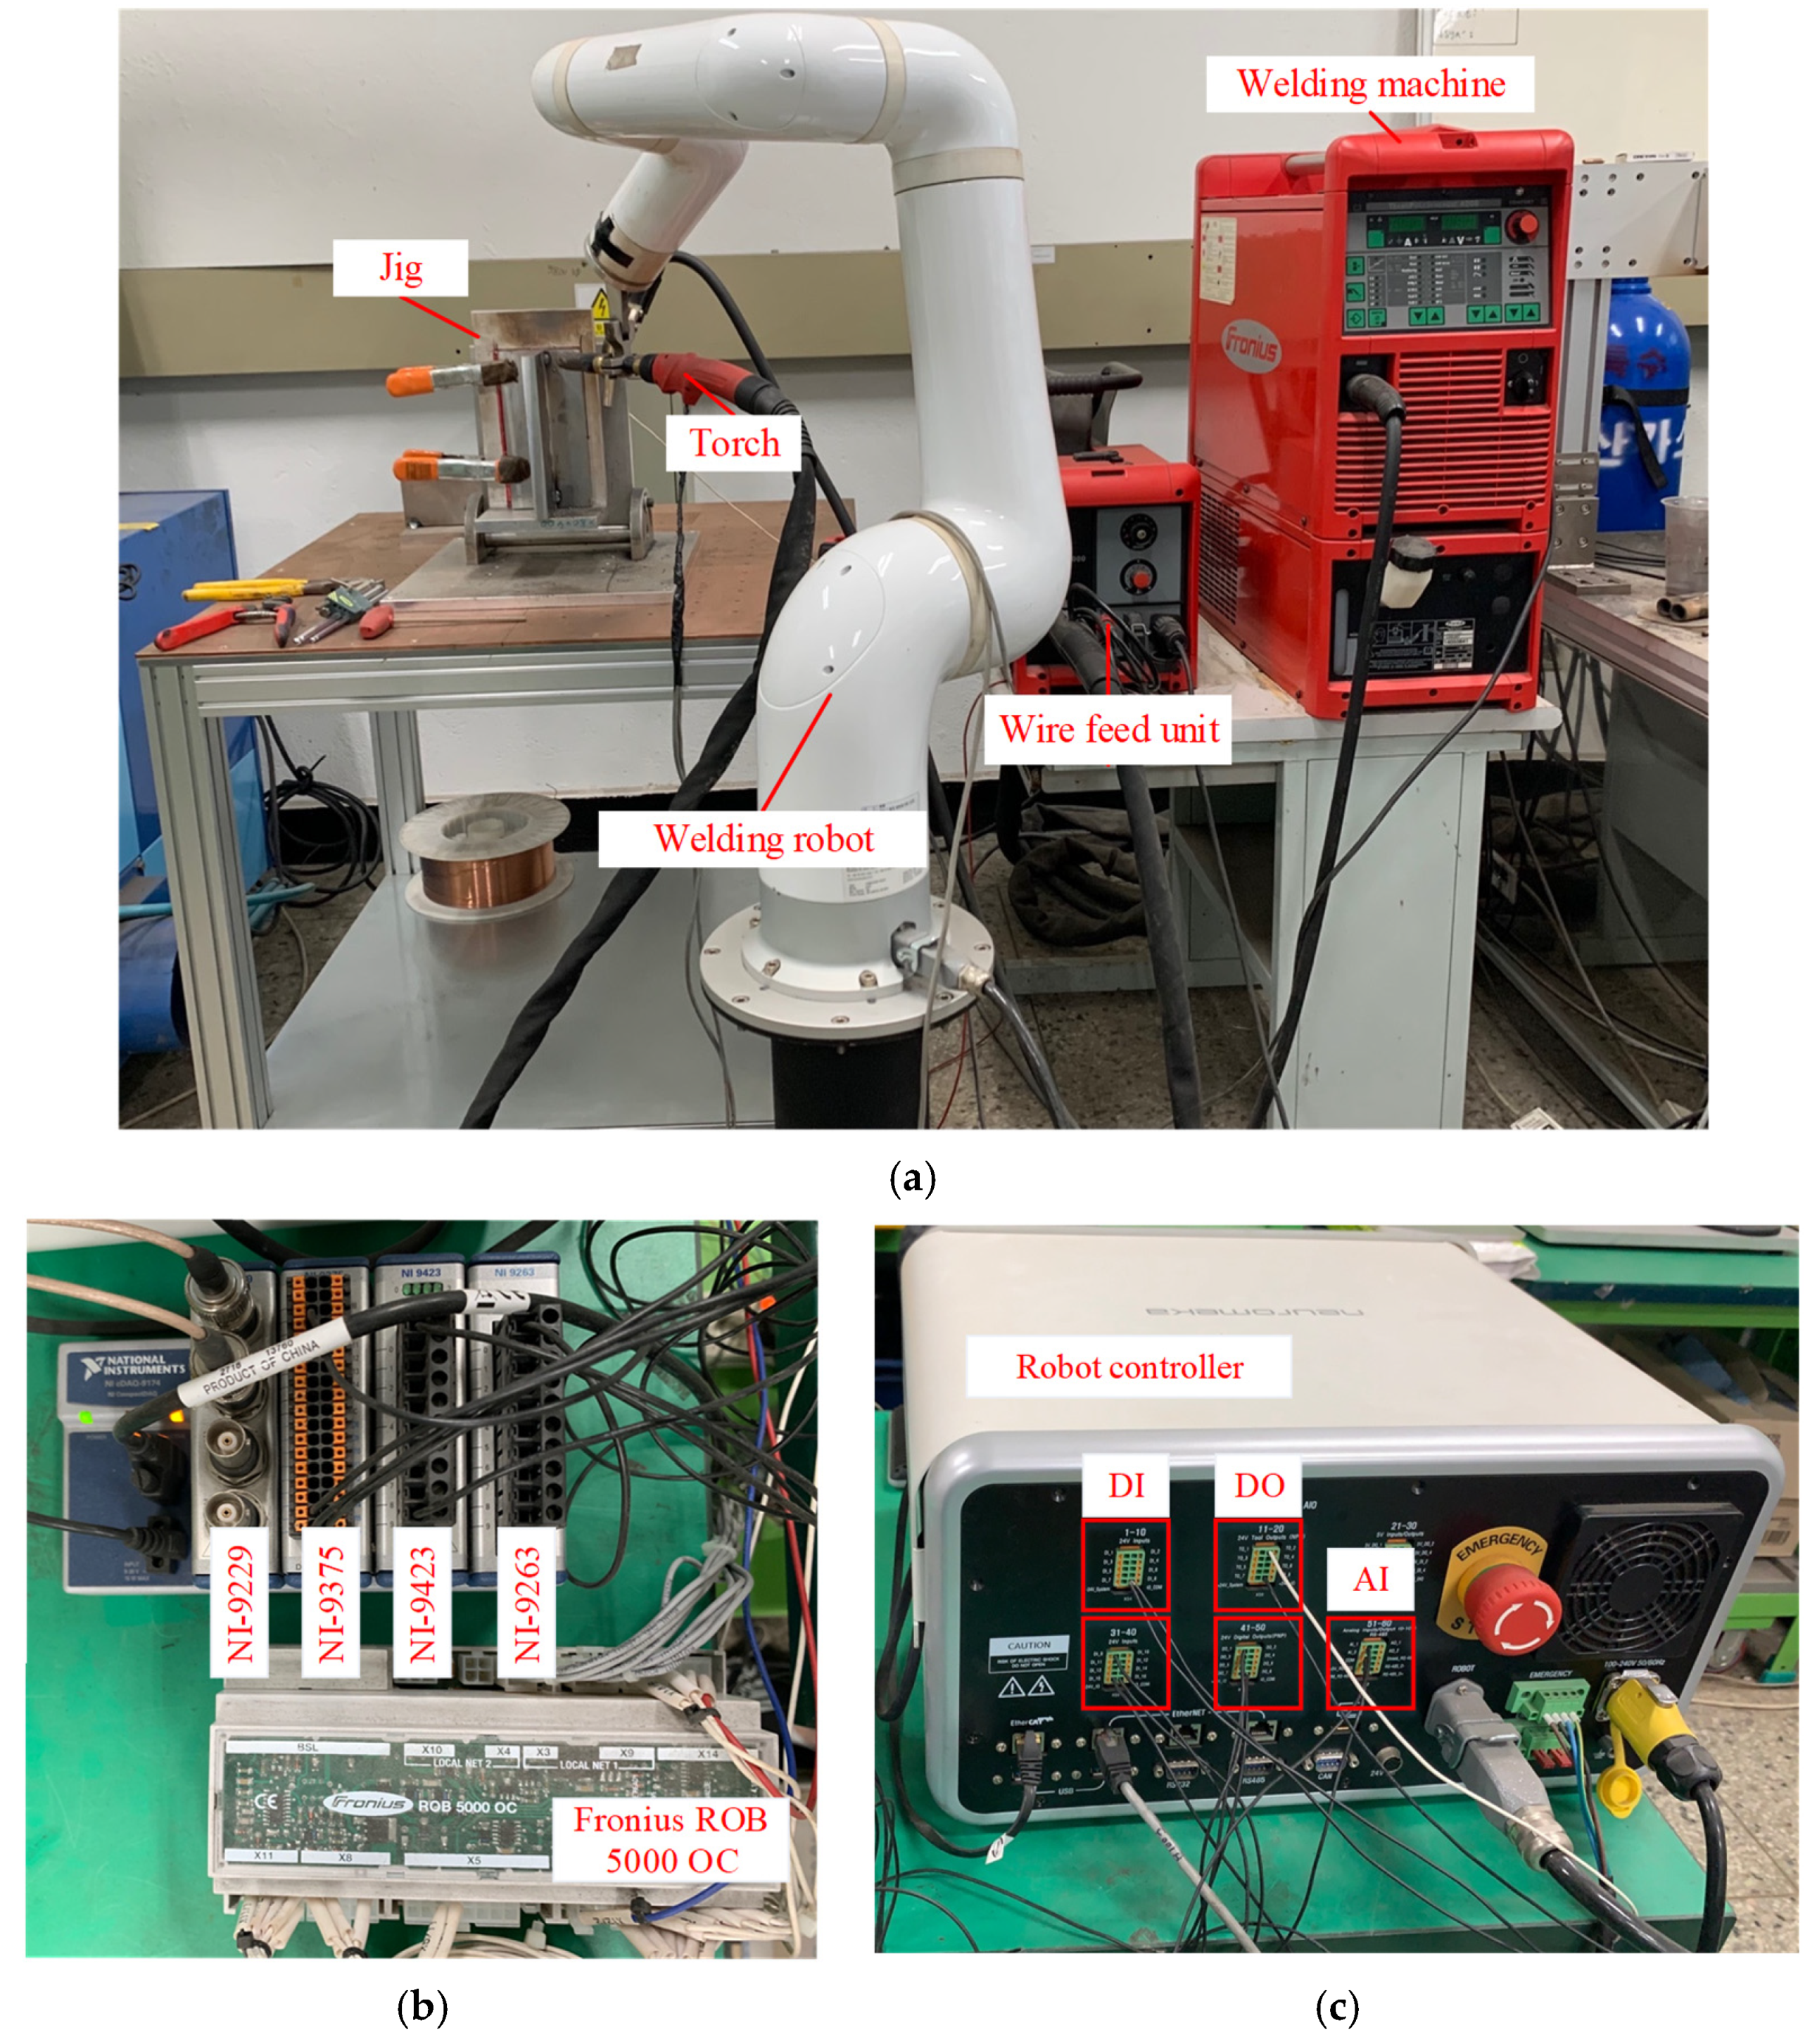
Figure 2.
Experimental equipment: (a) welding robot and welding machine, (b) NI modules and ROB 5000 OC, and (c) robot controller.
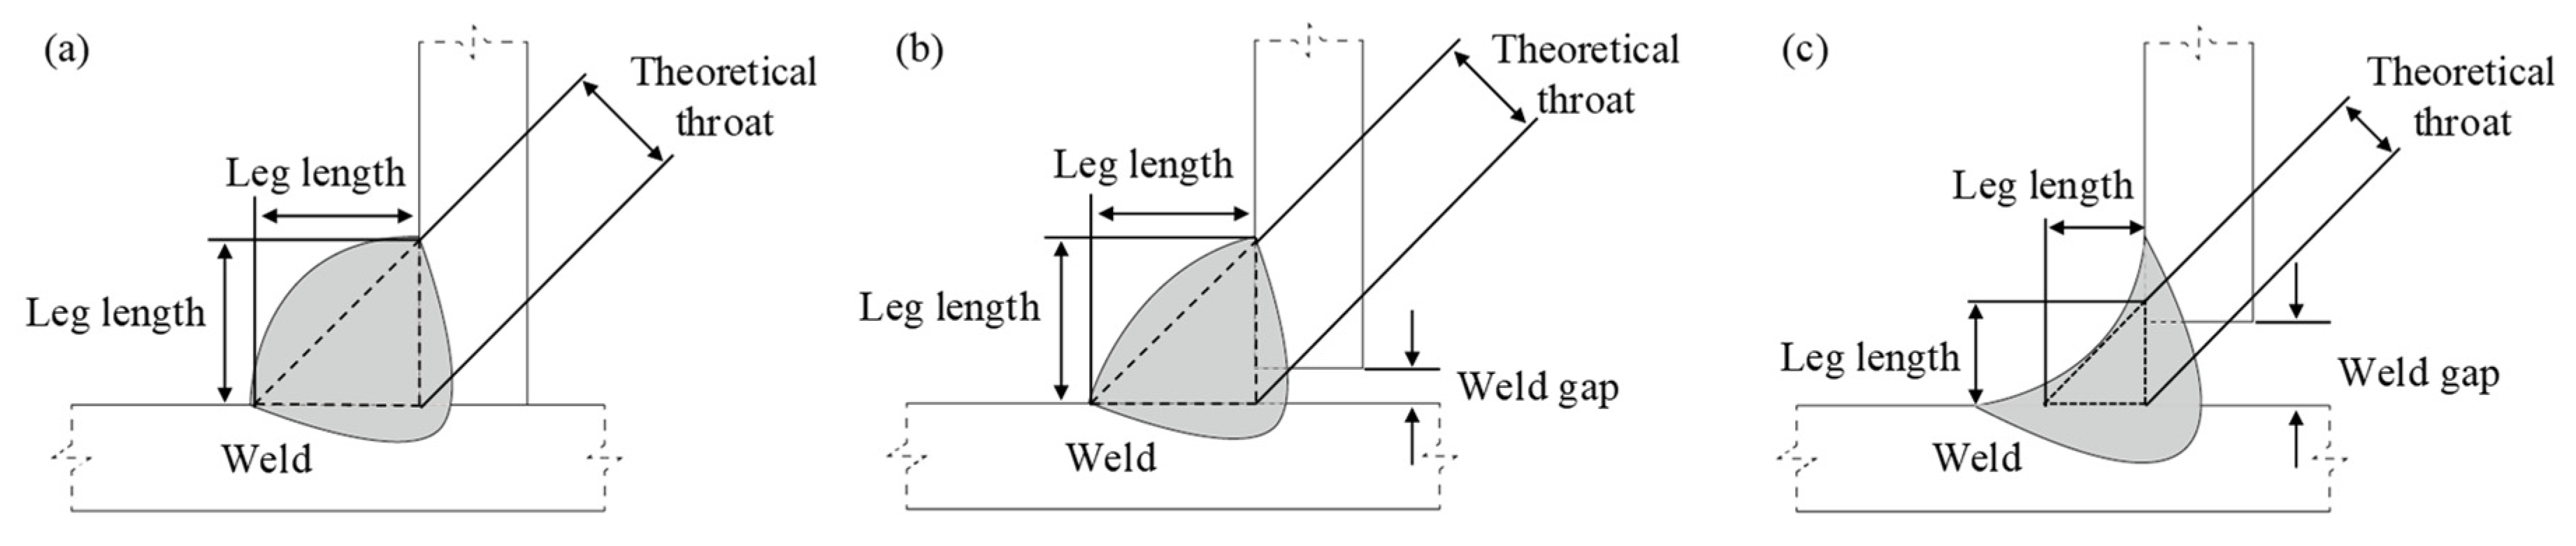
Figure 3.
Welded bead shape quality parameters on the T-joint: (a) without weld gap and (b,c) with weld gap.
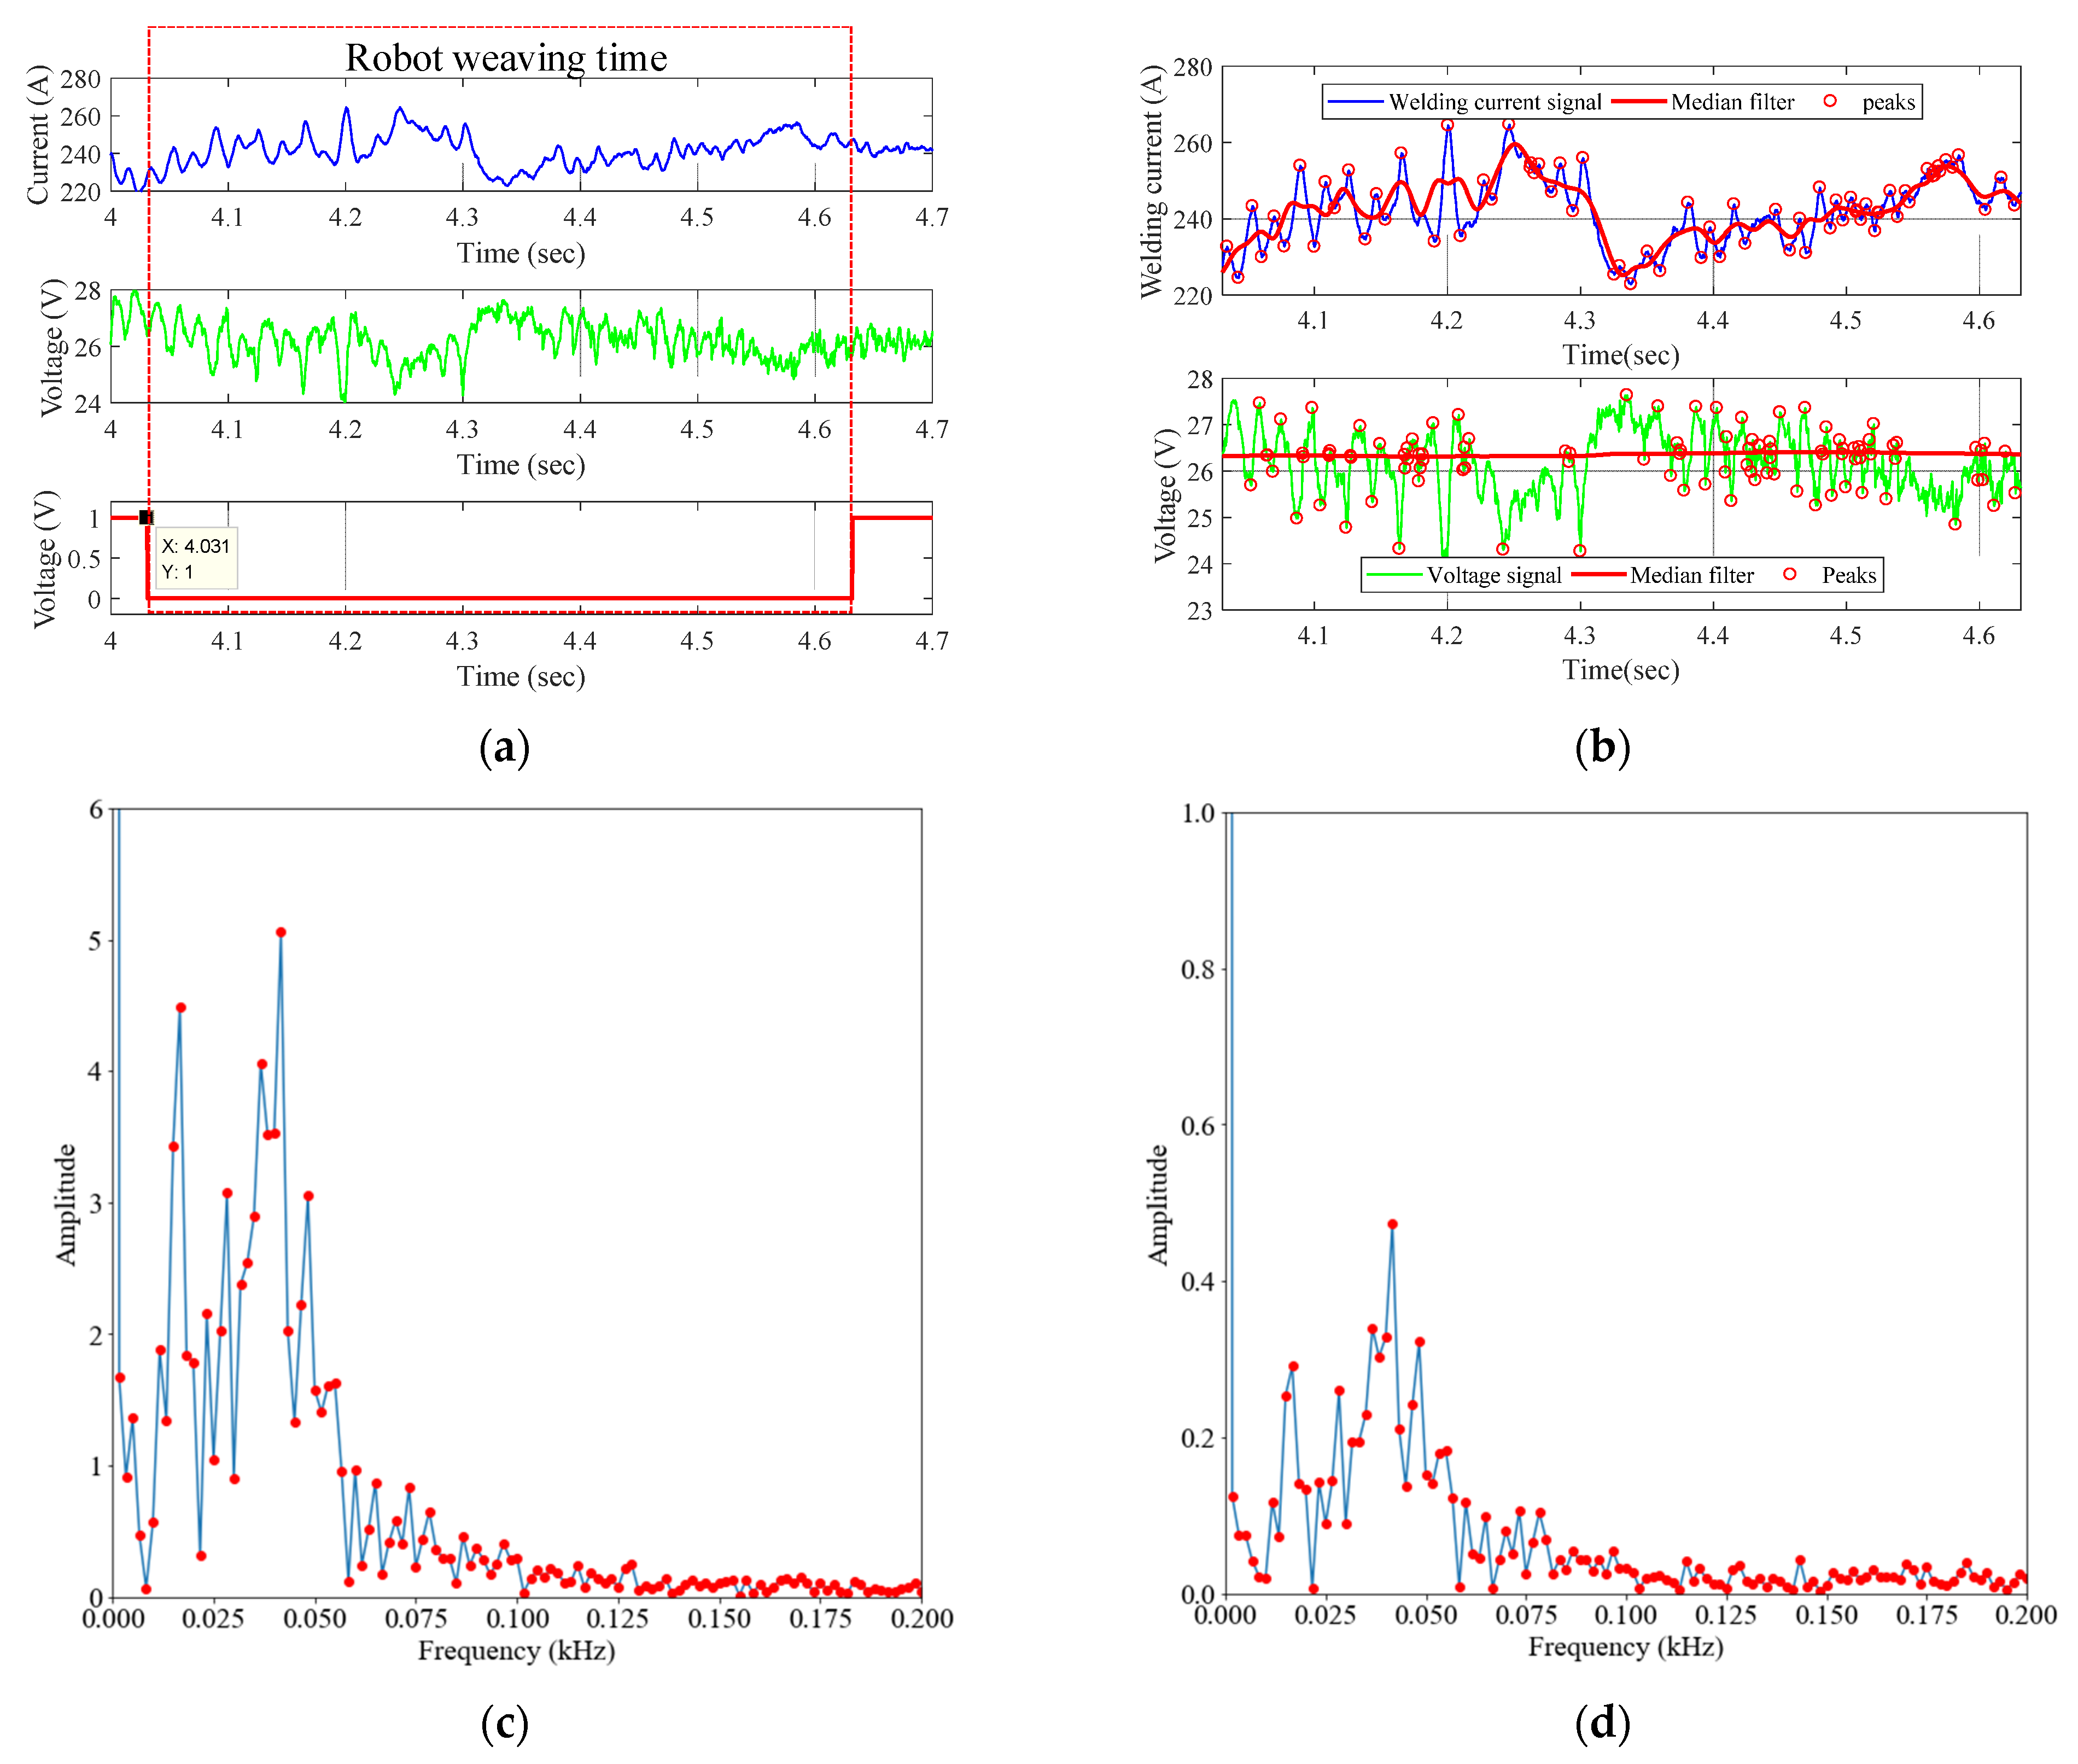
Figure 4.
Time and frequency domain feature extraction: (a) raw data of the welding current and voltage signal, (b) feature point generation using the median filter, (c) FFT result of the welding current signal, and (d) FFT result of the voltage signal.
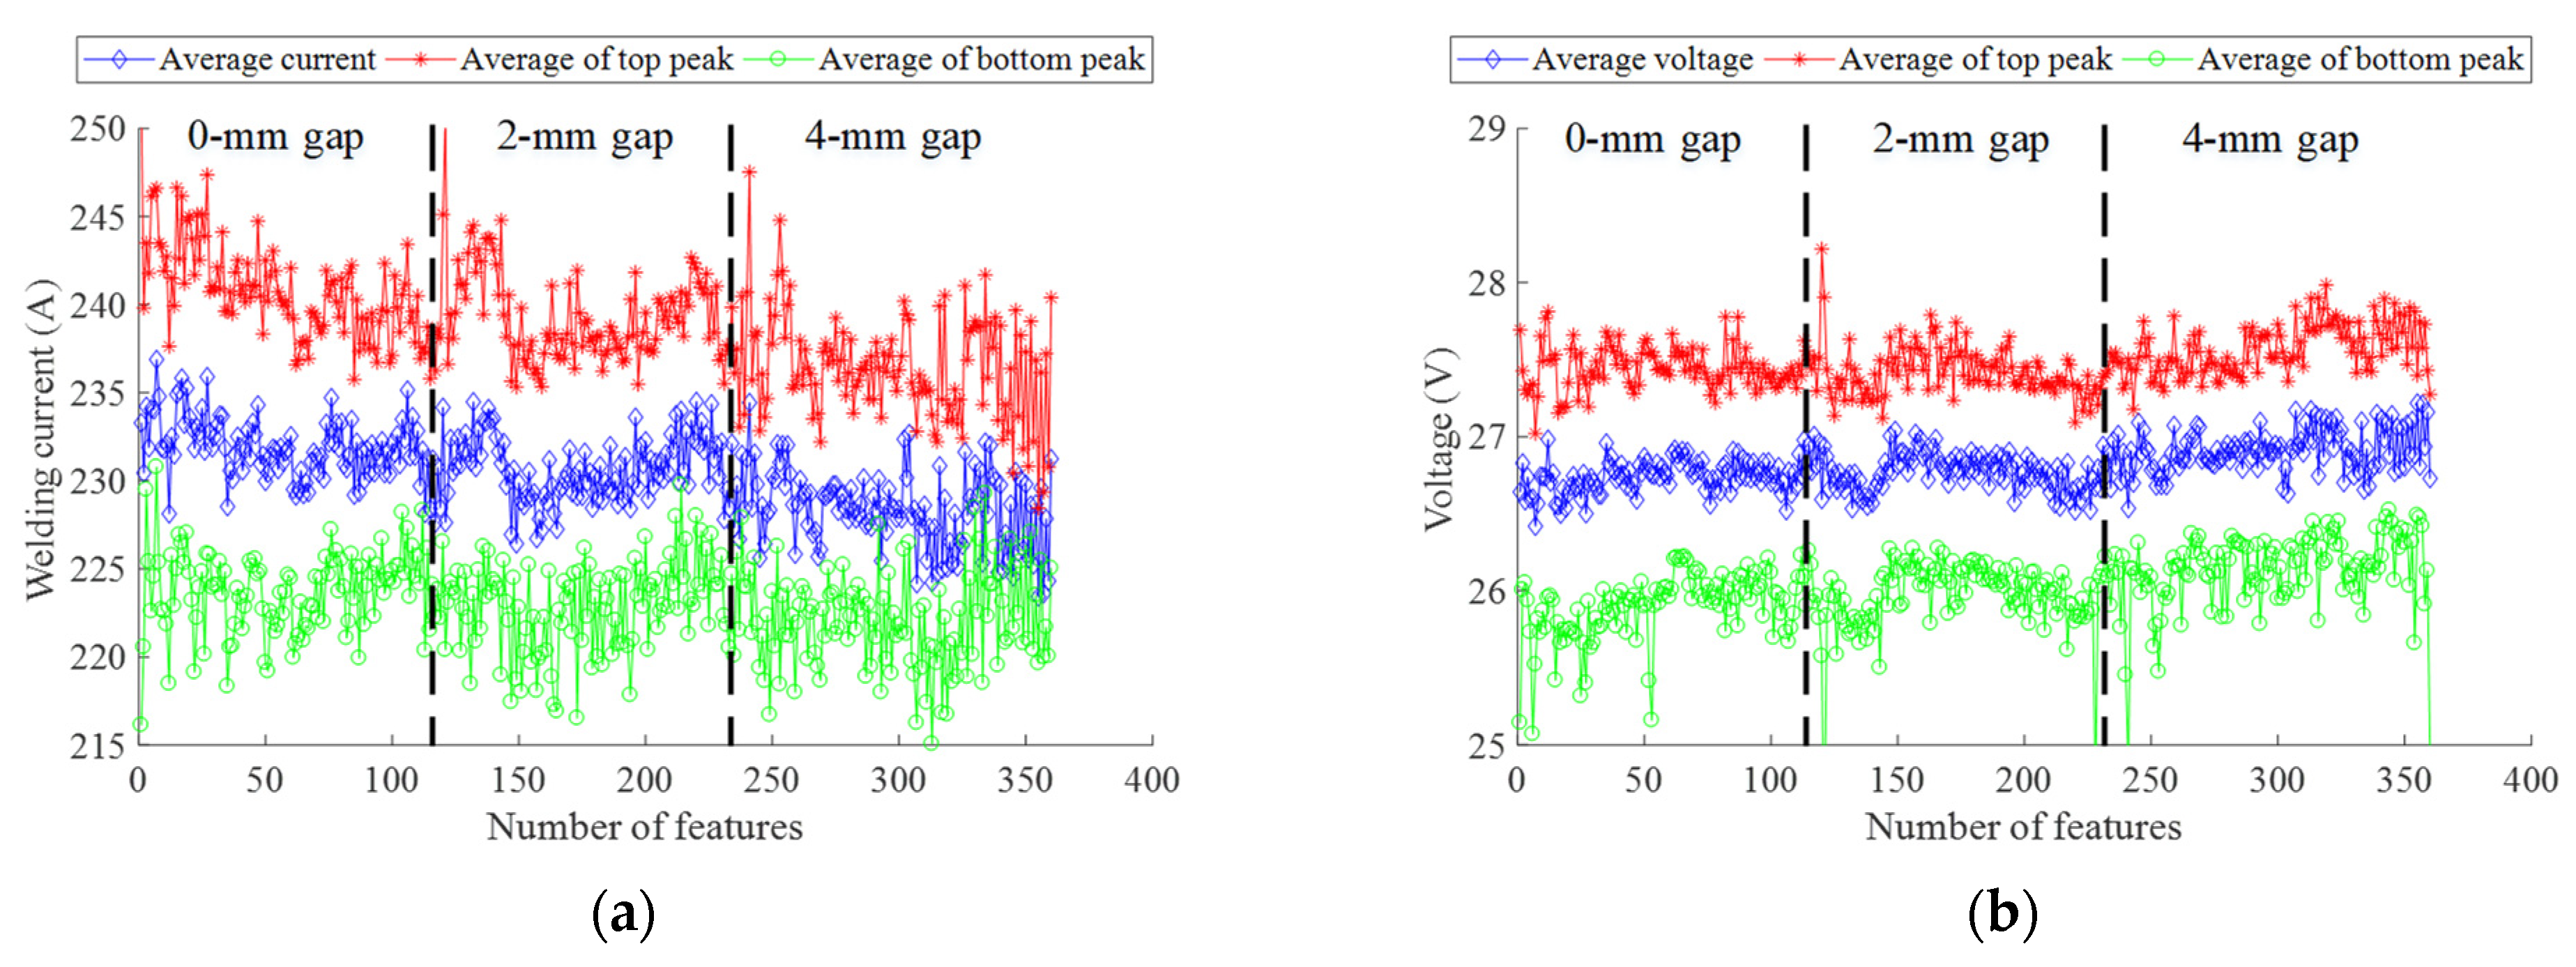
Figure 5.
Time domain feature variable visualization: (a) distribution of current feature variables according to the weld gap change and (b) distribution of voltage feature variables according to the weld gap change.
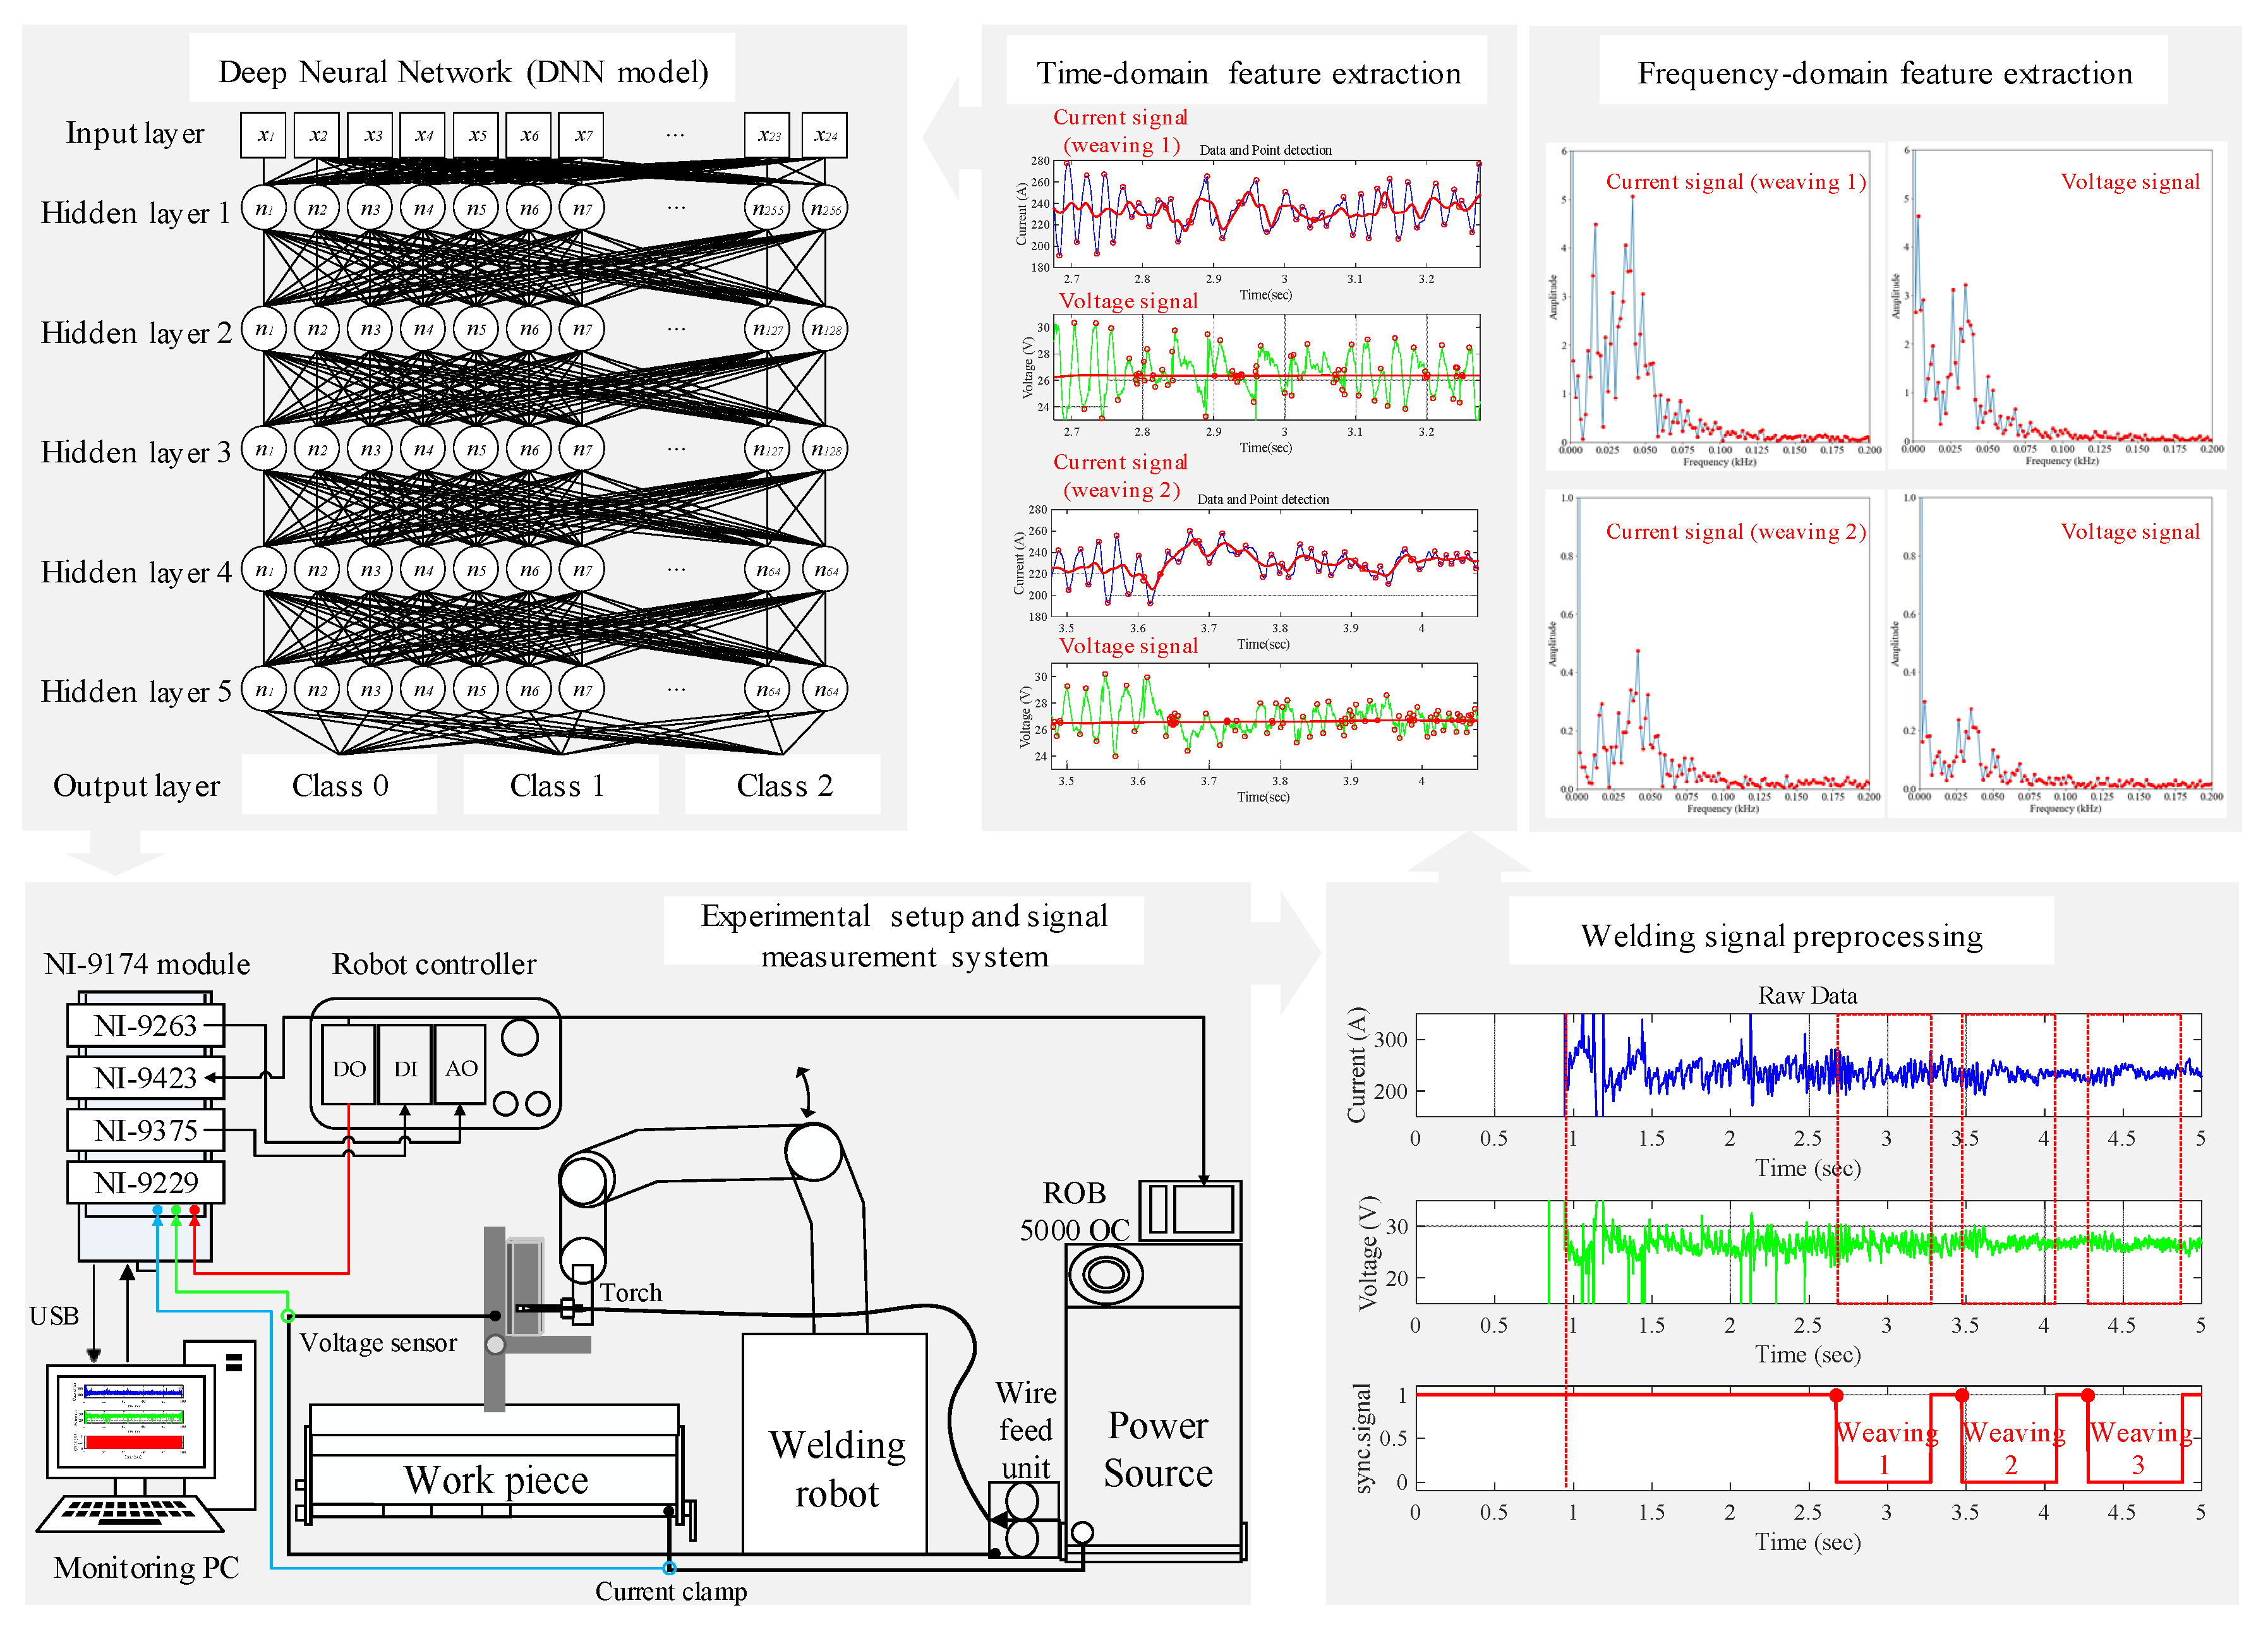
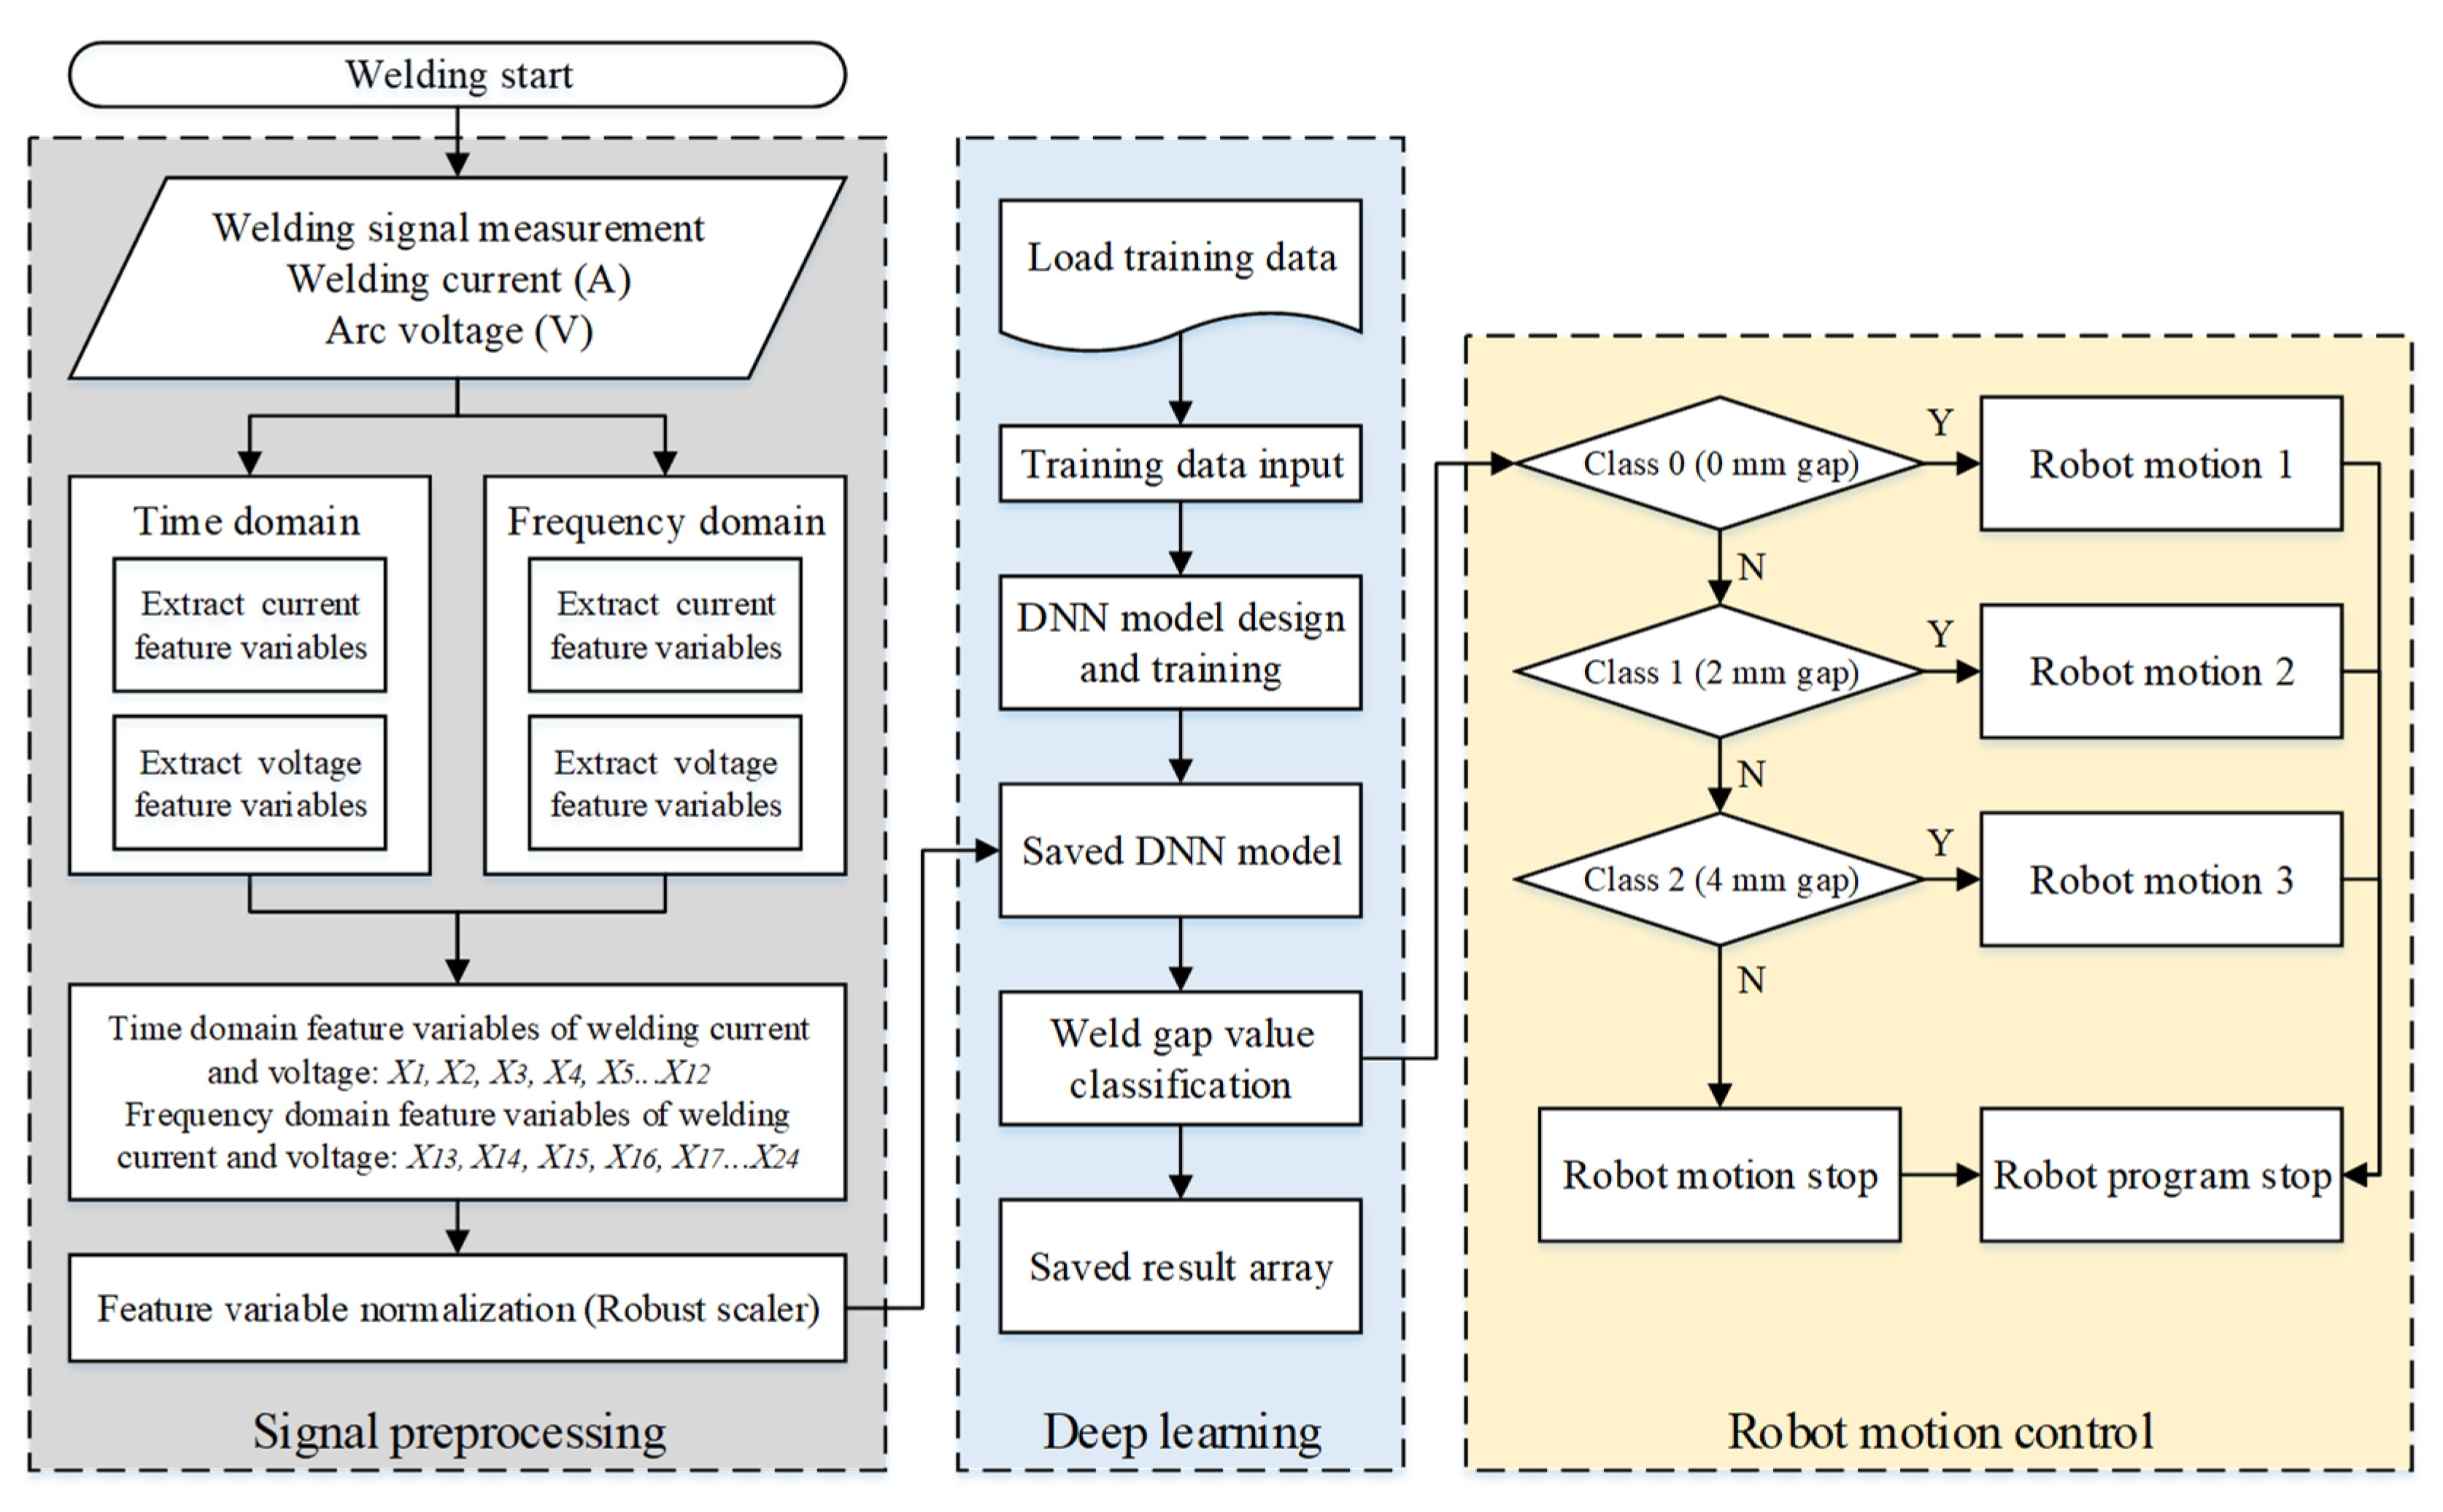
Figure 6.
Proposed weld gap detection and welding quality control system.
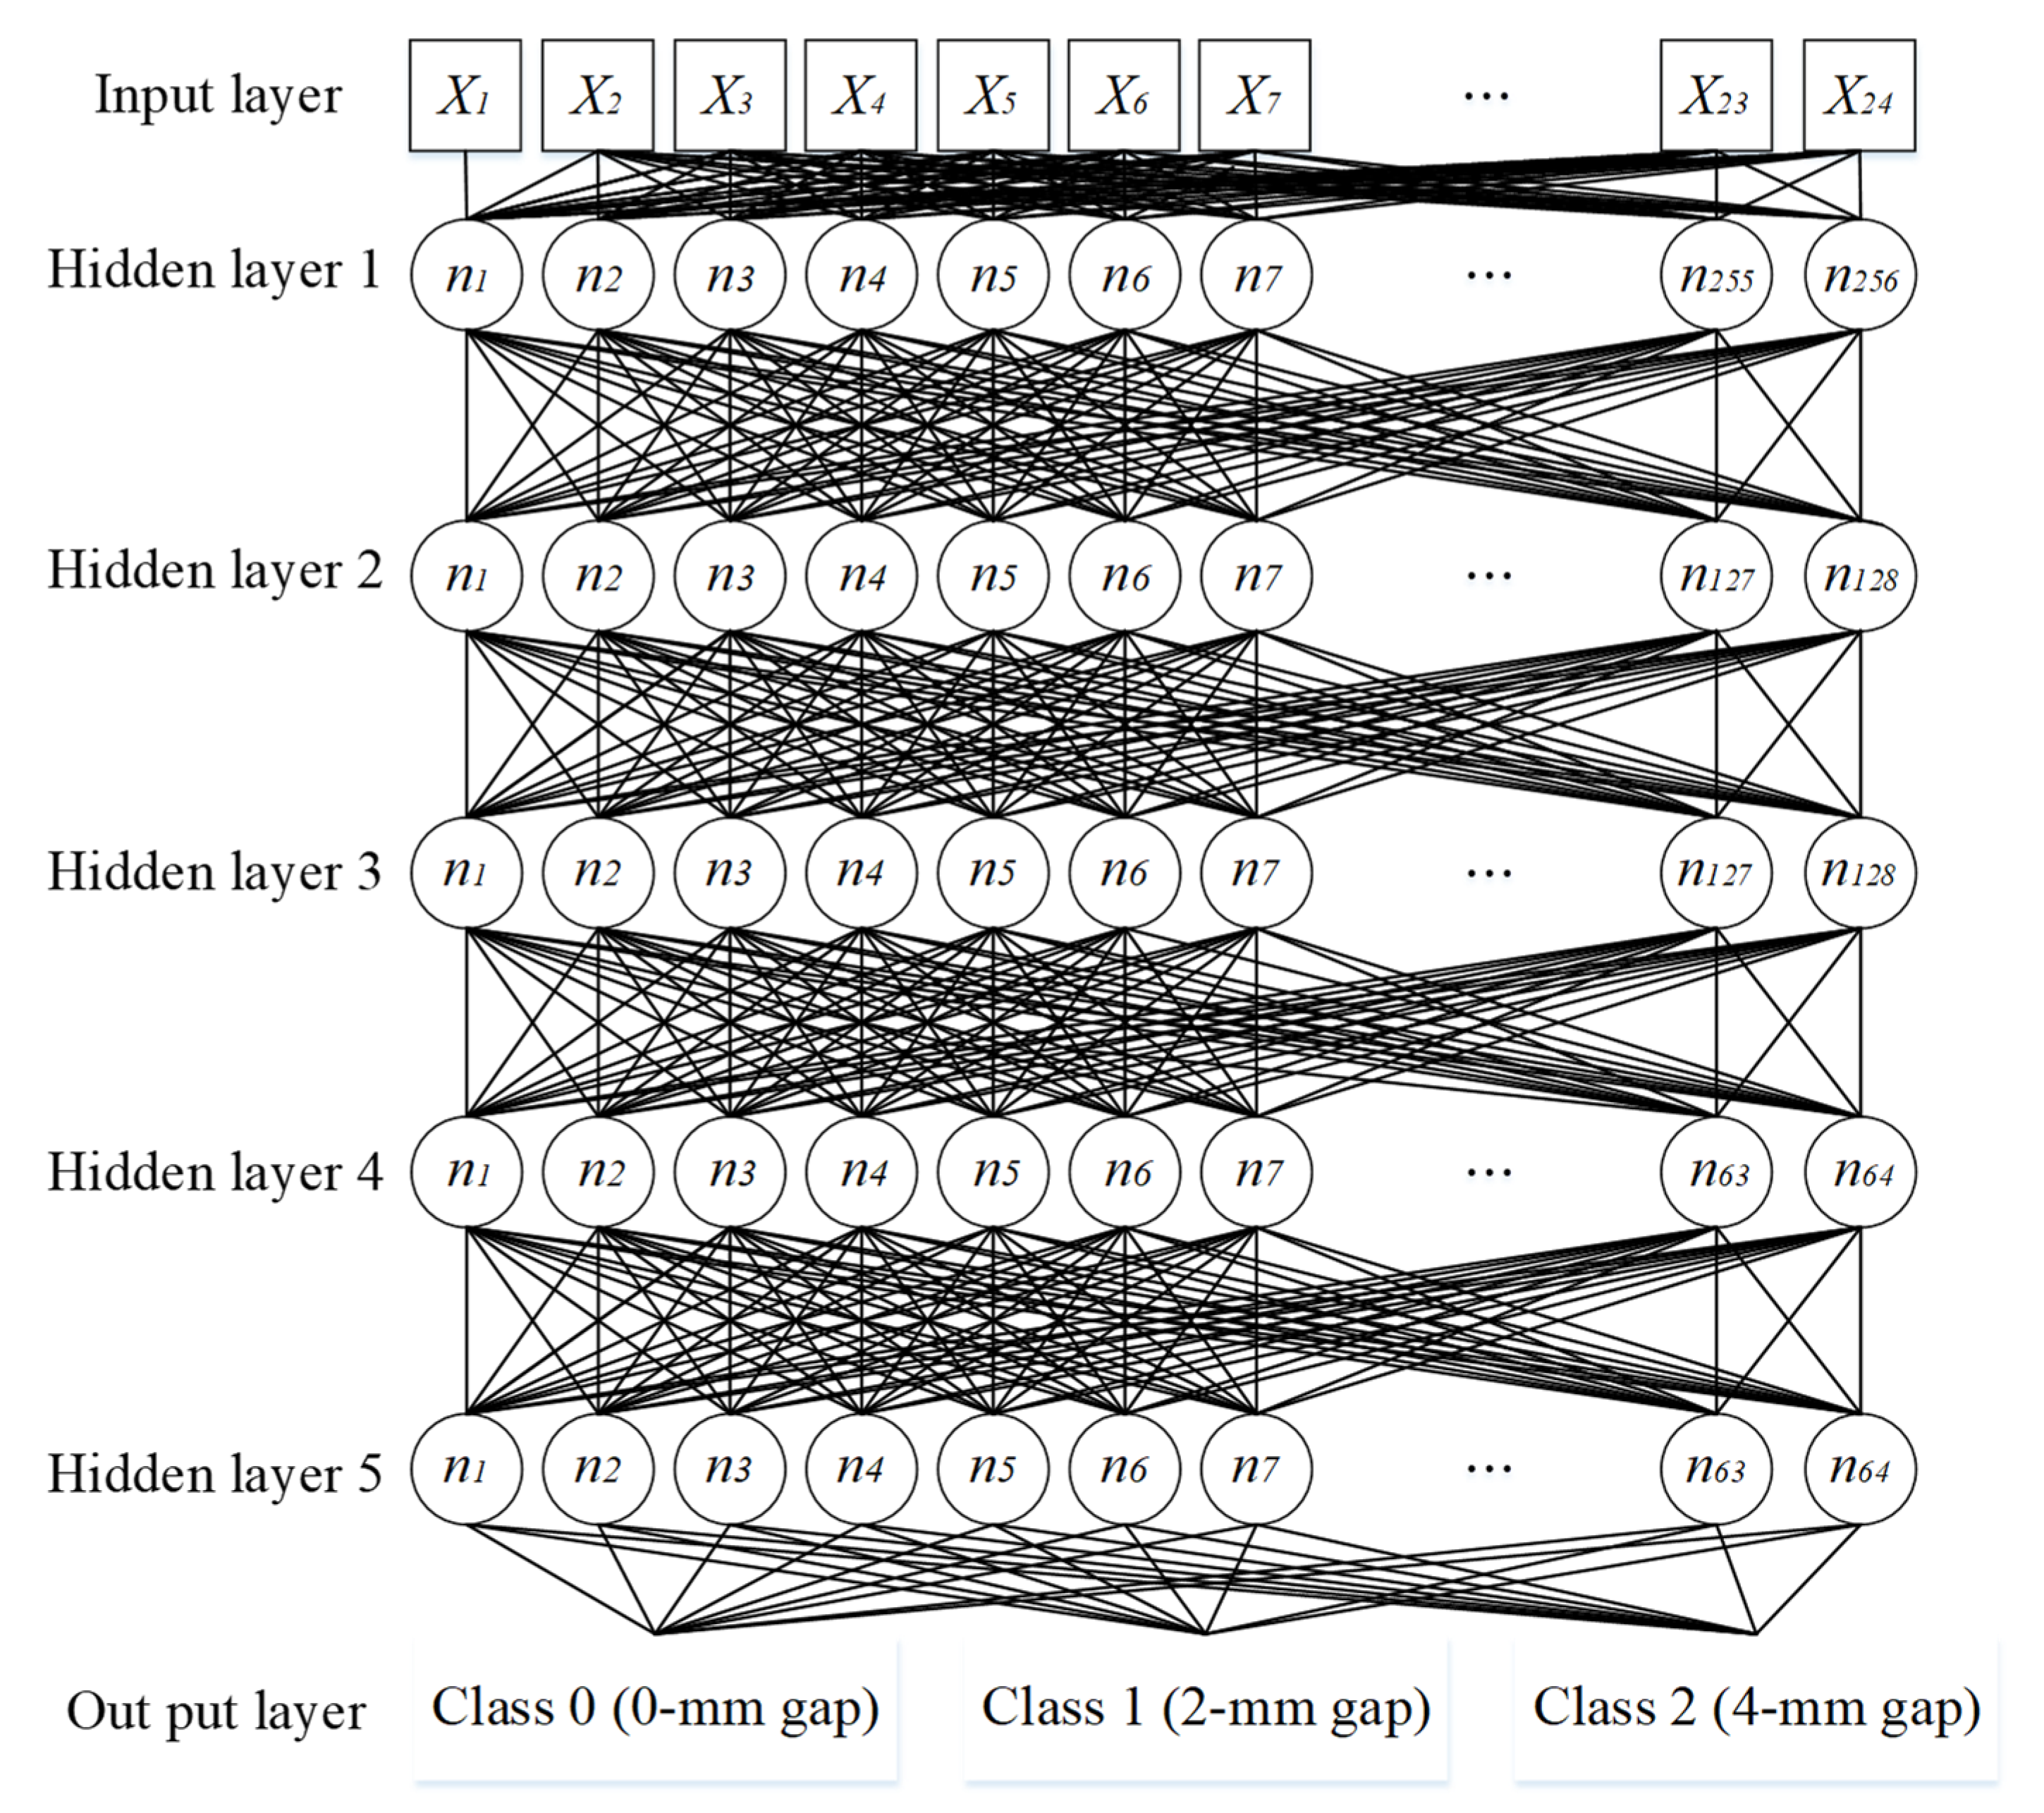
Figure 7.
Structure of the deep neural network (DNN) for classification of the weld gap.
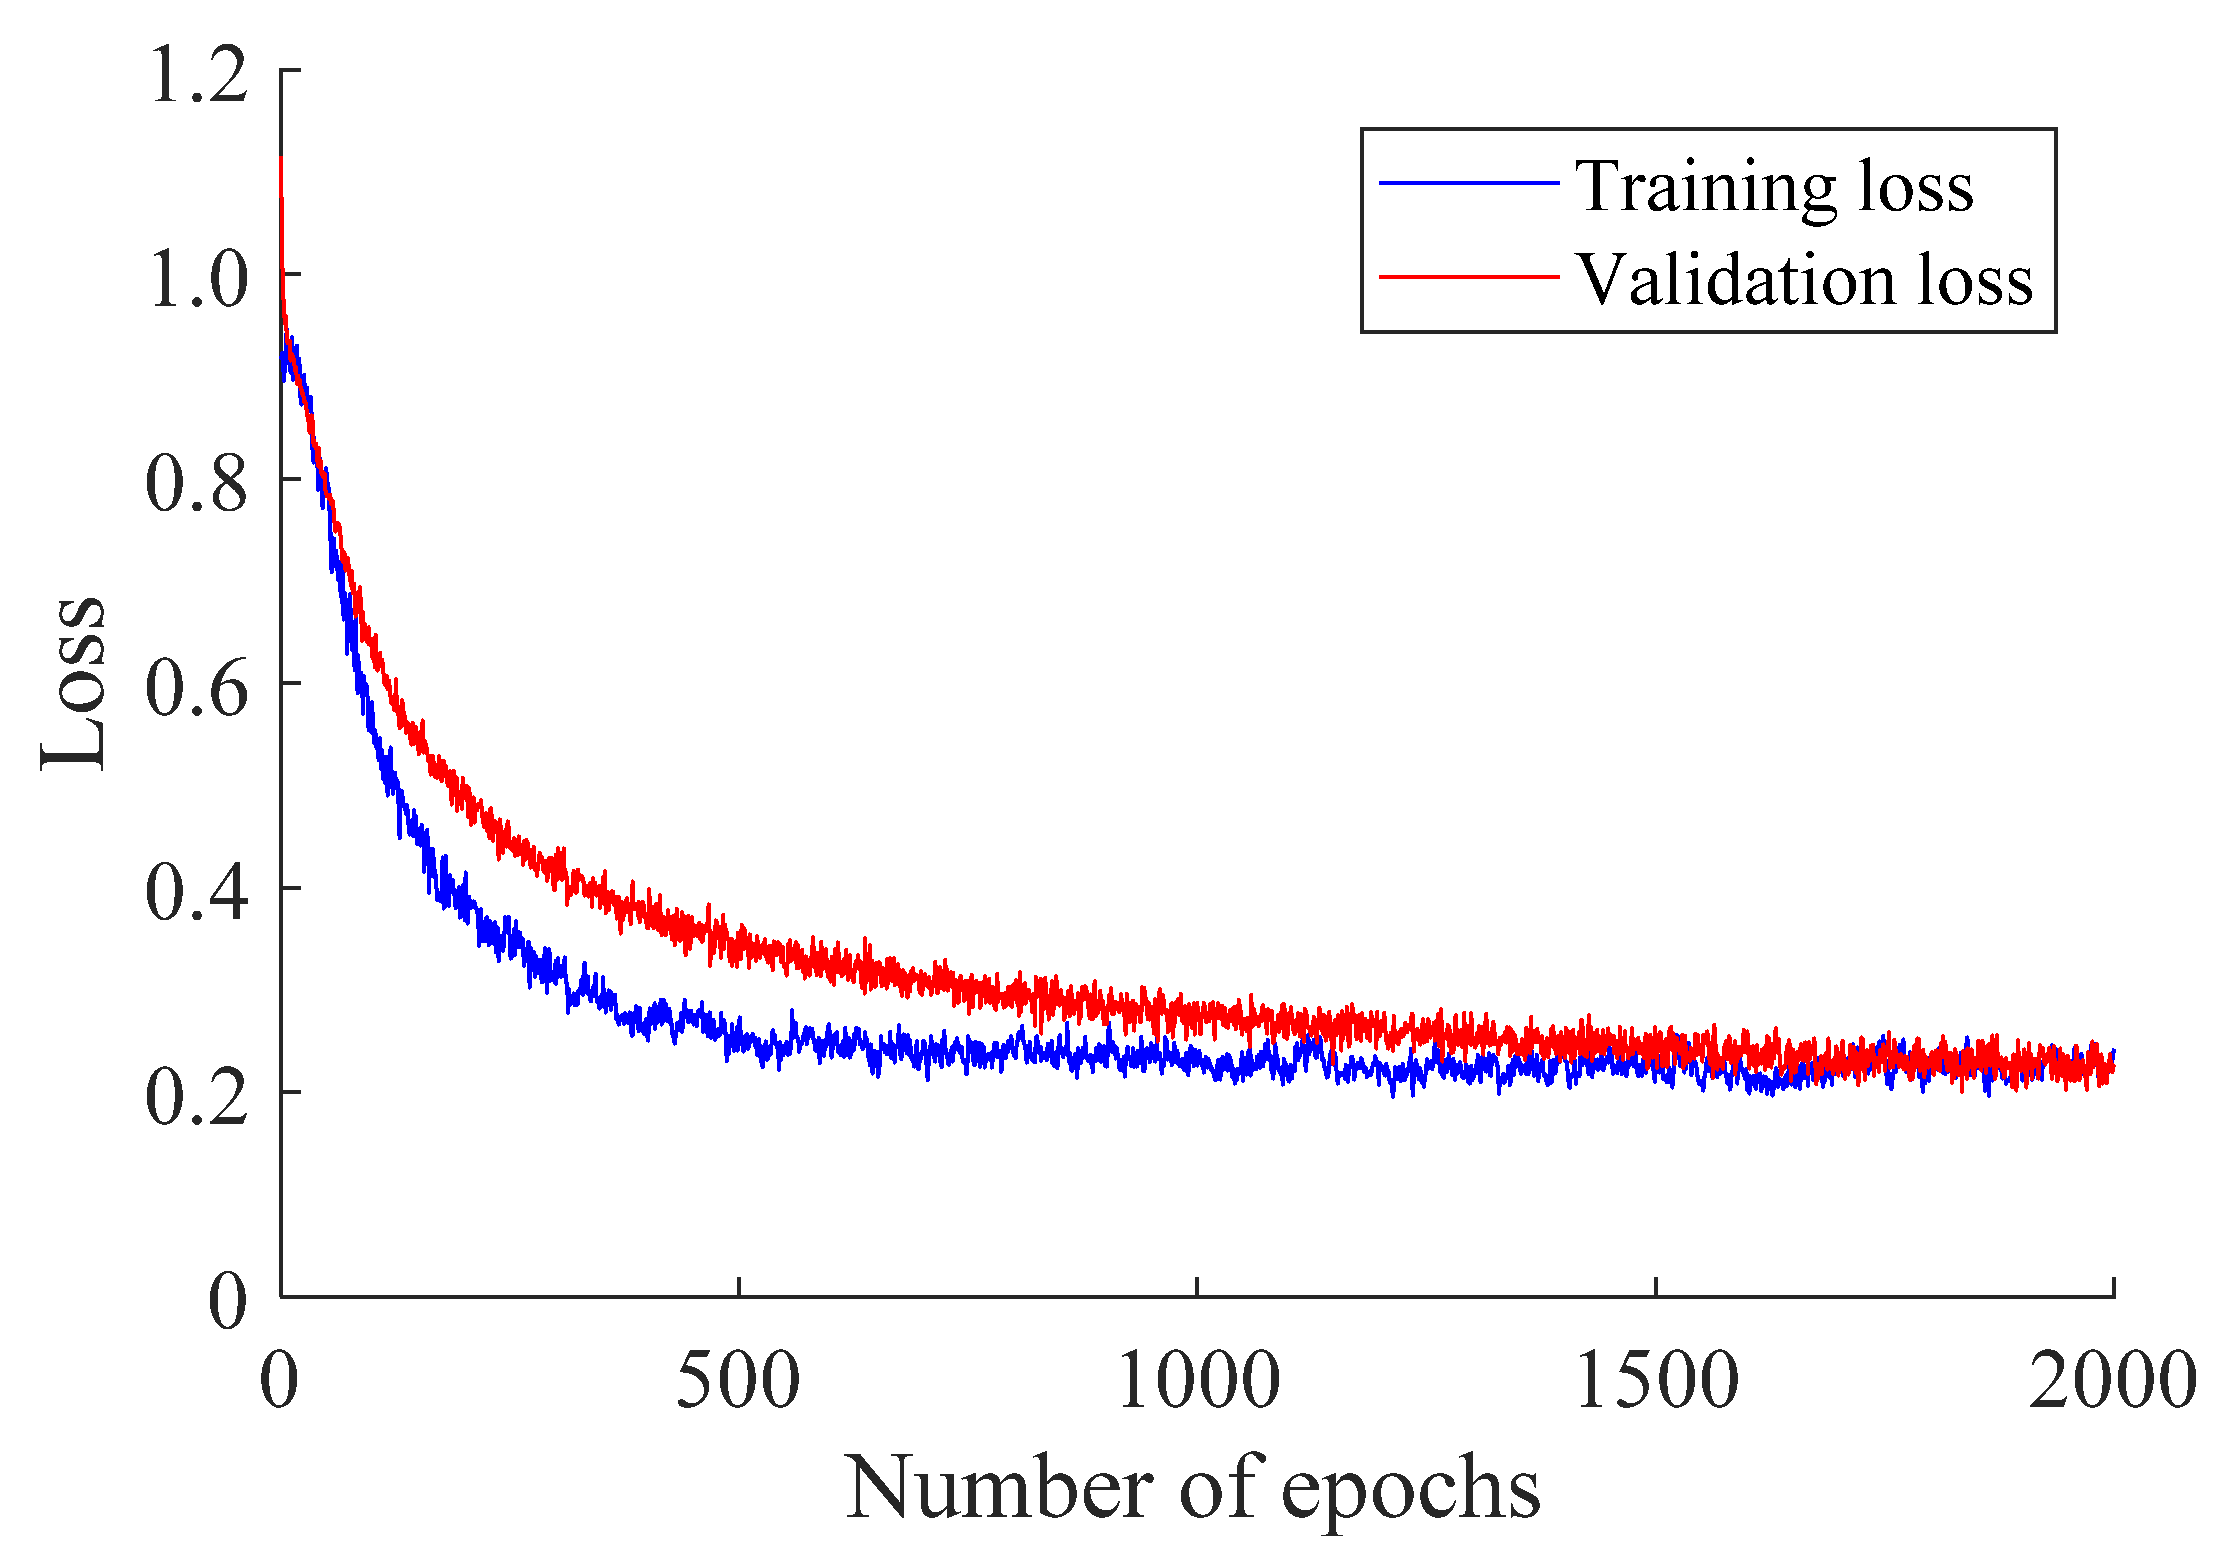
Figure 8.
Training results of the proposed DNN model.
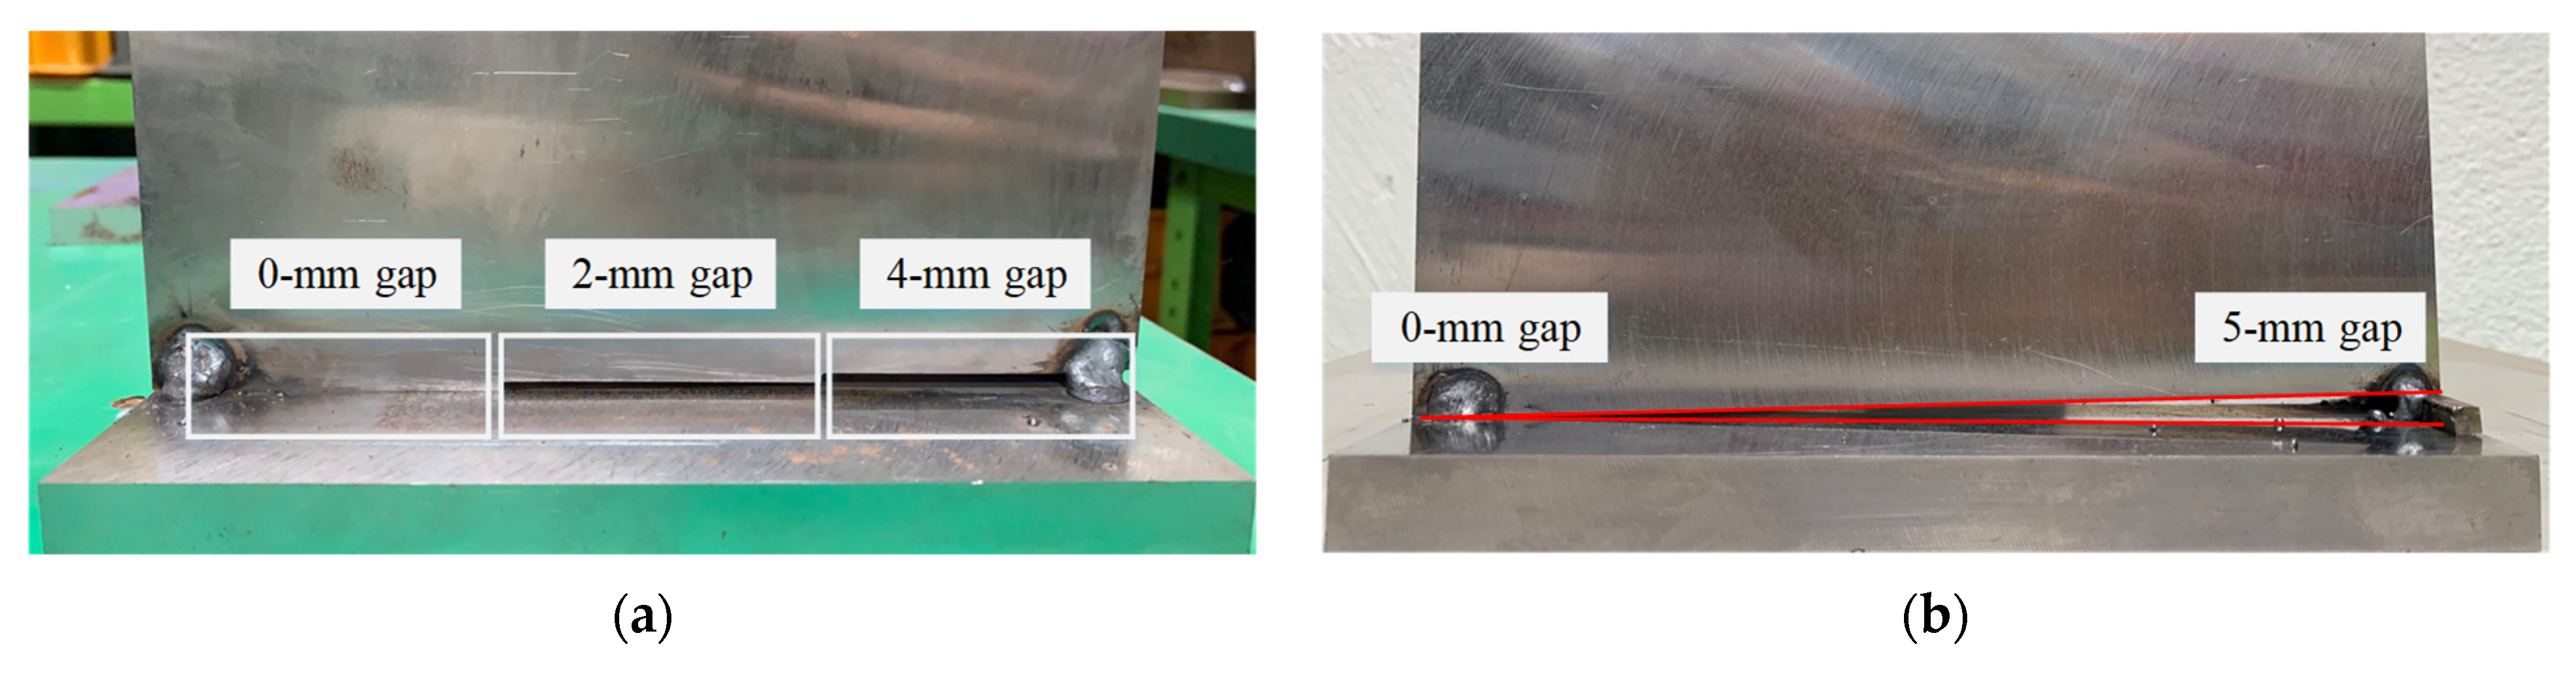
Figure 9.
Frame designation of welding current data: (a) the test plate used for offline verification and (b) the test plate used for online verification.
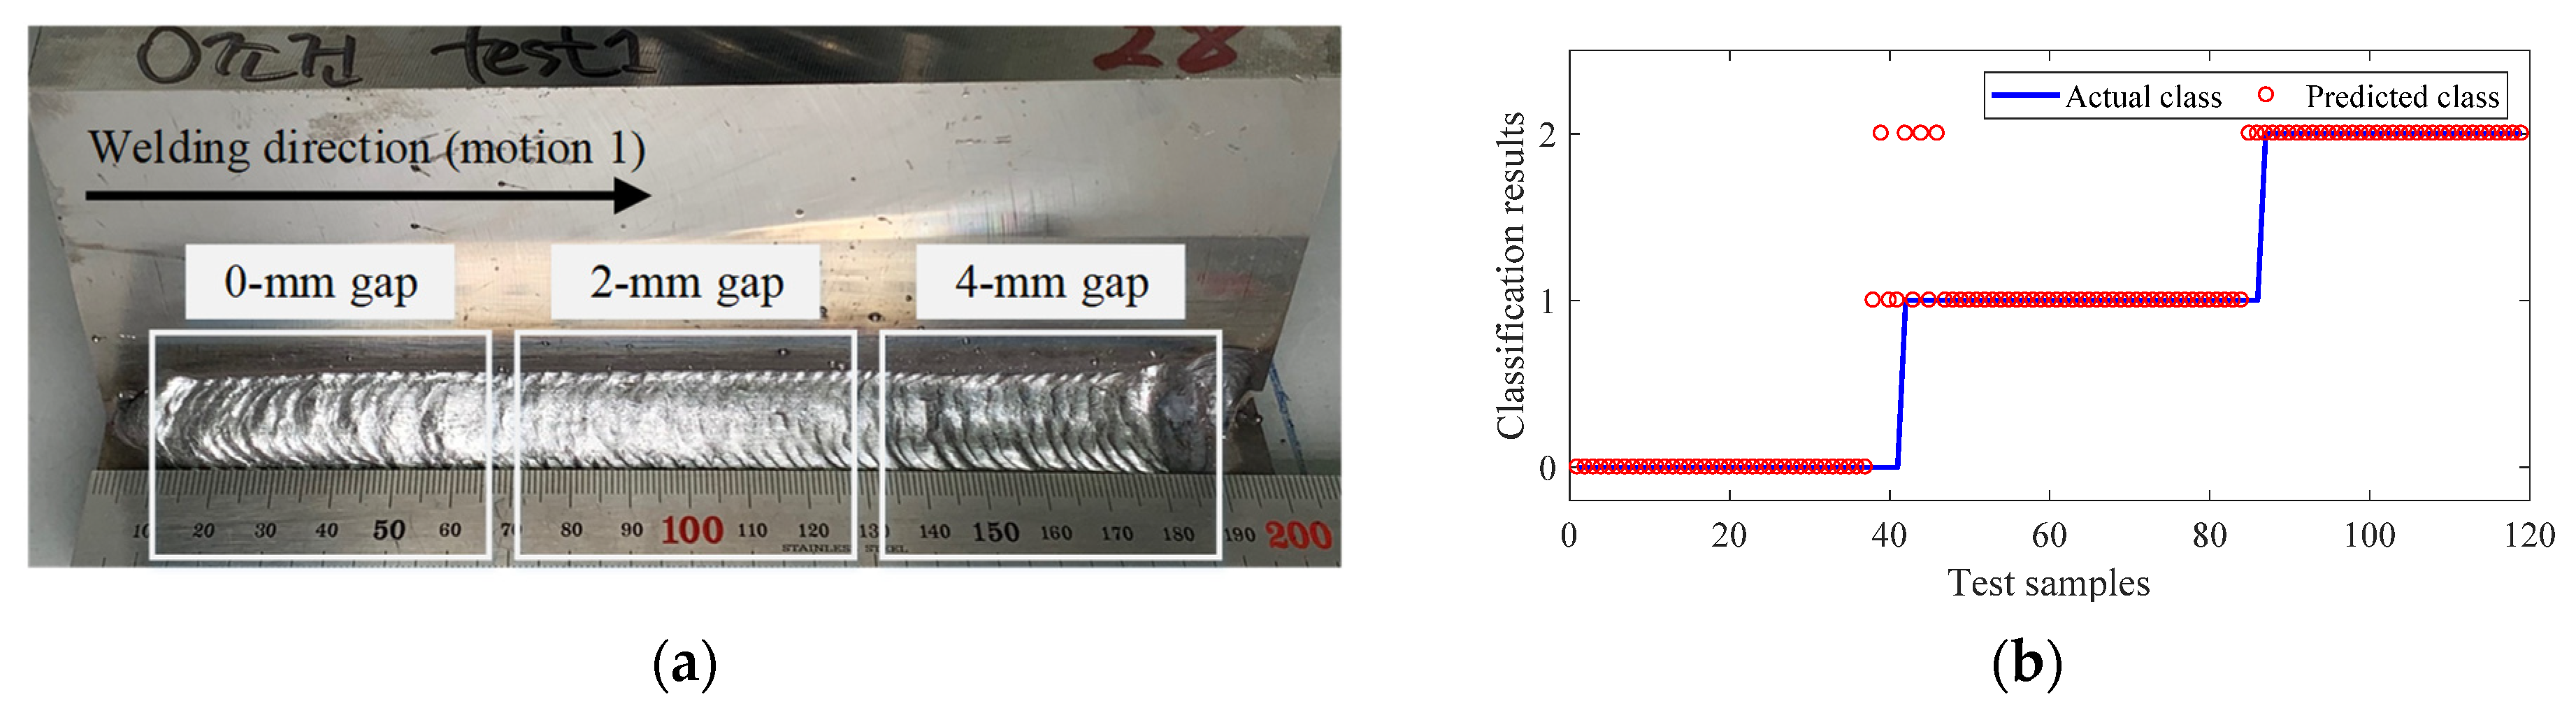
Figure 10.
Offline verification results for optimal conditions for 0 mm gap (applied robot motion 1): (a) weld bead shape of each weld gap region and (b) weld gap classification results.
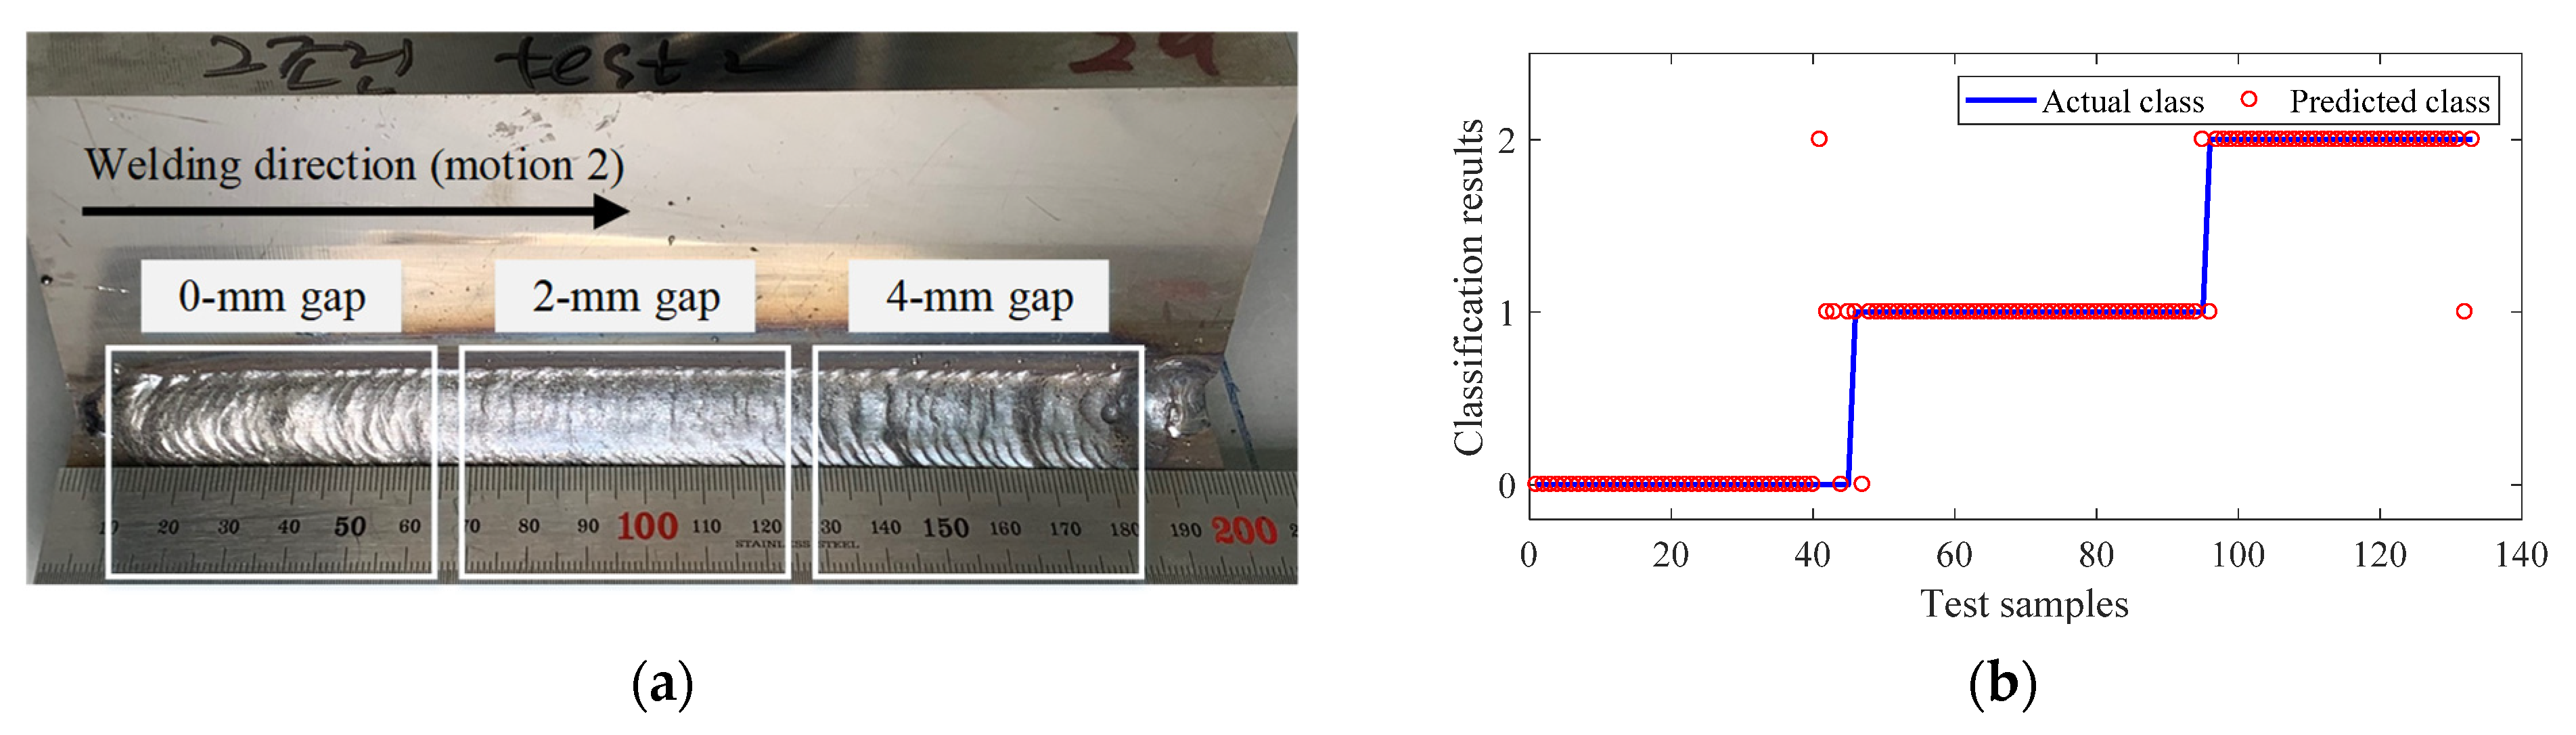
Figure 11.
Offline verification results for optimal conditions for 2 mm gap (applied robot motion 2): (a) weld bead shape of each weld gap region and (b) weld gap classification results.
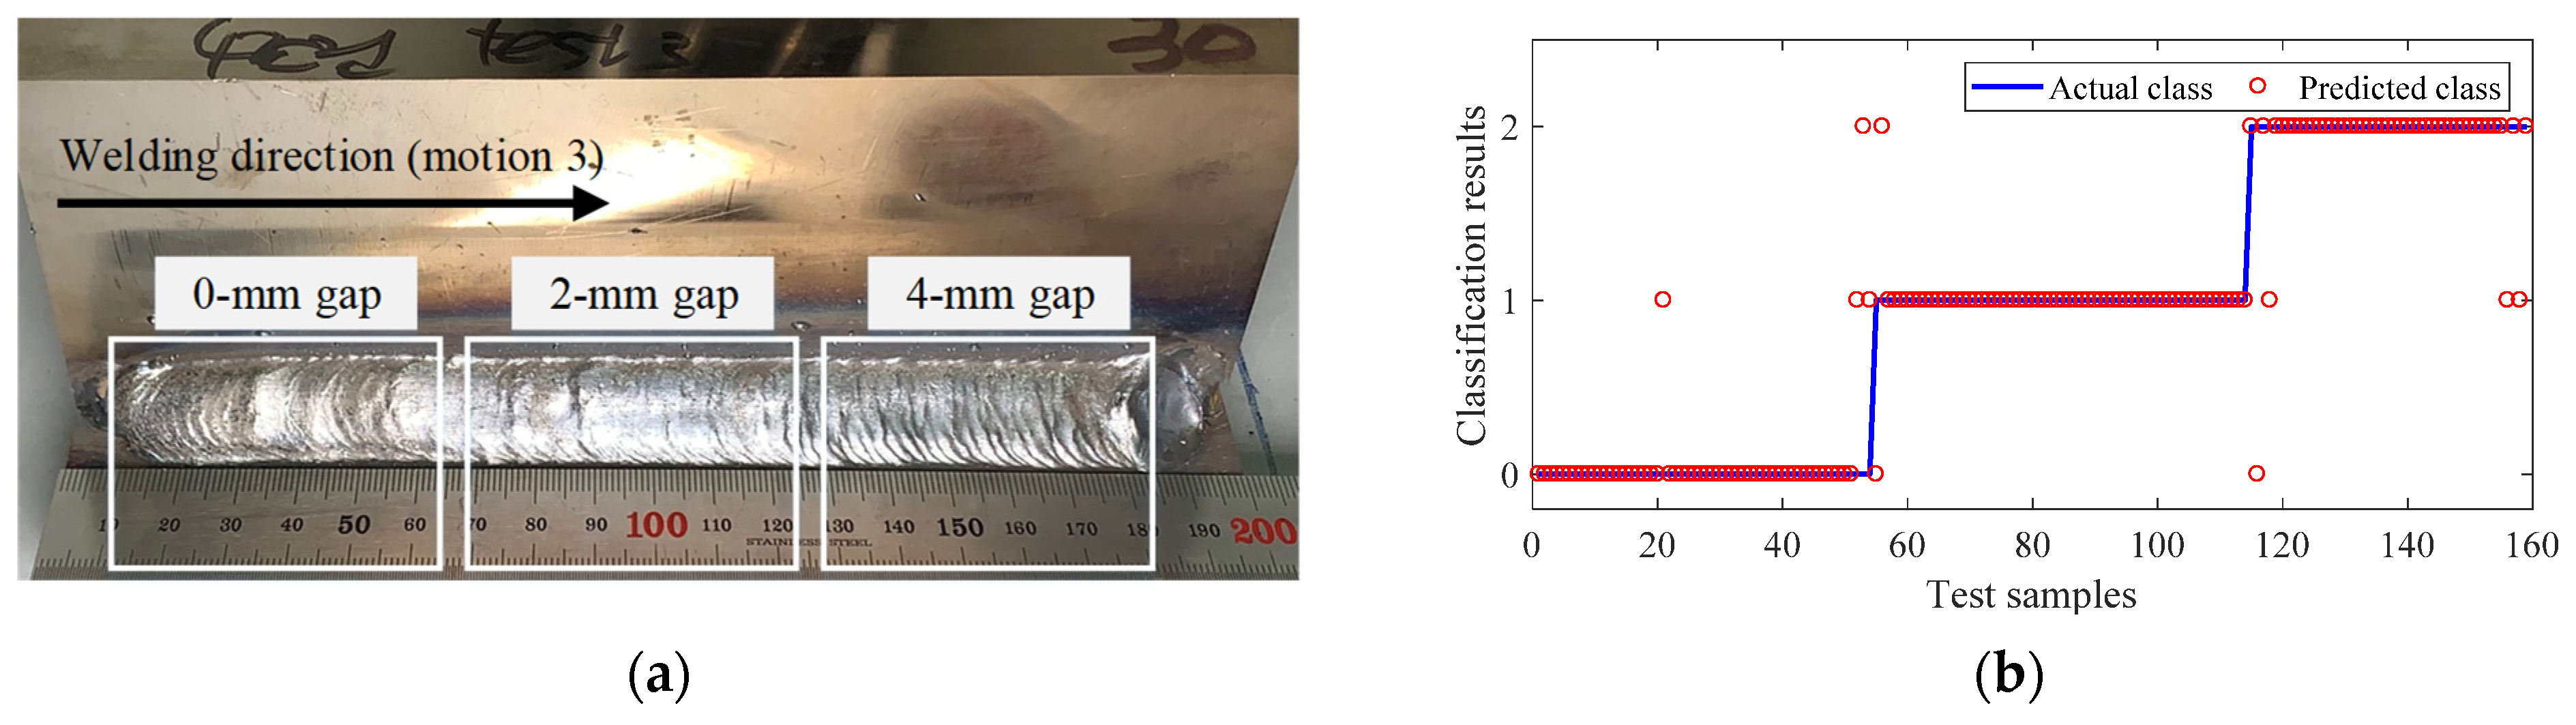
Figure 12.
Offline verification results for optimal conditions for 4 mm gap (applied robot motion 3): (a) weld bead shape of each weld gap region and (b) weld gap classification results.
Figure 13.
Flowchart of the technical roadmap.
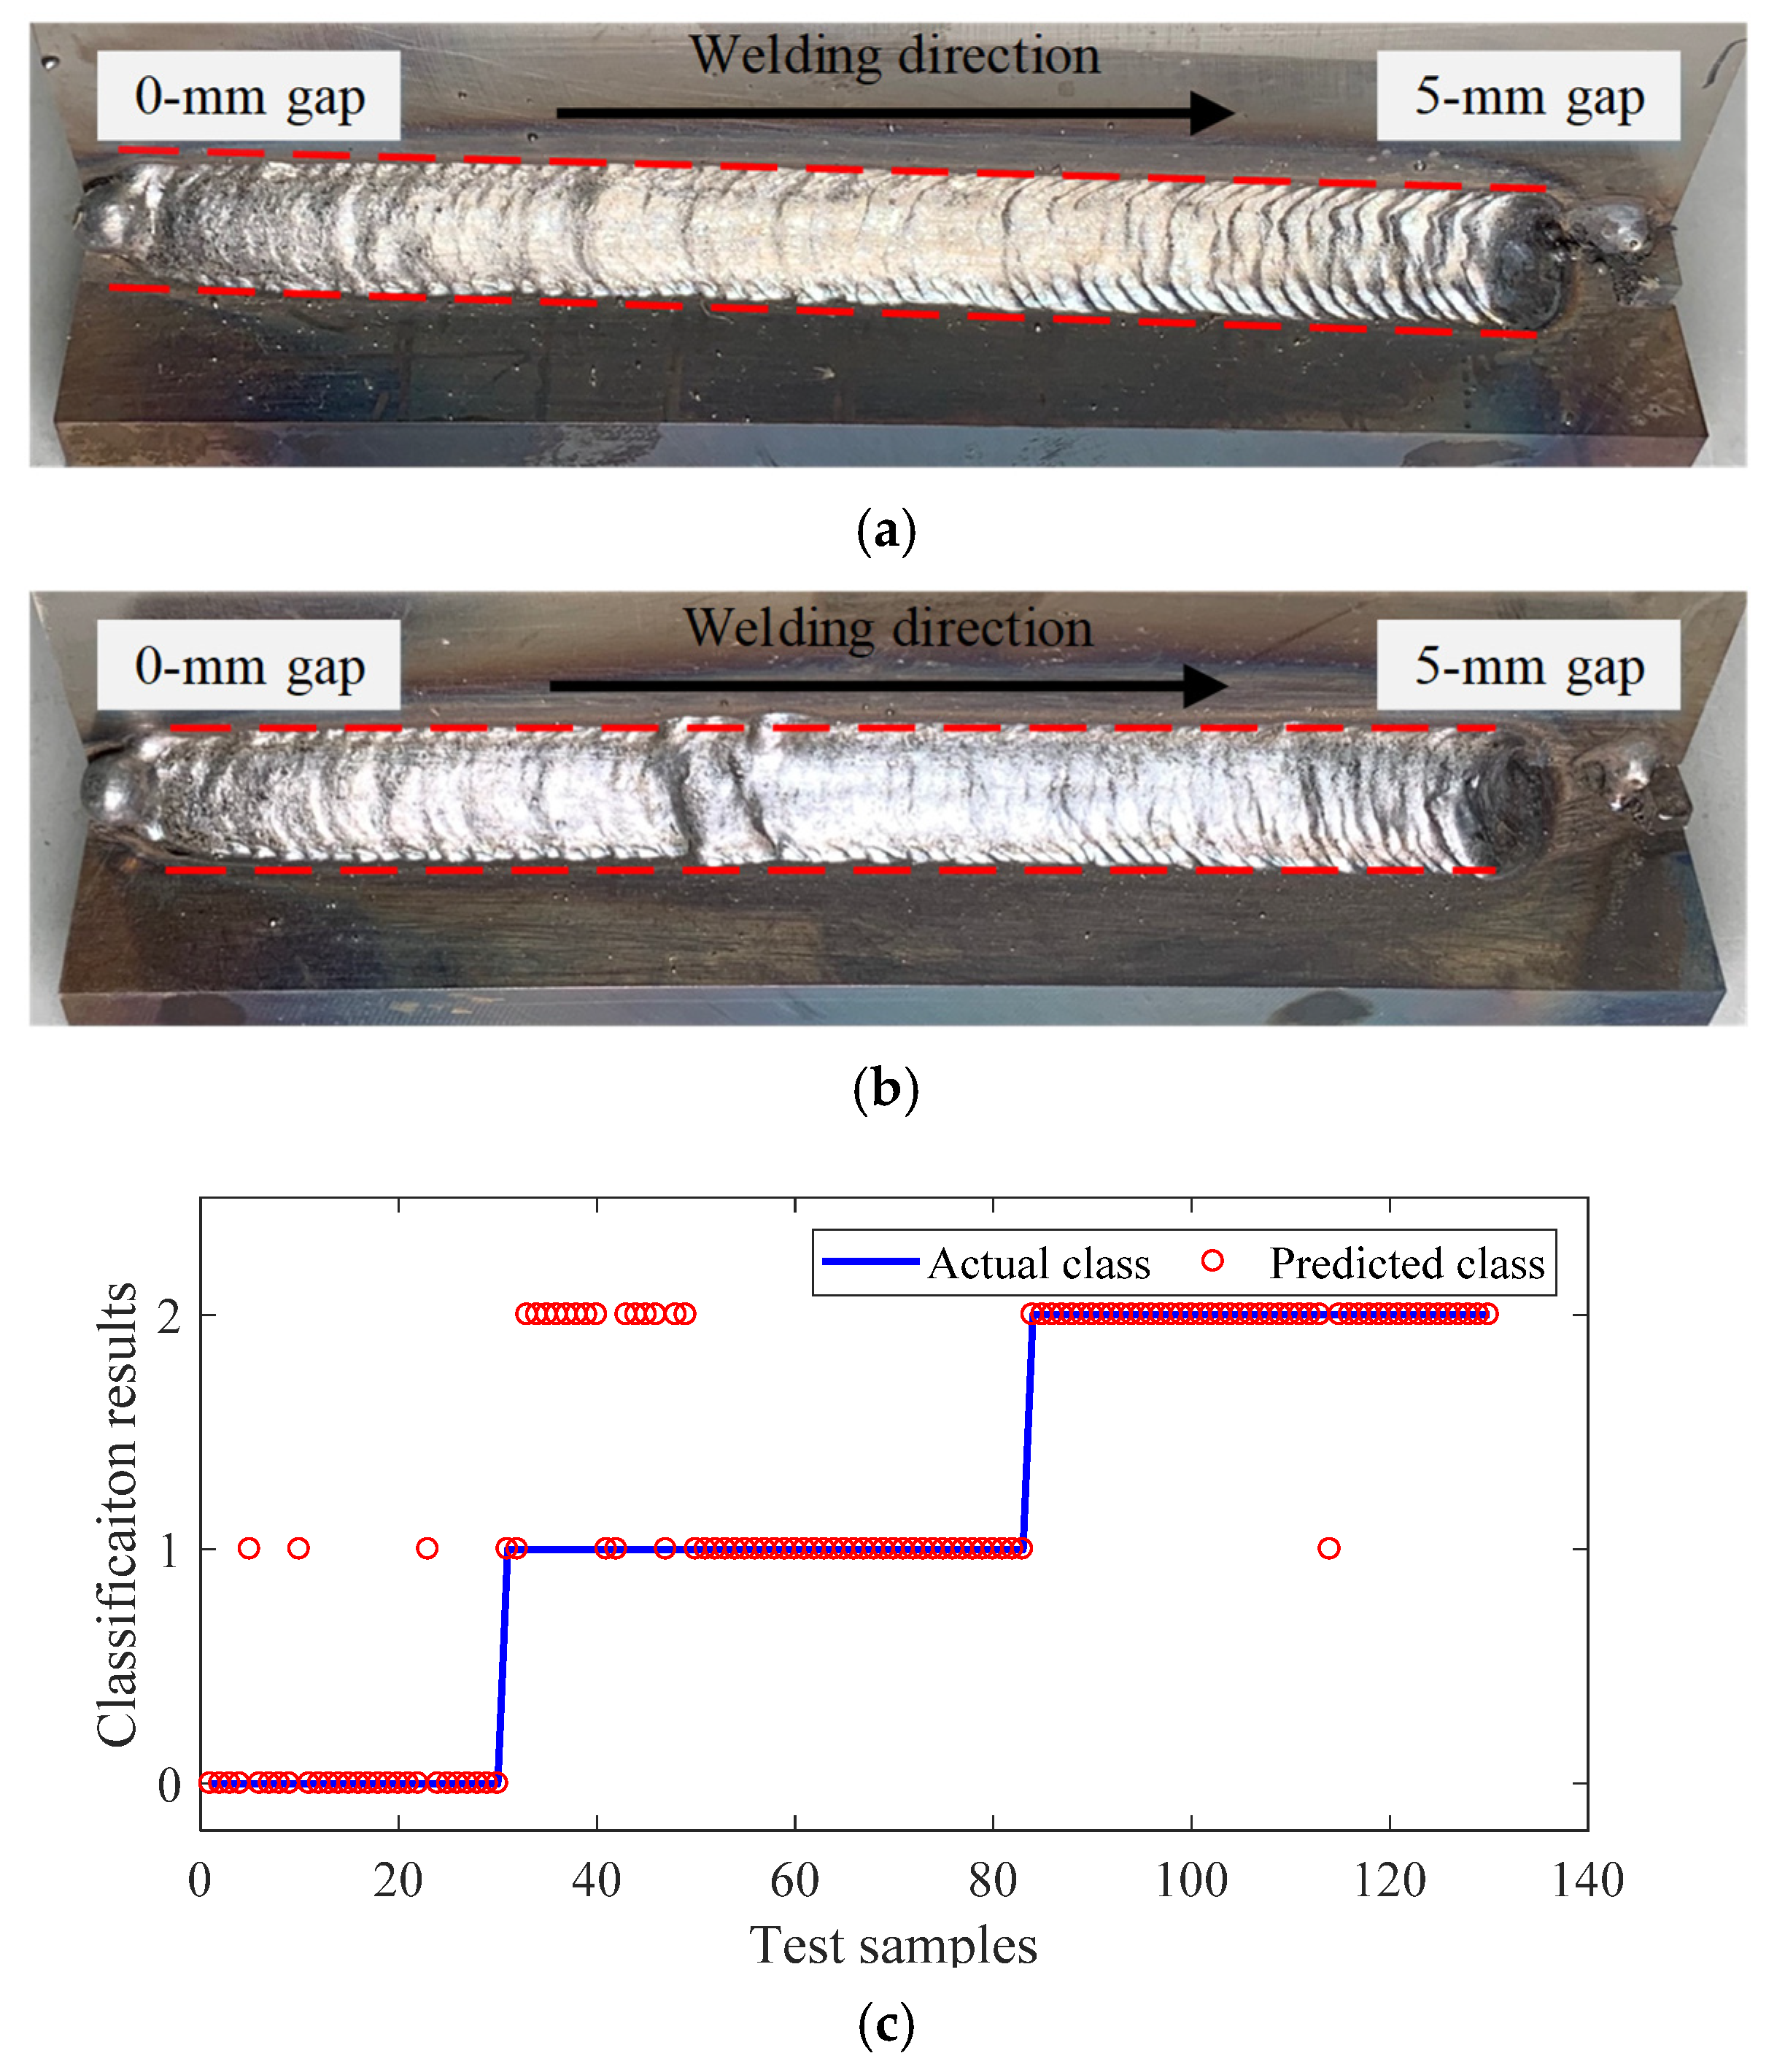
Figure 14.
Online weld gap monitoring and robot control results (applied robot motion 1): (a) weld bead shape of linearly increasing gap regions (without robot control), (b) weld bead shape of linearly increasing gap regions (with robot control), and (c) real-time weld gap monitoring results.
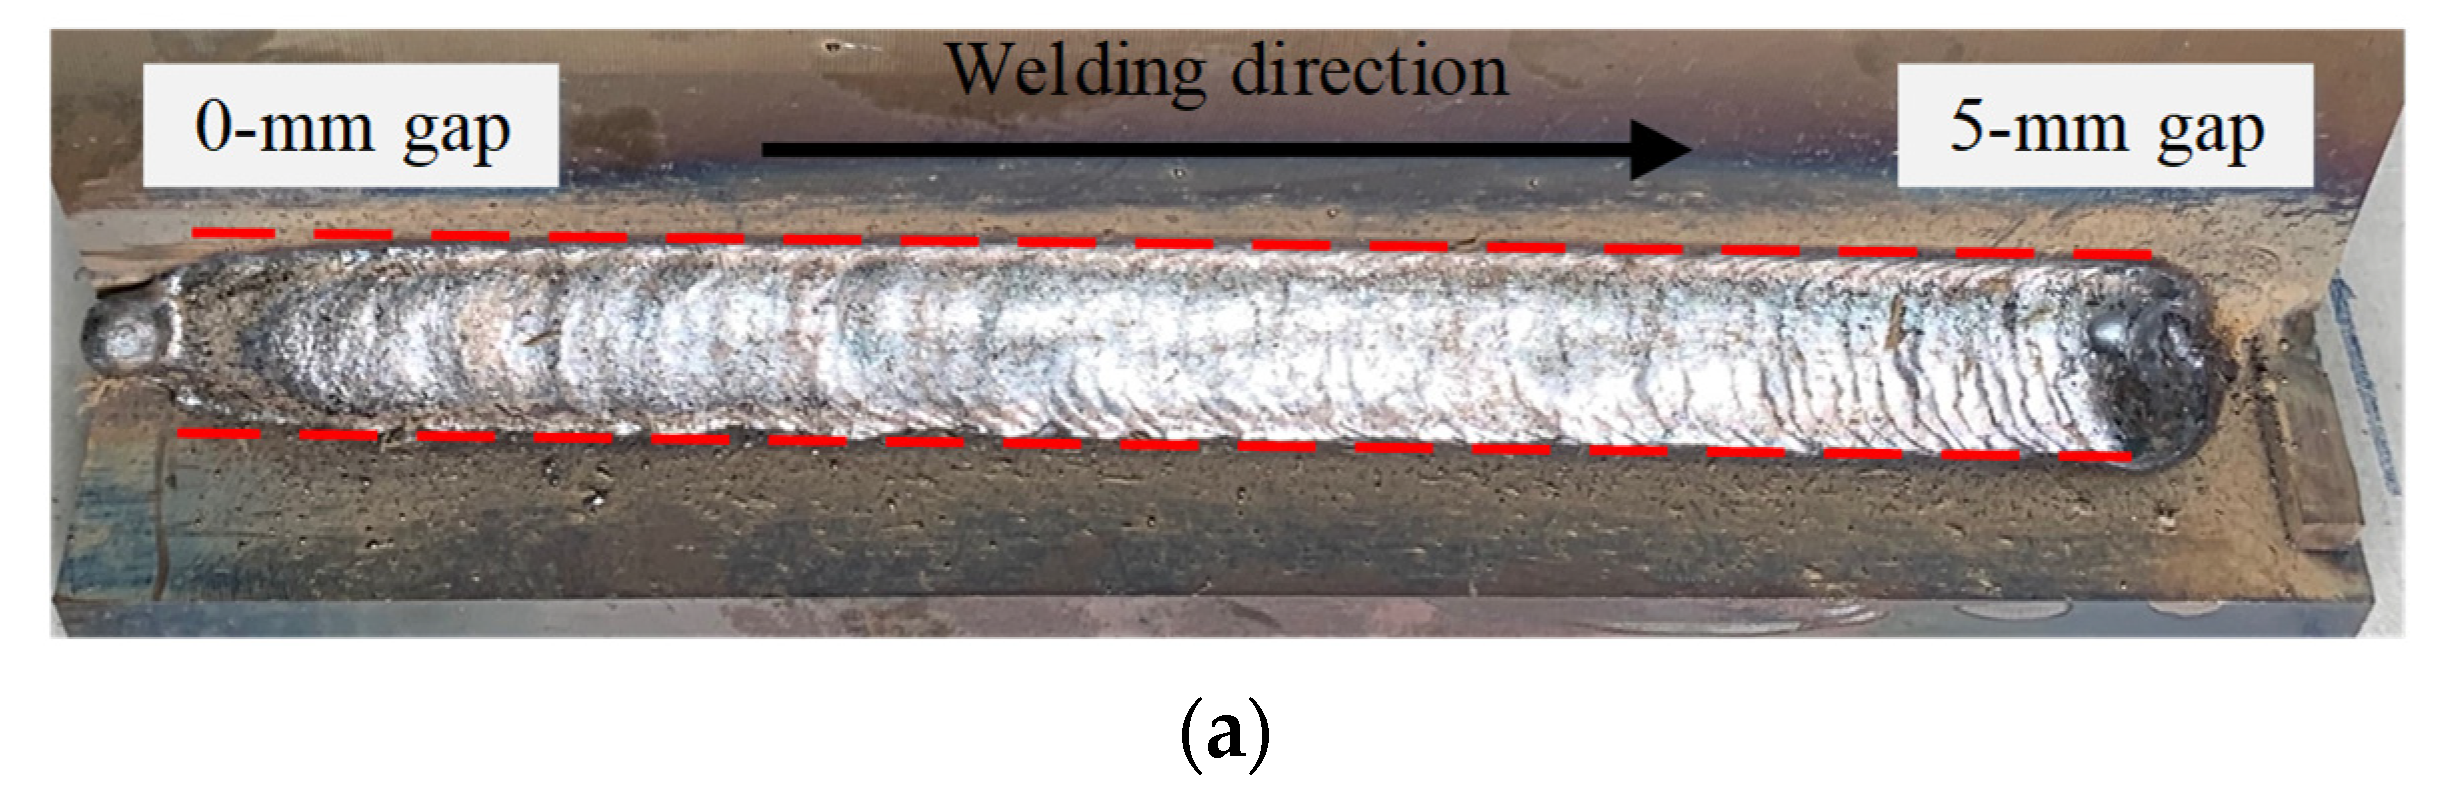
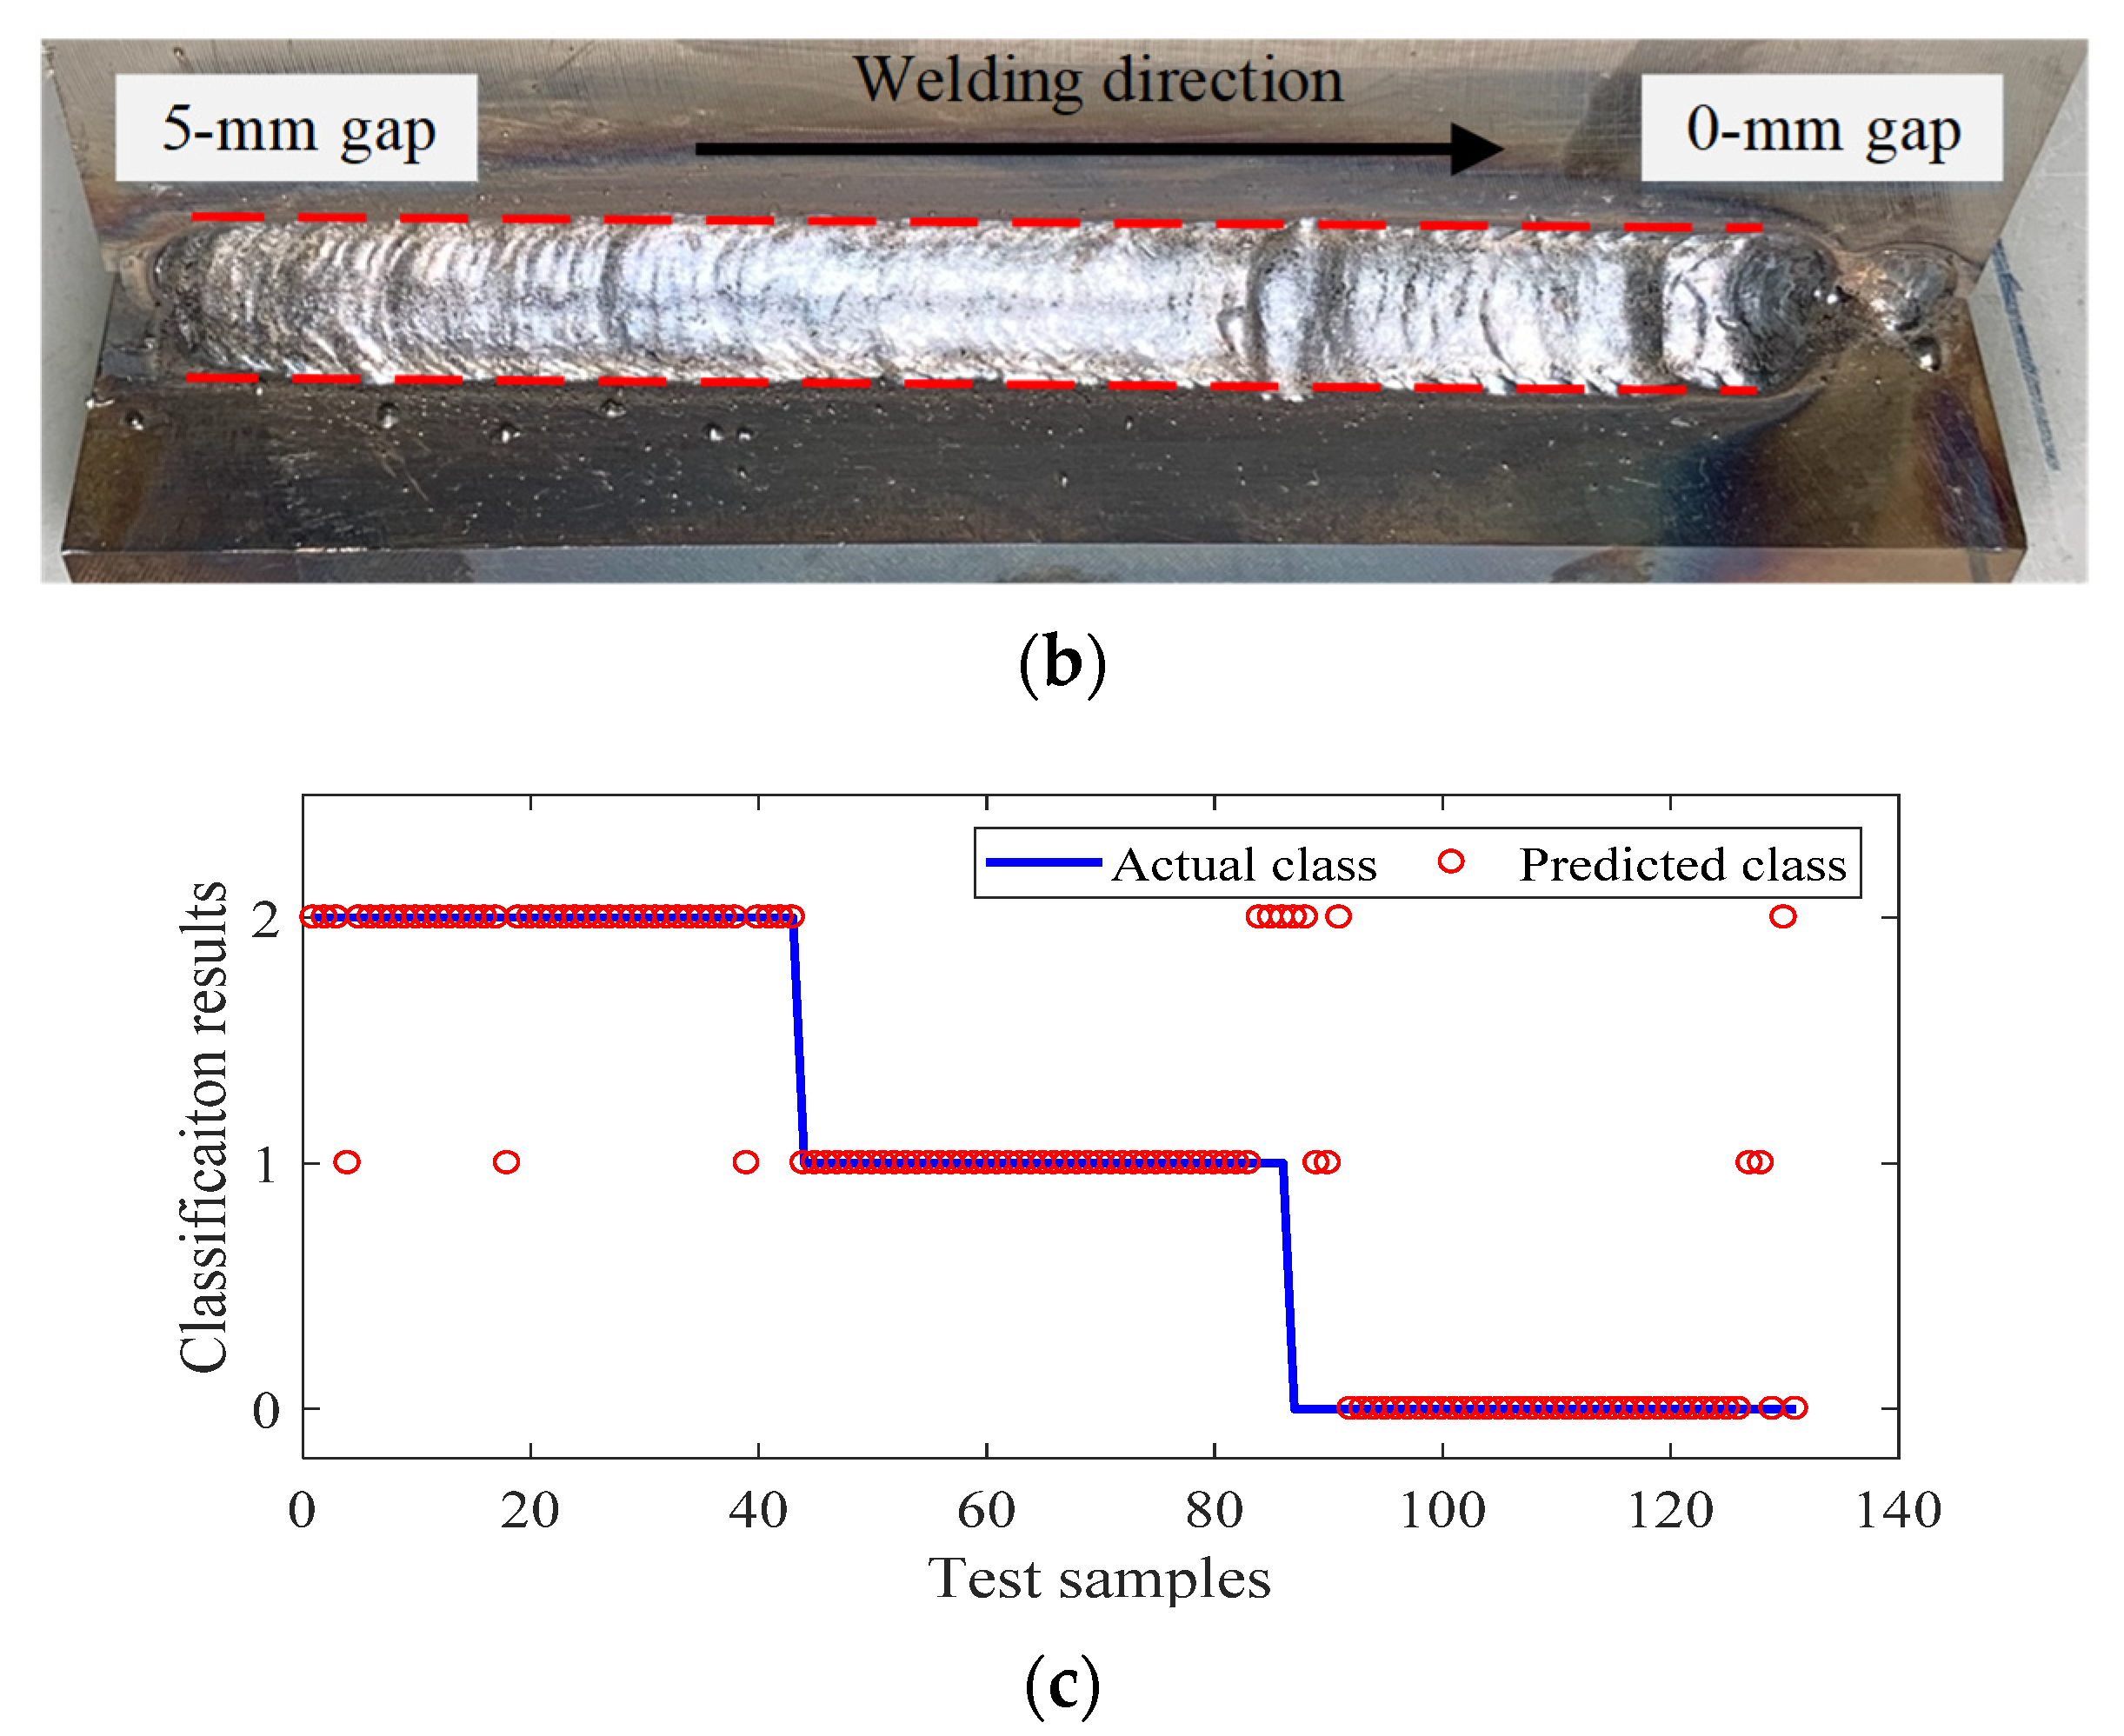
Figure 15.
Online weld gap monitoring and robot control results (applied robot motion 3): (a) weld bead shape of linearly increasing gap regions (without robot control), (b) weld bead shape of linearly decreasing gap regions (with robot control), and (c) real-time weld gap monitoring results.
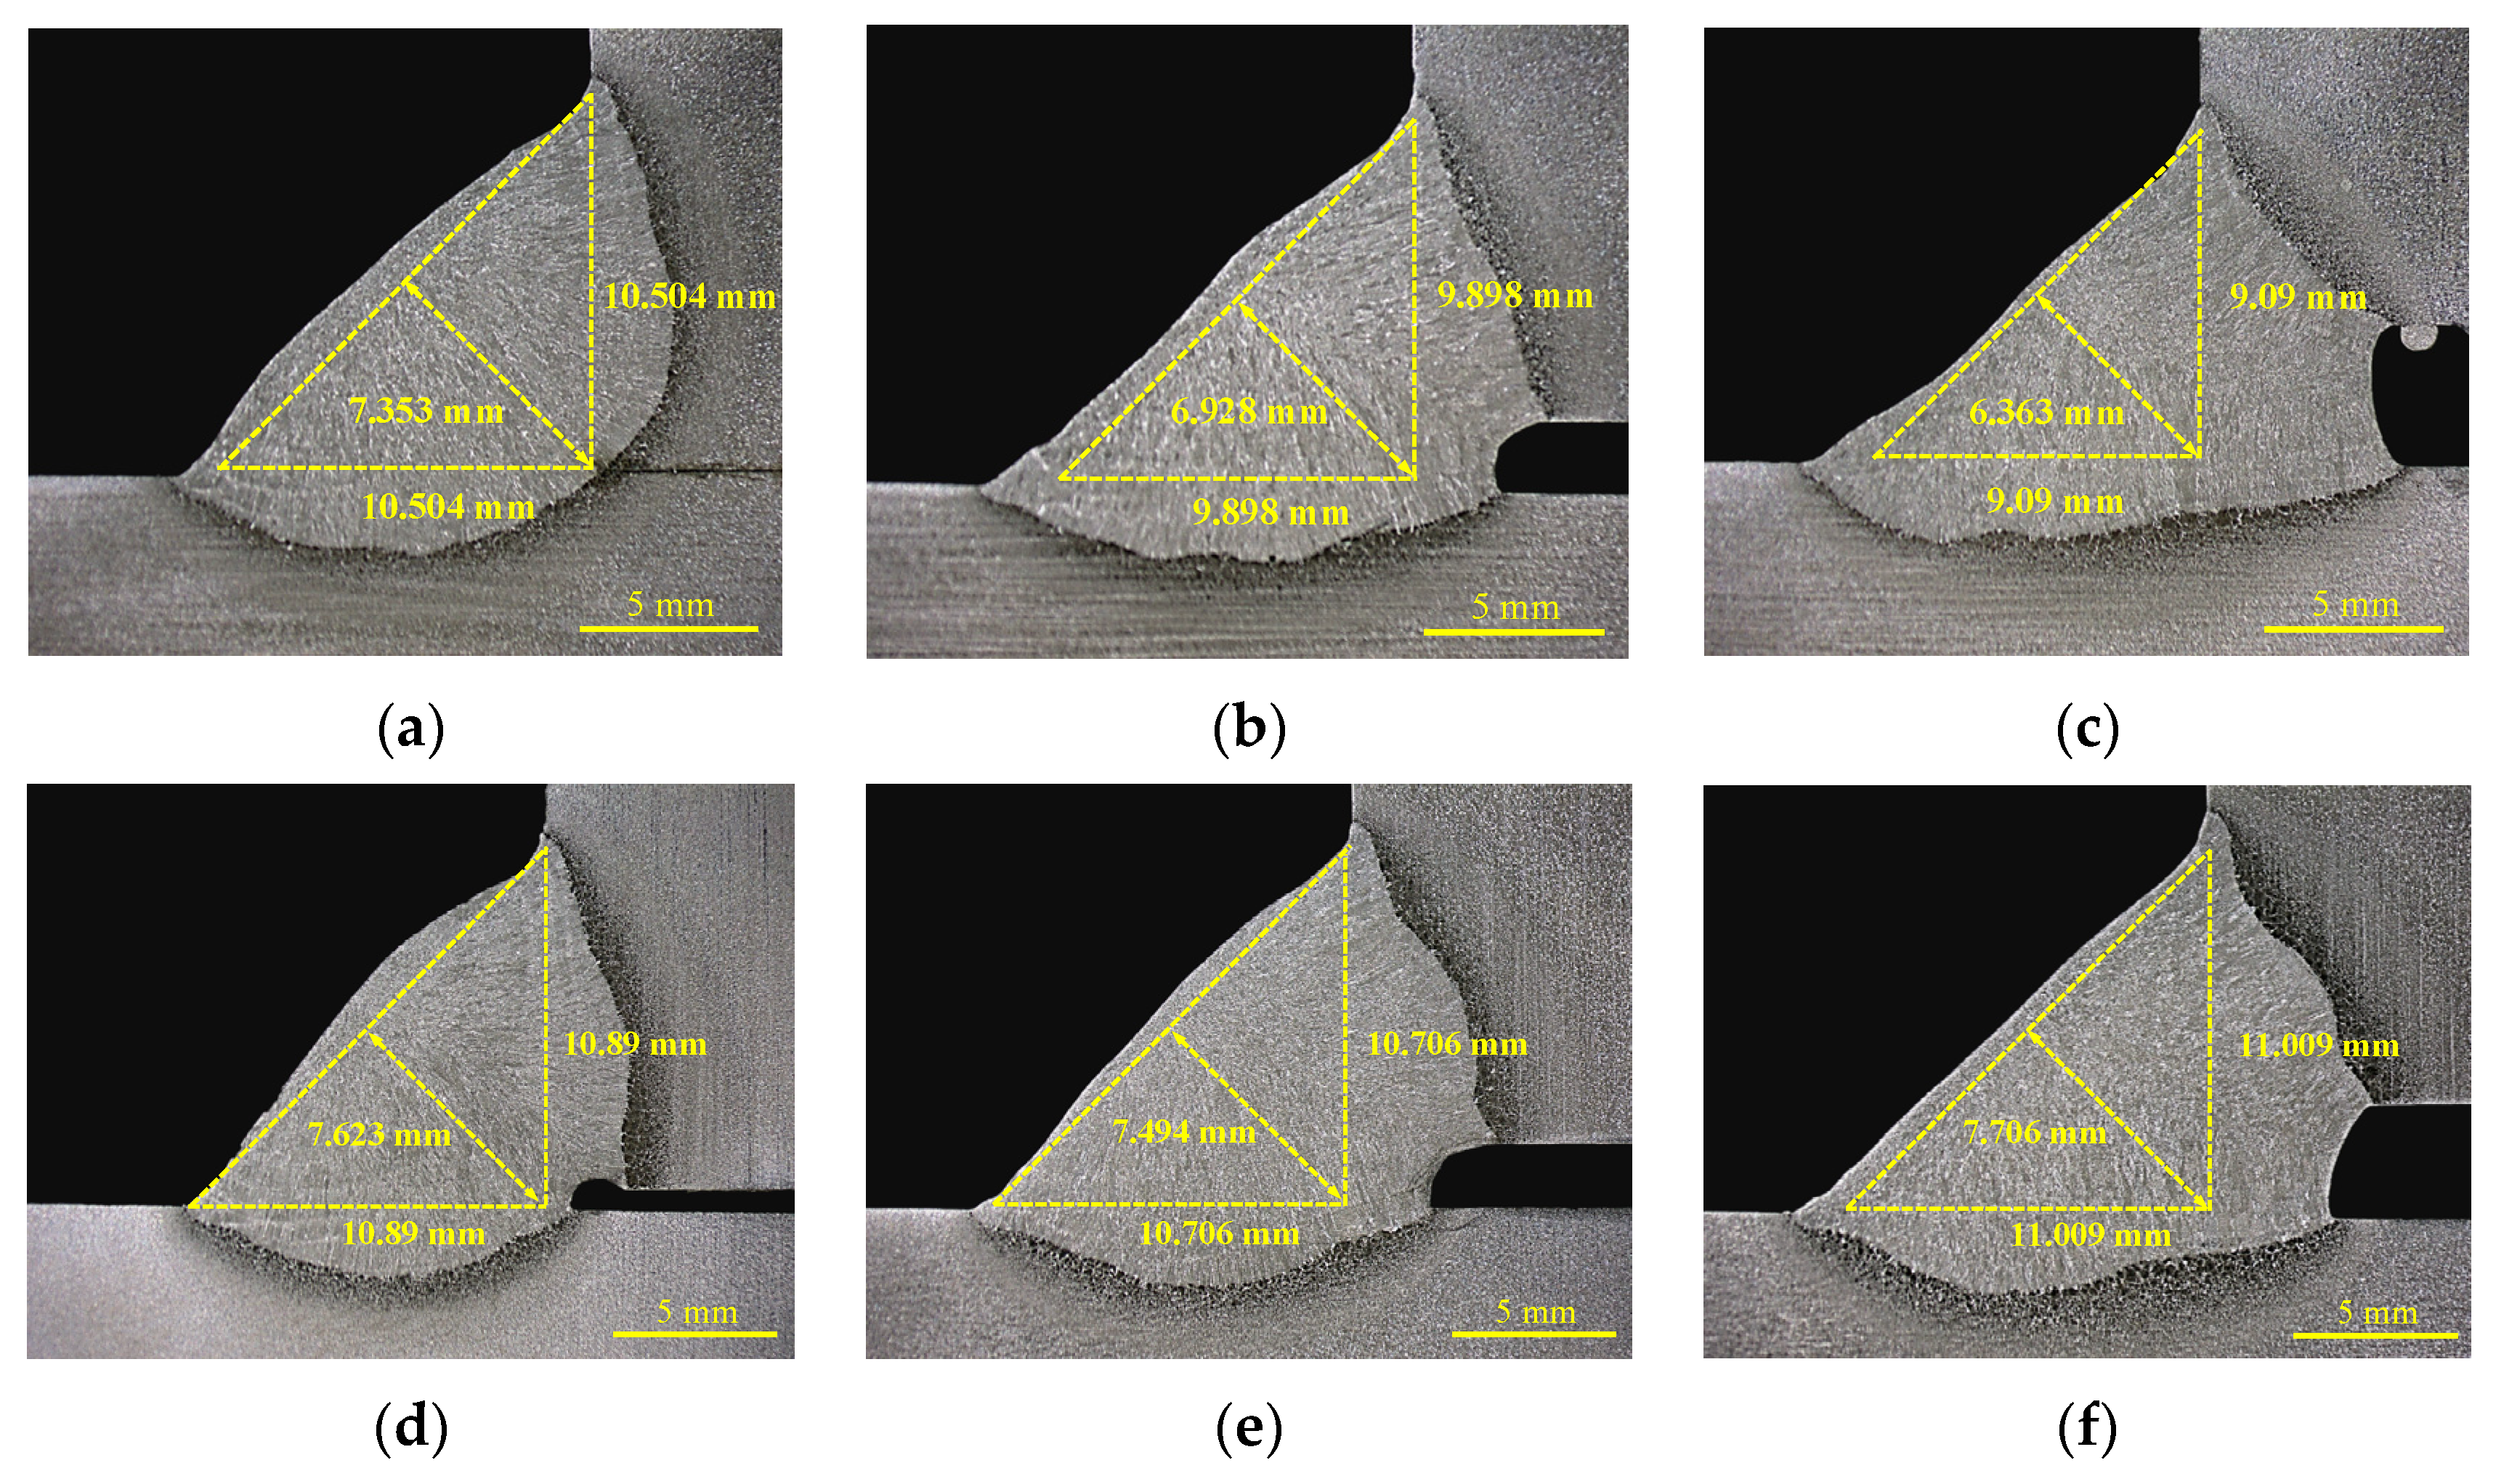
Figure 16.
Weld bead cross-sectional comparison with and without quality control (optimal conditions for 0 mm gap): (a–c) without real-time weld quality control, and (d–f) with weld quality control based on the proposed DNN method.
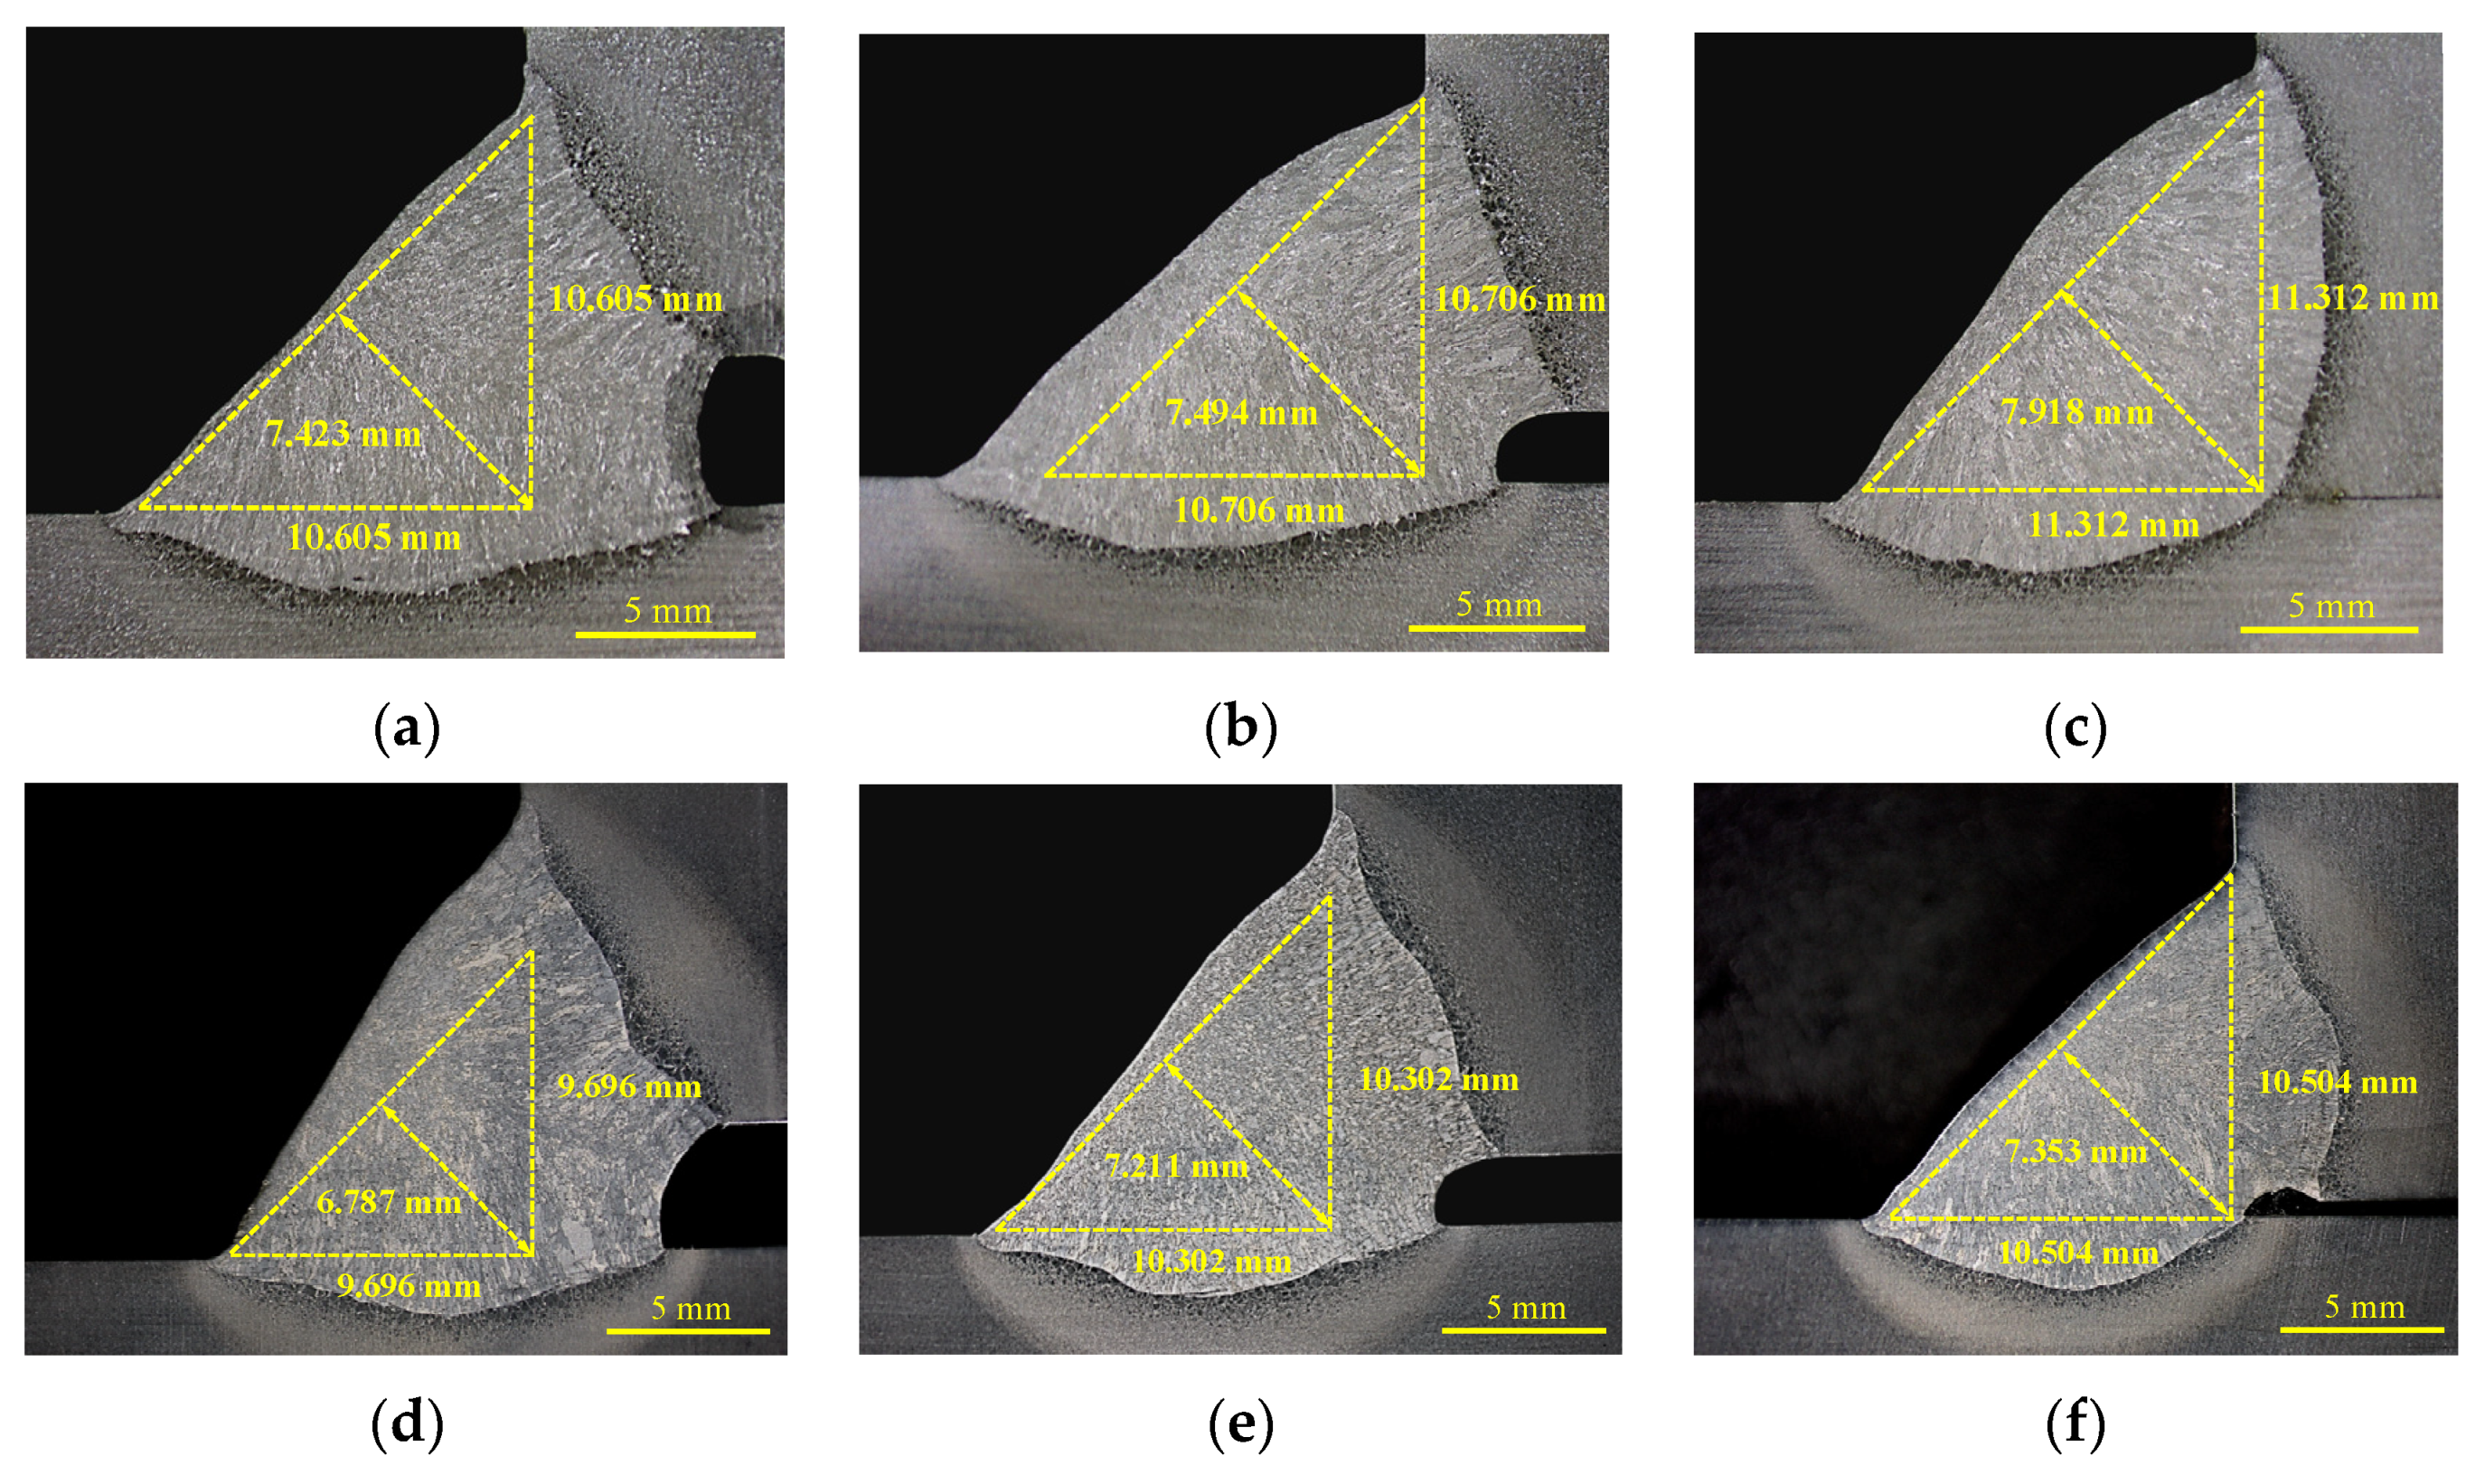
Figure 17.
Weld bead cross-sectional comparison with and without quality control (optimal conditions for 4 mm gap): (a–c) without real-time weld quality control, and (d–f) with weld quality control based on the proposed DNN method.
Table 1.
Chemical composition and mechanical properties of the base metal.
| | Chemical Composition (wt%) | Mechanical Properties |
|---|
| SS 400 | C | Si | Mn | P | S | YP
(MPa) | TS
(MPa) | EI
(%) |
| 0.1744 | 0.252 | 0.773 | 0.0127 | 0.0037 | 281 | 457 | 26 |
Table 2.
Welding experiment conditions.
| Welding Parameter | Parameter Value |
|---|
| Welding type | FCAW |
| Welding speed (cm/min) | 10.8, 13.2, 16.0 |
| CTWD (mm) | 18 |
| Wire feed rate (m/min) | 6.8 |
| Welding voltage (V) | 29 |
| Welding joint | T-fillet joint |
| Shield gas | CO2-100% (25 L/min) |
| Weld gap (mm) | 0, 2, 4 |
| Weaving speed (Hz) | 0.9 |
| Weaving width (mm) | 9 |
| Torch work angle (°) | 45 |
Table 4.
Definitions of feature variables.
| Feature Variable Number | Description | Symbol |
|---|
| X1 | Average welding current value in one weaving section | |
| X2 | Average of bottom peak value (current) | |
| X3 | Standard deviation of bottom peak value (current) | |
| X4 | Average of top peak value (current) | |
| X5 | Average value of top to bottom peak with respect to median filter | |
| X6 | Average value of bottom to top peak with respect to median filter | |
| X7 | Average voltage value in one weaving section | |
| X8 | Average of bottom peak value (voltage) | |
| X9 | Standard deviation of bottom peak value (voltage) | |
| X10 | Average of top peak value (voltage) | |
| X11 | Average value of top to bottom peak with respect to median filter | |
| X12 | Average value of bottom to top peak with respect to median filter | |
| X13 | Maximum value of current frequency | |
| X14 | Average value of current frequency | |
| X15 | Standard deviation value of current frequency | |
| X16 | Maximum amplitude (current frequency) | |
| X17 | Average value of amplitude | |
| X18 | Standard deviation value of amplitude | |
| X19 | Maximum value of voltage frequency | |
| X20 | Average value of voltage frequency | |
| X21 | Standard deviation value of voltage frequency | |
| X22 | Maximum amplitude (voltage frequency) | |
| X23 | Average value of amplitude | |
| X24 | Standard deviation value of amplitude | |
Table 5.
Five DNN structures.
| DNN Structure | Input Node | Hidden Layer | Number of Nodes | Training Accuracy (%) | Training Loss | Validation Accuracy (%) | Validation Loss |
|---|
| Structure 1 | 24 | 5 | 64-64-64-64-64 | 88.6 | 0.42 | 83.6 | 0.51 |
| Structure 2 | 5 | 128-128-128-128-128 | 90.2 | 0.25 | 88 | 0.29 |
| Structure 3 | 5 | 256-128-128-64-64 | 94.3 | 0.15 | 92 | 0.22 |
| Structure 4 | 4 | 256-128-128-64 | 89.5 | 0.36 | 85 | 0.44 |
| Structure 5 | 4 | 128-128-64-64 | 88.4 | 0.39 | 81 | 0.48 |
Table 6.
Training network structure of the DNN used in this study (structure 3).
| Layer Number | Type | Output Shape | Number of Parameters | Arguments |
|---|
| - | Input | 24 | | Range = [0,1,2] |
| 1 | Dense_1 | 256 | 6400 | |
| 2 | Batch Normalization_1 | 256 | 1024 | |
| 3 | Activation_1 | 256 | | Function = ReLU |
| 4 | Dropout_1 | 256 | | Probability = 0.5 |
| 5 | Dense_2 | 128 | 32896 | |
| 6 | Batch Normalization_2 | 128 | 512 | |
| 7 | Activation_2 | 128 | | Function = ReLU |
| 8 | Dropout_2 | 128 | | Probability = 0.5 |
| 9 | Dense_3 | 128 | 16512 | |
| 10 | Batch Normalization_3 | 128 | 512 | |
| 11 | Activation_3 | 128 | | Function = ReLU |
| 12 | Dropout_3 | 128 | | Probability = 0.5 |
| 13 | Dense_4 | 64 | 8256 | |
| 14 | Batch Normalization_4 | 64 | 256 | |
| 15 | Activation_4 | 64 | | Function = ReLU |
| 16 | Dropout_4 | 64 | | Probability = 0.5 |
| 17 | Dense_5 | 64 | 4160 | |
| 18 | Batch Normalization_5 | 64 | 256 | |
| 19 | Activation_5 | 64 | | Function = ReLU |
| 20 | Dropout_5 | 64 | | Probability = 0.5 |
| 21 | Dense_6 | 3 | 195 | Function = Softmax |
| 22 | Batch Normalization_6 | 3 | 12 | |
| 23 | Activation_6 | 3 | | Function = ReLU |
Table 7.
Weld gap monitoring performance of the proposed DNN model.
| Welding Speed (cm/min) | Output | Support | Correctly
Estimated | Error | Accuracy % | Average Accuracy % |
|---|
| 16 (motion 1) | Class 0 | 38 | 34 | 4 | 89.5 | 92.8 |
| Class 1 | 45 | 40 | 5 | 88.9 |
| Class 2 | 36 | 36 | 0 | 100 |
| 13.2 (motion 2) | Class 0 | 47 | 43 | 4 | 91.5 | 94.1 |
| Class 1 | 48 | 46 | 2 | 95.8 |
| Class 2 | 39 | 37 | 2 | 94.9 |
| 10.8 (motion 3) | Class 0 | 54 | 50 | 4 | 92.6 | 94.07 |
| Class 1 | 59 | 58 | 1 | 98.3 |
| Class 2 | 46 | 42 | 4 | 91.3 |
Table 8.
Real-time weld gap detection performance of the proposed DNN model (increasing gap).
| Variable | Support | Correctly
Estimated | Error | Accuracy % | Average Accuracy % |
|---|
| Class 0 (0 mm gap) | 30 | 27 | 3 | 90 | 86 |
| Class 1 (2 mm gap) | 53 | 37 | 16 | 69.8 |
| Class 2 (4 mm gap) | 47 | 46 | 1 | 97.9 |
Table 9.
Real-time weld gap detection performance of the proposed DNN model (decreasing gap).
| Variable | Support | Correctly Estimated | Error | Accuracy % | Average Accuracy % |
|---|
| Class 0 (0 mm gap) | 43 | 40 | 3 | 93 | 89.4 |
| Class 1 (2 mm gap) | 43 | 40 | 3 | 93 |
| Class 2 (4 mm gap) | 45 | 37 | 8 | 82.2 |
Table 10.
Comparison thickness of theoretical throat with and without control (Optimal conditions for 0 mm gap).
| Thickneass of Theoretical Throat (mm) | Weld Gap (mm) |
|---|
| 0 | 2 | 4 |
|---|
| Without control | 7.353 | 6.928 | 6.363 |
| With control | 7.623 | 7.494 | 7.706 |
Table 11.
Comparison thickness of theoretical throat with and without control (Optimal conditions for 4 mm gap).
| Thickneass of Theoretical Throat (mm) | Weld Gap (mm) |
|---|
| 4 | 2 | 0 |
|---|
| Without control | 7.353 | 6.928 | 6.363 |
| With control | 7.623 | 7.494 | 7.706 |


