Article

Effect of Nanosized Ni Reinforcements on the Structure of the Sn-3.0Ag-0.5Cu Alloy in Liquid and After-Reflow Solid States

by
Andriy Yakymovych
1,2,* and
Ihor Shtablavyi
3
1
Research Group for Mechanical Response of Materials, Faculty of Technical Chemistry, TU Wien, 1060 Vienna, Austria
2
Department of Inorganic Chemistry–Functional Materials, University of Vienna, 1060 Vienna, Austria
3
Department of Metal Physics, Ivan Franko National University of Lviv, 79008 Lviv, Ukraine
*
Author to whom correspondence should be addressed.
Metals 2023, 13(6), 1093; https://doi.org/10.3390/met13061093
Submission received: 16 May 2023 / Revised: 1 June 2023 / Accepted: 6 June 2023 / Published: 9 June 2023
(This article belongs to the Topic Materials and Technologies in Reflow Soldering)

Abstract

:
The Sn-Ag-Cu (SAC) alloy family is commonly used in lead-free solders employed in the electronics industry, for instance, SAC305, SAC387, SAC405, etc. However, the trend in manufacturing small electronic products and device miniaturization faces some disadvantages in terms of mechanical properties and their higher melting temperatures compared to Pb-Sn solders, prompting new research relating to the reinforcement of existing SAC solders. The current study presents structural features of nanocomposite (Sn-3.0Ag-0.5Cu)100−x(nanoNi)x solders with 0.5 wt.%, 1.0 wt.%, and 2.0 wt.% Ni. Structural analysis of the investigated samples were performed by means of X-ray diffraction in a liquid state and scanning electron microscopy (SEM). SEM showed the mutual substitution of Ni and Cu atoms in the Cu6Sn5 and Ni3Sn4 phases, respectively. The performed structural studies in liquid and solid states provided essential information concerning the structural transformations of liquid Sn-3.0Ag-0.5Cu alloys caused by minor additions of nanosized Ni powder. The melting point and degree of undercooling of the samples were investigated by DTA analysis.

1. Introduction

Sn-based Sn-Ag-Cu alloys with various types of nanosized impurities are interesting materials and promising candidates as low-temperature solders for electronics [1,2]. Early investigations aimed to investigate the microstructure and physico-mechanical properties of Sn-based Sn-Ag-Cu (SAC) alloys as the most promising candidate for the replacement of low-temperature Sn-Pb solders, and they have been actively explored in the modern microelectronic technology [3].
There is a large number of research and review papers that postulate the advantages of solder joint characteristics using nanocomposite SAC solders [4,5,6,7,8]. It is expected that a minor addition of ceramic or metal particles on a nanoscopic scale instead of in bulk will be much uniformly distributed in the solder matrix, making the solder joint more homogeneous. One of the main reasons for this solder modification is both the suppressing of the extensively growth of the Cu6Sn5 phase in the bulk solder, as well as at the interface of the solder/substrate and a change in the morphology of this intermetallic compound (IMC) layer from a scallop-type shape to a more plane-type shape. It is also expected that metal nanoparticles will be dissolved during the soldering process and their atoms will replace the Cu atoms in the Cu-Sn IMCs, directly impacting their morphology and the growth rate of the IMCs, while solid metal (M) additions in bulk could chemically react with the liquid Sn-based matrix and form M-Sn IMCs instead. Recently, several efforts have been made to develop a new generation of Pb-free solders by minor additions of various nanosized impurities, such as ceramic or metal nanoparticles, into commercial SAC solders [9,10,11,12,13]. It was shown that the TiO2 particles were incorporated at the Sn grain boundaries in reinforced 99Sn0.3Ag0.7Cu–TiO2 composite solders at both the interface of the intermetallic layer and in the solder bulk [10]. The improved wettability, increased shear strength, and enhanced microstructure of the nanocomposite SAC305/Cu solder joints with up to 1.0 wt.% of Co nanoparticles were presented in Ref. [11]. The transport properties and microstructure of the liquid SAC alloys with Co impurities were investigated in Ref. [12], while the extra heat effects of nanosized Ni addition into the liquid Sn-3.8Ag-0.7Cu (SAC387) solder compared to the bulk material were investigated in Ref. [13].
Nanosized Ni powder is under discussion as a perspective dopant material to existing lead-free solders. For instance, research papers related to the SAC + nanoNi solder paste declared an enhancement in various quantities essential for industrial applications. An increase in the shear strength and microhardness of the as-solidified Cu/solder/Cu was indicated in [14,15,16]. Improved electrical resistivity, elastic/shear moduli, and creep were shown in Ref. [14]. The reinforced microstructure, especially at the solder/substrate interface for the nanocomposite solder joints reinforced with nanoNi, is related to a transition of the interfacial IMCs from the scallop-type morphology of the Cu6Sn5 to a more planar type due to the substitution of Cu by Ni atoms in the Cu6Sn5 compound. Structural studies of the as-reflowed and thermally aged nanocomposite SAC305 solders joints showed that additions of nanosized Ni, Ni3Sn, and Ni3Sn2 inclusions to the SAC305 solder paste led to a decrease in the average thickness of the intermetallic compound layer in the interface between the solder and the substrate compared to the corresponding produced unreinforced solder joint [15,17]. A refinement of the microstructure of the Sn-based solders after minor additions of nanosized Ni powder was also found in the case of the Sn–9Zn, Sn–8Zn–3Bi [18], and Sn–35Bi–1Ag solders [19].
It is expected that metal nanoparticles are partly or totally dissolved in the liquid SAC matrix during the soldering process. Unfortunately, the literature related to the studies of the microstructure of the liquid SAC alloys with different metal additions in the nanoscopic scale is scarce. At this point, experimental data of both structure-sensitive thermophysical properties and microstructural analysis of the liquid nanocomposite SAC solders with additions of metal nanoparticles should provide necessary information for reliable simulations of the soldering processes. The transport properties of the liquid SAC305 alloys with Ni nanoparticles were investigated in Refs. [20,21]. The present research acts as a follow-up to these studies, focusing on structural investigations in liquid and after-reflow solid states.

2. Materials and Methods

A Sn-3.0Ag-0.5Cu solder with an average powder size of 31 μm (SAC305 powder, Kester, South Plainfield, NJ, USA) and nanosized Ni powder with an average diameter of 20 nm (99.9%, IOLITEC GmbH, Heilbronn, Germany) were used to prepare the nanocomposite (SAC305)100−x(nanoNi)x alloys.
The Ni nanoparticles with different nominal content (0.0–2.0 wt.%) were mechanically mixed with the solder powder in a Retsch mixer (Retsch MM301), maintaining a frequency of 700 rpm (11.7 s−1) at room temperature for approximately 30 min. Finally, the nanocomposite powders were cold-pressed in cylindrical form with a diameter of approx. 3 mm and a high of approx. 10 mm. It should be noted that all operations with the nanosized and nanocomposite materials in a glove box (Labmaster SP MBraun, O2 and H2O level: b1 ppm each) were considered under an Ar atmosphere.
The phase transformations and the corresponding temperatures were investigated by differential thermal analysis (DTA) using a Netzsch DTA 404F (NETZSCH-Gerätebau GmbH, Selb, Germany). Calibration of the Pt/Pt10%Rh thermocouples was performed at the melting points of pure Sn, Sb, and In. The samples were placed in open alumina crucibles, while the measurements were performed under a constant argon flow of 50 mL·min−1 and with a heating/cooling rate of 5 K·min−1. Each sample was investigated in two heating and cooling cycles.
The investigation of the atomic structure of nanocomposite solders in the liquid state was carried out using the high-temperature XRD method. The use of a high-temperature chamber with a special design makes it possible to study melts and crystalline materials in an inert atmosphere in a wide range of temperatures.
The peculiarity of the method of researching the structure of composite melts compared to traditional methods of high-temperature investigations of materials is that in our case, a larger area of the free surface of the sample was required and therefore a larger volume was also required. This creates additional technical restrictions for the design of the vacuum chamber and the heating system. In order to meet these requirements, our X-ray diffractometer was equipped with a specially designed vacuum chamber with a diameter of 18 cm, which was cooled by water. Such dimensions of the vacuum chamber made it possible to use various furnaces to heat the sample (Figure 1).
Heating of the samples was carried out with a direct heater and temperature control using a type A thermocouple. CuKα radiation, which was monochromatized with a single LiF crystal, was used for the studies. A special sample holder made it possible to obtain intensity curves in the reflection mode, using the Bragg–Brentano focusing geometry in the range of angles 10° ≤ 2θ ≤ 120°. In order to calculate structure factors (SFs), intensity curves were corrected to take into account the polarization of X-rays and the appearance of incoherent scattering [22] after which, using the Krogh-Moe method [23], they were normalized to electronic units.
Information about the structure of melts was obtained based on the analysis of the dependence of the intensity of diffracted X-ray radiation on the diffraction angle I(Θ). For this purpose, we calculated the pair distribution function g(r) and the radial distribution function 4πr2ρ(r) of atoms according to the following equations:
g r = 1 + 1 2 π 2 ρ 0 0 k max S k 1 sin k r k r k 2 d k
4 π r 2 ρ r = 4 π r 2 ρ 0 + 2 r 2 π 0 k max S k 1 sin k r k r k 2 d k
where S(k) is the structure factor, which is calculated as
S k = I k f i 2 k
and k = 4 π sin θ λ (where θ is a half of the scattering angle, and λ—X-rays wavelength). The positions of the main maxima of the pair distribution function make it possible to determine the most probable distances between atoms in the first (r1) and second (r2) coordination spheres. The area under the maxima of the radial distribution functions gives information about the coordination numbers.
Powder XRD measurements were carried out on a Bruker D8 diffractometer at ambient temperature using Ni-filtered CuKα radiation (accelerating voltage, 40 kV; electron current, 40 mA). The diffractometer operated in the θ/2θ mode. The powder was fixed with petroleum jelly on a single-crystal silicon sample carrier, which was rotated during the measurement. The detection unit was a Lynxeye strip detector. Indexing of the phases was supported by the Inorganic Crystal Structural Database (ICSD). Rietveld refinement of the XRD patterns was carried using Topas3® software provided by Bruker AXS.
The solidified samples were characterized by scanning electron microscopy (SEM) using a Zeiss Supra 55 VP ESEM. The microscope was equipped with an energy-dispersive X-ray (EDX) spectrometer. The excitation energy of the electron beam was 15–20 kV; backscattered electrons (BSEs) were detected to visualize the surfaces of the samples. The chemical analysis was performed using the energy-dispersive X-ray (EDX) technique, while four characteristic spectral lines of Co, Cu (K-line) and Ag, and Sn (L-line) were used for energy calibration of the EDX detector signal. The standard deviation for the chemical compositions obtained from EDX was about ±1 at%.

3. Results and Discussion

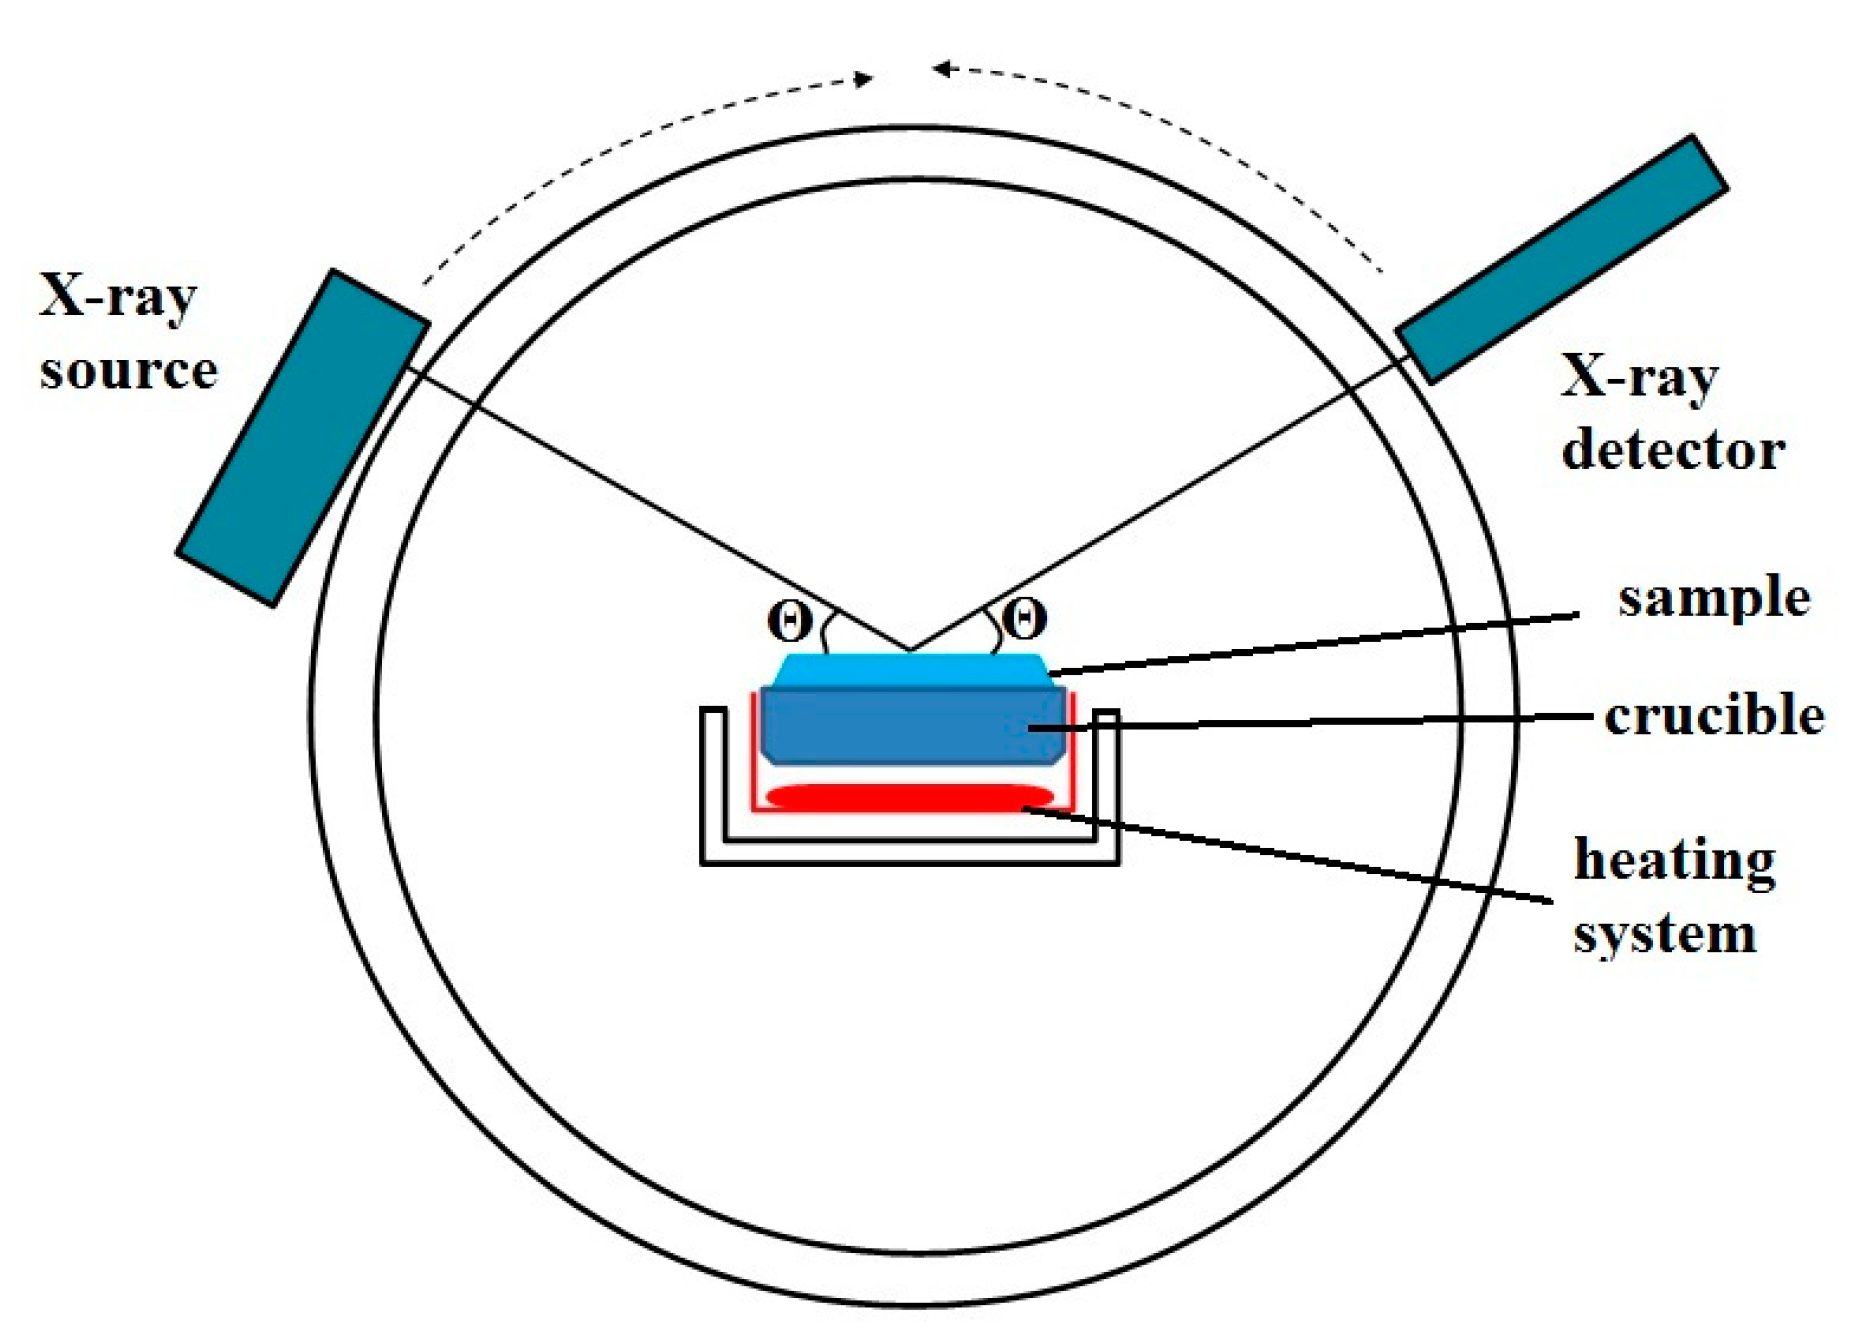
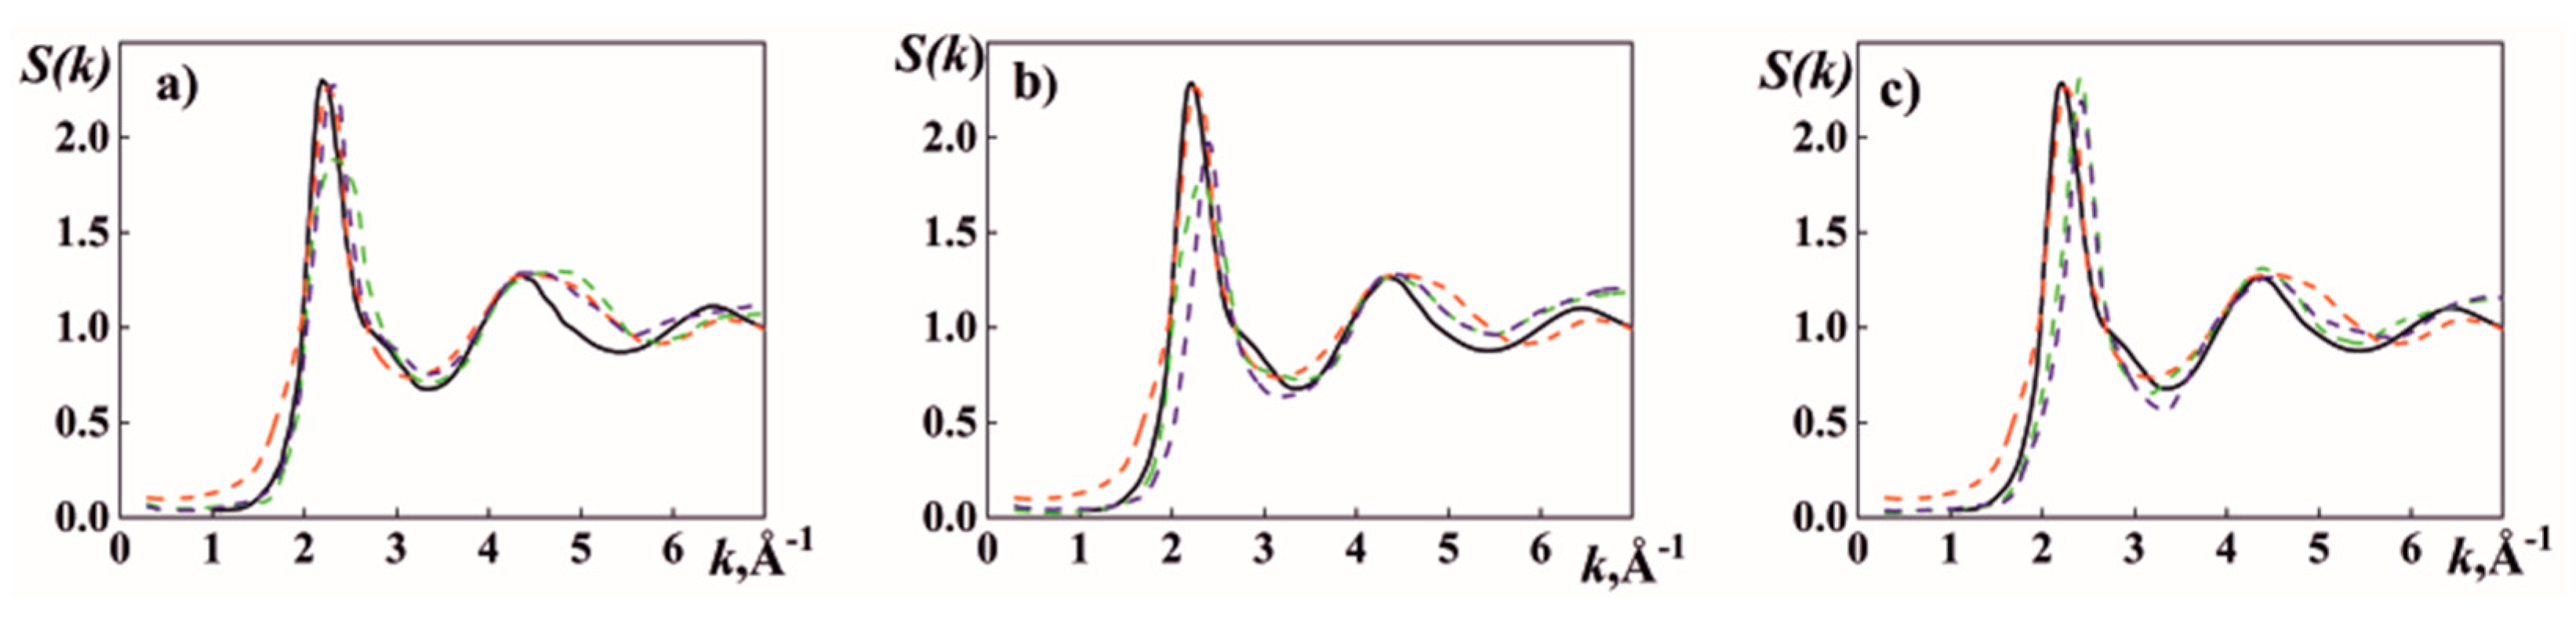
3.1. High-Temperature XRD Analysis
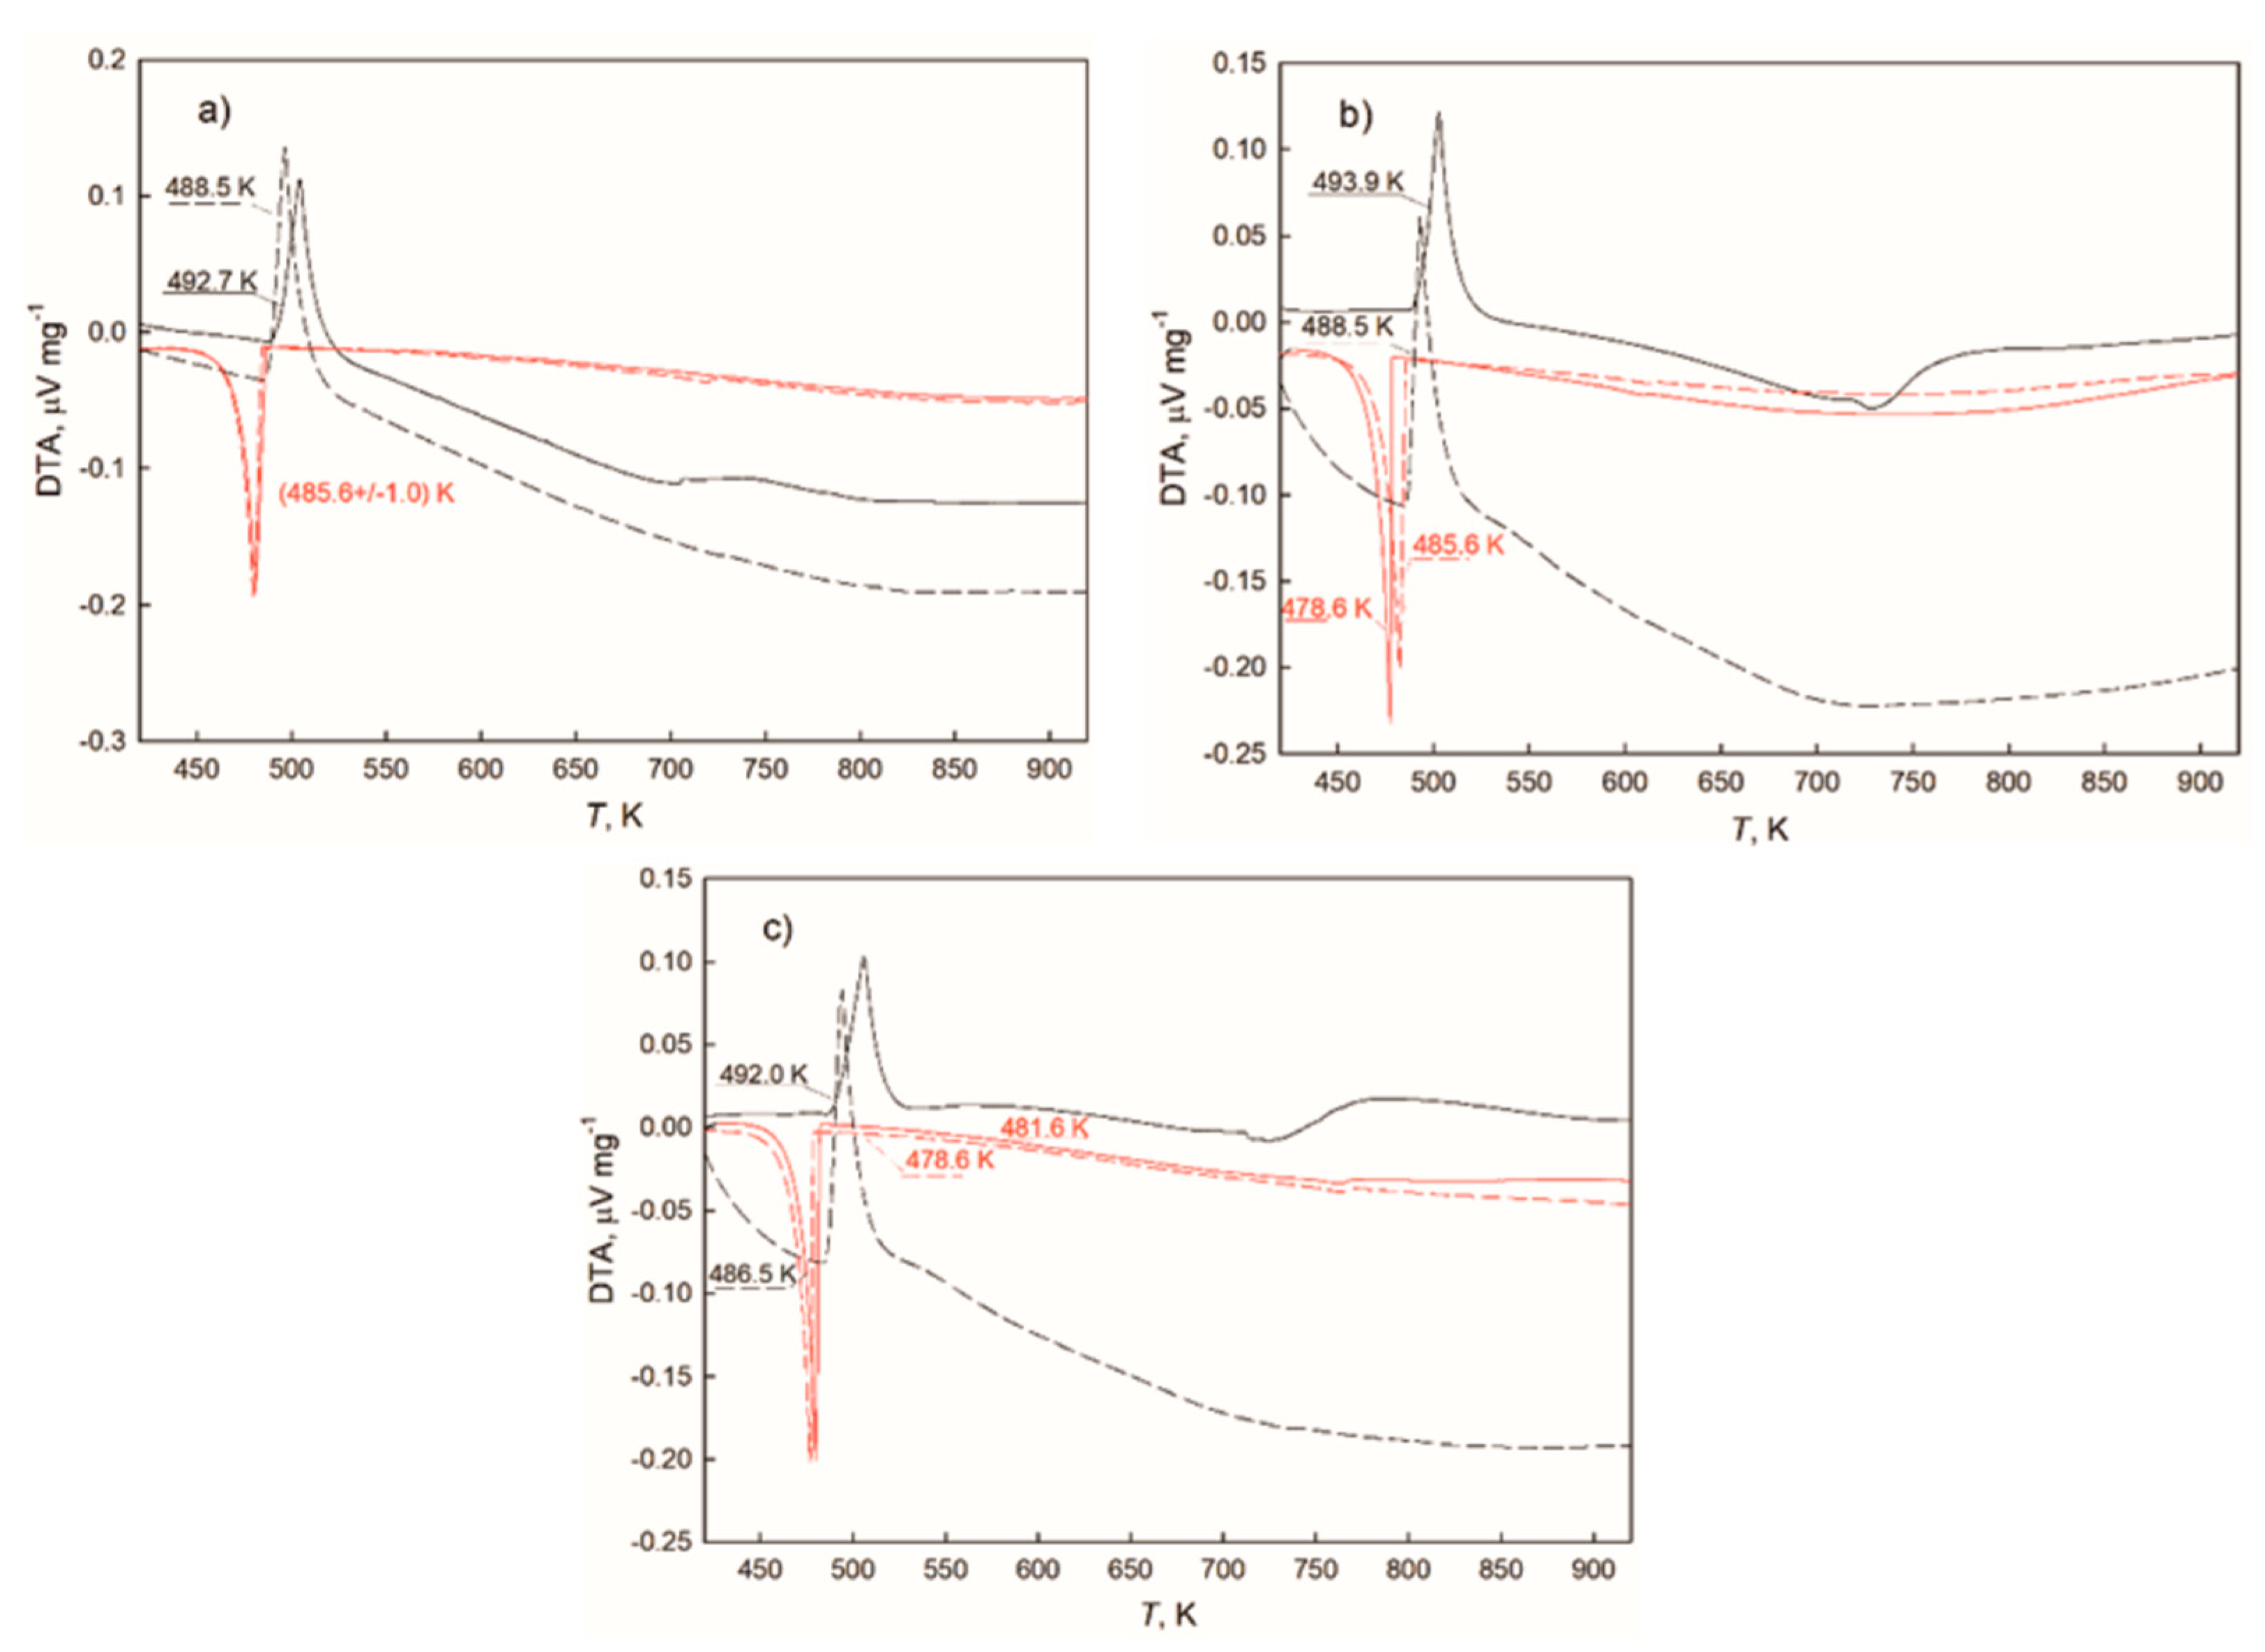
The recent study of the electrical conductivity of the liquid (SAC305)100−x(nanoNi)x alloys showed hysteresis between heating and cooling curves up to 400 K–500 K above the melting point for the samples with 1.0 wt.% and 2.0 wt.% of Ni NPs, respectively [20]. Therefore, it was decided to perform the high-temperature XRD study at temperatures much higher than the melting point of the SAC305 alloy to be sure that the added Ni NPs were completely dissolved in the liquid Sn-based matrix at fast heating, and the samples were in the homogeneous liquid state.
Considering the small content of silver and copper in the alloy and the insufficient information about the phase diagram of the four-component system, we focused on the liquidus temperatures of investigated alloys obtained from the binary Sn-Ni phase diagram and from the results of our thermal studies. According to our analysis, the liquidus temperatures of alloys with different nickel contents were as follows: Tm = 648 K; and 738 K and 848 K for alloys with 0.5 wt.%, 1.0 wt.% and 2.0 wt.% of Ni nanoparticles, respectively. A temperature of 60 K was chosen for structure investigations within Tm − 55 K and Tm + 5 K. Therefore, the investigations were performed at two different temperatures for each composition to discover structure features and possible structure transformations in the liquid state caused by temperature changes.
Figure 2 shows the structure factors (SFs) for the liquid (SAC305)100−x(Ni)x alloys compared to pure Sn and SAC305. A comparison of the structure factors of tin and the SAC305 melt shows small changes in the profile of their first maxima. The main difference is the disappearance of the shoulder on the right-hand side of the first maximum and the increase in the width of the second. The disappearance of the shoulder at the first maximum indicates the absence of covalently bound tin atoms in the melt, a small amount of which is present in pure tin [24,25]. The reason for this is obviously the predominant interaction of copper and silver with tin, which leads to the formation of clusters of tin around Cu or Ag atoms, which reduces the average most probable distances between SAC305 alloy atoms compared to tin ( r 1 S n = 0.323 nm, r 1 S A C 305 = 0.311 nm).
The addition of nickel nanoparticles had different effects on the structure of the melt, depending on the content of nanoparticles and the temperature. In the case where the content of nickel nanoparticles did not exceed one weight percent at a temperature close to the liquidus temperature of the alloy, the height of the first maximum of the structure factor decreased and its width increased. Such a change in the profile of the first maximum indicates a decrease in atomic ordering density [26] at the nanoparticle–melt boundary. As the temperature increased, the height of the first maximum of the SF increased, which indicates the dissolution of nickel in the melt.
It should be noted that even at temperatures close to liquidus, a small part of the nickel atoms dissolved in the melt, as evidenced by the shift of the first maximum of SF towards larger wave vectors, as well as the reduction in interatomic distances compared to pure tin. Increasing the temperature of (SAC305)99.5(Ni)0.5 (Figure 2a) and (SAC305)99.0(Ni)1.0 (Figure 2b) alloys led to the complete dissolution of nanoparticles of nickel, which led to a decrease in the mean interatomic distances and increase in the coordination number (Table 1). It is likely in this case (Ni, Cu, Ag) that Sn complexes were formed in the melt.
The structure of the melt changed in a completely different way with the addition of two weight percent of nickel nanoparticles. As we can see from the changes in the profile of the first maximum of the SFs (Figure 2c), even at a temperature close to liquidus, nickel dissolves in the melt, which leads to an increase in the degree of ordering and the consolidation of the melt clusters.

3.2. DTA Study

DTA was performed to estimate the characteristic temperatures of the quaternary Sn-based Ag-Cu-Ni-Sn alloys. Each sample was heated and cooled twice. The thermal effects observed at first heating corresponded to the nanocomposite alloy, while the following cooling, as well as the next cycle, should relate to the Sn-based Ag Cu Ni Sn system. By comparing the DTA thermograms during the first and second heating in Figure 3a–c, it is seen that the nanocomposite samples started to melt at a temperature of about 5 K higher than the corresponding bulk (SAC305)100−x(Ni)x alloys. The respective reaction temperatures of the quaternary alloys, evaluated from the present results, are listed in Table 2.
The degree of undercooling is defined by the difference in two onset temperatures in cooling and heating curves. It can be seen that initial additions of Ni reduced the degree of undercooling within the investigated concentration range, while the smallest value was observed by 0.5 wt% Ni. The investigated alloys are in a four-phase Sn + Ag3Sn + Cu6Sn5 + Ni3Sn4 region according to the phase diagram of that quaternary system [28]. The degree of undercooling should be directly connected with the crystallization process and is further discussed below.
The binary Sn-rich Ni-Sn alloys consisted of pure Sn and Ni3Sn4 IMC with respective phase concentrations, while the eutectic point corresponded to a concentration of 99.67 at.% Sn and a temperature of 504.3 K [29]. At the same time, relatively high solubility of Ni in the Cu6Sn5 phase was reported. That solubility was temperature-dependent and reached 29 at.% Ni at 673 K [30], studying the interfacial reactions between liquid Sn and various Cu-Ni alloys’ metallization. Therefore, minor additions of Ni did not lead to significant changes in the melting point of the near-eutectic SAC305 alloy, while the decreased undercooling suggested a catalytic action of Ni atoms on the nucleation of solidification.

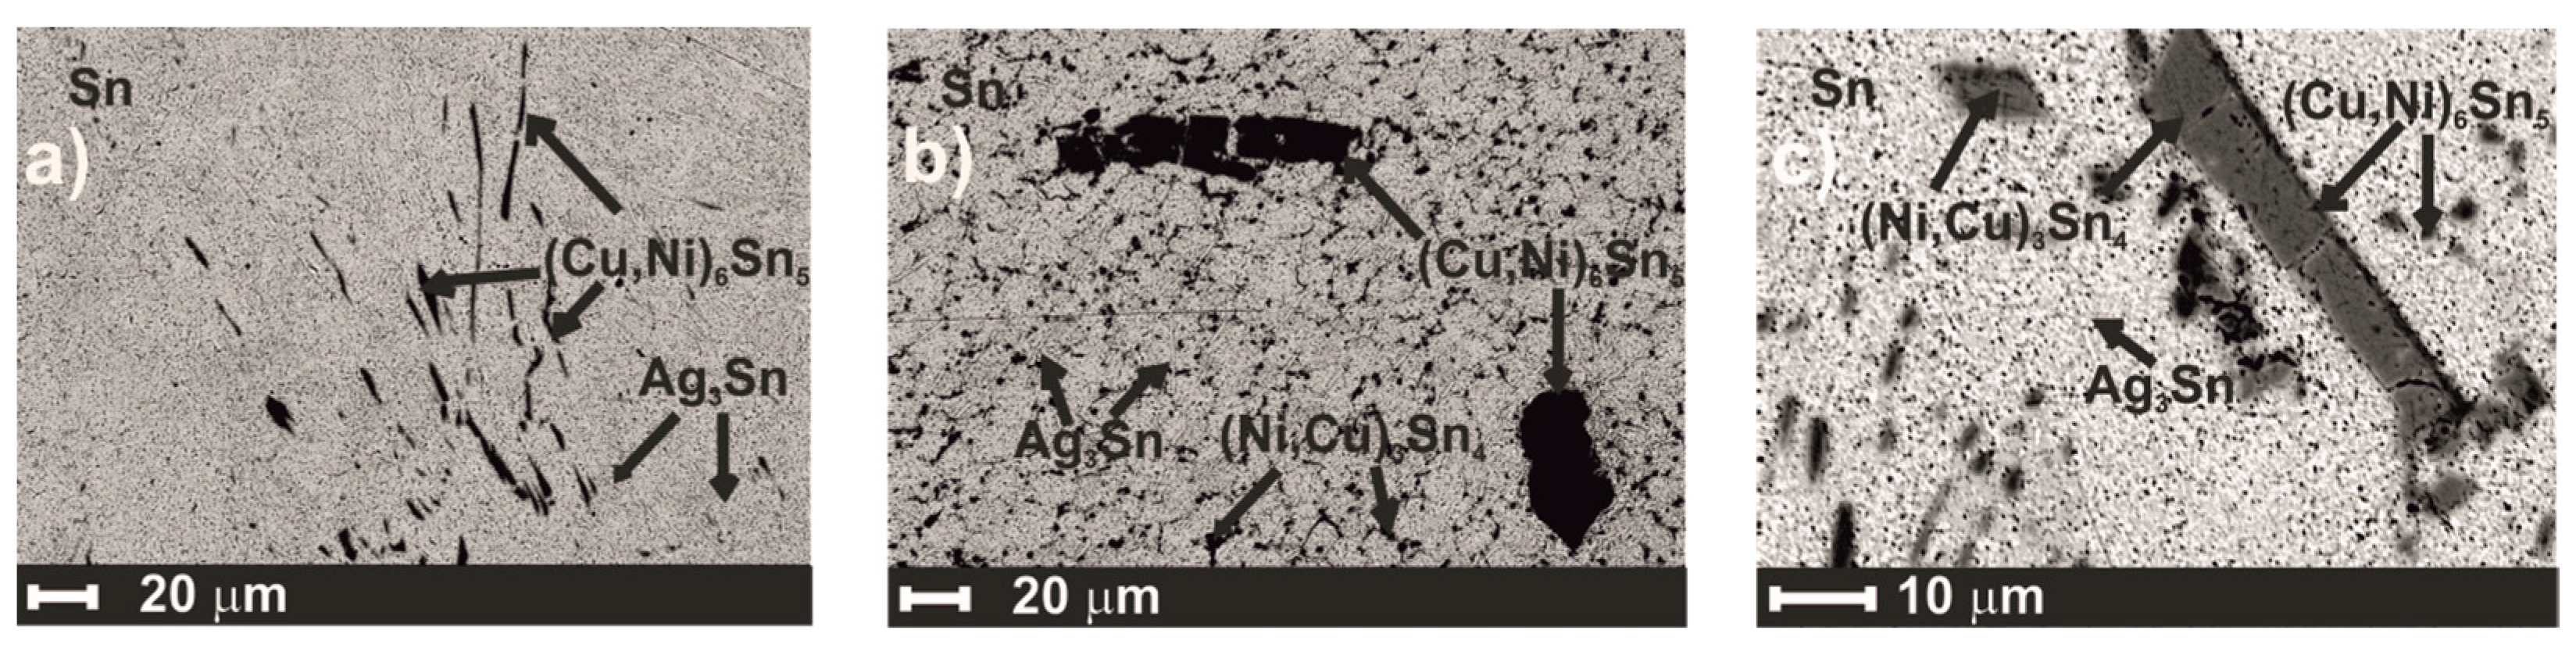
3.3. The Microstructural Study in the Solid State

The microstructure of the solidified (SAC305)100−xNix samples after measurements in the liquid state was studied by SEM and X-ray diffraction. The results of phase analyses of the investigated alloys can be found in Table 3, while the BSE images are presented in Figure 4a–c. No residual pure Ni was found in the samples. According to Vuorinen et al. [30], a relatively large amount of Ni atoms can substitute Cu in the Cu6Sn5 compound, which is in agreement with our results presented in Table 3 (sample BA1) and Figure 4a. Therefore, it is expected that the samples up to 1 wt.% Ni consisted of the Ag3Sn and (Cu,Ni)6Sn5 phases embedded into the βSn matrix.
An increase in the Ni content in the quaternary alloys to 1.0 wt.% led to the formation of another IMC, namely the Ni3Sn4. It was also found that Cu substituted Ni atoms in the Ni3Sn4 phases (Table 3/Samples BA2 and BA3 and Figure 4b,c). This is in agreement with the literature [20,31]. For instance, up to 6 at.% of Cu was found in the (Ni,Cu)3Sn4 phase by Schmetterer et al. [31], while the (Ni,Cu)3Sn4 phase with similar elemental concentrations was found in the (SAC305)100−xNix alloys with 1.0 and 2.0 wt.% Ni in Ref. [20]. It is suggested the formation of the (Ni,Cu)3Sn4 phase had an impact on the solidification process and slightly increased the degree of undercooling of the (SAC305)99.0Ni1.0 sample compared to the (SAC305)99.5Ni0.5 alloy.
The BSE micrographs of the investigated alloys show uniform distribution of both the very fine needle-shaped Ag3Sn phase and the spherical grains of the (Cu,Ni)6Sn5 phase in the Sn-based matrix. At the same time, the (Ni,Cu)3Sn4 phase grew in terms of grains, reaching up to 20 μm. The formation of the (Cu,Ni)6Sn5 and (Ni,Cu)3Sn4 phases was also indicated by the microstructural investigations of the solidified (SAC387)100−x(Ni)x samples after calorimetric measurements in Ref. [13].
XRD investigations showed the presence of the intermetallic compounds estimated by SEM analysis in the investigated samples and confirmed the data in Table 3 and Figure 4. For instance, Figure 5 shows the XRD pattern of (SAC305)99.5Ni0.5. It should be noted that the peaks of binary and ternary phases were comparatively weak; therefore, SEM-EDX analysis delivered important information and confirmed the existence of Ag3Sn, (Cu,Ni)6Sn5, and (Ni,Cu)3Sn4 inclusions in the βSn matrix.

4. Conclusions

The current work presents a study on the Sn-3.0Ag-0.5Cu solder with minor additions of nanosized Ni particles. Based on the performed high-temperature XRD analysis, it is suggested that initial additions of Ni NPs up to 1.0 wt.% were partly dissolved in the SAC305 melt at temperatures close to the liquidus points of the corresponding Sn-Ag-Cu-Ni alloys, while the height of the first maximum of the structure factor decreased and its width increased. It supposed the formation of (Ni, Cu, Ag)Sn complexes in the melts. The further temperature increase led to the total dissolution of the Ni NPs. The total dissolution of nanoparticles, even at temperatures near the liquidus point, was indicated for the melt with 2.0 wt.% Ni. Any significant changes in the melting point of the SAC305 solder were observed by the addition of up to 2.0 wt.% Ni. At the same time, the reduced degree of undercooling supposed a catalytic action of Ni atoms on the nucleation process. The microstructural analysis for the as-solidified samples showed that Ni atoms replaced Cu atoms in the Cu6Sn5 IMC by initial additions of Ni NPs into the SAC305 alloy. The (Sn-3.0Ag-0.5Cu)100−x(nanoNi)x solders with more than 1.0 wt.% Ni consisted of Sn, Ag3Sn, (Cu,Ni)6Sn5, and (Ni,Cu)3Sn4 phases. It is supposed that the formation of the last phase increases the degree of undercooling by about 2–3 °C; however, it remains much less than in the SAC305 alloy.

Author Contributions

Conceptualization and design of the study, A.Y.; XRD measurements in the liquid state, I.S.; DTA and structural investigations in the solid state, A.Y.; writing—original draft preparation, A.Y.; writing—review and editing, I.S. All authors have read and agreed to the published version of the manuscript.

Funding

This research was funded by the Austrian Science Fund (FWF), project Nos. P27049 and P34894.

Data Availability Statement

Not applicable.

Acknowledgments

The authors want to thank Stephan Puchegger from the Department of Physics, University of Vienna for his help with SEM measurements and the Austrian Science Fund (FWF) for the Open Access funding.

Conflicts of Interest

The authors declare no conflict of interest. The funders had no role in the design of the study; in the collection, analyses, or interpretation of data; in the writing of the manuscript; or in the decision to publish the results.

References

  1. Li, M.-L.; Zhang, L.; Jiang, N.; Zhang, L.; Zhong, S.-J. Materials modification of the lead-free solders incorporated with micro/nano-sized particles: A review. Mater. Design. 2021, 197, 109224. [Google Scholar] [CrossRef]
  2. Tian, R.; Wang, C.; Huang, Y.; Guo, X. Effects of nanoparticle addition on the reliability of Sn-based Pb-free solder joints under various conditions: A review. NANO 2023, 18, 2330001. [Google Scholar] [CrossRef]
  3. Schmetterer, C.; Ipser, H.; Pearce, J. ELFNET COST Action 531—Handbook of Properties of SAC Solders and Joints; Vydavatelstvi KNIHAR: Brno, Czech Republic, 2008. [Google Scholar]
  4. Tamizi, M.; Movahedi, M.; Kokabi, A.H. Real-time monitoring of soldering process in SAC composite solder paste: Movement and interaction of dopant particles in solder paste. J. Mater. Sci. Mater. Electron. 2023, 34, 507. [Google Scholar] [CrossRef]
  5. Tikale, S.; Narayan Prabhu, K. Bond shear strength of Al2O3 nanoparticles reinforced 2220-capacitor/SAC305 solder interconnects reflowed on bare and Ni-coated copper substrate. J. Mater. Sci. Mater. Electron. 2021, 32, 2865–2886. [Google Scholar] [CrossRef]
  6. Rajendran, S.H.; Hwang, S.J.; Jung, J.P. Shear strength and aging characteristics of Sn-3.0Ag-0.5Cu/Cu solder joint reinforced with ZrO2 nanoparticles. Metals 2020, 10, 1295. [Google Scholar] [CrossRef]
  7. Lu, X.; Zhang, L.; Xi, W.; Li, M.-I. Structure and properties of low-Ag SAC solders for electronic packaging. J. Mater. Sci. Mater. Electron. 2022, 33, 22668–22705. [Google Scholar] [CrossRef]
  8. Aamir, M.; Muhammad, R.; Tolouei-Rad, M.; Giasin, K.; Silberschmidt, V. A review: Microstructure and properties of tin-silver-copper lead-free solder series for the applications of electronics. Solder. Surf. Mount. Technol. 2020, 32, 115–126. [Google Scholar] [CrossRef]
  9. Skwarek, A.; Krammer, O.; Hurtony, T.; Ptak, P.; Górecki, K.; Wroński, S.; Straubinger, D.; Witek, K.; Illés, B. Application of ZnO nanoparticles in Sn99Ag0.3Cu0.7 based composite solder alloys. Nanomaterials 2021, 11, 1545. [Google Scholar] [CrossRef]
  10. Skwarek, A.; Ptak, P.; Górecki, K.; Hurtony, T.; Illés, B. Microstructure influence of SACX0307-TiO2 composite solder joints on thermal properties of power LED assemblies. Materials 2020, 13, 1563. [Google Scholar] [CrossRef]
  11. Gu, Y.; Liu, Y.; Zhao, X.; Wen, S.; Li, H.; Wang, Y. Effects of cobalt nanoparticles addition on shear strength, wettability and interfacial intermetallic growth of Sn−3.0Ag−0.5Cu solder during thermal cycling. Mater. Sci. Forum. 2015, 815, 97–102. [Google Scholar] [CrossRef]
  12. Yakymovych, A.; Sklyarchuk, V.; Plevachuk, Y.; Sokoliuk, B. Viscosity and electrical conductivity of the liquid Sn-3.8Ag-0.7Cu alloy with minor Co admixtures. JMEPEG 2016, 25, 4437–4443. [Google Scholar] [CrossRef] [Green Version]
  13. Yakymovych, A.; Kaptay, G.; Flandorfer, H.; Bernardi, J.; Schwarz, S.; Ipser, H. The nano heat effect of replacing macro-particles by nano-particles in drop calorimetry: The case of core/shell metal/oxide nano-particles. RSC Adv. 2018, 8, 8856. [Google Scholar] [CrossRef] [Green Version]
  14. Gain, A.; Zhang, L. Effects of Ni nanoparticles addition on the microstructure, electrical and mechanical properties of Sn-Ag-Cu alloy. Materialia 2019, 5, 100234. [Google Scholar] [CrossRef]
  15. Yakymovych, A.; Švec, P.; Orovcik, L. Nanocomposite SAC solders: The effect of adding Ni and Ni-Sn nanoparticles on morphology and mechanical properties of Sn-3.0Ag-0.5Cu solders. J. Electron. Mater. 2018, 47, 117–123. [Google Scholar] [CrossRef] [Green Version]
  16. Gan, G.-S.; Gan, L.-Q.; Guo, J.-Z.; Xia, D.-Q.; Zhang, C.; Yang, D.; Wu, Y.; Liu, C. Ultrasonic-assisted soldering of low-Ag SAC lead-free solder paste at low-temperature. Mater. Trans. 2018, 59, 359–366. [Google Scholar] [CrossRef] [Green Version]
  17. Yakymovych, A.; Plevachuk, Y.; Orovcik, L.; Švec, P., Sr. Nanocomposite SAC solders: The effect of heat treatment on the morphology of Sn-3.0Ag-0.5Cu/Cu solder joints reinforced with Ni and Ni-Sn nanoparticles. Appl. Nanosci. 2022, 12, 977–982. [Google Scholar] [CrossRef]
  18. Gain, A.K.; Chan, Y.C.; Yung, K.C.; Sharif, A.; Ali, L. Effect of nano Ni additions on the structure and properties of Sn-9Zn and Sn-8Sn-3Bi solder in ball grid array packages. In Proceedings of the 2nd Electronics System-Integration Technology Conference, Greenwich, UK, 1–4 September 2008; pp. 1291–1294. [Google Scholar] [CrossRef]
  19. Gain, A.K.; Zhang, L.C. Interfacial microstructure, wettability and material properties of nickel (Ni) nanoparticle doped tin–bismuth–silver (Sn–Bi–Ag) solder on copper (Cu) substrate. J. Mater. Sci. Mater. Electron. 2016, 27, 3982–3994. [Google Scholar] [CrossRef]
  20. Yakymovych, A.; Plevachuk, Y.; Sklyarchuk, V.; Sokoliuk, B.; Galya, T.; Ipser, H. Microstructure and electro-physical properties of Sn-3.0Ag-0.5Cu nanocomposite solder reinforced with Ni nanoparticles in the melting-solidification temperature range. J. Phase Equilibria Diffus. 2017, 38, 217–222. [Google Scholar] [CrossRef] [Green Version]
  21. Yakymovych, A.; Weber, H.; Kaban, I.; Ipser, H. Dynamic viscosity of a liquid Sn 3.0Ag 0.5Cu alloy with Ni nanoparticles. J. Mol. Liq. 2018, 268, 176–180. [Google Scholar] [CrossRef]
  22. Cromer, D.T.; Waber, J.T. Scattering factors computed from relativistic Dirac-Slater wave functions. Acta Crystallogr. 1965, 18, 104–109. [Google Scholar] [CrossRef]
  23. Kroghmoe, J. A method for converting experimental X-ray intensities to an absolute scale. Acta Crystallogr. 1965, 9, 951–953. [Google Scholar] [CrossRef]
  24. Wilson, J.R. The structure of liquid metals and alloys. Metall. Rev. 1965, 10, 381–590. [Google Scholar] [CrossRef]
  25. Calderín, L.; González, D.J.; González, L.E.; López, J.M. Structural, dynamic, and electronic properties of liquid tin: An ab initio molecular dynamics study. J. Chem. Phys. 2008, 129, 194506. [Google Scholar] [CrossRef] [PubMed] [Green Version]
  26. Waseda, Y. The Structure of Non Crystalline Materials; McGraw-Hill: New York, NY, USA, 1980. [Google Scholar]
  27. Yakymovych, A.; Mudry, S.; Shtablavyi, I.; Ipser, H. Effect of nano Co reinforcements on the structure of the Sn-3.0Ag-0.5Cu solder in liquid and after reflow solid states. Mater. Chem. Phys. 2018, 181, 470–475. [Google Scholar] [CrossRef] [Green Version]
  28. Chen, S.-W.; Chiu, C.-N.; Hsieh, K.-C. Phase equilibria of the Sn-Ag-Cu-Ni quaternary system at 210 °C. J. Electron. Mater. 2007, 36, 197–206. [Google Scholar] [CrossRef]
  29. Schmetterer, C.; Flandorfer, H.; Richter, K.W.; Saeed, U.; Kauffman, M.; Roussel, P.; Ipser, H. A new investigation of the system Ni–Sn. Intermetallics 2007, 15, 869–884. [Google Scholar] [CrossRef]
  30. Vuorinen, V.; Yu, H.; Laurila, T.; Kivilahti, J.K. Formation of intermetallic compounds between liquid Sn and various CuNix metallizations. J. Electron. Mater. 2008, 37, 792–805. [Google Scholar] [CrossRef] [Green Version]
  31. Schmetterer, C.; Flandorfer, H.; Luef, C.; Kodentsov, A.; Ipser, H. Cu-Ni-Sn: A key system for lead-free soldering. J. Electron. Mater. 2009, 38, 10–24. [Google Scholar] [CrossRef]
Figure 1. Schematic representation of the study of the structure of melts.
Metals 13 01093 g001
Figure 2. Structure factors of liquid Sn, SAC305, and (SAC305)100−x(Ni)x alloys (a) with 0.5 wt.%Ni; (b) with 1.0 wt.%Ni; (c) with 2.0 wt.% Ni/—Sn. --- SAC305; --- (SAC305)100−x(Ni)x at Tm−55 K; --- (SAC305)100−x(Ni)x at Tm + 5 K).
Metals 13 01093 g002
Figure 3. Thermogram sections from DTA measurements of the (SAC305)100−x(nanoNi)x alloys where x = 0.5 wt.% (a), 1.0 wt.% (b), and 2.0 wt.% (c). (Black curves correspond to the heating and red curves correspond to the cooling; solid lines correspond to the first run and dashed lines correspond to the second run.)
Metals 13 01093 g003
Figure 4. SEM images of the of the (SAC305) 100−xNix 5 alloys with 0.5 wt.% Ni (a), 1.0 wt.% Ni (b) and 2.0 wt.% Ni (c).
Metals 13 01093 g004
Figure 5. XRD pattern of (SAC305)99.5Ni0.5 alloy after X-ray analysis in the liquid state (1—βSn; 2—Ag3Sn; 3—(Cu,Ni)6Sn5).
Metals 13 01093 g005
Table 1. Interatomic distances of the liquid (SAC305)100−x(Ni)x alloys.
Composition, wt.%T, Kr1, nmr2, nmr2/r1Zsym
SAC305Ni
99.50.55933.045.801.917.3
6533.155.921.888.7
99.01.06833.205.911.858.8
7433.195.931.868.8
98.02.07933.215.891.838.6
8533.165.931.888.7
Table 2. Summary of compositions and onset of melting and solidification temperatures (T°m and T°s).
Composition, wt.%Composition, at.%T°m, KT°s, K(T°mT°s), KSource
SAC305NiSAC305Ni
100.00.0100.00.0489.3 ± 0.5475.3 ± 0.614.0 ± 1.1[27]
99.50.599.01.0488.5485.6 ± 1.02.9 ± 1.0exp.
99.01.098.02.0488.5482.1 ± 3.56.4 ± 3.5exp.
98.02.096.04.0486.5480.1 ± 1.56.4 ± 1.5exp.
Table 3. SEM-EDX results of (SAC305)100−xNix samples after the investigations in the liquid state including the atomic percentage of the pure elements in the formed phases (BA1—(SAC305)99.5Ni0.5; BA2—(SAC305)99.0Ni1.0; BA1—(SAC305)98.0Ni2.0).
SampleSn PhaseAg-Sn Phase(Cu,Ni)Sn Phases
Sn
at. %
Ag
at. %
Sn
at. %
Ni
at. %
Cu
at. %
Sn
at. %
BA1βSn100Ag3Sn7426(Cu,Ni)6Sn53–941–4748–50
BA2βSn100Ag3Sn7624(Cu,Ni)6Sn5
(Ni,Cu)3Sn4
12–17
30–40
33–37
47–53
60–70
BA3βSn100Ag3Sn7426(Cu,Ni)6Sn5
(Ni,Cu)3Sn4
13–18
25–26
34–37
14–15
48–50
59–60
Disclaimer/Publisher’s Note: The statements, opinions and data contained in all publications are solely those of the individual author(s) and contributor(s) and not of MDPI and/or the editor(s). MDPI and/or the editor(s) disclaim responsibility for any injury to people or property resulting from any ideas, methods, instructions or products referred to in the content.

