Article

Phase-Field Simulation and Dendrite Evolution Analysis of Solidification Process for Cu-W Alloy Contact Materials under Arc Ablation

1
State Key Laboratory of Alternate Electrical Power System with Renewable Energy Sources, North China Electric Power University, Beijing 102206, China
2
School of Electrical Engineering, Shandong University, Jinan 250100, China
*
Author to whom correspondence should be addressed.
Metals 2024, 14(10), 1100; https://doi.org/10.3390/met14101100
Submission received: 29 July 2024 / Revised: 16 September 2024 / Accepted: 19 September 2024 / Published: 25 September 2024

Abstract

:
Cu-W alloys are widely used in high-voltage circuit breaker contacts due to their high resistance to arc ablation, but few studies have analyzed the microstructure of Cu-W alloys under arc ablation. This study applied a phase-field model based on the phase-field model developed by Karma and co-workers to the evolution of dendrite growth in the solidification process of Cu-W alloy under arc ablation. The process of columnar dendrite evolution during solidification was simulated, and the effect of the supercooling degree and anisotropic strength on the morphology of the dendrites during solidification was analyzed. The results show that the solid–liquid interface becomes unstable with the release of latent heat, and competitive growth between dendrites occurs with a large amount of solute discharge. In addition, when the supercooling degree is 289 K, the interface is located at a lower height of only 15 μm, and the growth rate is slow. At high anisotropy, the side branches of the dendrites are more fully developed and tertiary dendritic arms appear, leading to a decrease in the alloy’s relative density and poorer ablation resistance. In contrast, the main dendrites are more developed under high supercooling, which improves the density and ablation resistance of the material. The results in this paper may provide a novel way to study the microstructure evolution and material property changes in Cu-W alloys under the high temperature of the arc for high-voltage circuit breaker contacts.

1. Introduction

As the voltage level of China’s ultra-high-voltage transmission system increases, the performance of high-voltage circuit breaker contact materials demands higher requirements, and there is an urgent need to clarify the change in alloys’ microscopic properties during contact arc ignition [1]. Cu-W alloy contact materials have been widely used in high-voltage circuit breakers due to their great electrical and thermal conductivity and excellent resistance to ablation. Nevertheless, the contacts often face the problem of arc ablation, caused by the opening and breaking of the contact when working, which seriously degrades the performance of Cu-W alloy contacts and even affects the safe and stable operation of the whole power system [2].
The extreme heat of the combustion arc causes the material’s surface to melt and re-solidify, resulting in dramatic changes in the shape and properties of the solidified material [3,4,5]. As the solidification and phase transition of Cu-W alloy are completed in an extremely short time due to the cooling effect, these processes involve numerous aspects of heat, mass, and momentum transfer simultaneously [6]. At present, the temperature equivalence method is mainly used by scholars at home and abroad to study the ablation of alloy contacts. Liu et al. analyzed the arc thermal effect based on the MHD model using an equivalent heat source and equated the arc’s thermal effect by calculating the temperature distribution with an error within 0.5%, which verified the accuracy of the temperature equivalence through experiments [7]. Khakpour et al. investigated the effect of temperature on electrical characteristics, which included the voltage and power of a free-burning arc, and modified the physical model of the arc to determine the effect of temperature variation on the electrical characteristics of the arc [8]. Geng et al. used equivalent heat-dissipation coefficients to comprehensively characterize the changes in heat dissipation during the additive manufacturing process; combined with Rosenthal’s analytical solution, a theoretical model was developed to optimize the inter-channel temperature and heat input for each layer deposition to achieve stable additive manufacturing [9]. The above studies have provided extensive information on the arc and temperature equivalence; however, many studies have not involved Cu-W alloy materials and have lacked experiments on the changes in the microstructure of the combustion arc.
The refractory nature of Cu-W alloys makes it difficult to analyze the microstructure and morphology of Cu-W alloys during solidification with traditional experimental methods, and it is even more difficult to observe the growth of dendrites in real-time in a short time and on a small scale [10]. Therefore, it is particularly necessary to study the dendritic growth process of Cu-W alloy solidification using appropriate methods. With the rapid development of computer technology, mature numerical simulation methods have gradually gained popularity among many scholars for their unique advantages. In mesoscopic simulation studies of metal solidification, the main methods include the cellular automaton method, the Monte Carlo method, and the phase-field method [11]. Among these, the phase-field method has been widely used to greatly reduce the computational effort of simulation and improve the accuracy of simulation through the introduction of sequential coefficients. Karma and others eliminated the influence of the interface solute segregation anomaly by introducing the antitrapping solute trapping term, which has been widely used to simulate the evolution process of dendrites [12]. Gong et al. studied the effect of different degrees of supercooling on dendritic growth during the cooling process of Al-Cu alloys using the adaptive finite element method and tracking algorithm and found that increasing supercooling accelerates dendritic growth [13]. Zhao et al. analyzed the effects of thermal disturbance, supercooling, and growth orientation angle on the growth morphology at the solid–liquid interface of dendrites, suggesting that solute redistribution leads to the formation of multilevel solute segregation, while the dendritic growth rate increases with temperature gradient and solidification rate [14]. Zhan et al. investigated the effect of anisotropy on grain growth morphology; they found that the branching of dendritic crystals tends to be uniform and that it is difficult to distinguish the main and side branches when the anisotropy is small, but as the anisotropy increases, the branching becomes obvious [15]. The above research mainly analyzed the evolution of dendritic morphology in alloy solidification from the aspects of supercooling, anisotropy, and thermal disturbance. This is because supercooling is an integral factor in the study of the microstructure of materials during solidification, as it is the main driver of all dynamic and thermodynamic processes during dendritic growth [16]. There is a close relationship between the magnitude of the anisotropy coefficient during alloy solidification and the surface tension, interfacial thickness, and interfacial dynamics, which influence the complexity of the dendritic morphology [17]. Therefore, further research on the effect of supercooling and the anisotropy coefficient on dendritic growth is of great significance for analyzing the microstructure evolution characteristics in Cu-W alloy solidification and more intuitively analyzing their effect on alloy solute distribution. Meanwhile, the phase-field model of Karma and co-workers has been widely used in the study of dendritic growth evolution during solidification, though material studies have mainly focused on Ni and Al. There is relatively little research on dendrites in Cu-W alloys and a lack of phase-field simulation studies on the effects of anisotropy and supercooling on dendritic morphology and evolution processes.
Therefore, the research in this paper combines the phase-field method with temperature equivalence to investigate the microstructure formation during the solidification process of Cu-W alloy under arc heating. The evolution of dendrites at different timesteps was simulated to further study the effect of anisotropy coefficient and supercooling degree on the morphology of dendritic growth of Cu-W alloys, in addition to further analyzing the effects of supercooling degree on the solute distribution of Cu-W alloys. This study opens up new avenues for researching the dendritic evolution and morphological characteristics of Cu-W alloy during the solidification process of circuit breaker contacts.

2. Materials and Methods

2.1. Phase-Field Model of Cu-W Alloy

To simulate the microstructure changes during the solidification process of Cu-W alloy under a high-temperature arc ablation, the study uses the phase-field method and temperature equivalence method based on the binary alloy phase-field model established by Karma et al. [18]. The study focuses on the edge region of melt pool pits with obvious morphology after arc ablation. The Cu-W alloy phase-field model consists of two coupled equations, namely the phase-field control equation controlling the evolution of phase order parameter and the solute field control equation controlling solute diffusion. The dimensionless form of the phase-field control equation is shown in Equation (1). The evolution of dendrites can be characterized by the non-conserved order parameter φ, which takes values of +1 and −1 in the solid and liquid phases, respectively, and smoothly varies between −1 and +1 at the solid–liquid interface.
τ 0 [ 1 ( 1 k ) y V p t l T ] φ t = W 2 2 φ + φ φ 3 λ 1 k g ~ ( φ ) ( e u 1 + ( 1 k ) y V p t l T )
where τ0 is the relaxation time, lT = |m|c0(1 − k)/G is the thermal length, k = cs/cl is the solute partition coefficient, y represents the growth direction of columnar dendrites, t stands for time, and Vp and G, respectively, represent the solidification rate and temperature gradient along the dendrite growth direction; the coupling coefficient is λ = LΔT0/2HTM, where ΔT0 is the cooling range of the liquid phase, and ΔT = Tm − T is the supercooling degree. The phase-field parameters required for the simulation process involve the characteristic length W, relaxation time τ0, and the coupling constant λ, which are related through the following equation:
τ 0 = a 2 λ W 0 2 / D
λ = a 1 W / d 0
d 0 = Γ | m | c 0 1 k 1
where a2 = 0.6267, D is the solute diffusion coefficient, a1 = 0.8839, d0 is the capillary length, Γ is the Gibbs–Thomson coefficient, and m is the slope of the liquidus line of the alloy.
In contrast to the analysis focusing on the variation in order parameter in the aforementioned phase-field control equation, the solute field control equation primarily considers the influence of solute diffusion on the solidification process. In this paper, the thin-interface limit method is utilized to define the solute evolution by introducing the conserved order parameter c [19]. To more accurately describe the solute field, the dimensionless solute supersaturation U is introduced, expressed as:
U = ( e u 1 ) ( 1 k )
where u is a dimensionless variable and its expression is:
u = l n 2 c / c l 0 ( 1 + k ( 1 k ) h ( φ )
where c represents the actual solute concentration, c l 0 is the initial concentration of the solution, and h(φ) = φ represents the latent heat generated at the interface.
The solute field control equation is shown as follows:
1 + k 2 1 k 2 φ U t = D q ( φ ) U j a t + 1 + ( 1 k ) U 2 φ t .
The term j a t represents the anti-solute trapping term, and its expression is:
j a t = a W ( 1 k ) c l 0 e u φ t φ φ
where a = 1/2 2   , W represents the interface anisotropy, and the interpolation function expression used to describe the properties of the solid–liquid interface is as follows:
q ˜ ( φ ) = q ( φ ) 2 1 + k ( 1 k ) h ( φ ) .
Additionally, considering the interface anisotropy of the alloy as τ = τ0a2s(θ), W = W0as(θ), where W0 is the thickness of the solid–liquid interface. Combining the different crystal structures of Cu and W, the anisotropy of Cu-W alloy in two-dimensional space can be expressed as as(θ) = 1 + εcos4θ, where ε is the anisotropy coefficient, and θ = arctan(yφ/xφ) is the angle between the normal direction of the phase-field interface and the x axis. The unit normal vector at the interface is represented as:
n = φ | φ | .
In the directional solidification process of alloys, a temperature gradient exists along the solidification direction. The temperature freezing approximation assumes that the temperature gradient is constant, simplifying the influence of the temperature gradient during solidification. In this regard, this paper approximates the temperature field T(y,t) to follow the temperature freezing approximation, defined as:
T ( y , t ) = T 0 + G ( y V p t )
where T0 is the reference temperature. G = 5 K/mm. Vp = 0.2 mm/s. The main reasons for using this method include the following: (I) The solute diffuses much faster in the liquid phase than in the solid phase, which can be ignored. (II) It is assumed that the temperature gradient is the same for the solid phase and the liquid phase, due to the small difference in thermal conductivity between the two of them [20].

2.2. Cu-W Alloy Phase-Field Model Calculation Method

This paper uses the finite difference method to discretize the phase-field equation. Considering the solute field equation as a conservation equation and for stability in solving, the finite volume method is adopted for discretization. The discretization of the phase-field variable φ is shown as follows [21]:
φ x ( i , j ) = φ i + 1 , j φ i 1 , j 2 Δ x + o Δ x 2
2 φ x 2 ( i , j ) = φ i + 1 , j 2 φ i , j + φ i 1 , j ( Δ x ) 2 + ο ( Δ x 2 )
2 φ x y ( i , j ) = φ i + 1 , j + 1 φ i 1 , j + 1 φ i + 1 , j 1 + φ i 1 , j 1 4 ( Δ x ) 2 + ο ( Δ x 2 ) .
The solute field variable U is solved by using the finite volume method. DERX(i ± 1/2,j) and DERY(i ± 1/2,j) represent the discretized derivatives of U for x and y, respectively. The solution is obtained at the centers of the four sides of the finite volume, as shown below [22]:
D E R X ( i + 1 / 2 , j ) = ( U n ( i + 1 , j ) U n ( i , j ) ) / Δ x
D E R X ( i 1 / 2 , j ) = ( U n ( i , j ) U n ( i 1 , j ) ) / Δ x
D E R Y ( i + 1 / 2 , j ) = ( U n ( i + 1 , j + 1 ) + U n ( i , j + 1 ) + U n ( i , j ) + U n ( i + 1 , j ) ) / 4 Δ x ( U n ( i + 1 , j ) + U n ( i , j ) + U n ( i , j 1 ) + U n ( i + 1 , j 1 ) ) / 4 Δ x
D E R Y ( i 1 / 2 , j ) = ( U n ( i , j + 1 ) + U n ( i 1 , j + 1 ) + U n ( i 1 , j ) + U n ( i , j ) ) / 4 Δ x ( U n ( i , j ) + U n ( i 1 , j ) + U n ( i 1 , j 1 ) + U n ( i , j ) ) / 4 Δ x .

3. Dendritic Morphology during the Solidification Process of Cu-W Alloy

Cu-W alloy contacts melt and solidify under the high temperature of the arc ablation and the microstructure of the material changes significantly. Among these changes, the variation in the dendritic morphology and the volume fraction of the solid phase determines the material properties. When the dendritic growth is denser with fewer side branches, the resulting microstructure after alloy solidification exhibits better erosion resistance. In contrast, the evolution of the dendritic growth leading to secondary or even multiple dendritic arms can significantly affect the properties of the alloy material and may even shorten the contact’s lifespan. This section analyses the relevant computational parameters for Cu-W alloy and simulates the dendritic evolution during the re-solidification process of the alloy under the high temperature of arc ablation.

3.1. Parameters of Cu-W Alloy Solidification Computation

In this study, the alloy material CuW80, commonly used for high-voltage circuit breaker contacts, is selected as the research object. Based on the properties of the Cu and W elements, and according to the Cu-W alloy phase diagram in Figure 1 [23,24], it can be seen that the melting points and boiling points of copper and tungsten elements differ greatly, and the two neither dissolve with each other nor form intermetallic compounds. Thus, the elements that make up the Cu-W alloy exist in independent phases. The Cu-W alloy combines the excellent properties of Cu and W elements, which not only shows the excellent electrical and thermal conductivity of Cu elements but also has the ultra-high melting and boiling points, high hardness, and low thermal expansion coefficient of W elements, especially the resistance to high-temperature oxidation.
Based on these characteristics, the alloy thermophysical parameters involved in the simulation and calculation process are shown in Table 1.
Periodic boundary conditions are used in the horizontal direction of the computational domain and the zero-flux boundary conditions are applied in the vertical direction. The simulation domain is divided into 300 mm × 300 mm with a spatial step size of Δx = Δy = 0.8 W. The timestep size is Δt = 0.0014 and W/d0 = 20.

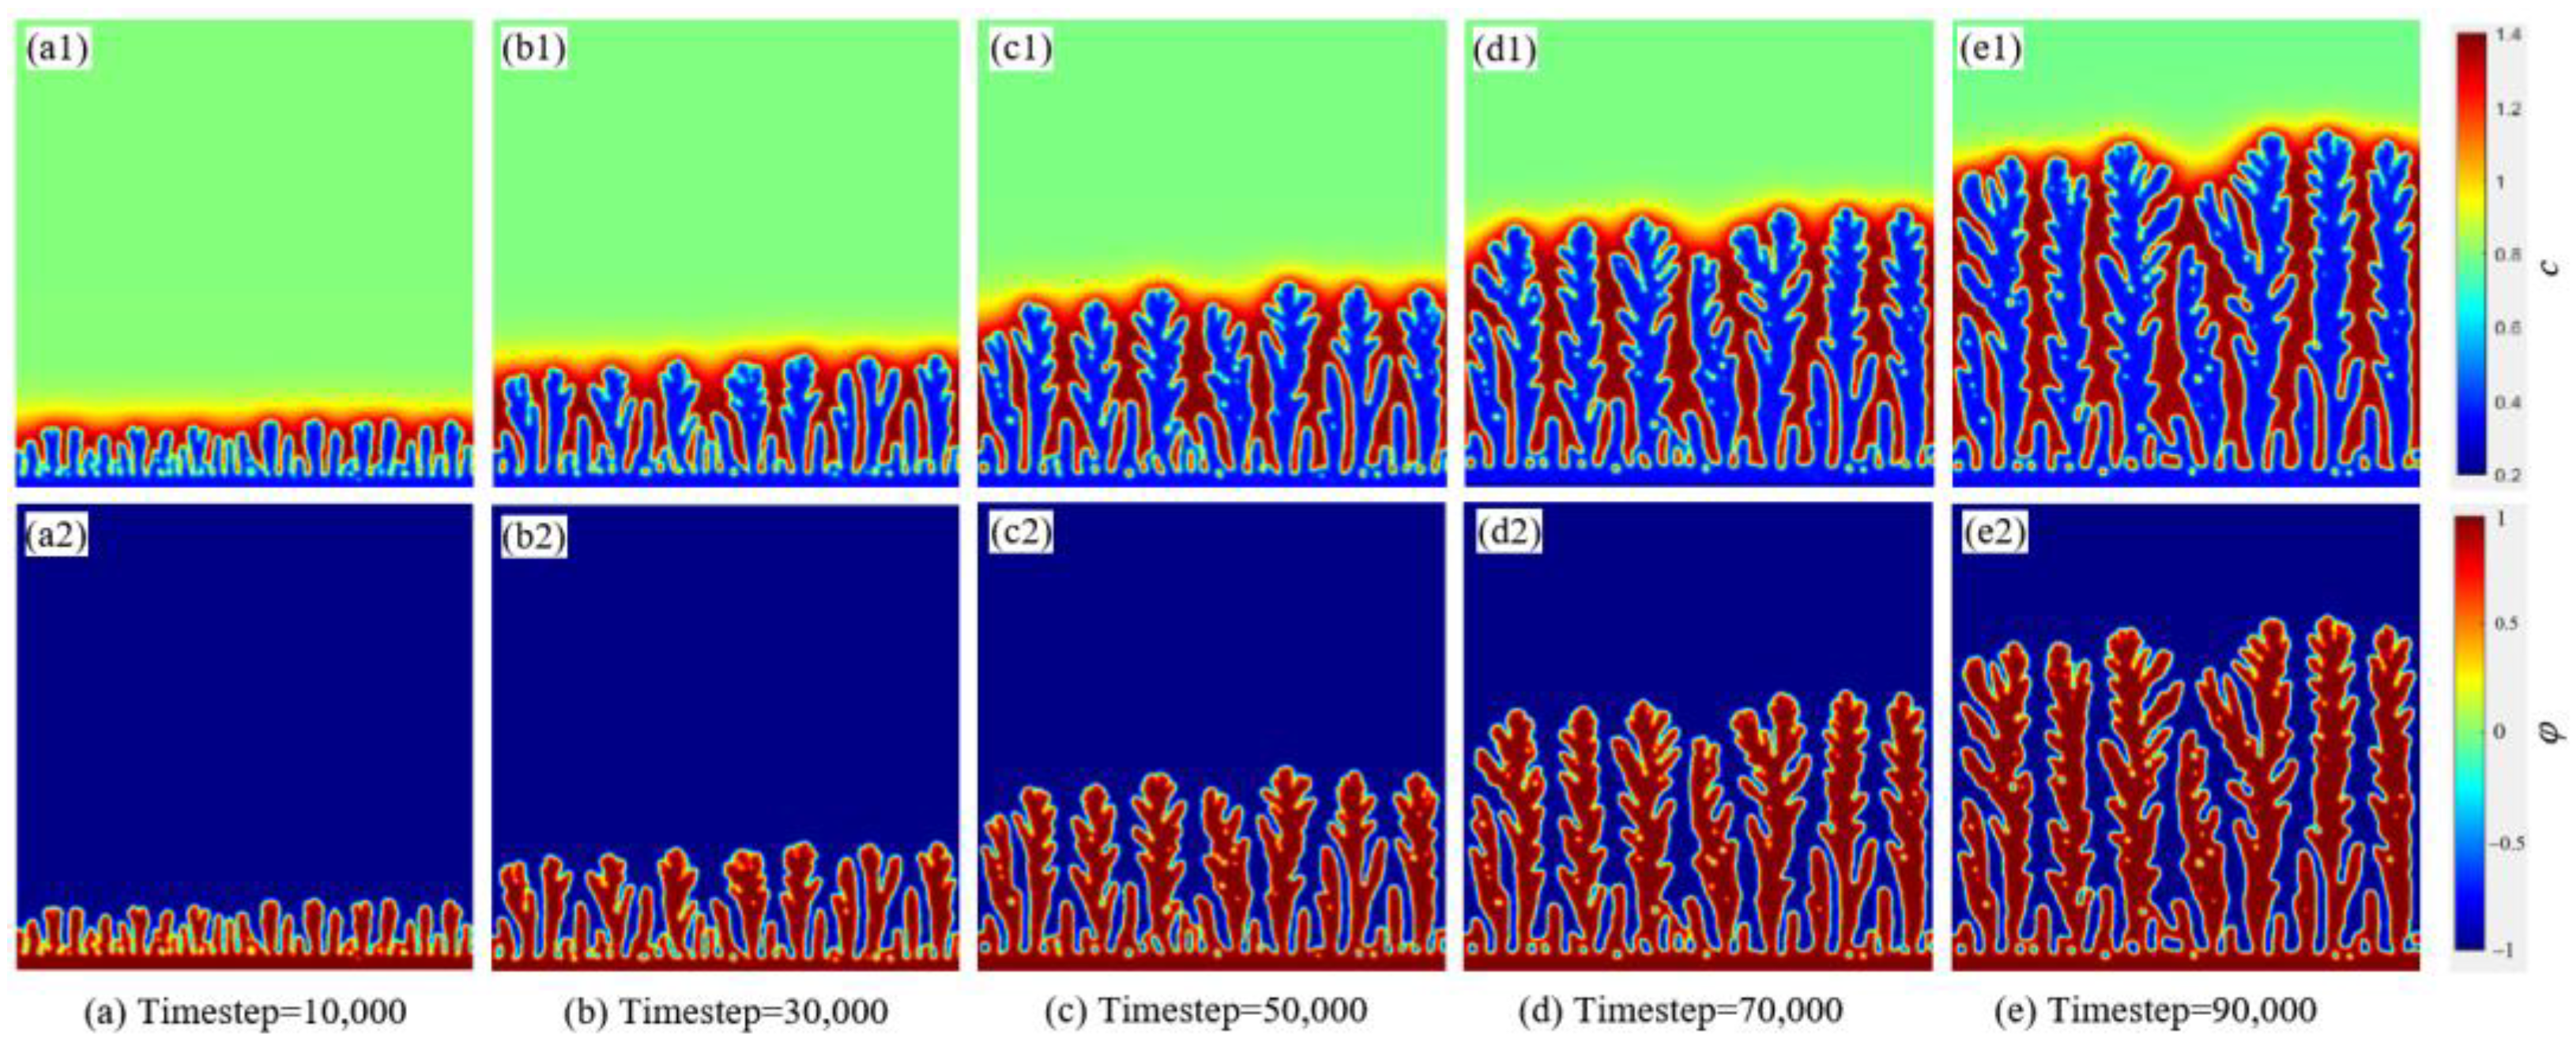
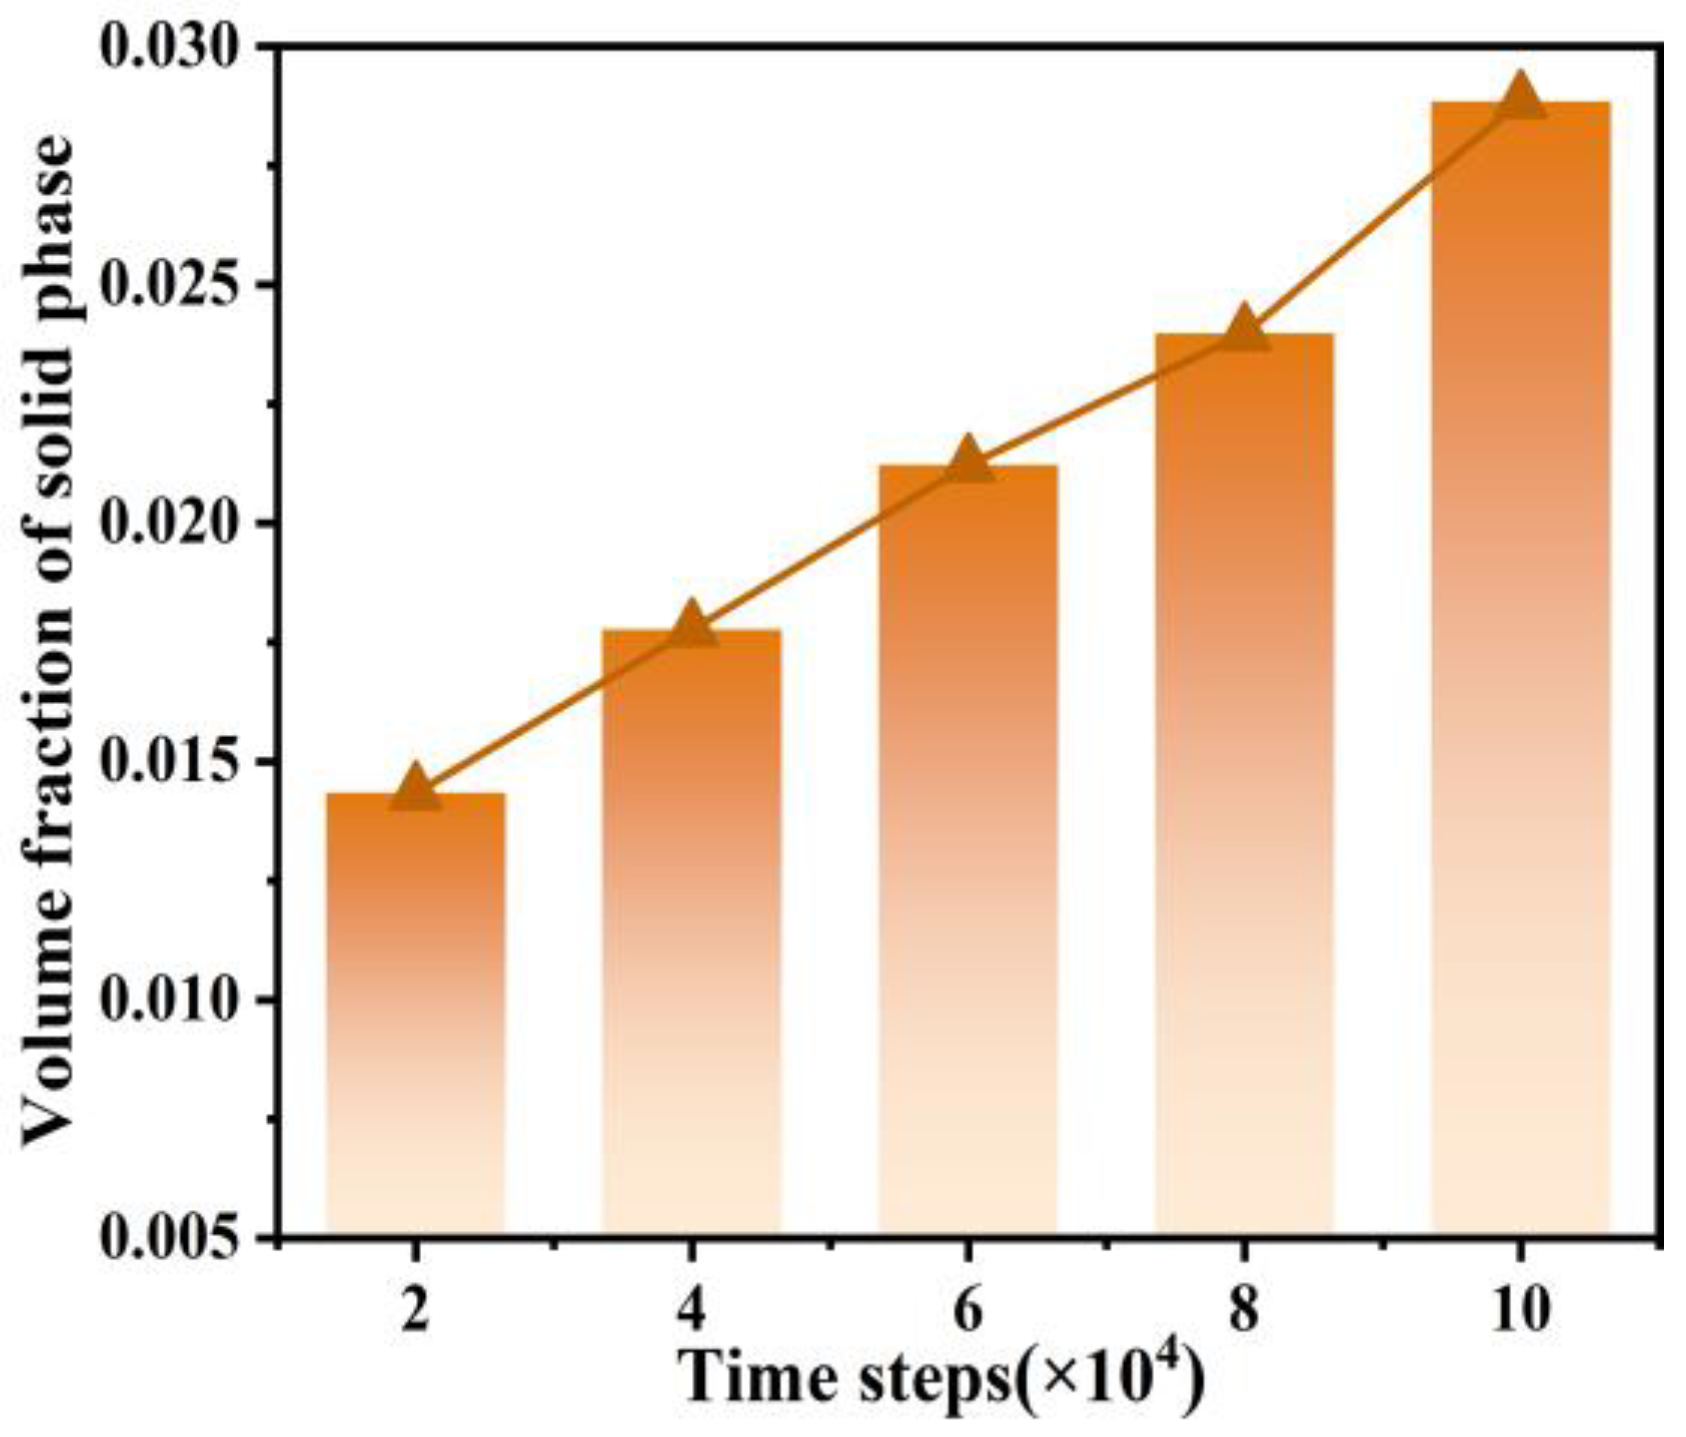
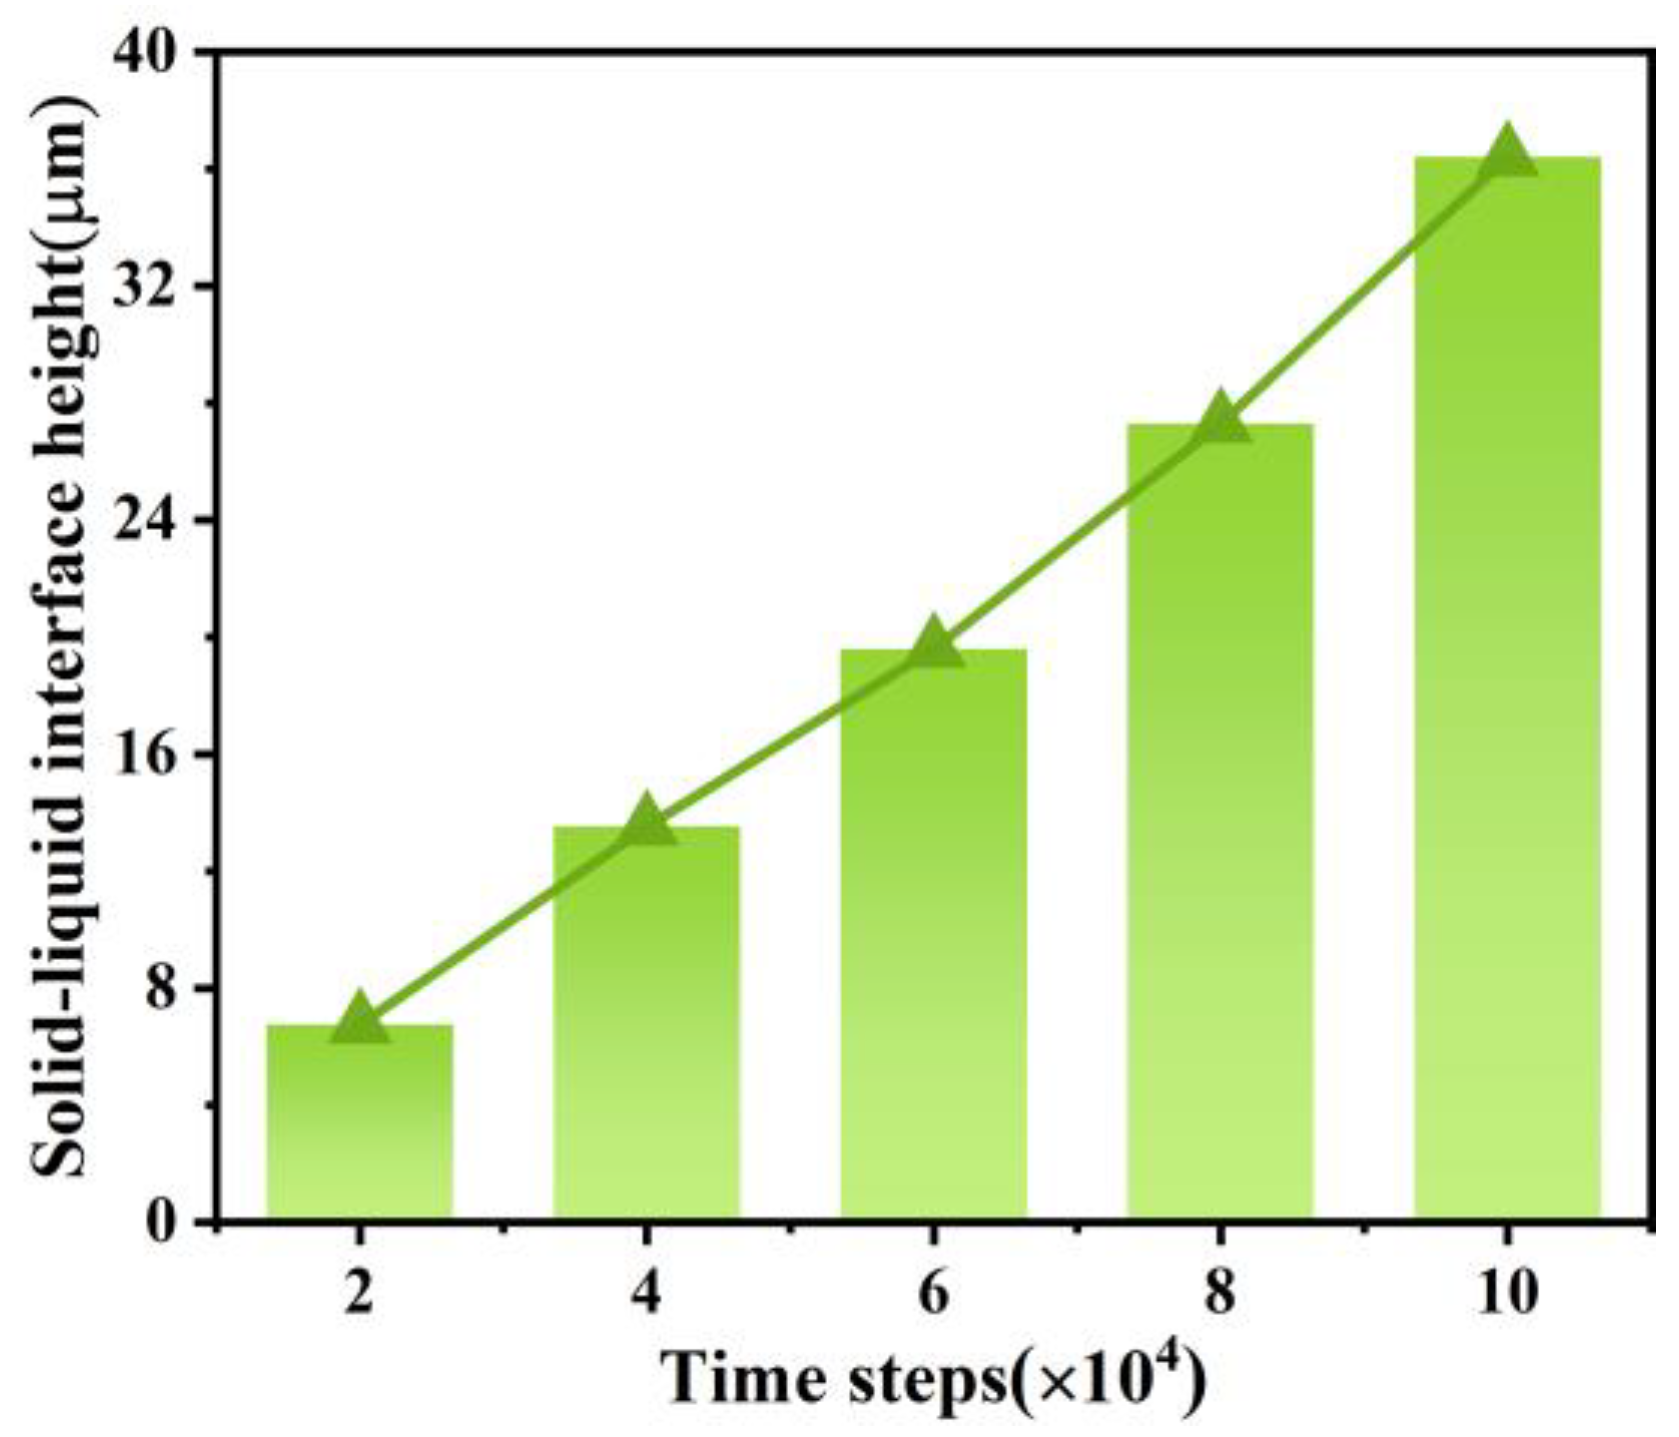
3.2. The Dendritic Morphology at Different Timesteps

The evolution of the dendritic microstructure during the solidification process of the Cu-W alloy under different timesteps is depicted in Figure 2, at which the dimensionless supercooling degree Δ is 0.45 and the anisotropy coefficient ε is 0.03. In Figure 2, c is the solute concentration, which simulates the evolution of the solute field of Cu-W alloys. φ is the ordinate coefficient, which simulates the growth process of the dendrites. It can be observed that the dendritic structure at all stages of Figure 2a–e exhibits a columnar morphology with secondary dendritic arms, which is due to the outward emission of heat released during the solidification process. With increasing solidification time, the initially random nucleation becomes unstable and starts to evolve. The initial growth shape of the dendrites changes from cellular to dendritic with side branches, and the spacing between the main dendrites becomes smaller, finally evolving into the morphology shown in Figure 2(b1). At this point, the solid–liquid interface remains relatively stable with no significant competition observed, while the dendrite spacing becomes larger and the solute enrichment occurs at the tip. However, the solid–liquid interface becomes unstable over time, leading to the emergence of the secondary dendrites in Figure 2(c1). The primary dendrite arms develop well and become more robust during the growth process, shown in Figure 2(c1,d1). The competition between the secondary branch dendrites becomes more intense, leaving some branch crystals poorly developed in the early stages. During this competition, many dendrites stop evolving, and only a small number of dendrites continue to grow.
In addition, the dendrites release a large amount of heat along the crystal axis when the alloy solidifies, which leads to the faster growth of the tip of the dendrites. Consequently, as shown in Figure 2(c1), the primary branches and the dendritic morphology are noticeable. In contrast, it can be seen from Figure 2(d1,d2) that the growth rate along the axial direction is significantly faster than that in other directions. The reason for this phenomenon is that the grains have a larger temperature gradient along the axial line than in other directions during nucleation and growth, causing the dendrites to grow continuously towards the front along the grain axis.
Further, the morphology and growth rate of the dendrites are analyzed by calculating the change in the solid-phase volume fraction of the dendrites. Figure 3 shows the evolution of the solid-phase volume fraction overtime during the dendritic evolution process, when ε = 0.03 and Δ = 0.45. It can be observed that as the number of timesteps increases, the proportion of the solid phase in dendrites gradually increases. However, the low solid-phase volume fraction of the dendrites in this part indicates the existence of a distinct transition region during the dendritic evolution, where the phase-field parameter φ is less than 1.
Figure 4 illustrates the change in solid–liquid interfacial position at different timesteps. It can be observed that the interface position increases proportionally with the evolution time, showing no significant fluctuations.
In addition, the dendrite morphology of the Cu-W alloy during solidification is based on the Figure 8 in reference [27]. It can be seen that the middle part of the dendrite morphology of the Cu-W alloy has more obvious main dendrite arms and the side branches are more complex. Except for the above results, there are few studies on the dendrite changes in the Cu-W alloy. There is a certain discrepancy between the experiment and the simulation in this paper of the growth of dendrites. However, the overall morphology of the experiment and simulation is similar.

4. Analysis of Influencing Factors on Dendritic Morphology of Cu-W Alloy

The growth and morphology changes in dendrites during the solidification process of alloys are influenced by both the supercooling degree and the anisotropy coefficient. When the melt supercooling degree of Cu-W alloy becomes larger, the re-solidification speed of the contact molten part increases. This is conducive to the formation of a higher density of the organization, and the mechanical properties and ablation resistance of the material can be improved. In contrast, the dendrite morphology becomes more complicated with the increase in the anisotropy coefficient. It can increase the dendrite spacing, which is not conducive to the formation of dense organization. The growth rate of the dendrites slows down. Therefore, in this section, the evolution of the dendrites and solute distribution during the solidification process of the Cu-W alloy is investigated from the aspects of the supercooling degree and anisotropy.

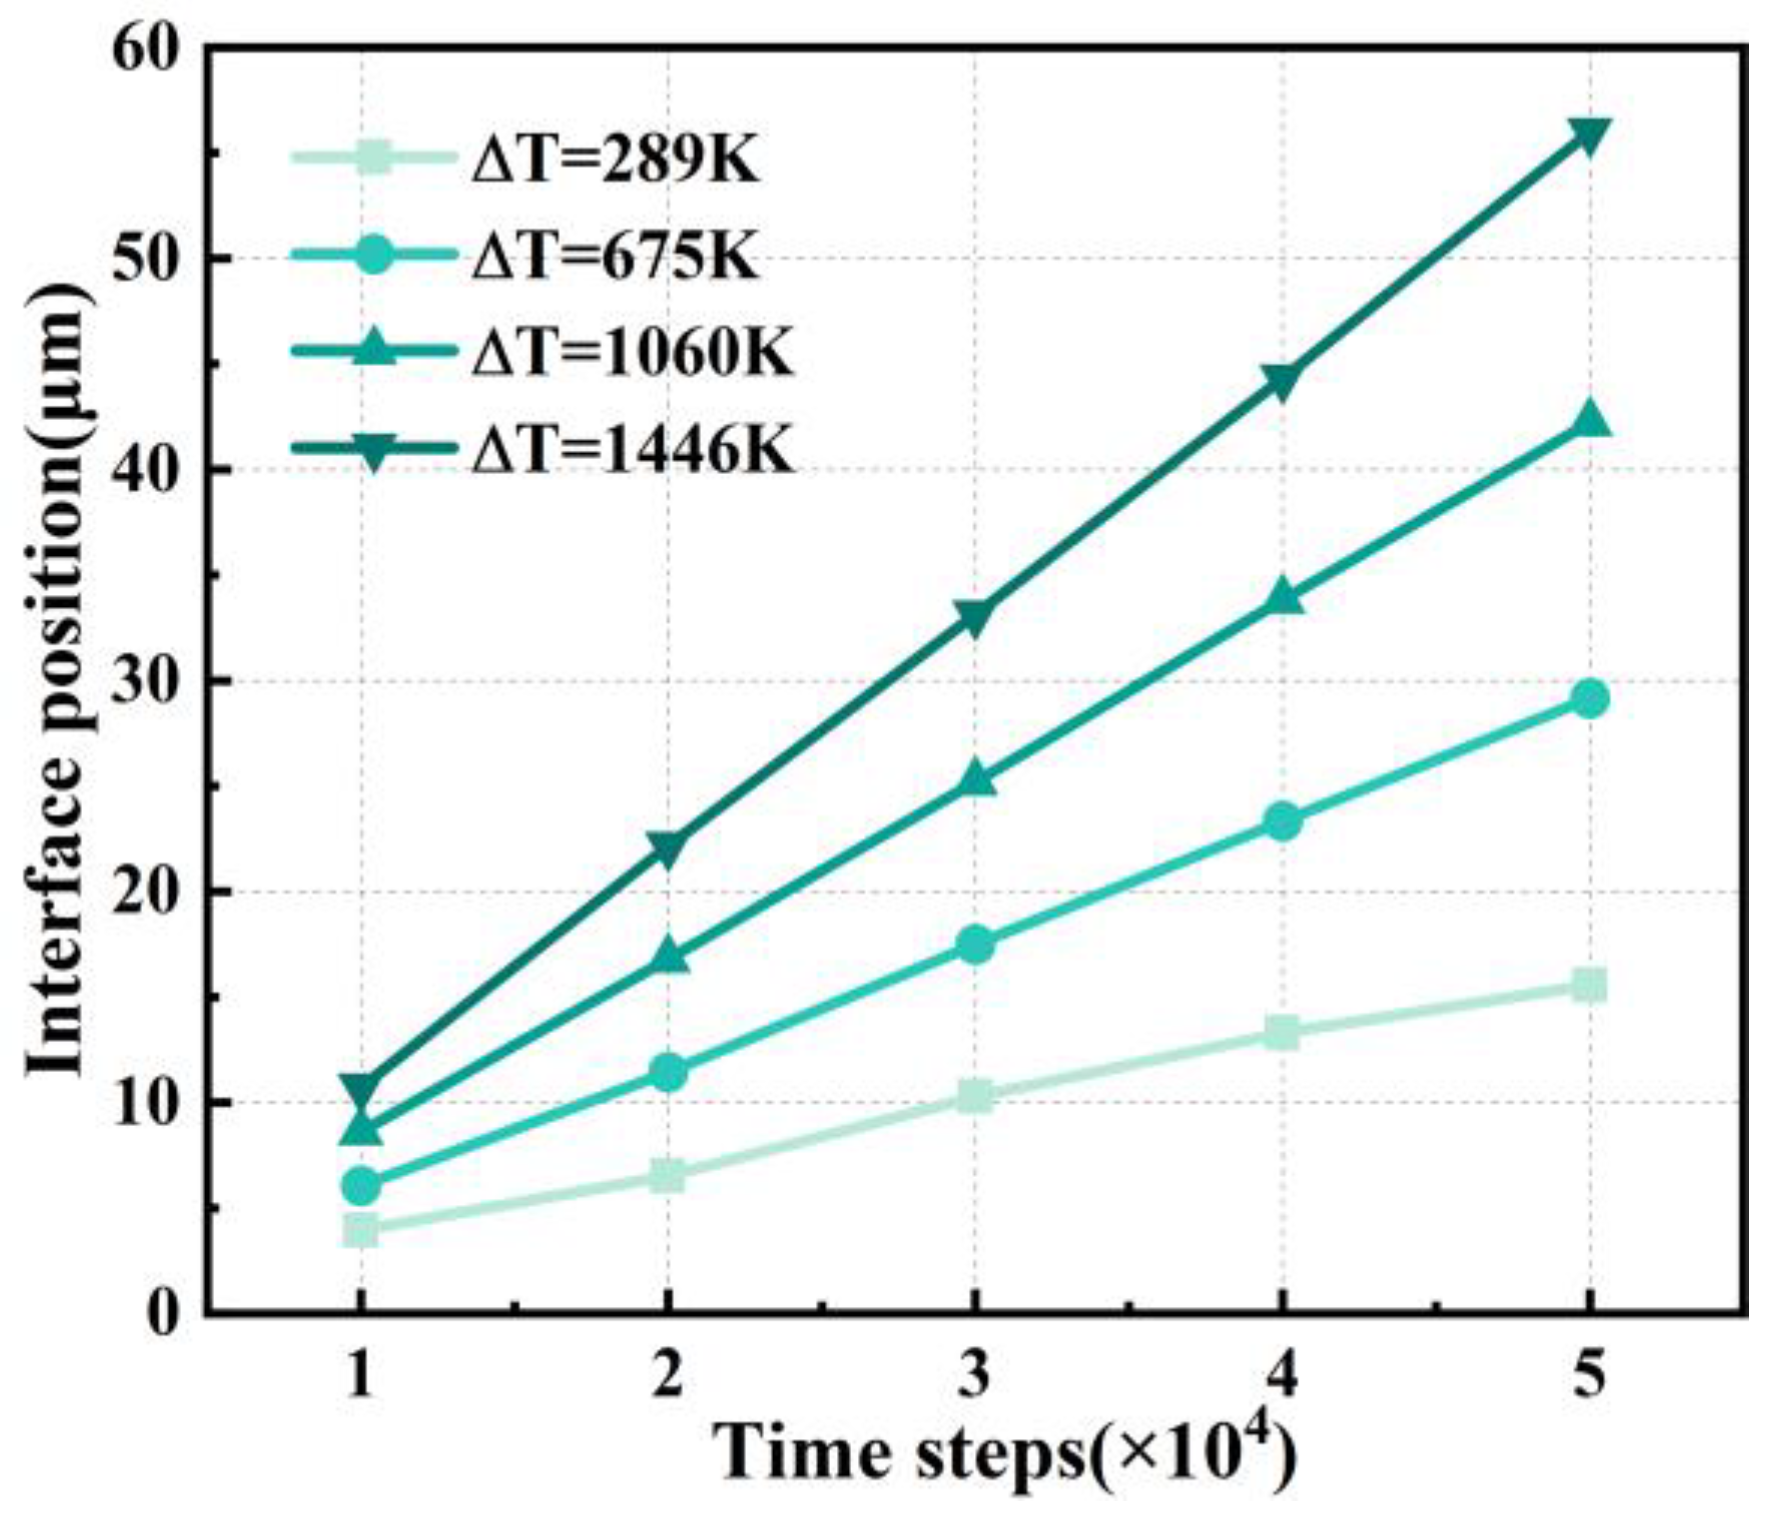
4.1. Effect of Supercooling on Dendritic Morphology

The effect of different supercooling degrees on the dendritic growth morphology of the Cu-W alloy is successively analyzed by controlling the simulation timestep = 70,000, ε = 0.05, and ensuring that the other parameters remain constant. The simulation results are presented in Figure 5.
From Figure 5, it can be observed that the main dendrites are small and elongated at a low supercooling degree. This means that the growth rate of dendrites is slow and the liquid phase is large. Additionally, based on the dendritic morphology, it can be seen from Figure 5(a1) that the influence of anisotropy on the growth process is not significant for the grains under a low supercooling degree. The morphology of fully grown grains is not typical dendritic but rather belongs to a coarse and single type, with a relatively stable solid–liquid interface. As the supercooling further increases, the anisotropic growth tendency of grains becomes significantly enhanced. The histomorphology shown in Figure 5(b1) is a typical columnar dendritic morphology with the main dendritic arms becoming thick. At this moment, the fully grown dendrites occupy most of the space in the calculation domain. Their growth rate is significantly accelerated and the solid–liquid interface is unstable. When the supercooling degree increases further, the simulation results in Figure 5(d1) show that the main dendrite arms are thick and smooth. The number of side branches is close to 0. In addition to facilitating the fastest growth rate of dendrites, the area of fully grown dendrites occupies nearly 98% of the calculation area. This indicates that excessive supercooling can lead to instability at some interfaces. The supercooling degree makes the dendritic morphology complex and determines the speed of dendritic growth.
The morphological changes in the dendrites cannot be analyzed only by the proportion of the solid phase. However, the dynamic evolution of dendrites can be reflected by the distribution of alloy solutes, which is greatly influenced by supercooling. As shown in Figure 5(a2), the growth rate of dendrites is slower at lower supercooling degrees, and the solute redistribution ability is worse. As shown in Figure 5(c2,d2), with the increase in supercooling, the dendrites grow rapidly along the direction of the crystal axis, and the solute distribution changes. The reason for the presence of a large amount of solute near the tip of the dendrite at this moment is that the diffusion rate of solute is much smaller than the growth rate of dendrite. To further analyze the dendritic growth, quantitative analysis is conducted from two aspects, including the volume fraction of the solid phase and the position of the solid–liquid interface. Figure 6 illustrates the evolution of the solid-phase volume fraction for four different dimensionless supercooling degrees during solidification. It can be observed that the volume fraction of the solid phase in the columnar dendrites increases proportionally with the increase in supercooling. When the supercooling is 0.15 and the timestep is 45,000, the volume fraction of the solid phase remains within 2%. This indicates the inhibition of dendrite growth and low solid-phase conversion. When the supercooling is 0.55 and the timestep is 45,000, the volume fraction of the solid phase is 15%. The morphology of columnar dendrites matches the actual variation well [28].
In addition, the degree of supercooling controls the supercooling state at the solid–liquid interface front and determines the state of the dendrite growth. The higher supercooling tends to produce a stronger solidification drive, which accelerates the rate of alloy solidification and dendrite tip growth, ultimately resulting in an elevated solid–liquid interface position. As shown in Figure 7, the trend in the solid–liquid interface position change is similar to the volume fraction of the solid phase. When ΔT = 1446 K, the interface position reaches a maximum of 56 μm, which is 41 μm higher than that at ΔT = 289 K. It suggests that the dendritic growth rate determines the interfacial position and further confirms the promoting effect of supercooling on the dendritic growth rate.

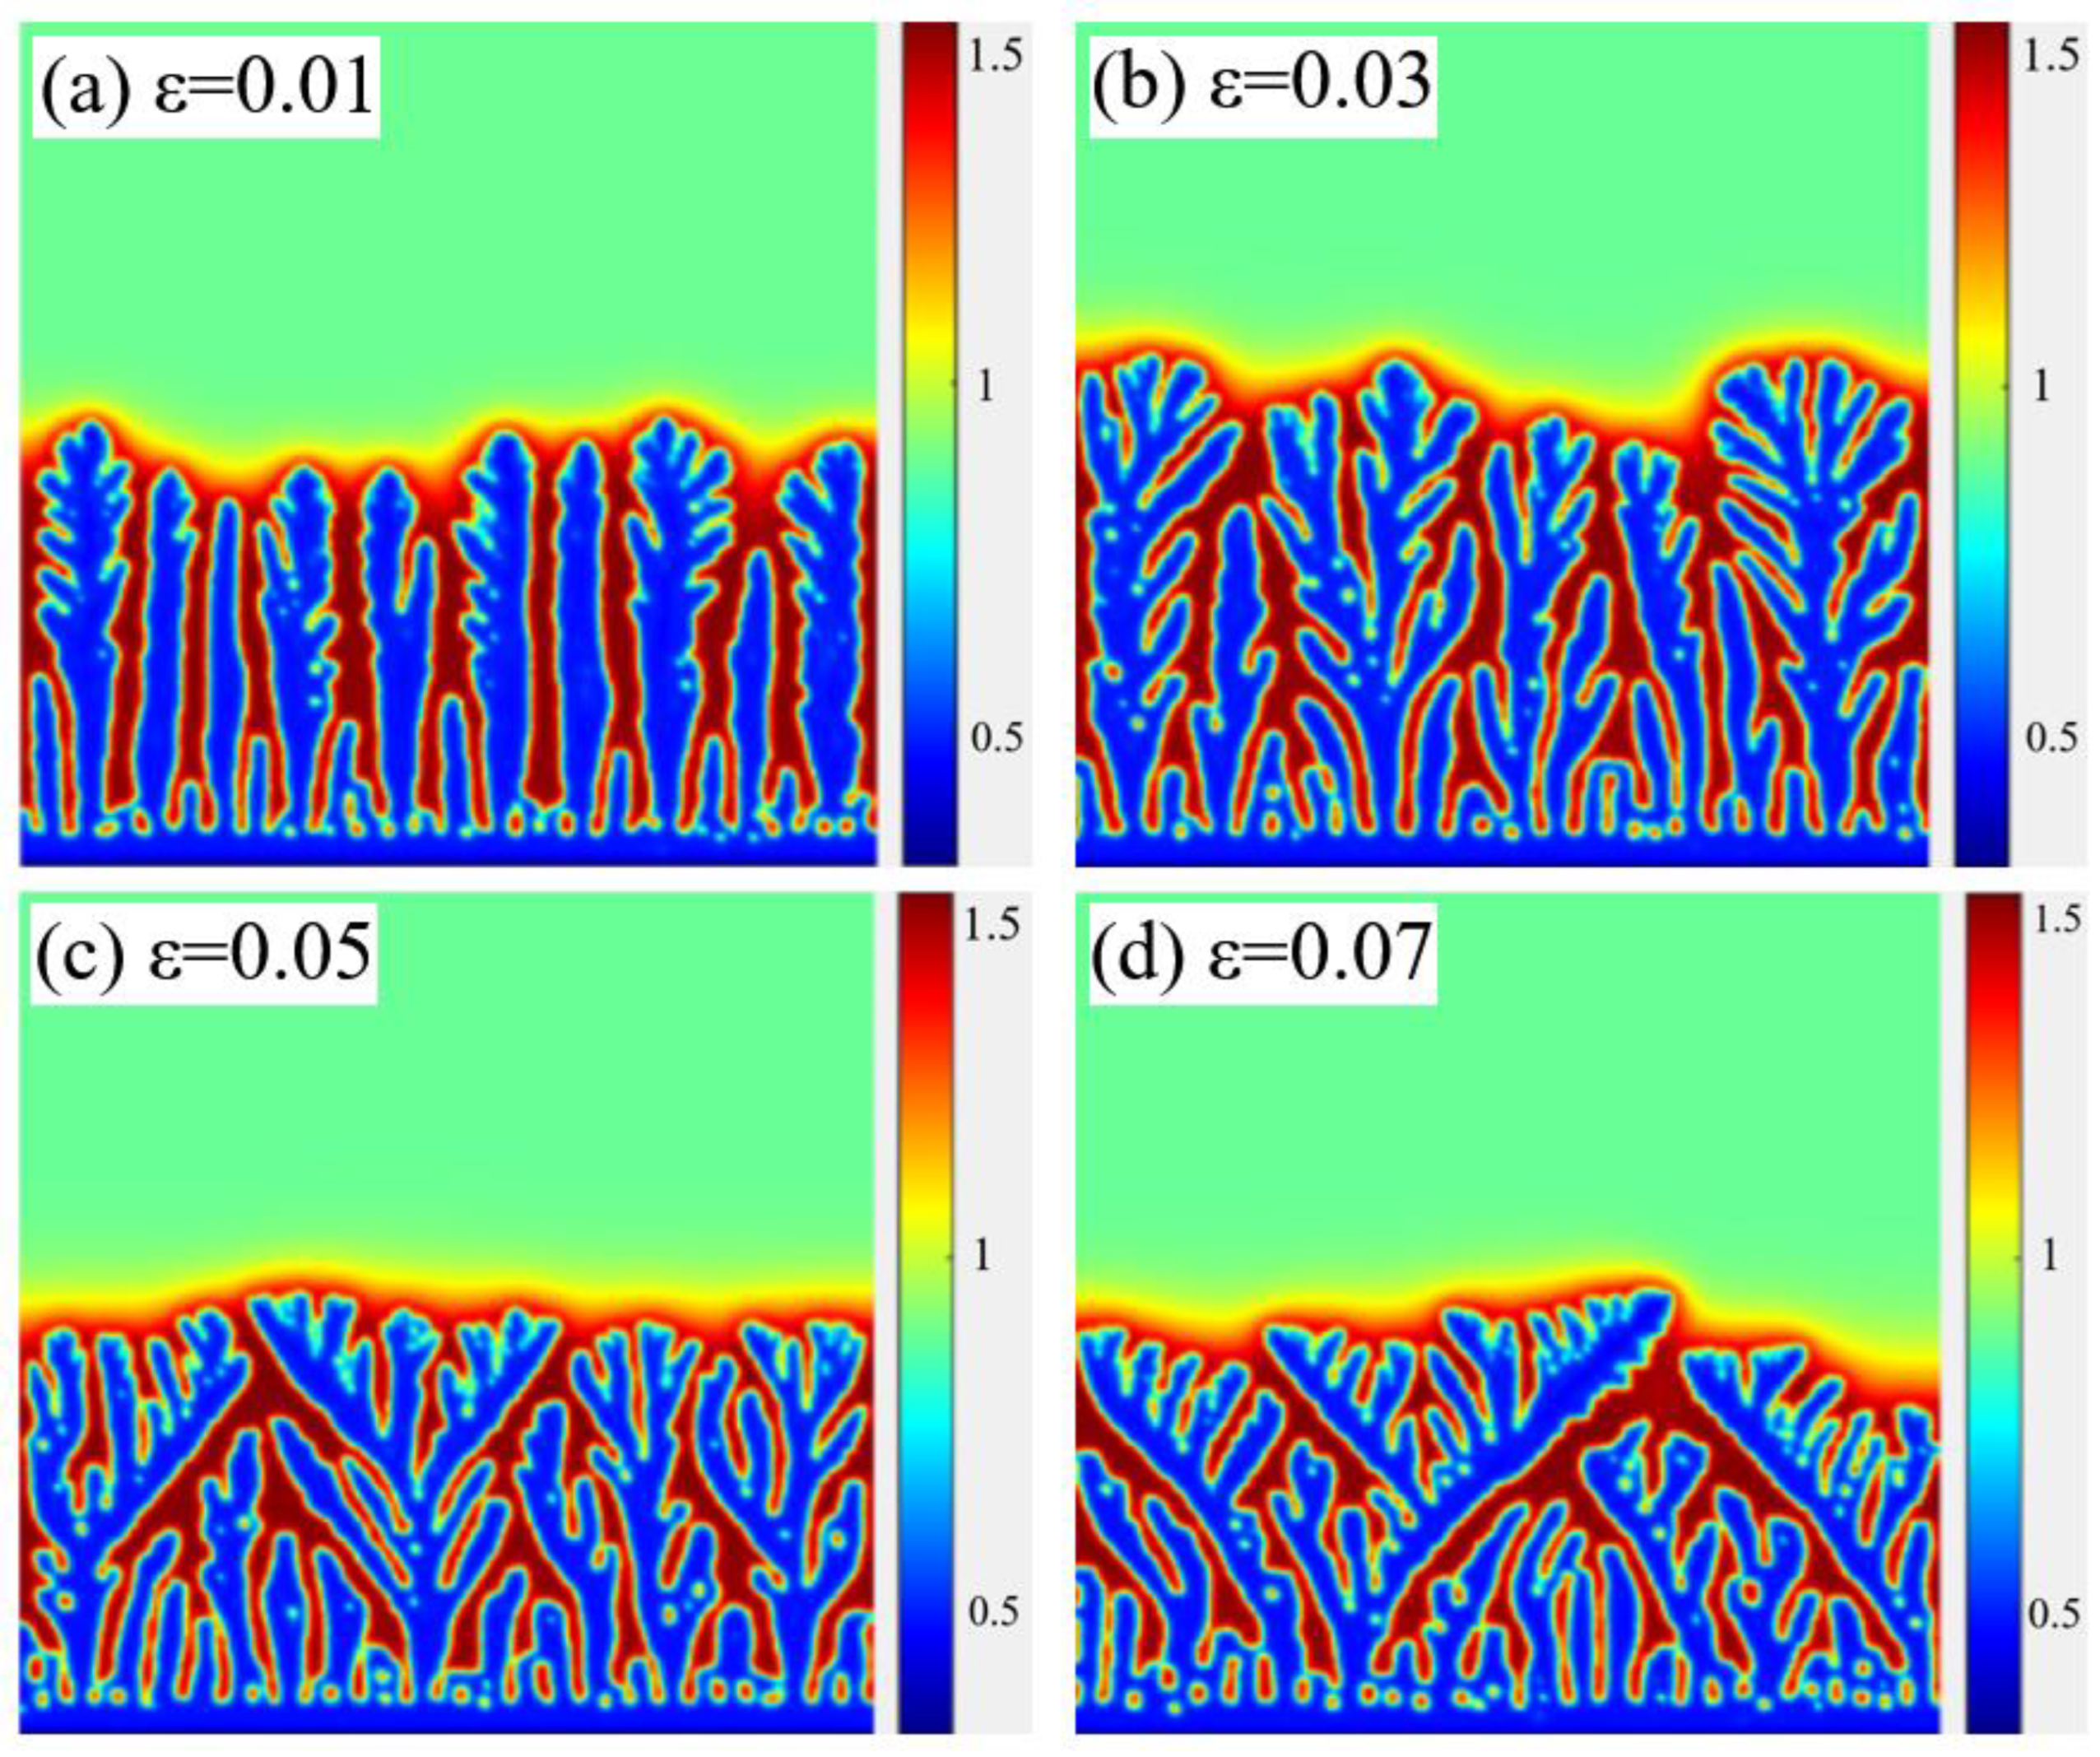
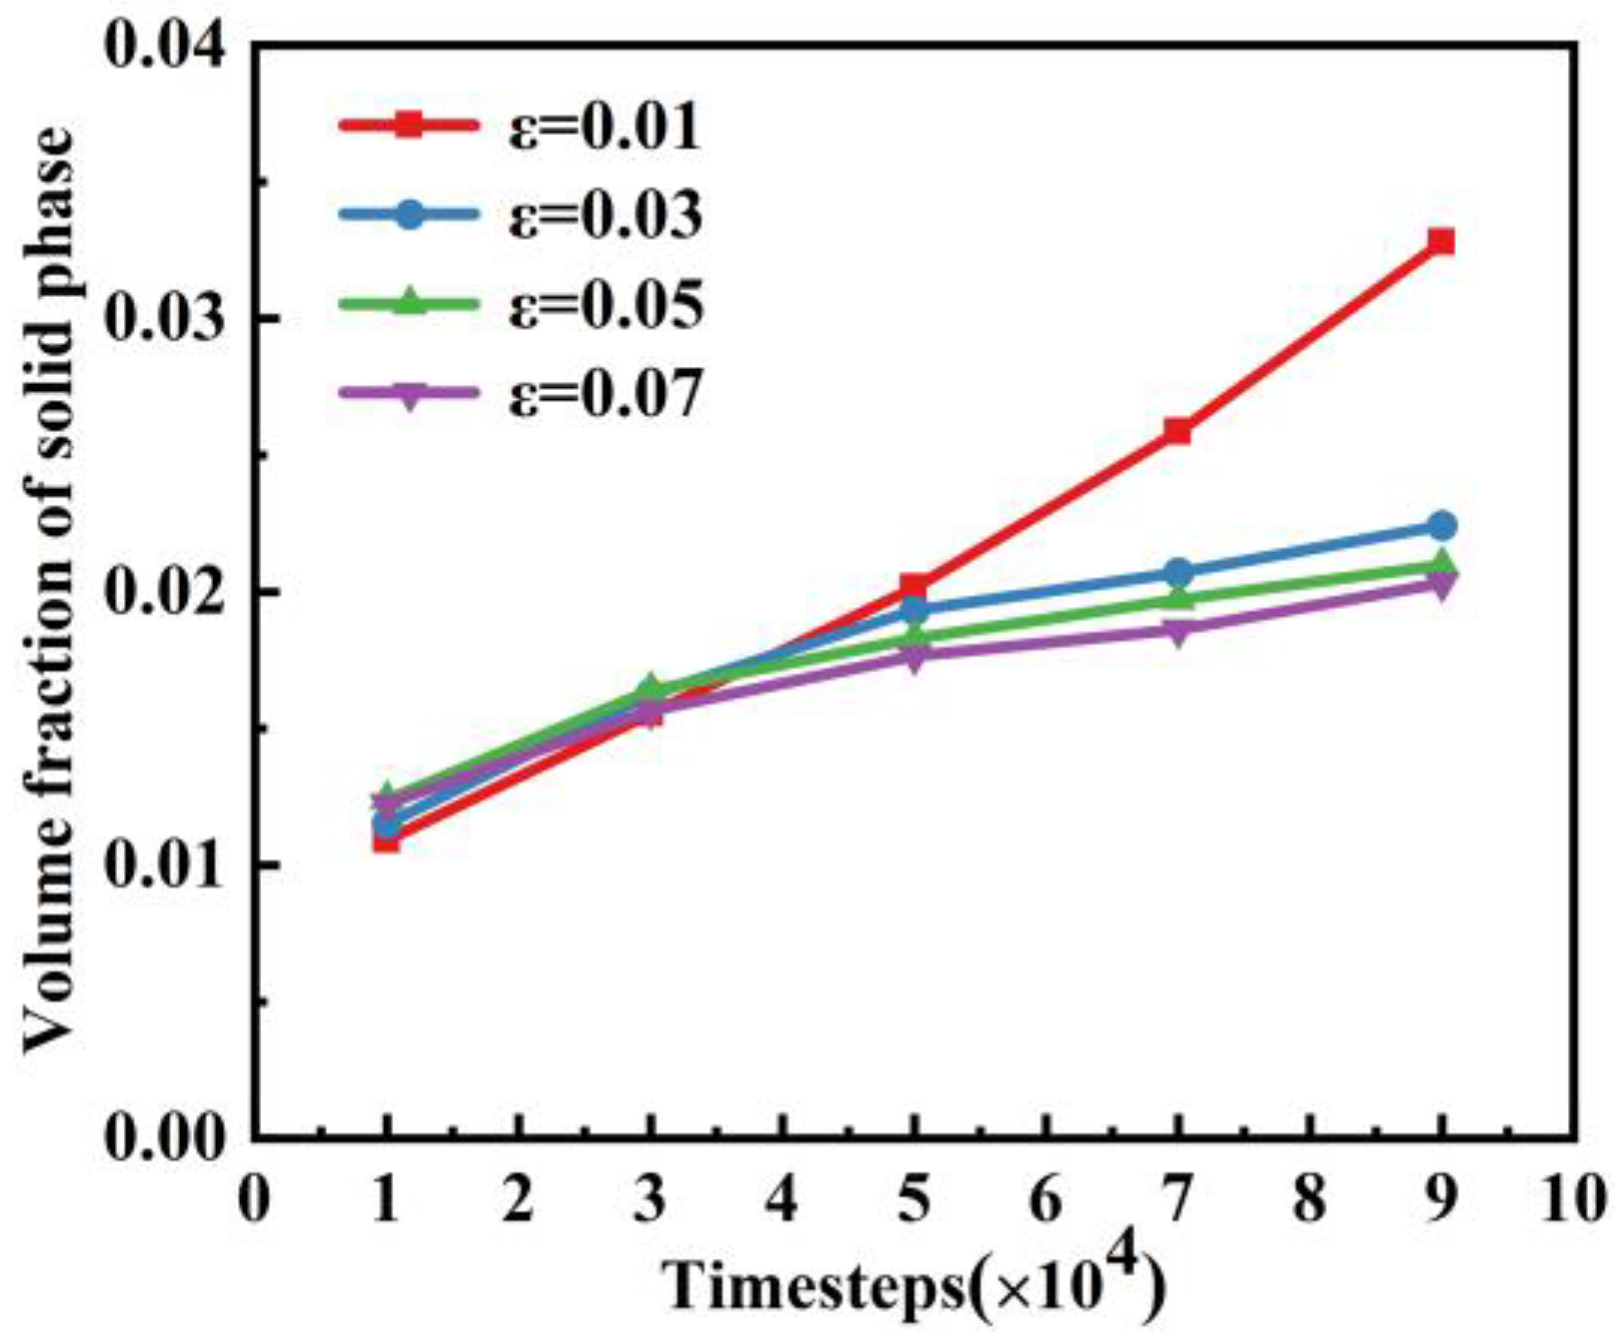
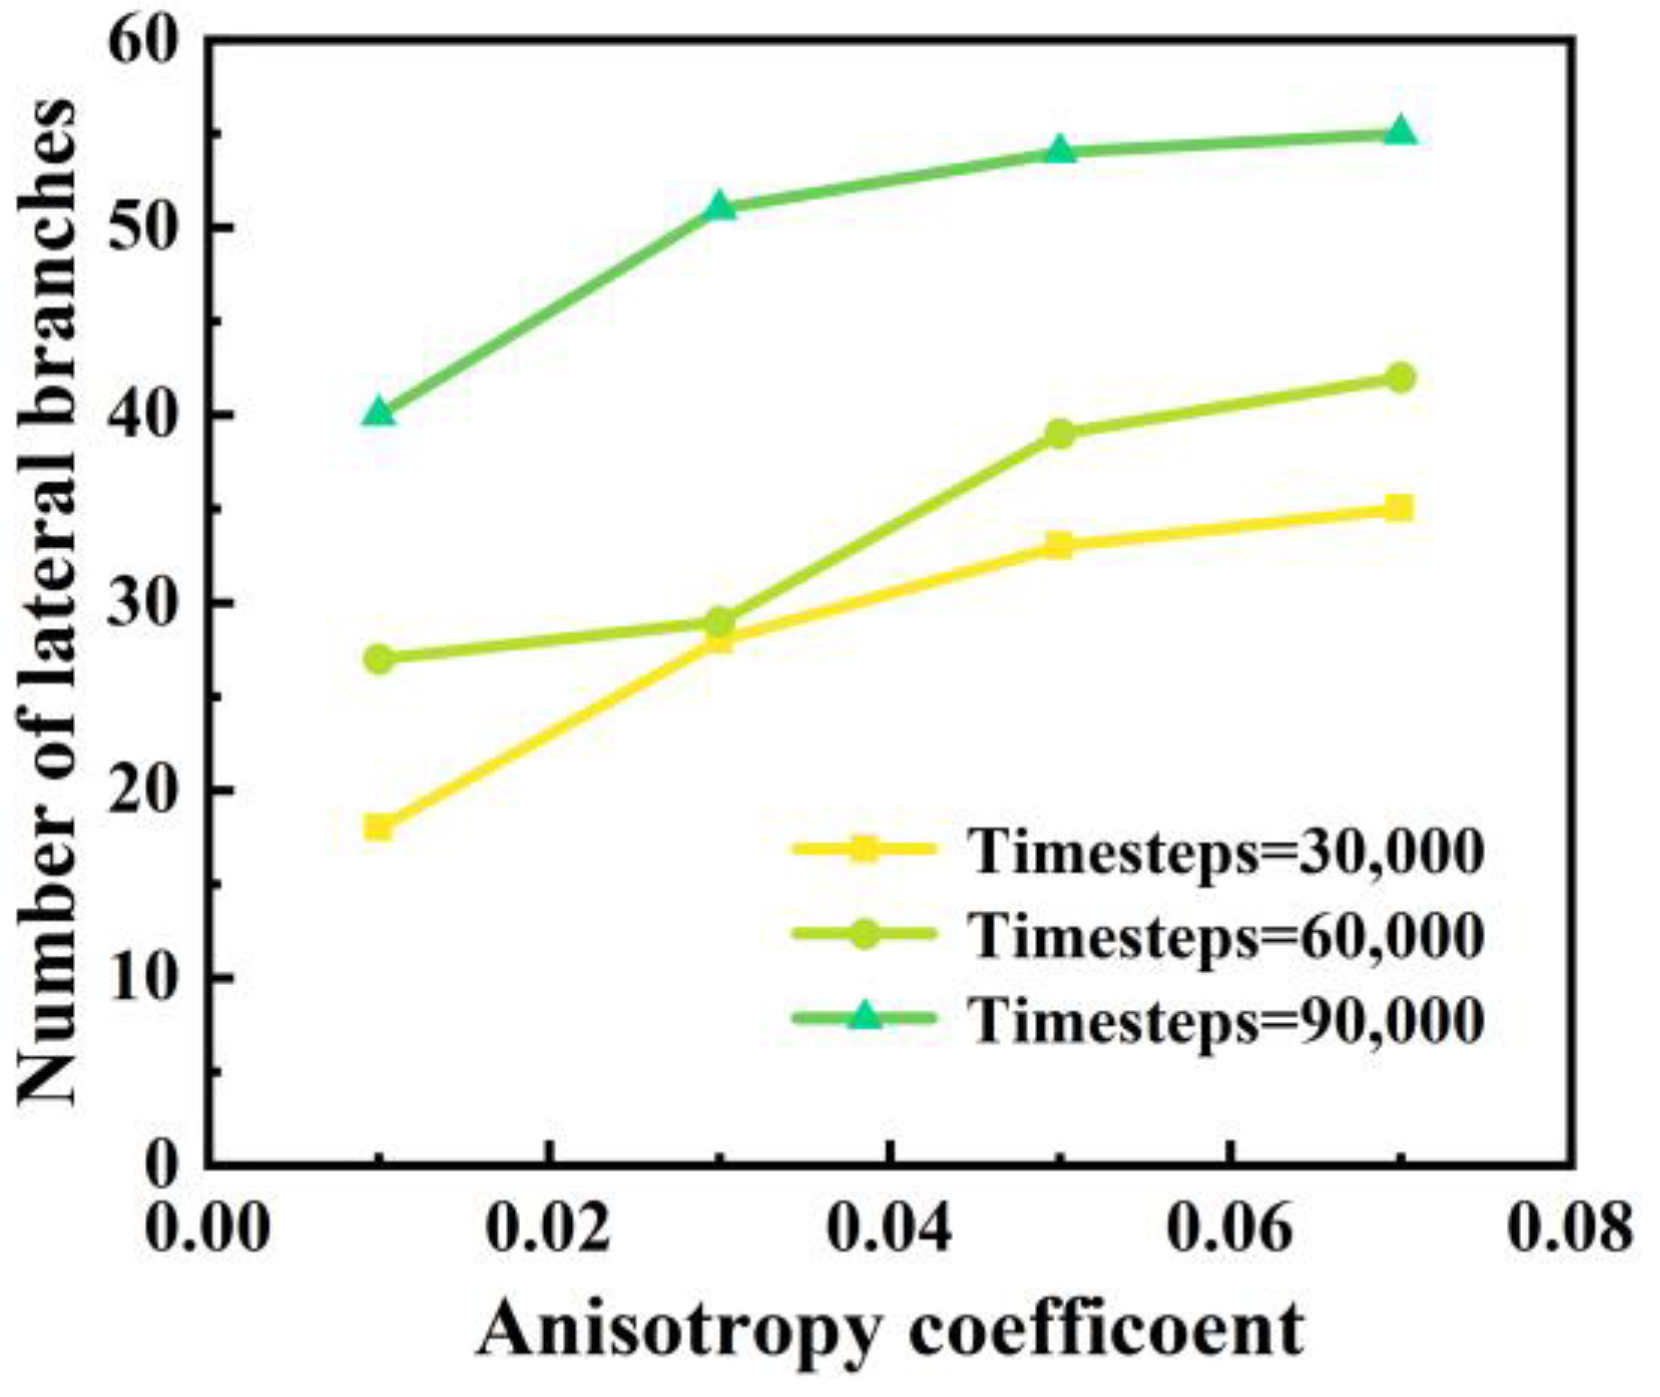
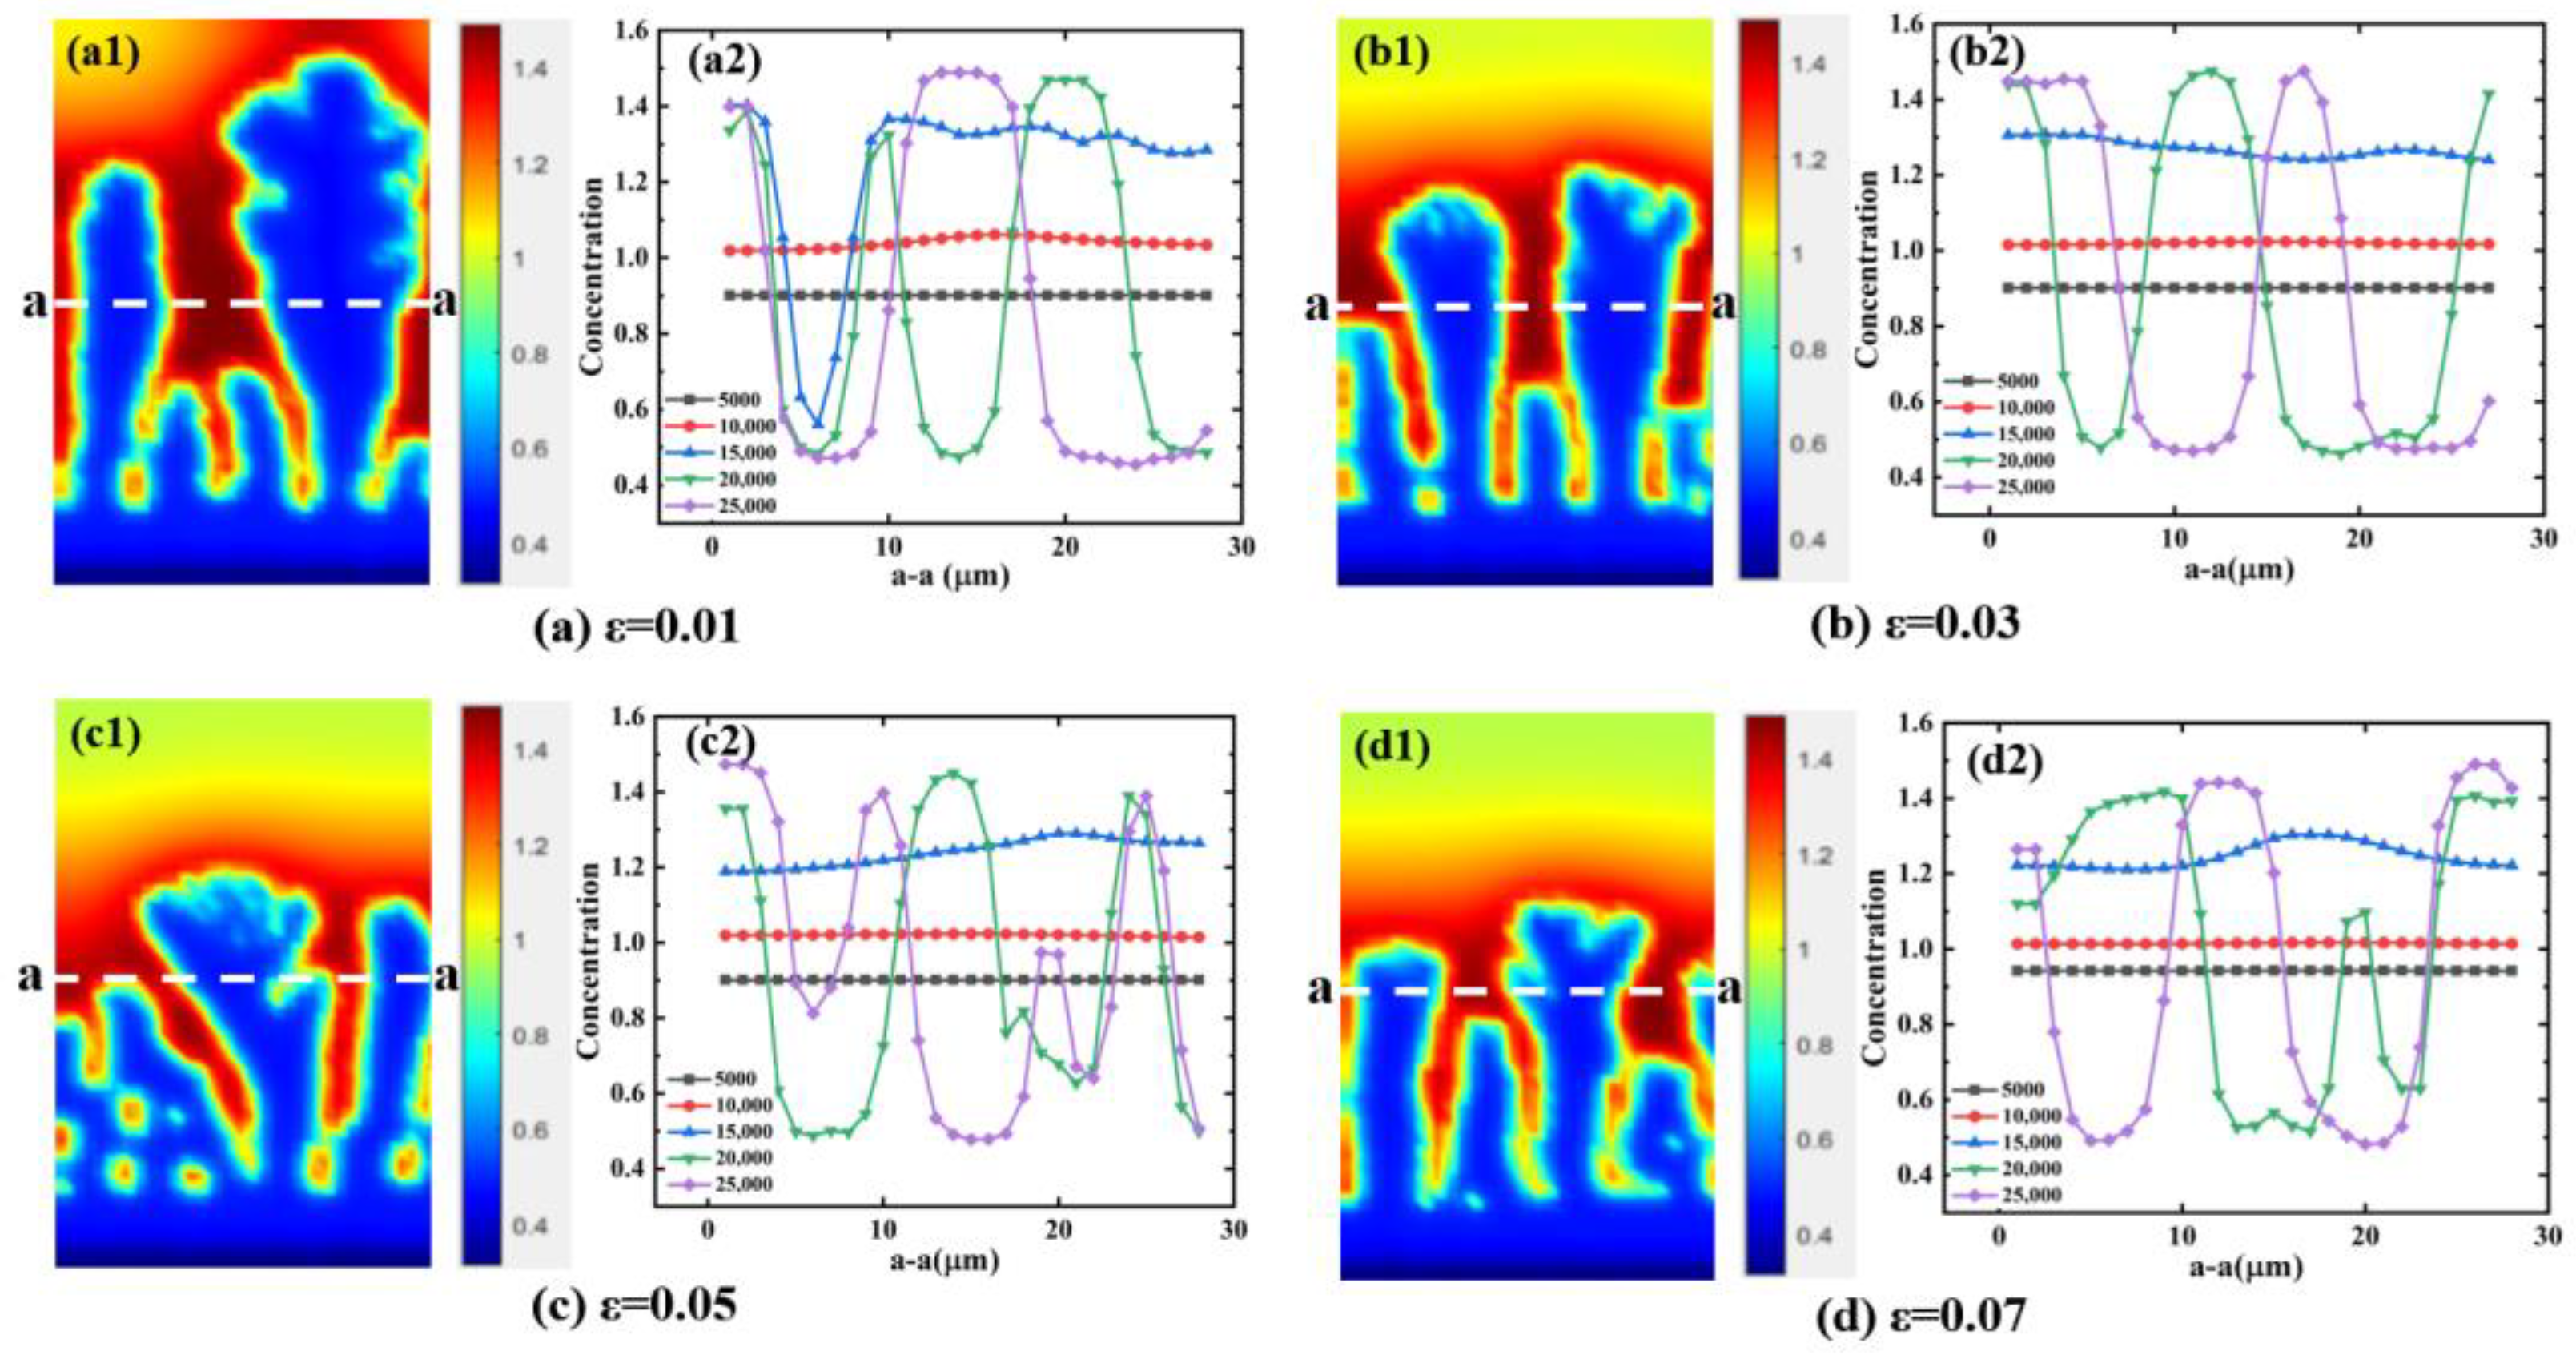
4.2. Influence of Anisotropy Coefficient on Dendritic Morphology

This section discusses the dendritic growth and evolution at different anisotropy coefficients. While keeping other parameters constant and Δ = 0.45, the effect of varying degrees of anisotropy on the number of secondary dendrite arms and the complexity of lateral branches is investigated. Figure 8 presents a comparative analysis of the dendritic evolution morphology at four different anisotropy coefficients. The simulation results show that when the anisotropy coefficient is small and the growth direction is parallel to the temperature gradient, the primary branch crystals are more robust. It is worth noting that there is a change in the direction of dendrite growth at a = 0.03, with lateral branches growing faster towards the sides. This is because that cellular dendrites produce at small anisotropy coefficients. As the anisotropy coefficient becomes larger, the dendrites grow in the direction dominated by the anisotropy coefficient.
Due to the competition between dendrites, some dendrites are eliminated during the evolution process, and the lateral branches on the primary dendrite arms are mostly secondary dendrites with short lengths. As the anisotropy coefficient increases, the primary dendrite becomes finer and its growth direction no longer aligns parallel to the temperature gradient. The number of lateral branches increases significantly, which in turn evolve into multiple dendritic arms. At this stage, the dendrite change at the interface is no longer stable. When the anisotropy coefficient is 0.05, the interface front becomes unstable, and the splitting of dendrite tips along the vertical direction becomes more pronounced. The lateral branch growth exhibits a noticeable acceleration. This phenomenon is closely related to that at crystal anisotropy coefficient, interface supercooling, and solute interactions. The above results agree with the theory proposed by Fallah [29].
Simultaneously, the anisotropy coefficient significantly influences the solidification rate of dendrites, as illustrated in Figure 9. From the figure, it is evident that the solid-phase volume fraction at different anisotropy coefficients is relatively low. The reason for this is that the grain structure is cellular in the early stage of dendrite growth and can be affected by various factors. As the timesteps increase, the solidification rate progressively rises. However, the solid-phase volume fractions are relatively close at different anisotropy coefficients. Among them, the highest solidification rate is observed at ε = 0.01 with a solid-phase volume fraction above 3%. A noticeable increase is observed starting at 50,000 timesteps, surpassing the 2% solidification rates for the other three anisotropy coefficients. This study shows that the accelerated growth rate of dendritic side branches with increasing anisotropy coefficient directly leads to a more pronounced evolution. However, at this stage, the region is mostly solid–liquid coexistence state. At this time, the liquid phase has not completely converted to solid phase, which makes the solidification rate lower. Overall, the growth of columnar crystals tends to stabilize, and the solid-phase content increases steadily as solidification proceeds. Figure 10 depicts the variation in the number of the dendritic lateral branches at different anisotropy coefficients and different timesteps. It can be found that the number of lateral branches increases with increasing anisotropy coefficient at the same timestep. In addition, the total number of dendrite lateral branches is 53 at an anisotropy coefficient of 0.05 and a timestep of 90,000, which is 40% more than that at a timestep of 30,000. This indicates that the morphological complexity of dendrites is proportional to time.
To further investigate the influence of anisotropy on the growth of primary dendrites, a statistical analysis of the solute distribution is carried out at a fixed position (a–a) for different anisotropy coefficients [30,31,32]. Figure 11 is a partially enlarged view of the early form of Figure 8. The morphological and concentration changes in the solidified tissue from top to bottom are as follows: Figure 11(a1–d1) depicts the typical evolution sequence from dendritic to seaweed-like structures and tip splitting in the solute field. Figure 11(a2–d2) illustrates the solute distribution along the white line (a−a) at different times. In the early stage, the alloy solute concentration gradually increases and remains relatively stable. However, the apparent fluctuations in the solute profiles show that both the dendritic and solute distributions become significantly unstable with increasing anisotropy coefficient. When the timestep is constant, the larger anisotropy results in more complex dendritic morphologies and branches. Moreover, the narrower main dendritic arms lead to smaller inter-dendritic spacing. These results indicate that the increased anisotropy coefficient induces dendritic variations and accelerates the dendritic growth.

5. Conclusions

This paper studies the evolution of dendrite growth in the solidification process of Cu-W alloy under arc ablation based on the phase-field model developed by Karma and co-workers. The whole process of dendritic growth during the solidification of the Cu-W alloy under a high-temperature arc, and the characteristics of dendritic growth in this process, are analyzed. The high temperature causes the Cu-W alloy to undergo melting and subsequent solidification. During the solidification process, the dendrites evolve into columnar structures. As the timesteps increase, the solid–liquid interface becomes unstable due to the release of latent heat, leading to the competitive growth and significant solute expulsion. Further, the effect of supercooling and anisotropy on the growth and morphology of columnar dendrites in the Cu-W alloy is also analyzed. By analyzing the position of the solid–liquid interface and the volume fraction of the solid phase, it is found that the interface position is only 15 μm when the supercooling degree is 289 K. The growth rate of the dendrites accelerates significantly when supercooling degree reaches 1446 K, at which the interfacial position nearly doubles compared to that at 289 K. Thus, the supercooling degree has a significant effect on the solidification process of Cu-W alloy dendrites. Meanwhile, simulation finds that the anisotropy and supercooling degree can affect the development of side branches of dendrite. The number of side branches can directly affect the overall densification of dendrites, which in turn affects the densification and ablative corrosion resistance of Cu-W alloy materials. A large number of dendritic lateral branches leads to the poor densification and ablative resistance of Cu-W alloy contacts. In contrast, the mechanical properties of Cu-W alloy contacts improve with increasing supercooling.

Author Contributions

Conceptualization, H.R. and Q.L.; methodology, Q.L. and Z.H.; software, J.M. and Y.Y.; validation, J.M., S.Z. and J.L.; formal analysis, Z.X.; data curation, Z.H. and Y.Y.; writing—original draft preparation, J.L., S.Z. and J.M.; writing—review and editing, H.R. and Q.L.; visualization, H.R. and Z.X.; supervision, Q.L.; project administration, H.R.; funding acquisition, H.R. All authors have read and agreed to the published version of the manuscript.

Funding

This research was supported by National Natural Science Foundation of China (grant number 52207153), Beijing Natural Science Foundation (grant number 3232053) and China Postdoctoral Science Foundation (grant numbers 2024T170269 and 2023M731073).

Data Availability Statement

The original contributions presented in the study are included in the article, further inquiries can be directed to the corresponding author.

Conflicts of Interest

The authors declare no conflicts of interest.

References

  1. Han, Z.Y.; Li, Q.M.; Li, J.K.; Wang, M.X.; Ren, H.W.; Zou, L. Phase field model for electric-thermal coupled discharge breakdown of polyimide nanocomposites under high frequency electrical stress. Plasma Sci. Technol. 2024, 26, 025505. [Google Scholar] [CrossRef]
  2. Li, C.; Hu, J.; Lin, C.; Zhang, B.; Zhang, G.; He, J. Surface charge migration and dc surface flashover of surface-modified epoxy-based insulators. J. Phys. D Appl. Phys. 2017, 50, 065301. [Google Scholar] [CrossRef]
  3. Long, Z.; Li, J.F.; Yin, L.M.; Zhang, H.H.; Xu, M.R.; Yao, Z.X. Phase field simulation of intermetallic compound evolution at the interface of copper–tin coating under thermal–mechanical–electrical diffusion coupling. J. Electron. Mater. 2023, 52, 3321. [Google Scholar]
  4. Jiang, Y.; Xiu, S.; Yang, J.; Tan, T.; Liu, Z.; Chu, B. Investigation on the arc root characteristics of vacuum arc between the iron-core cup-shaped transverse magnetic field contacts. Phys. Plasmas 2022, 29, 043505. [Google Scholar] [CrossRef]
  5. Biswas, S.; Liu, D.; Aagesen, L.K.; Jiang, W. Solidification and grain formation in alloys: A 2D application of the grand-potential-based phase-field approach model. Model. Simul. Mater. Sci. Eng. 2022, 30, 025013. [Google Scholar] [CrossRef]
  6. Li, Y.R.Y.; Fu, C.C.; Wan, B.; Yan, X.J.; Zhang, W.F.; Li, W. Phase-field modelling of lead-free solder joint void growth under thermal-electrical coupled stress. J. Electron. Mater. 2022, 51, 259. [Google Scholar] [CrossRef]
  7. Liu, K.; Yang, F.; Wang, S.; Gao, B.; Xu, C. The research on the heat source characteristics and the equivalent heat source of the arc in gaps. Int. J. Heat Mass Transf. 2018, 124, 177. [Google Scholar] [CrossRef]
  8. Khakpour, A.; Uhrlandt, D.; Methling, R.-P.; Gortschakow, S.; Franke, S.; Imani, M.T.; Weltmann, K.-D. Impact of temperature changing on voltage and power of an electric arc. Electr. Power Syst. Res. 2017, 143, 73. [Google Scholar] [CrossRef]
  9. Geng, H.; Li, J.; Xiong, J.; Lin, X. Optimisation of interpass temperature and heat input for wire and arc additive manufacturing 5A06 aluminium alloy. Sci. Technol. Weld. Join. 2017, 22, 472. [Google Scholar] [CrossRef]
  10. Guo, C.; Li, J.; Wang, Z.; Wang, J. Non-uniplanar competitive growth of columnar dendritic grains during directional solidification in quasi-2D and 3D configurations. Mater. Des. 2018, 151, 141. [Google Scholar] [CrossRef]
  11. Tan, J.H.K.; Sing, S.L.; Yeong, W.Y. Microstructure modelling for metallic additive manufacturing: A review. Virtual Phys. Prototyp. 2020, 15, 87. [Google Scholar] [CrossRef]
  12. Karma, A. Phase-field formulation for quantitative modeling of alloy solidification. Phys. Rev. Lett. 2001, 87, 115701. [Google Scholar] [CrossRef] [PubMed]
  13. Gong, T.Z.; Chen, Y.; Cao, Y.F.; Kang, X.H.; Li, D.Z. Fast simulations of a large number of crystals growth in centimeter-scale during alloy solidification via nonlinearly preconditioned quantitative phase-field formula. Comp. Mater. Sci. 2018, 147, 338. [Google Scholar] [CrossRef]
  14. Zhao, Y.; Liu, K.; Hou, H.; Chen, L.Q. Role of interfacial energy anisotropy in dendrite orientation in Al-Zn alloys: A phase field study. Mater. Des. 2022, 216, 110555. [Google Scholar] [CrossRef]
  15. Liu, Z.H.; Feng, Y.; Jiang, N.Y.; Zhou, Z.J.; Wang, F.; Li, X.C.; Yu, M. Arc erosion behavior of Cu/Ti3SiC2 cathodes in c-C4F8 gas as a substitute for SF6 gas. J. Electron. Mater. 2023, 52, 7818. [Google Scholar] [CrossRef]
  16. Shao, L.; Chen, B.; Yang, W.; He, J.; Tan, J. Numerical modeling of ice crystal dendritic growth with humidity by using an anisotropic phase field model. Cryst. Growth Des. 2024, 24, 1400. [Google Scholar] [CrossRef]
  17. Zhao, D.W.; Li, J.F. Phase-field modeling of the effect of liquid-solid interface anisotropies on free dendritic growth. Acta Phys. Sin. 2009, 58, 7094. [Google Scholar] [CrossRef]
  18. Echebarria, B.; Folch, R.; Karma, A.; Plapp, M. Quantitative phase-field model of alloy solidification. Phys. Rev. E 2004, 70, 061604. [Google Scholar] [CrossRef]
  19. Boettinger, W.J.; Warren, J.A.; Beckermann, C.; Karma, A. Phase-field simulation of solidification. Annu. Rev. Mater. Res. 2002, 32, 163. [Google Scholar] [CrossRef]
  20. Li, M.E.; Yang, G.C.; Zhou, Y.H. Phase field modeling of directional solidification of a binary alloy at high velocities. Acta Phys. Sin. 2005, 54, 454. [Google Scholar]
  21. Danilov, D.; Nestler, B. Phase-field modelling of solute trapping during rapid solidification of a Si–As alloy. Acta Mater. 2006, 54, 4659. [Google Scholar] [CrossRef]
  22. Provatas, N.; Elder, K. Phase-Field Methods in Materials Science and Engineering, 1st ed.; Wiley: Hoboken, NJ, USA, 2010. [Google Scholar]
  23. Meng, Y.; Shen, Y.; Chen, C.; Li, Y.; Feng, X. Effects of Cu content and mechanical alloying parameters on the preparation of W–Cu composite coatings on copper substrate. J. Alloys Compd. 2014, 75, 585. [Google Scholar] [CrossRef]
  24. SGTE 2022 Alloy Phase Diagrams. Available online: https://www.Crct.Polymtl.Ca/Fact/Documentation/#Opennewwindow (accessed on 10 September 2024).
  25. Long, W.Y.; Xia, C.; Xiong, B.W.; Fang, L.G. Phase-field simulation of dendritic growth in a binary alloy with thermodynamics data. Chin. Phys. B 2008, 17, 1078. [Google Scholar]
  26. Li, D.R.; Cai, Y.X.; Liu, Z.Y.; Wang, E.D. Modelling of physical properties of W-Cu alloy and calculation of theoretical values. China Tungsten Ind. 2011, 26, 003504. [Google Scholar]
  27. Deng, C.; Jiang, M.L.; Zhou, S.F. Microstructure and properties of pure tungsten and tungsten copper composites by laser additive manufacturing. Spec. Cast. Nonferrous Alloys 2022, 42, 804. [Google Scholar]
  28. Wang, L.; Wei, Y.; Yu, F.; Zhang, Q.; Peng, Q. Phase-field simulation of dendrite growth under forced flow conditions in an Al–Cu welding molten pool. Cryst. Res. Technol. 2016, 51, 602. [Google Scholar] [CrossRef]
  29. Duan, P.P.; Xing, H.; Chen, Z.; Hao, G.H.; Wang, B.H.; Jin, K.X. Phase-field modeling of free dendritic growth of magnesium based alloy. Acta Phys. Sin. 2015, 64, 060201. [Google Scholar] [CrossRef]
  30. Fallah, V.; Amoorezaei, M.; Provatas, N.; Corbin, S.F.; Khajepour, A. Phase-field simulation of solidification morphology in laser power deposition of Ti-Nb alloys. Acta Mater. 2012, 60, 1663. [Google Scholar] [CrossRef]
  31. Li, H.; Wang, X.; Liang, Y.; Fei, Y.; Zhang, H. Effect of electrical contact mode on the arc-erosion behavior of titanium diboride-nickel co-reinforced and nickel-enhanced silver-based electrical contact materials. J. Electron. Mater. 2022, 51, 1137. [Google Scholar] [CrossRef]
  32. Wang, Y.B.; Peng, L.M.; Ji, Y.Z.; Chen, X.X.; Wang, C.L.; Wu, Y.J.; Fu, Y.N.; Chen, L.-Q. The effect of cooling rates on the dendritic morphology transition of Mg-6Gd alloy by in situ X-ray radiography. J. Mater. Sci Technol. 2018, 34, 1142. [Google Scholar] [CrossRef]
Figure 1. Cu-W alloy phase diagram [24].
Metals 14 01100 g001
Figure 2. The dendritic morphology of Cu-W alloys at different timesteps with ε = 0.03 and Δ = 0.45 in the solute field (a1e1) and phase field (a2e2): (a) Timestep = 10,000, (b) timestep = 30,000, (c) timestep = 50,000, (d) timestep = 70,000, (e) timestep = 90,000.
Metals 14 01100 g002
Figure 3. The variation in the solid-phase volume fraction at different timesteps with ε = 0.03 and Δ = 0.45.
Metals 14 01100 g003
Figure 4. The variation in solid–liquid interface height at different timesteps with ε = 0.03 and Δ = 0.45.
Metals 14 01100 g004
Figure 5. The dendritic morphology of the Cu-W alloy at different supercooling degrees with ε = 0.05 in the phase field (a1d1) and solute field (a2d2): (a) Δ = 0.15, (b) Δ = 0.35, (c) Δ = 0.55, (d) Δ = 0.75.
Metals 14 01100 g005
Figure 6. The variation in the solid-phase volume fraction at different dimensionless supercooling degrees with ε = 0.05.
Metals 14 01100 g006
Figure 7. The variation in the solid–liquid interfacial positions at different supercooling degrees with ε = 0.05.
Metals 14 01100 g007
Figure 8. The dendrite morphology at different anisotropy coefficients with Δ = 0.45: (a) ε = 0.01, (b) ε = 0.03, (c) ε = 0.05, (d) ε = 0.07.
Metals 14 01100 g008
Figure 9. The volume fraction of the solid phase at different anisotropy coefficients with Δ = 0.45.
Metals 14 01100 g009
Figure 10. The number of lateral branches of the dendritic crystals at different anisotropy coefficients with Δ = 0.45.
Metals 14 01100 g010
Figure 11. Solidified tissue morphology and solute solubility changes at a–a direction under different anisotropy coefficients with Δ = 0.45. (a) ε = 0.01, (b) ε = 0.03, (c) ε = 0.05, (d) ε = 0.07.
Metals 14 01100 g011
Table 1. Material parameters of Cu-W alloy adapted from Refs. [25,26].
Material ParametersCuWCuW80
Melting point (K)135736952815
Density (g/cm3)8.9619.3515.15
Specific heat capacity (J/(kg·K))0.130.390.19
Latent heat (J/kg)1.34 × 1054.01 × 1053.47 × 105
Gibbs–Thomson (K·m)1.3 × 10−78.29 × 10−76.89 × 10⁻⁷
Disclaimer/Publisher’s Note: The statements, opinions and data contained in all publications are solely those of the individual author(s) and contributor(s) and not of MDPI and/or the editor(s). MDPI and/or the editor(s) disclaim responsibility for any injury to people or property resulting from any ideas, methods, instructions or products referred to in the content.

