Article

Joint Quality Assessment of Ultrasonic Metal Welded Parts by Fracture Surface Evaluation

1
Welding and Joining Institute, RWTH Aachen University, 52062 Aachen, Germany
2
Institute of Advanced Manufacturing (iAM), Shenzhen International Graduate School, Tsinghua University, Shenzhen 518055, China
*
Author to whom correspondence should be addressed.
Metals 2024, 14(8), 892; https://doi.org/10.3390/met14080892
Submission received: 10 June 2024 / Revised: 25 July 2024 / Accepted: 2 August 2024 / Published: 5 August 2024

Abstract

:
In ultrasonic metal welding, low specific resistances and large joining surface cross-sections require the use of mechanical testing to quantify the joint quality. In this study, different quality features of ultrasonically welded joints made of pure copper sheet are investigated during the successive phases of joint formation. Two test series with different workpiece geometries are examined. It is shown that mechanical quality features such as shear and peel forces behave differently over the formation of the joint and are not transferable. As an alternative to these, laser scanning microscopy is used to record images of the fracture surface that describe the growth of the joint area during formation. The study finds that shear tensile force growth and joint area growth are non-linear and comparable, with optimized welds achieving joint areas of 30 mm2 out of 64 mm2 and 6 mm2 out of 16 mm2. Although overall quality increases with increasing welding time, the material strength in the joint zone decreases. Depending on the original rolling condition, between 43% and 59% of the original material strength can be identified as the joint strength. The automatic analysis of fracture images is a suitable alternative to mechanical testing for similar joints.

1. Introduction

Ultrasonic Metal Welding (USMW) is an innovative welding technique that uses high-frequency ultrasonic vibrations to join stacks of thin metal sheets or wires. Typical applications are the production of power electronics, wire harnesses, solar energy products and battery cells [1,2,3]. In contrast to conventional fusion welding processes, in which a molten phase is created, ultrasonic vibrations generate frictional heat and pressure at the interface of materials, resulting in a material bond in a solid state [4,5]. This results in high-quality similar joints, dissimilar joints between, e.g., aluminum and copper or aluminum and titanium, as well as respective alloys, which, despite being susceptible to intermetallic phase formation, can achieve good quality [5,6,7,8]. While typical problem areas for fusion welding processes such as the formation of intermetallic compounds or pores during laser beam welding are therefore not relevant, the USMW process is sensitive due to its many influencing variables and poor observability [4,9]. In addition to the welding parameters amplitude, energy and pressure [1,4,10], influencing variables include the workpiece properties, i.e., material hardness, surface condition, geometric deviations, and also tool wear [4,11]. The quality of ultrasonic welded joints is primarily determined based on mechanical features determined in destructive tests [4,5,11,12,13]. An analysis of electrical resistance is not meaningful for the quality of the joint due to the typically large joining area. A quantitative measurement of the actual joint area is not used as a quality feature. The determination of meaningful quality data is indispensable for the design of process monitoring models. High-accuracy prediction models require high measurement data quality [14]. This also concerns a quality determination of USMW joints. The current research state of joint formation and quality data acquisition is described below.

1.1. Joint Formation

USMW is a solid-state welding process [1,4,5]. The prevailing understanding of USMW for similar and dissimilar joints describes the incremental formation of microscopic joints and their subsequent growth in size and number. At the start of the welding process, ultrasonic vibrations and pressure create microscopic joints at the interfaces of the workpieces. These welded micro-welds grow in size and number as the process continues, in theory eventually covering the entire interface defined by the sonotrode size. According to DeVries’ three-stage model for aluminum parts of the same type, surface contaminants such as oxides and lubricants are present on the part surface before ultrasonic welding. When pressing the parts to be joined, direct, full-surface contact is prevented, and the parts to be joined only come into contact with surface irregularities. When the ultrasonic vibration starts, these irregularities are deformed, breaking up the impurities and increasing the metal-to-metal contact of the parts. The ongoing welding cycle, stage 2, leads to the slow formation of a joint based on these initial contacts. The possible third stage is over-welding, in which too much heat is applied to the welding spot, resulting in a deterioration of the mechanical properties [1].
Balz’s newer six-stage model for welding based on experiments with two pure copper workpieces is more comprehensive. It begins with stage 1—transient phase, where ultrasonic oscillation causes relative movement between the welding parts and heating contact points, which is comparable to the irregularities described by DeVries. Next, in stage 2—shearing and cleaning, oil residues evaporate, and oxides break up. As friction heat increases in stage 3, the so-called thermal softening occurs, significantly expanding contact areas. This leads in stage 4 to dynamic recrystallization, where the softened material within the joint zone recrystallizes. With reduced relative movement between the joining parts, in stage 5, the maximized joint area is reached. Finally, in stage 6, over-welding occurs, characterized by a loss of joint strength due to static recrystallization and geometric weakening of the workpieces [4]. Balz uses the relative motions between the individual sheets and the welding tools, acquired using high-speed videography and speckle tracking as indicators for the process stages. This description of the joining process is confirmed by later research by Li and Balle for dissimilar Al-Cu joints [15]. The joint quality, measured as a maximum peel force, increases with increasing sonotrode force and welding time or energy (energy or time-controlled process) up to a maximum and then falls again due to high thermal and mechanical loads [4]. Fujii et al. show an increasing course of the maximum shear strength depending on the weld energy used [16].
The vibration amplitude determines the relative path between the joining partners and is largely responsible for the friction intensity against the background of the high operating frequencies [7]. Component-side influencing factors, such as the material and its mechanical properties, as well as the geometry and thickness of the sonotrode-side joining part also heavily influence the welding process [1,10,11,17,18,19]. As a surface-sensitive process, this is also the case for the technical (roughness) and natural surface (absorbed gas, water and fat molecules as well as oxide layers) [4,11,20,21,22]. Thicker oxide layers make joint formation more difficult, especially with copper oxide layers [21]. The influence of residues such as oil or alcohol is not so clear and can be significantly affected or superimposed by other influences such as the rolling condition [22,23]. The process influences have a comparable effect for welding dissimilar and similar material combinations.

1.2. Quality Assessment and Prediction

Joint quality assessment plays a decisive role in the reliability and performance of welds. Destructive testing techniques, including tensile shear testing, tensile peel testing and shear testing provide quantitative measures of joint strength (elongation, displacement), and usually only the maximum value is considered as a quality indicator for joint formation [4,12,13,16]. Additionally, resistance measurements and accelerated aging tests in electrical applications, as well as modeling and simulations aid in optimizing process parameters and predicting the performance of USMW joints but are not used as quality measures during production [18,19,24].
Up to now, only the quality requirements and testing methods of stranded wire knots [13,24] and wire-terminal applications [12,24] are standardized by the SAE USCAR38-2 [12] and USCAR45 [13], as well as the standard IEC 60352-9:2024 [24]. These standards define and require two test forms, tensile peel testing and tensile shear testing, which is used accordingly in the research, e.g., Bergmann et al. used shear testing to qualify nickel coatings of terminals [17]. To determine the quality of welded sheets, often only one test method is used in the literature [2,4,5,6,9,13,14,23,25]. The form of the test is usually determined by the specimen geometry. Due to the large weld area compared to the workpiece cross-section, often only peel tests are possible [2,4,23,25]. Peel tests are significantly dependent on the force application angle, the deformation of the sheets, as well as on the local distribution of the micro-welds in the joint area. The testing method does significantly scatter. While conducting a shear tensile test without regarding the geometric constraints, the part geometry can cause a premature failure in the base material that is far below the possible joint strengths [9] that have been observed for similar joint sizes and materials [11]. In this case, no relevant information on the joint strength can be derived. The mechanical joint quality is also frequently used to evaluate the influence of disturbance variables on joint formation, such as surface states [11,17,21,22,26], component geometries [11,18,19] or material hardness [11,23].
For the development of production monitoring systems for USMW, quality prediction methods using external sensors and machine learning have been under investigation [9,11,14,23,25]. Often not only a classification of good/bad welds is proposed but a quantified prediction of the joint quality [9,25]. The mechanical joint strength is primarily used as the target quality, indicating the value of the prediction models, which requires a corresponding quality of the test and quality parameter itself. Quality prediction models are trained to predict either the maximum tensile shear force [9,11] or maximum tensile peel force of the joint [23,25].
In addition to assessing the mechanical joint quality, microstructural analysis using light microscopy or scanning electron microscopy offers insights into grain structure, intermetallic formation, and interface morphology, which is crucial for understanding bonding mechanisms such as dynamic recrystallization, adhesion and diffusion [4,6,17,27].

1.3. Real Welding Area and Specific Strength

The real joint area achieved is particularly complex in ultrasonic welding as it lies between the joining parts. The joint surface area is often equated with the area of the sonotrode imprint, although the joint consists of numerous so-called micro-welds [1,4,5], their extent is dependent on the surface roughness [26], and welding also occurs outside of the tool imprint [1,23]. For this reason, the joint quality is not actually specified as material strength in the joint area, but as maximum force, which also corresponds to the requirement that the mechanical strength is secondary in most electrical applications [12,13,24]. Nevertheless, assessing the real joint area is important for estimating the joint performance for electrical and thermal loads and for comparing it to base material properties [5].
The weld strength and the maximum shear force are related to the joint area, with the strength being expressible as the ratio of these two factors. For dissimilar Al-Cu joints, the area is supposed to grow linearly with increasing welding time [28]. This is induced by the growing number and size of the micro-welds [1,4,10]. Furthermore, dislocation density and grain size refinement play a crucial role in this process. Higher amplitudes, greater normal forces, and longer welding time lead to increased bond strength and higher Linear Weld Density ( L W D ). L W D is defined as the ratio of the bonded interface length to the total interface length [20,27] as
L W D ( % ) = L b L × 100
L W D represents the percentage of the interface length that is successfully welded, as indicated by diffusion [29]. Microsection analysis shows bonding phenomena, but calculating the real weld area from L W D can be error prone. This is due to the preferred direction of micro-welds in the vibration direction and the complex geometry, roughness, and unbroken edges of the sheets, which are not fully captured in a 2D section analysis [4,10,11,23].
For dissimilar joints, the fracture surface was assessed to determine the joint area size [3,8,28]. The main focus is on material residues on the surfaces. This neglects the fact that most models of joint formation are based on relative movement with material plastic deformation as well as the re-breaking of micro-welds at the start of welding. For welds with different material hardnesses, e.g., Cu and Al, the softer material is incorporated into the imperfections in the surface of the harder material. Li et al. adopted a procedure (acquisition of microscopic pictures and automated evaluation based on color limits) and analyzed the fracture surfaces for Al-Cu mixed joints [6]. The samples are subjected to shear tensile testing, and the Al remaining on the Cu surface is recorded via the color based on the green hue of the individual pixels (RGB picture), which also relates to the light conditions [3]. It was not explained how a distinction is made between welding and abrasion. Wu et al. used dark field microscopy to identify the effective joint area of USMW of nickel-plated copper sheets, acquiring real weld areas of 1.6% to 2.4% of the sonotrode surface for the optimum identified welding parameters, and the parts are tested via tensile shear testing [8]. Such a small joint area appears exceptionally low. The identified joint surfaces are located in a ring around the weld or the tips of the sonotrode projections [8]. It is therefore reasonable to assume that it is the material displaced outwards during welding that is being measured rather than the joint surface. Shear tensile tests are not considered suitable for such analyses due to the typical smearing of the joint zone and the fracture pattern [1,4,14]. The analysis method is furthermore not suitable for welds of similar material.
The analysis of surfaces to assess the joint for similar joints is more complicated but has been demonstrated in non-quantitative outlines [1,4,8]. For example, DeVries assessed the outer position of micro-welds to assume the contact pressure during welding [1].
In a previous investigation [14], the authors demonstrated the basic feasibility of automated evaluations of fracture surfaces of similar material joints using microscopy pictures after prior preparation by means of oxidation with few samples. For two pure copper sheets (EN CW004A), the development of the joint strength in a peel tensile test and the formation of the real weld area were shown in rough time steps from the start of the welding process to the optimum welding time. The results indicate a continuous growth of the area and welding strength for the investigated parameter range, yet no model was set up. The pictures were automatically analyzed, and distinctive colors (RGB) were used to determine the welded area [14]. Figure 1 shows an oxidized sample prior to testing (a) and a macroscopic picture of the failure surface of two oxidized sheets after peel testing (b). In the figure, the purple surface discoloration due to oxidation and the oxide-free, bright fracture surface can be seen. Around the fracture surface in Figure 1b, brown and green areas indicate contact of the sheets after welding, slowing the oxidization process, but no material bond. The method could therefore be suitable for distinguishing between joint surfaces destroyed during welding and those destroyed during testing.

1.4. Conclusion on the State-of-the-Art and Aim of This Study

USMW continues to gain industrial importance due to its growing markets, electrification, and e-mobility for similar and dissimilar welds. The joint is formed through numerous micro-welds, which are distributed over the entire joint surface and grow in number and size over the welding time. The joint quality is essentially determined by the maximum achieved forces during mechanical peel or shear tensile tests. For wire-terminal joints, both test types are required by the standards, but for sheet weld, the test type is chosen depending on the geometry of the part. The mechanical tests and quality features are subject to errors, as they depend on base material strength and the geometry of the specimens, and only a simple maximum value is evaluated. Therefore, mechanical tests do not necessarily provide reliable quality information, particularly in the case of tensile peel tests. Reliable quality determination methods are needed for process development, joint evaluation, joint formation studies, and quality prediction models. The quantitative evaluation of fracture surfaces is a promising alternative or supplement to mechanical testing methods to improve the evaluation of joint quality.
For dissimilar welds, the real joint area was determined based on material residues on the fracture surface after mechanical testing. However, this evaluation is highly questionable due to the relative movement of the parts to be joined during welding, and during the shear tensile test, the softer material can smear on the surface. Such an analysis has not yet been carried out with the required number of tests for welded similar joints, though an analysis of roughness and oxidized surfaces seems feasible. Alternatives, such as the evaluation of micrographs, are not suitable due to the effort involved and the evaluation of only one line of contact (LWD), which, for example, ignores the 3D structure of the tools.
The aim of this study is to model the growth of different quality features and real joint area over the course of the welding of a similar joint, compare them and finally derive models for the joint quality and joint strength. The mechanical quality features are correlated with the status of joint formation and optical evaluation of the fracture surfaces, thereby demonstrating the feasibility of an optical evaluation as an alternative or additional quality measure for USMW joints of sheets. This optically determined type of quality feature evaluates the complete joint, providing a valuable feature for process development and quality control for geometries that can only be peel-tested.
Figure 2 shows the experimental and analysis approach developed for this study. Similar USMW welds are carried out for pure copper sheets (EN CW004A/EN CW004A) with increasing welding times (start of the process to optimum parameters and over-welding) so that all postulated stages of joint formation are covered. The sample setup resembles busbar and power electronic applications. Here, current collectors are welded onto the copper substrate or onto each other using USMW. The samples are then prepared for mechanical testing, tested, and the fracture surface is recorded using a confocal laser scanning microscope. Methods for determining the joint area are subsequently developed, and finally, models for the joint formation for different mechanical tests and the joint area are compared, resulting in models for joint strength over welding time.

2. Materials and Methods

The investigation is conducted with two different test series to represent typical testing scenarios for sheet joints. Test series 1, representing, e.g., busbar applications, consists of two orientation variants of the same two sheets, one for tensile shear testing and a variant with a 180° rotated upper plate orientation to allow tensile peel testing for comparison. The specimen configurations are depicted in Figure 3 and incorporate a welding area of up to 64 mm2 and a sheet cross-section of 30 mm2. Test series 2, representing power electronic applications, is not suitable for shear testing due to the large joint area (up to 16 mm2) compared to the joining part cross-section (2 mm2). While test series 1 features two identical sheets with 1 mm thickness, test series 2 incorporates a thin upper plate with 1.5 mm thickness and a thick lower plate with 0.5 mm thickness, imitating the comparable setup of a massive substrate and a thin upper current collector found in power electronic applications [2,9]. For the test series, individual welding parameters and mechanical testing setups were applied.

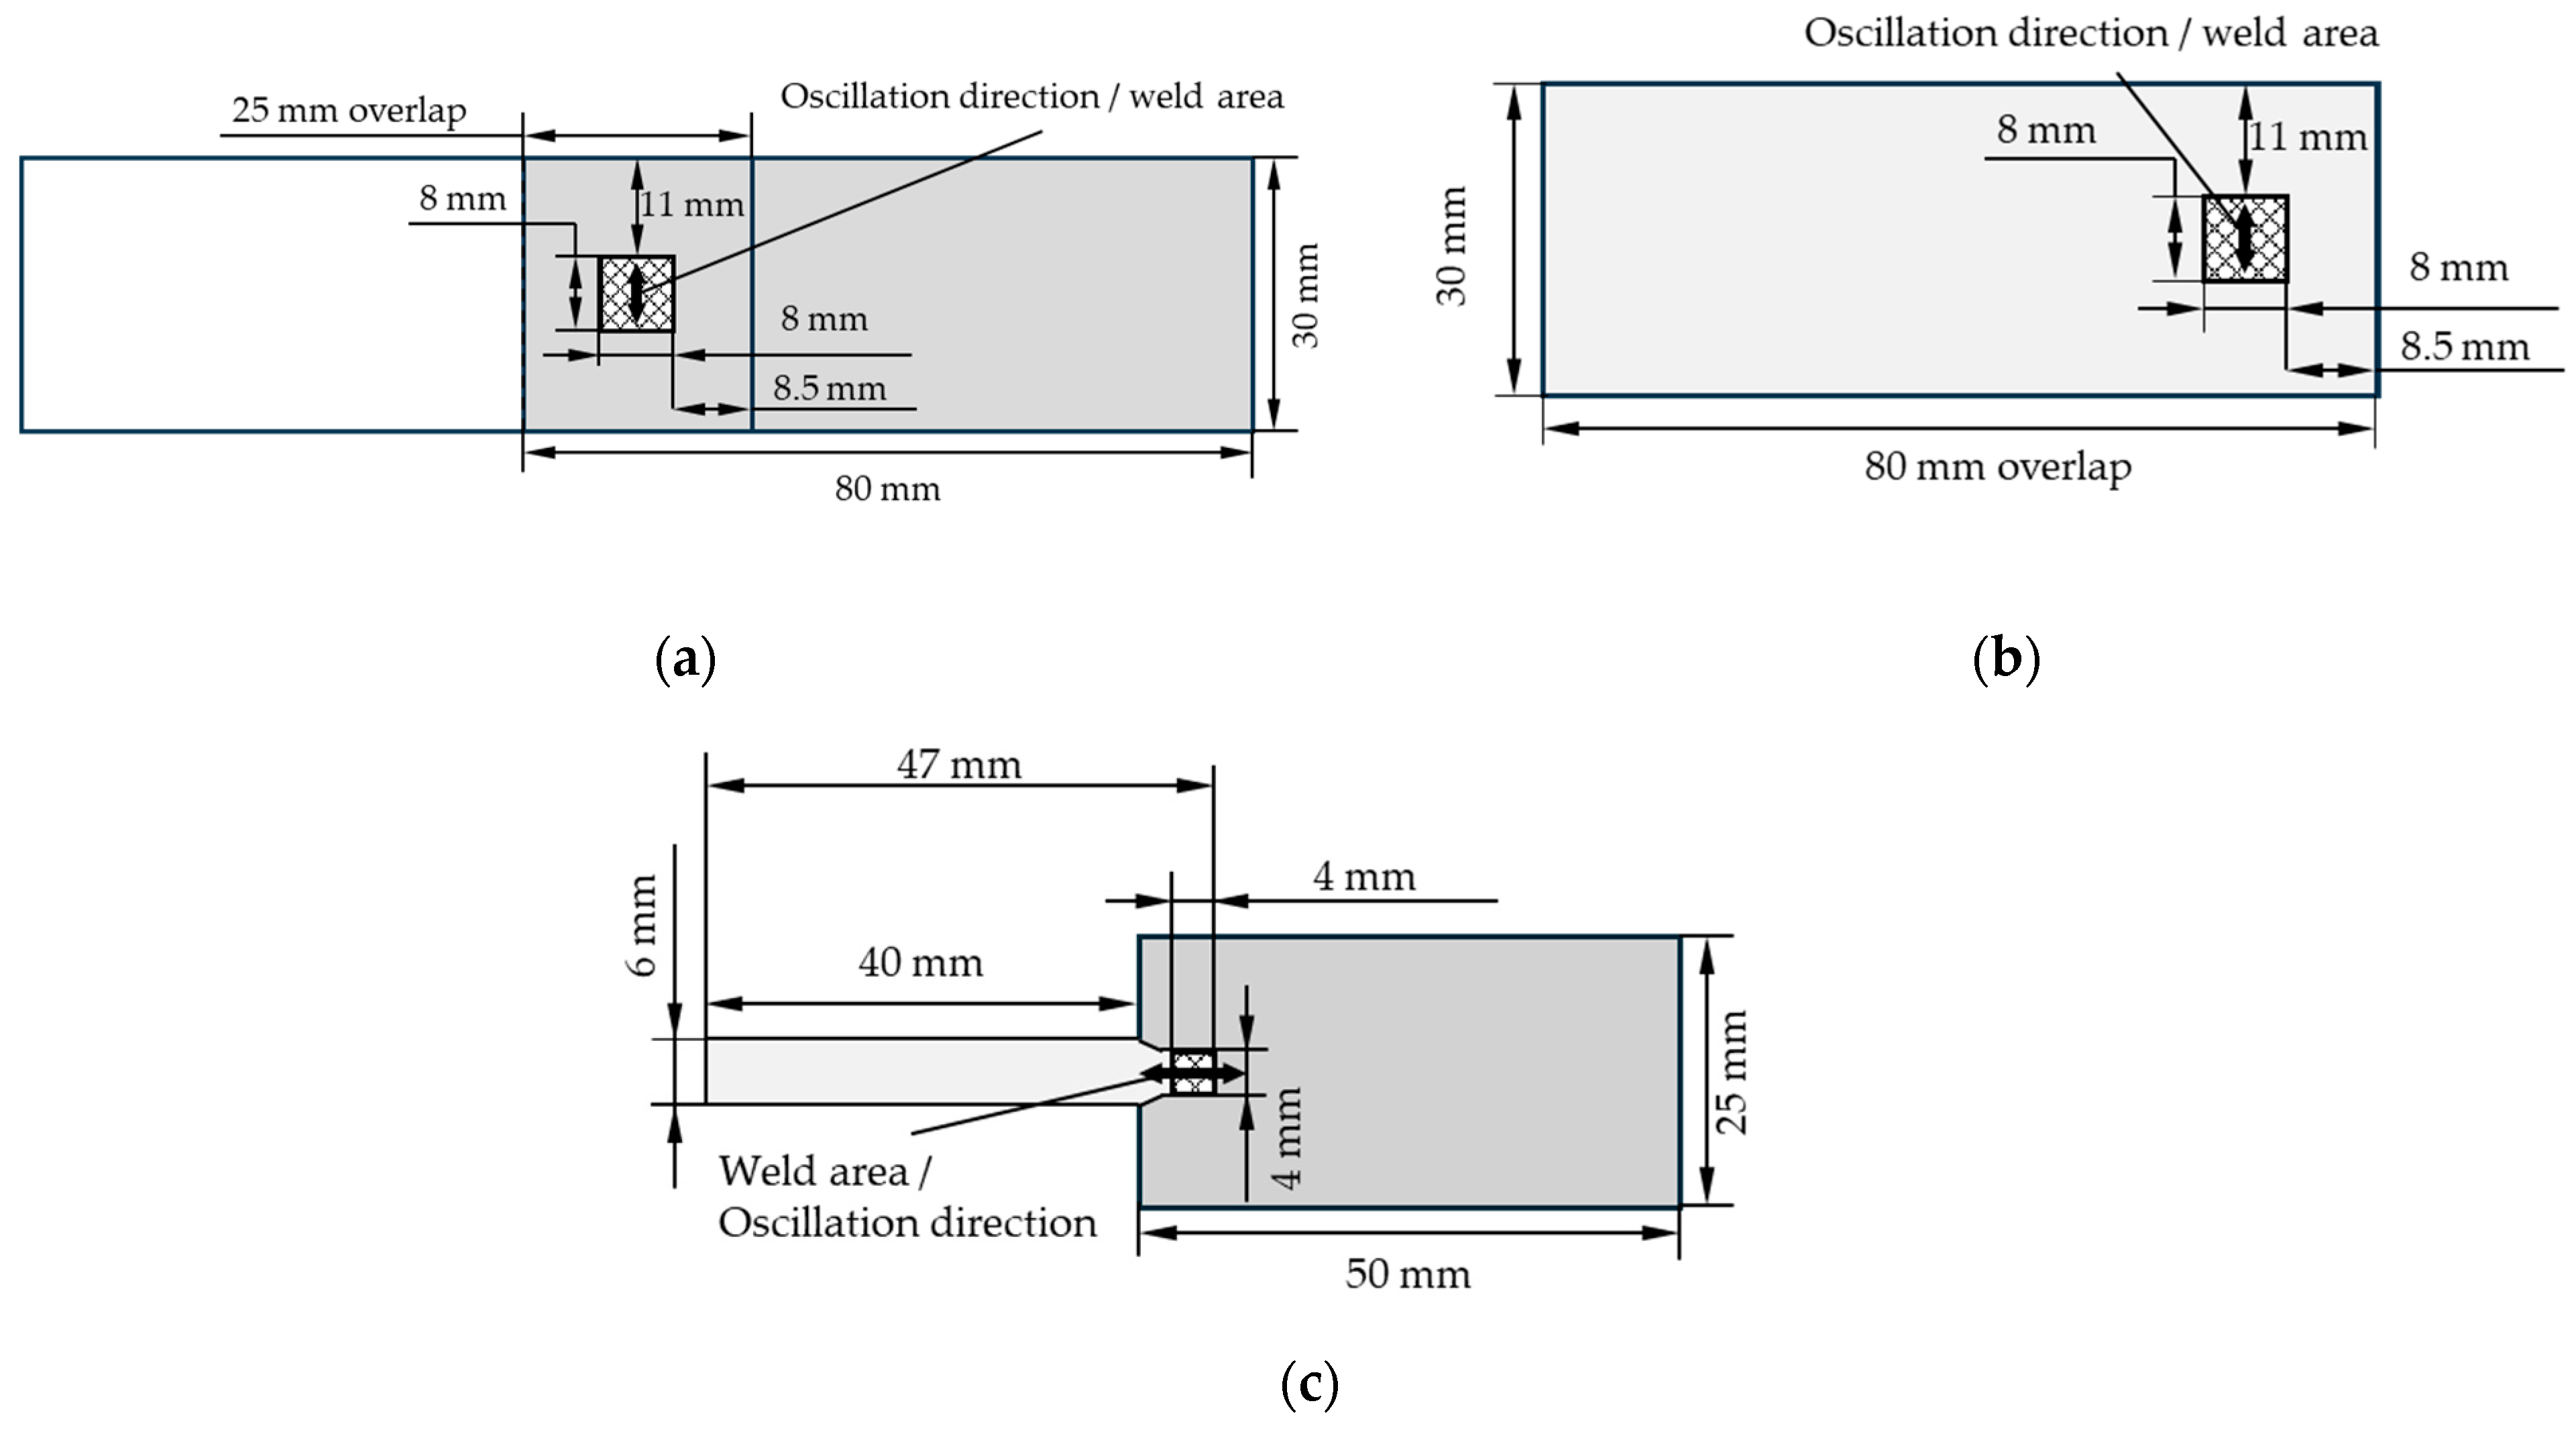
2.1. Materials and Welding Processes

All experiments were conducted with cold-rolled, pure copper sheet material. Table 1 lists the material codes specified and the tested mechanical properties. In addition to the reference state half-hard cold-rolled copper plate, test series 1 also includes soft and hard rolling states of the same material. The base material hardness leads to different joint strength and failure modes [11,23]. In addition, different rolling states may impact the natural frequency and the vibration response of the sheets to the working vibration of the welding tool [18,19]. Test series 2 only has one material configuration. The maximum tensile strength RM is measured in the rolling direction of the individual sheets and determined according to standard DIN EN ISO 6892-1 [30].
The sample material used was cleaned with isopropanol prior to welding. The surface topography corresponds to the rolled condition with no additional changes to the state of cleanliness or roughness (see [11,22,26]). Further information on the base material, including the surface state and chemical composition, is provided in the annex in Table A1 and Table A2 in Appendix A. The welding experiments were conducted on a Schunk Sonosystems GmbH LS-C, Wettenberg, Germany, with a 4 kW generator, using optimized welding parameters based on a design-of-experiments with two iterations of a central composite design for each test series. All configurations of test series 1 feature the same set of parameters, optimized for the “half-hard” rolling state material. The parameter study and detailed investigation of influence factors is extensively described in previous publications [11,14]. For test series 2, a corresponding detailed description of the parameter determination and the welding process results under industry-relevant welding material disturbances is planned in future publications and will not be addressed in detail at this point. Table 2 summarizes the distinctive welding parameters and welding tool configurations. In both test series, the weld-energy-determining parameter in the form of a welding time is varied in stages.
Each welding experiment (time step) in test series 1 was repeated four times (three samples for tensile shear testing, one sample for peel testing). Each welding experiment of test series 2 was repeated five times; all were tensile peel-tested.

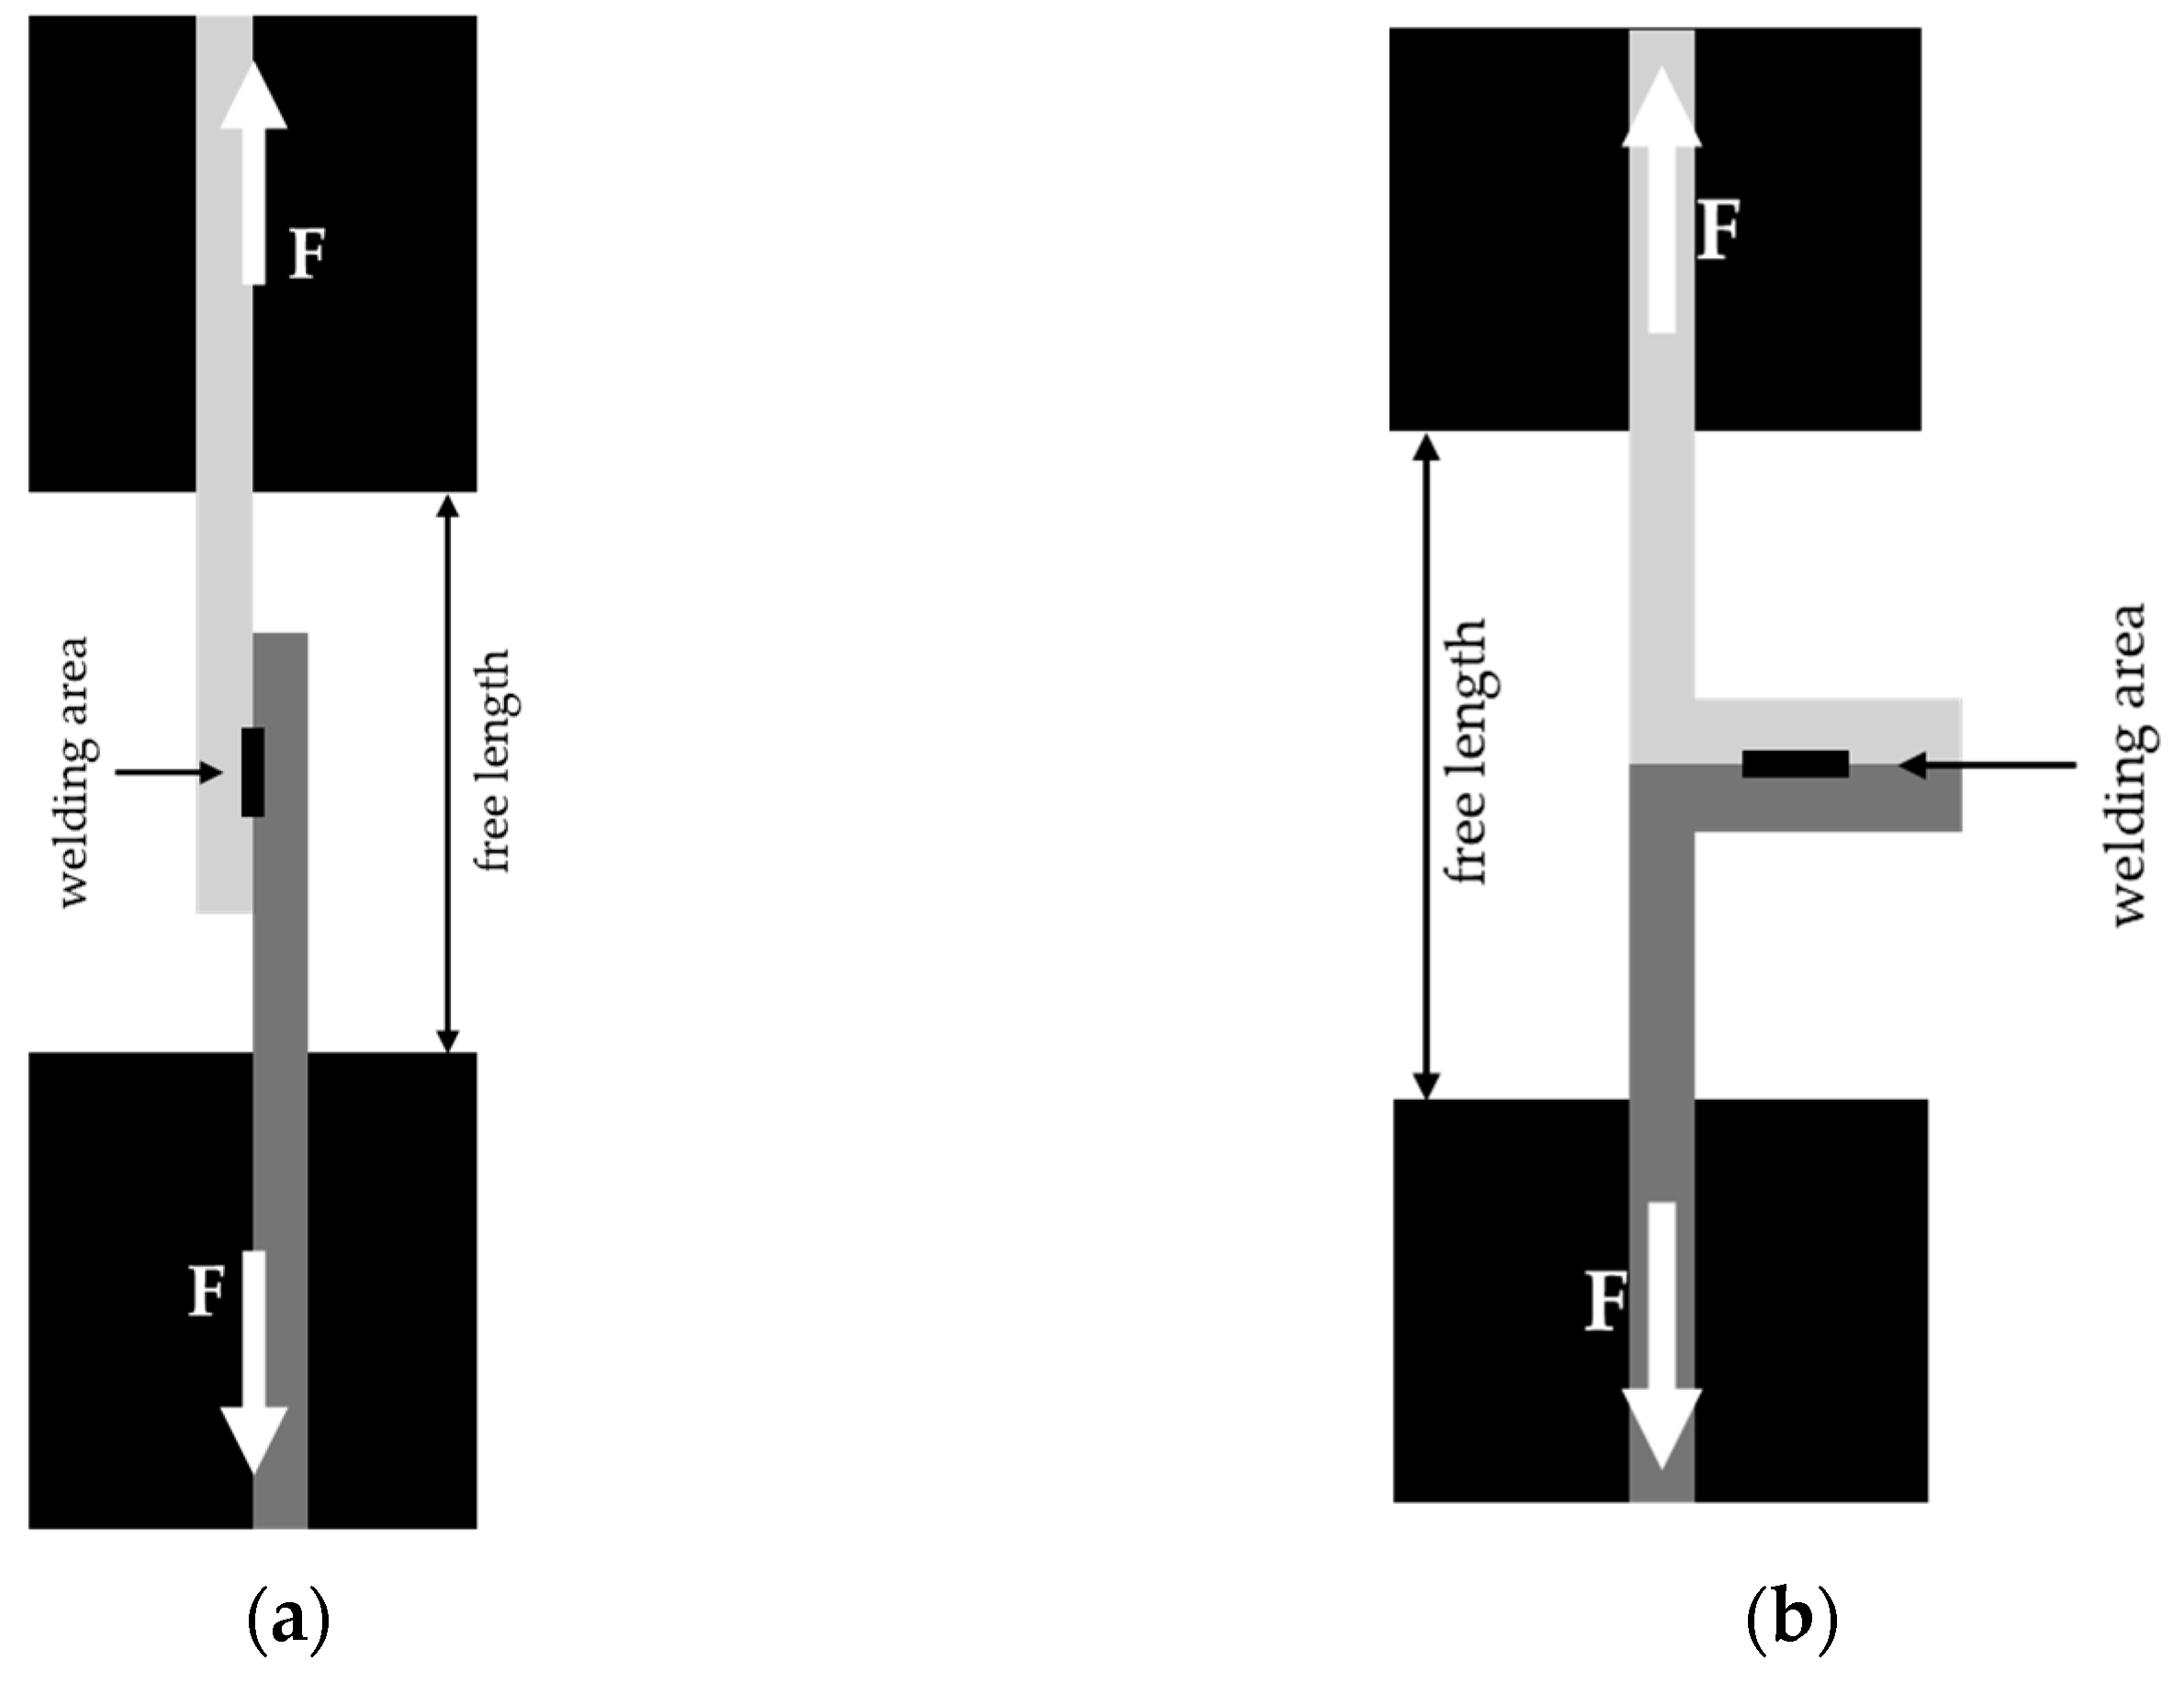
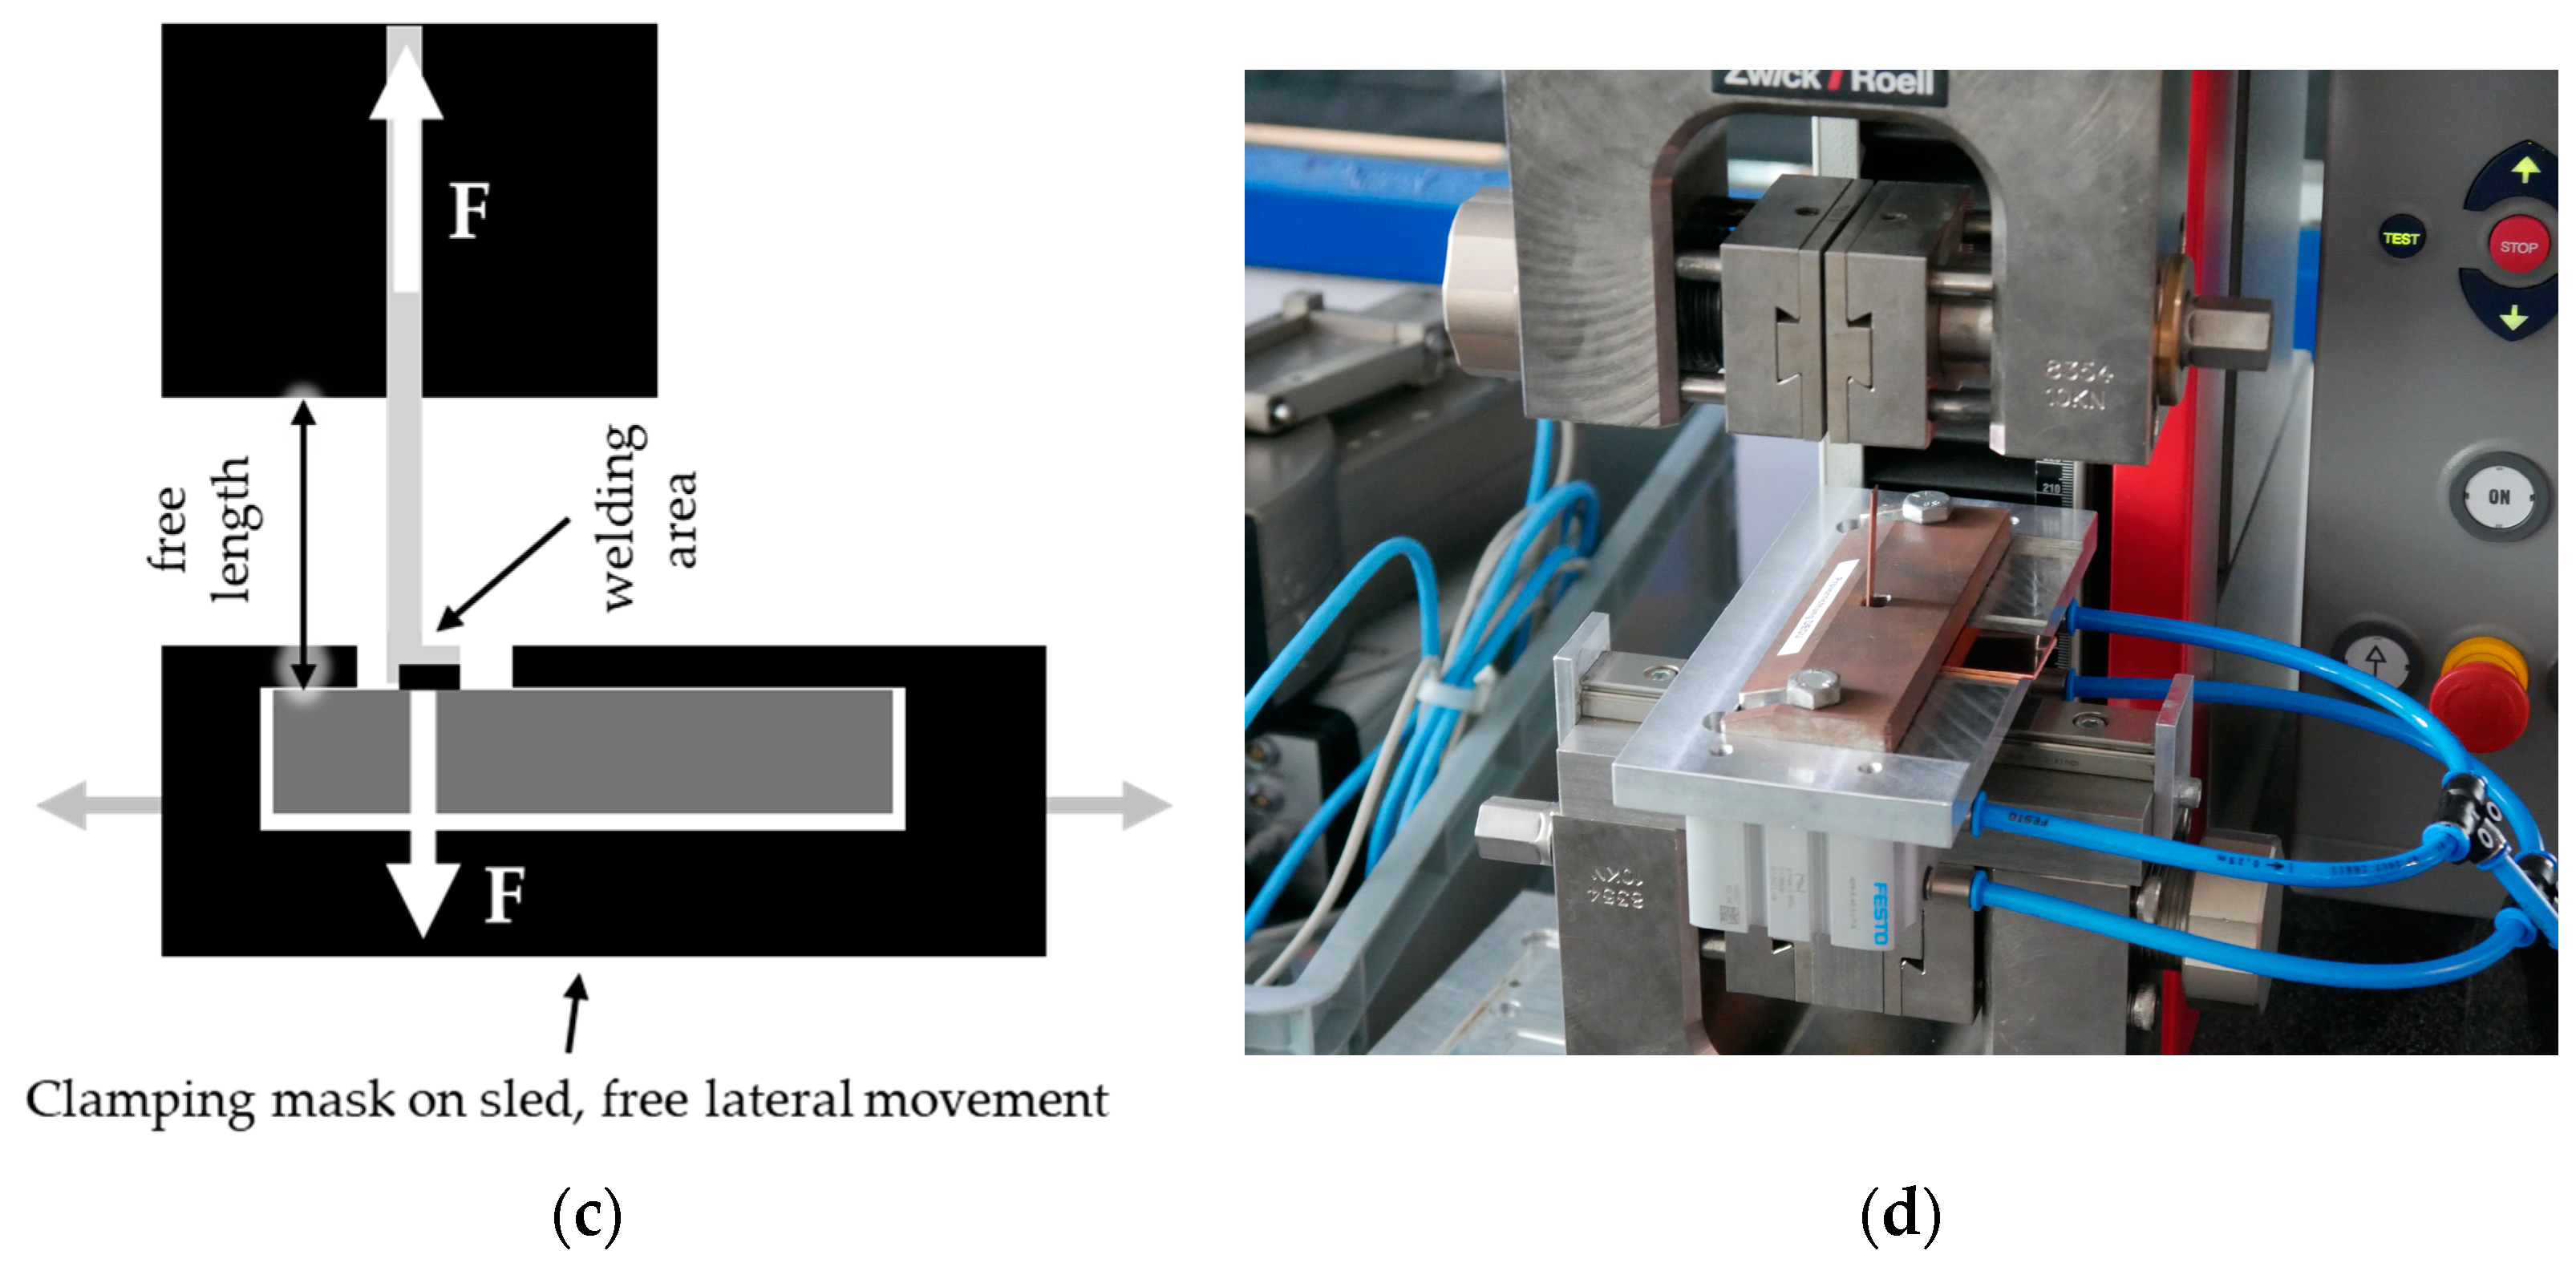
2.2. Mechanical Testing

Figure 4 shows the tensile setups used: shear tensile test (Figure 4a) and peel tensile tests (Figure 4b) from test series 1, conducted on a Zwick Z010 universal testing machine (ZwickRoell GmbH & Co. KG, Ulm, Germany) with a ±10 kN load range. The welding parts were secured using wedge screw grips, and the test parameters are listed in Table 3. Samples were clamped with 50 mm free length and evenly divided to position the joint spot centrally. For peel testing, sheets are bent at 90°, 25 mm from the edge, matching the shear test specimen’s overlap length. Bending was performed using a vice to limit mechanical loads on the joint to a minimum. Both geometries can move and bend freely during testing, as no backing plate is used.
For test series 2, also depicted in Figure 4 and specified in Table 3, a zwickiLine Z5.0 universal testing machine (ZwickRoell GmbH & Co. KG, Ulm, Germany) was used. This testing machine has a load range of ±5 kN to fit to the smaller force range expected. For the upper plate, screw grips were used for clamping, as schematically depicted in Figure 4c and similar to the ones used in test series 1. The lower part acting as a base plate is fixed around the welding area, with a self-made clamping mask depicted in Figure 4d, and placed on a linear guide. The carriage, or sled, allows the clamping device to move freely during testing, ensuring an almost constant angle of attack of 90° for the tensile peel force. Each specimen was bent during installation in the clamping jig directly at the welding area with no radius, no deformation or bending occurring at the beginning of the peel tests prior to applying stress to the joint.

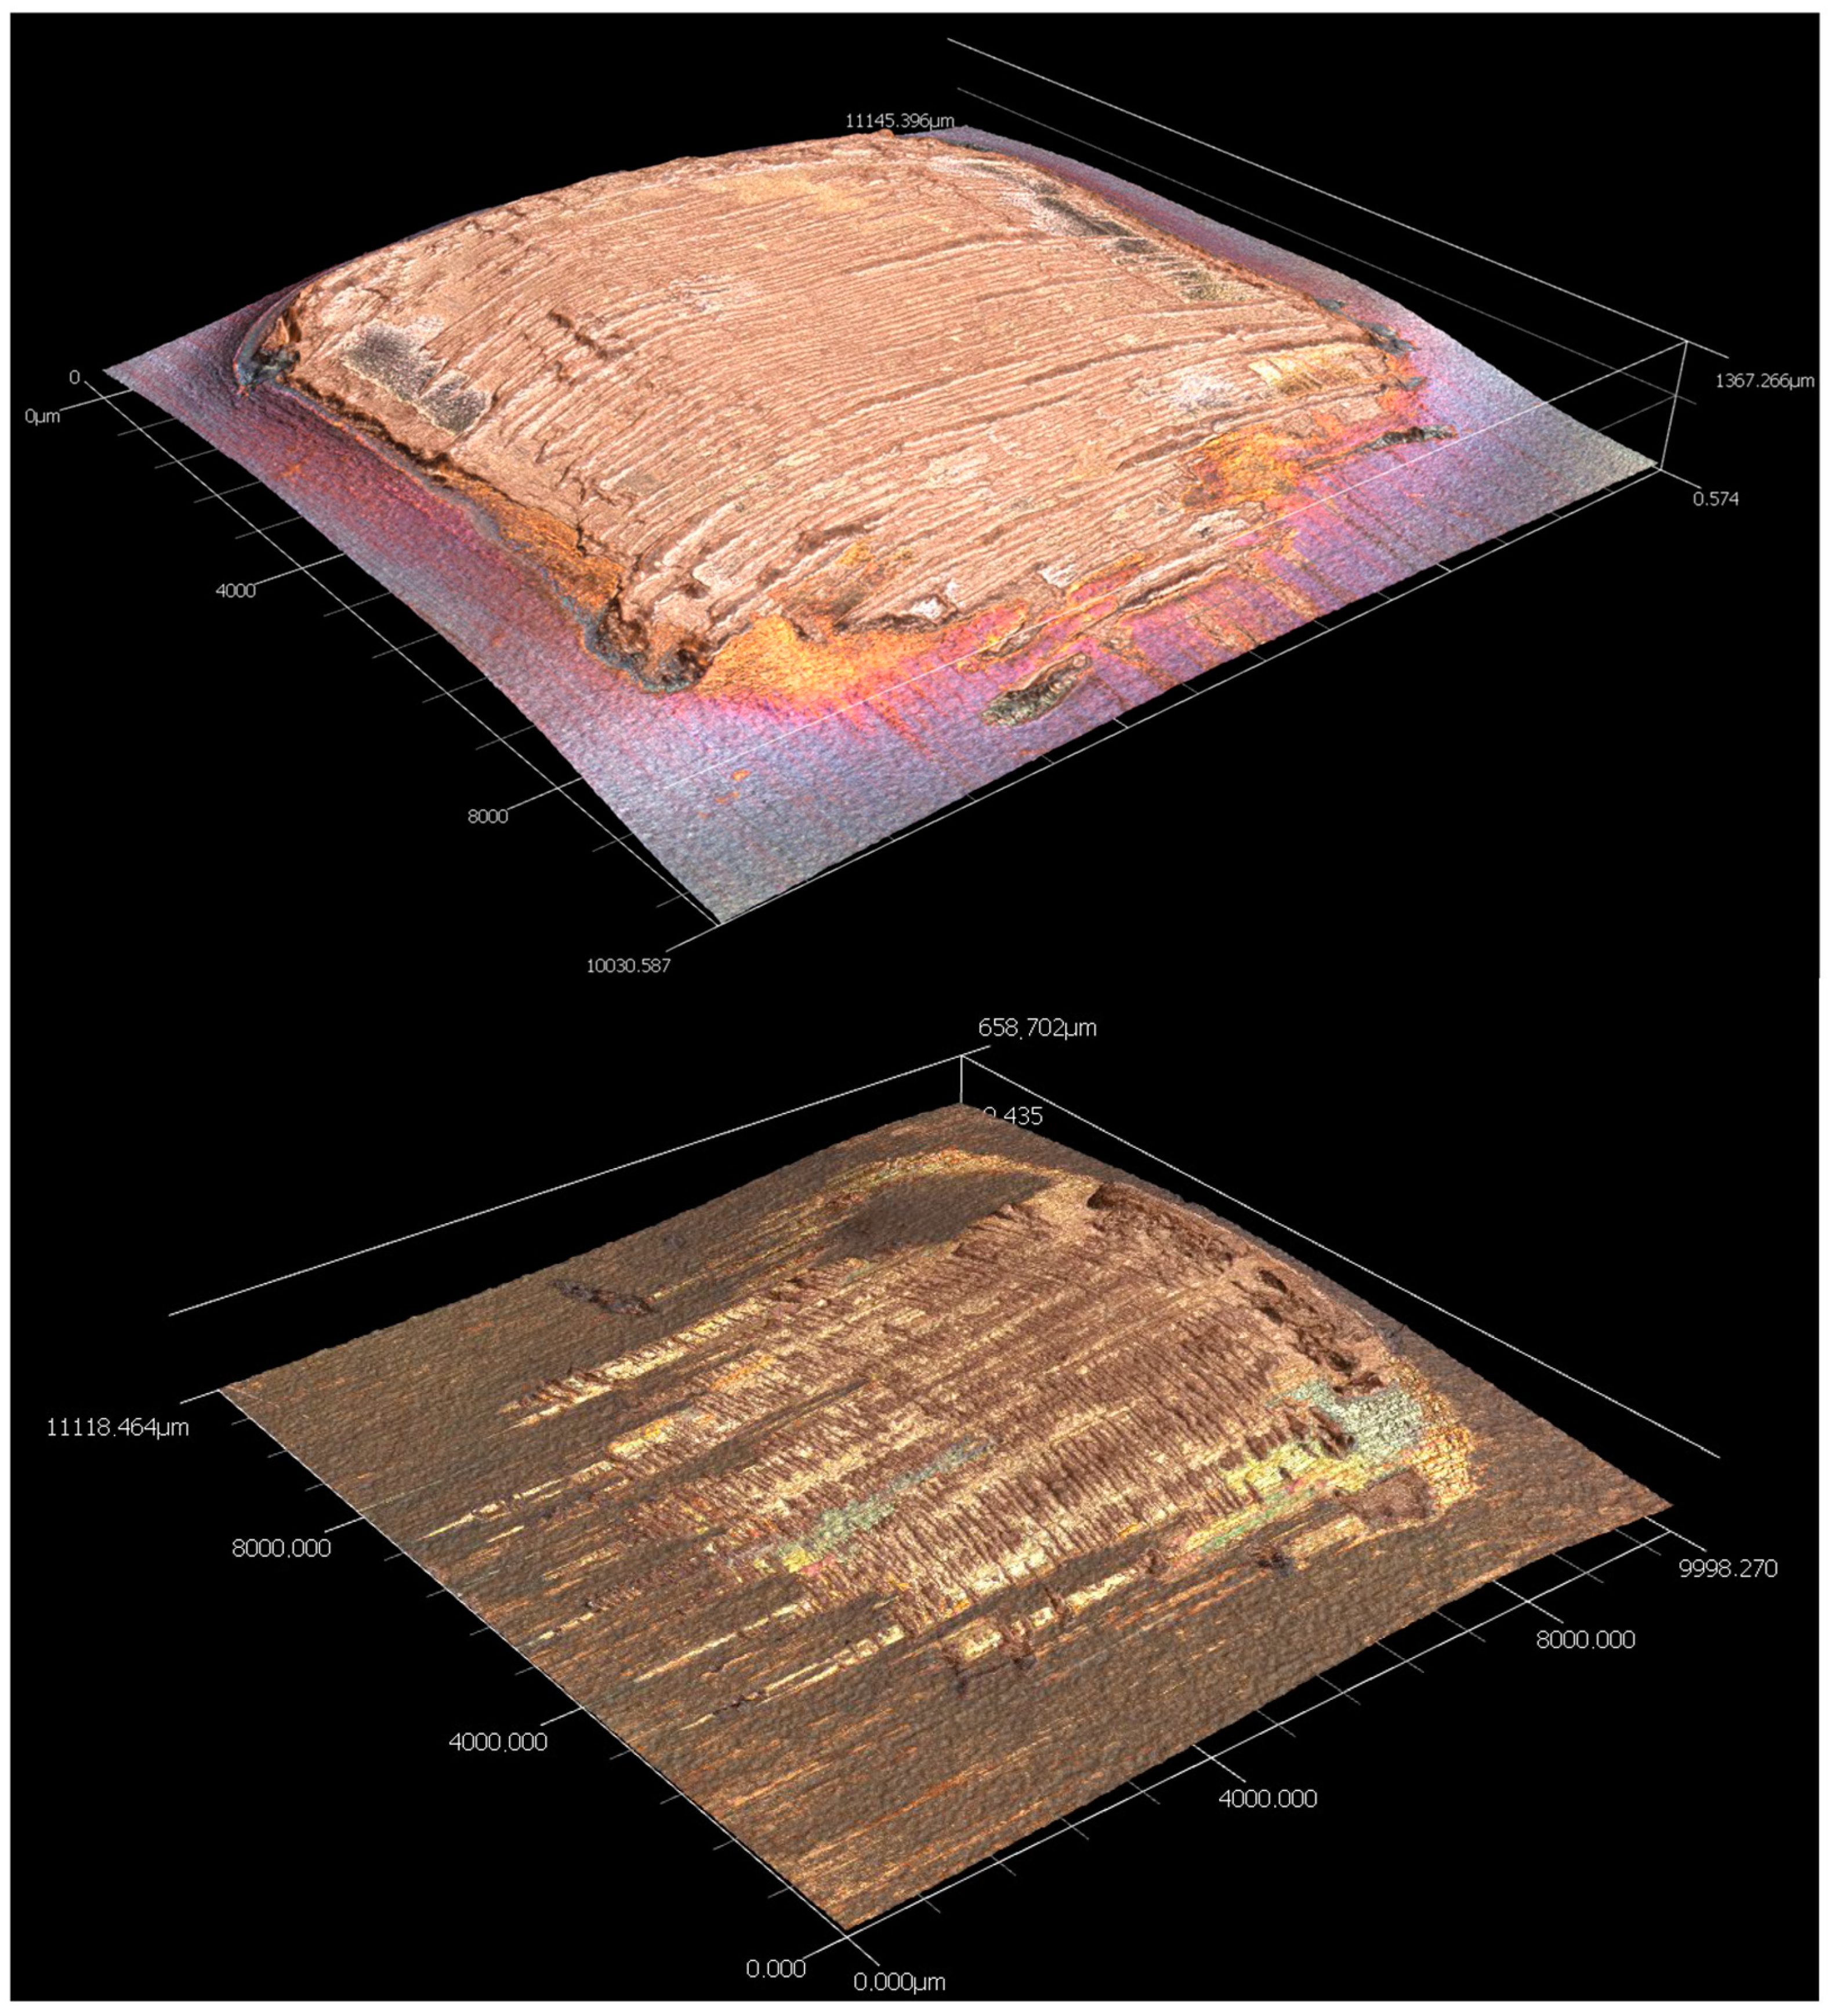
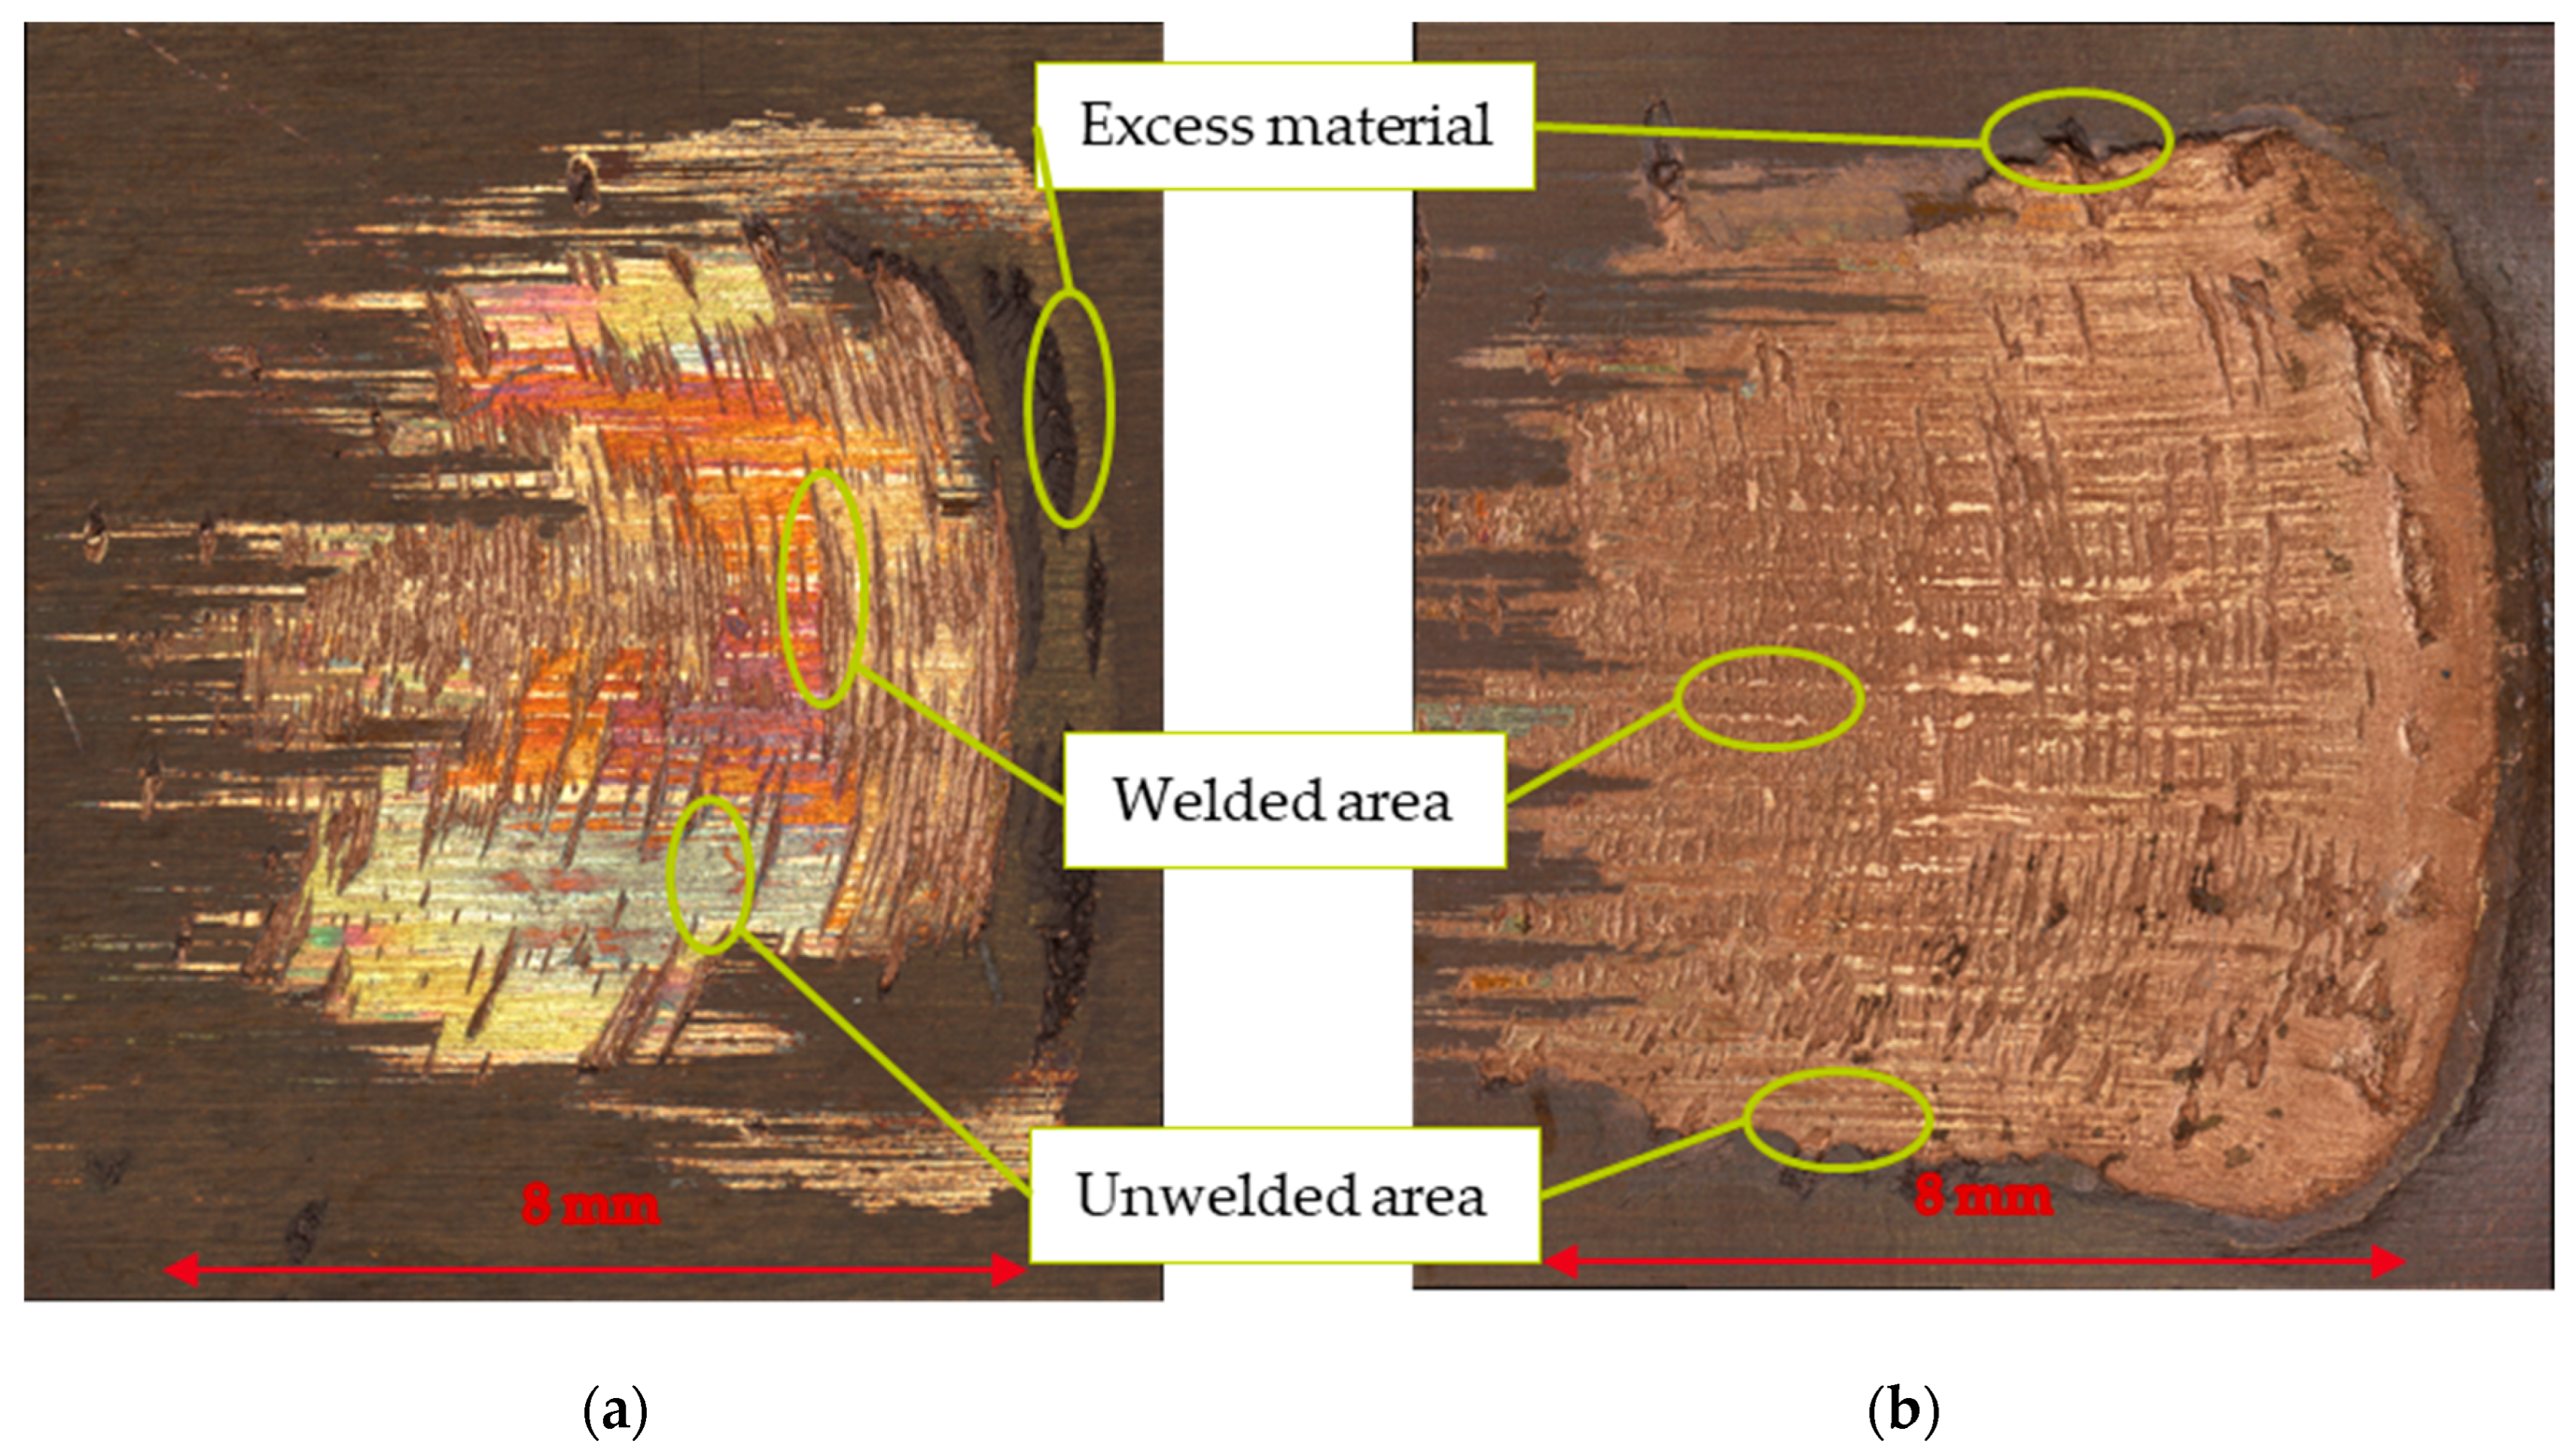
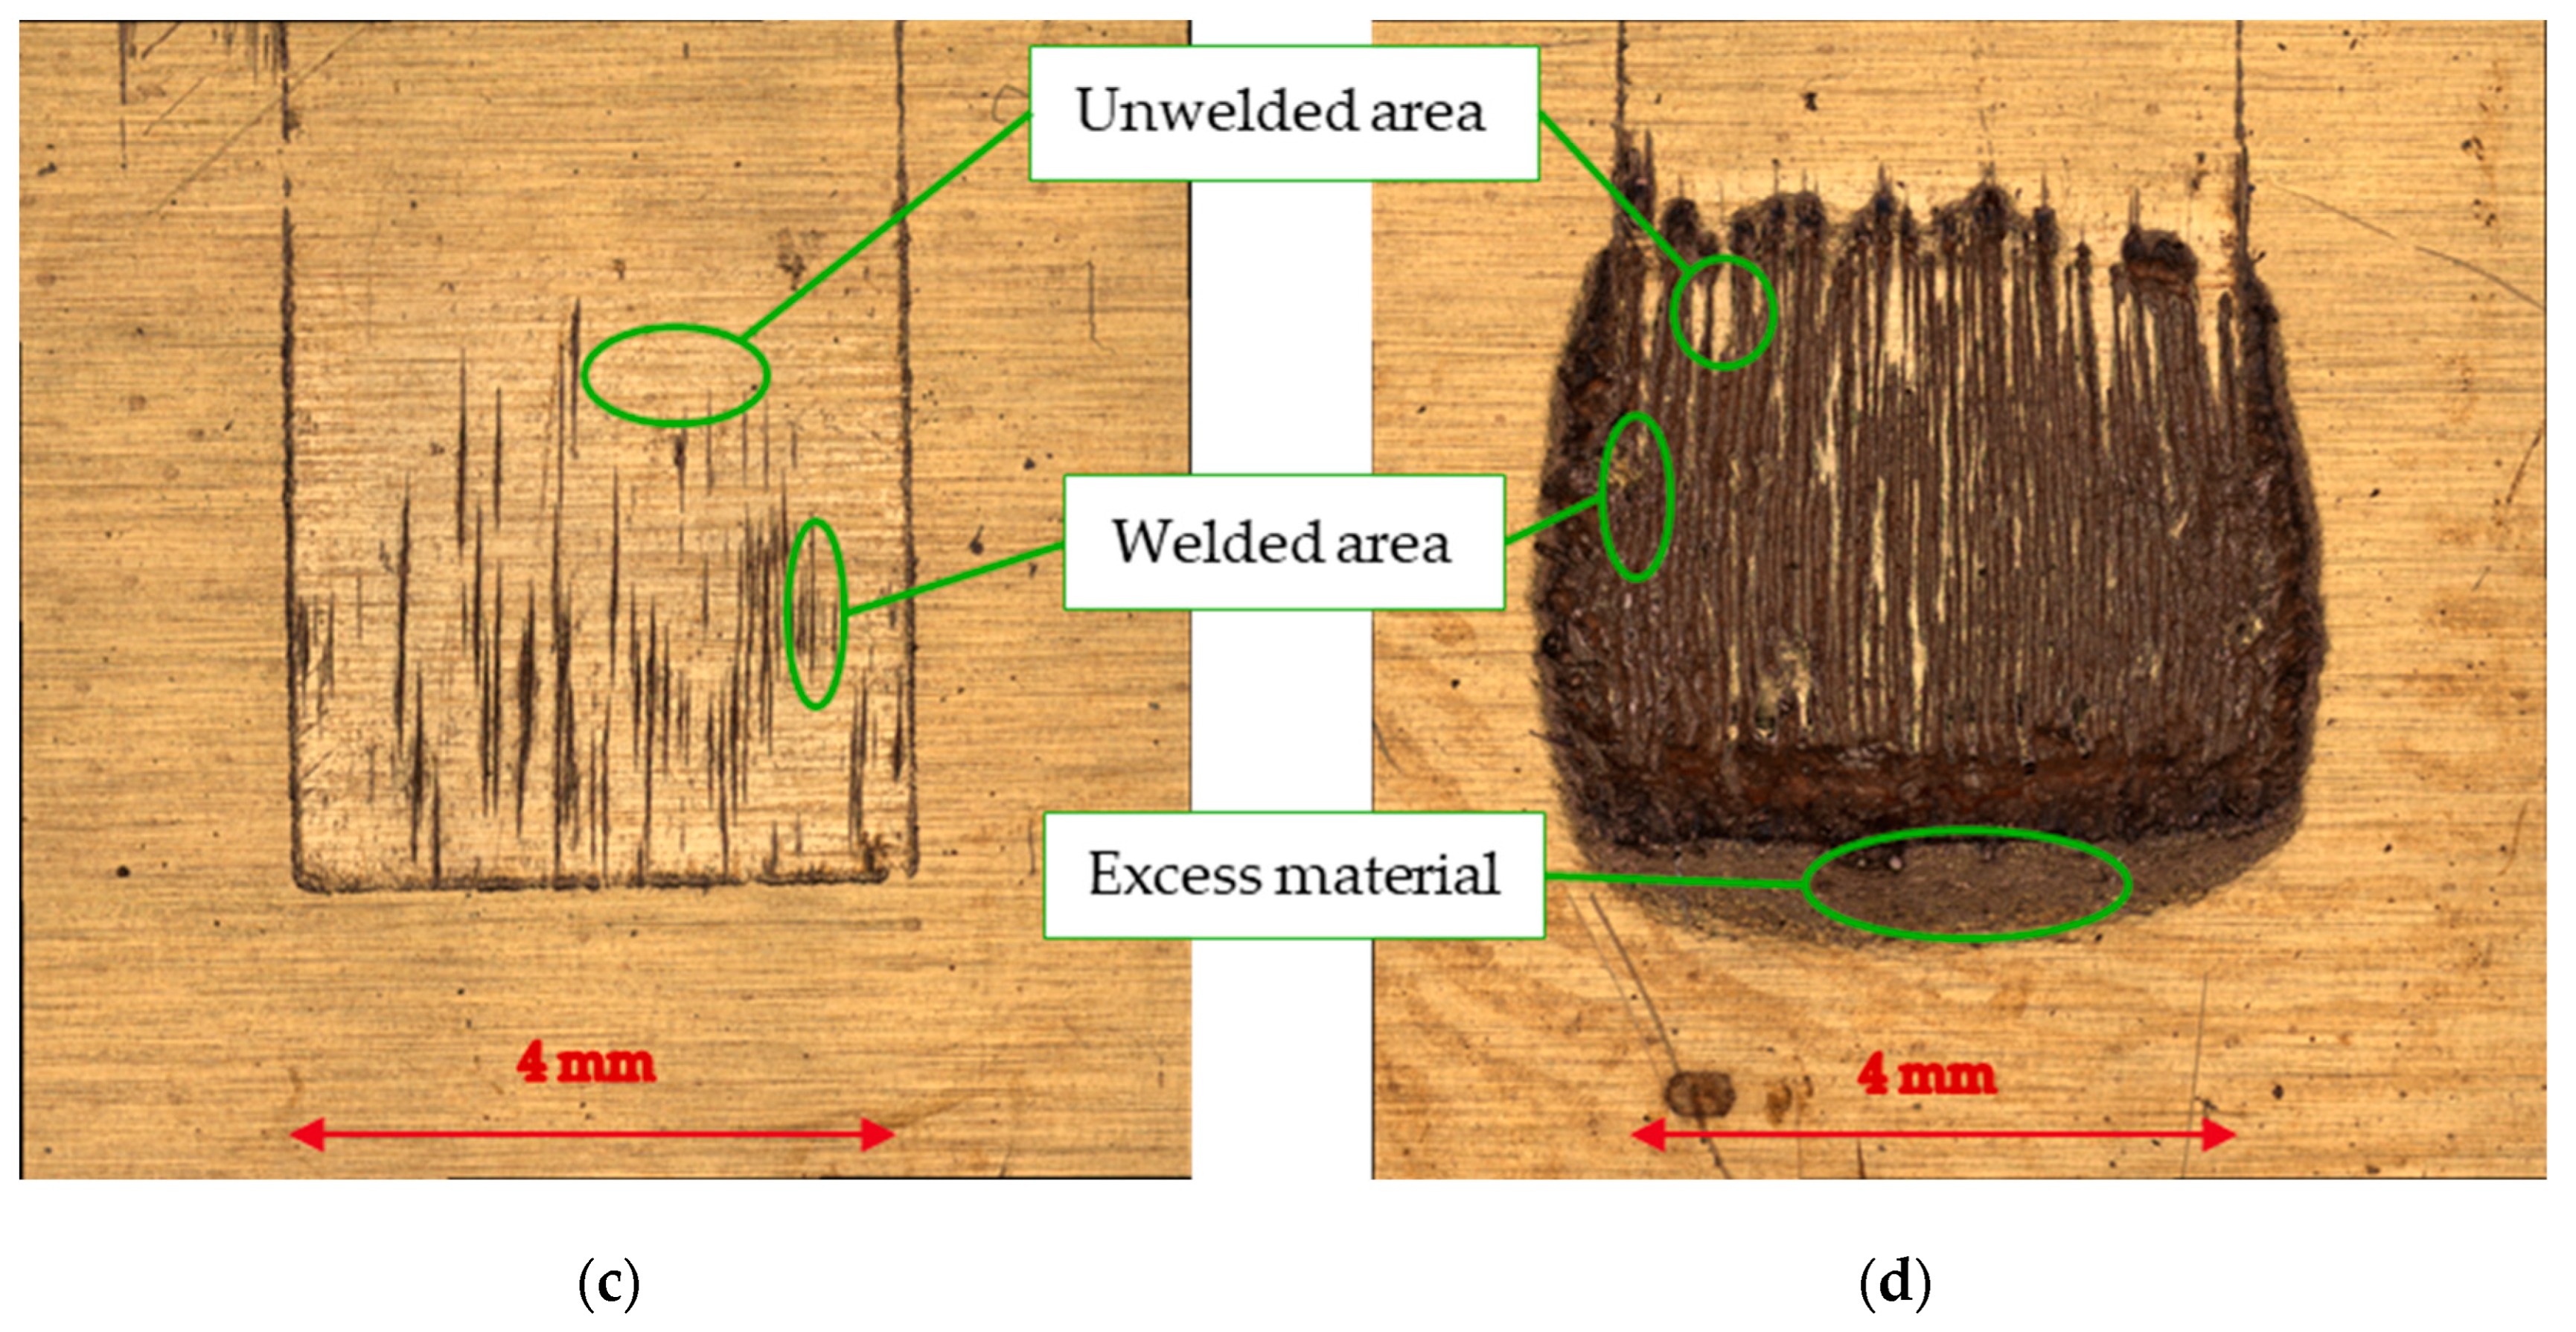
2.3. Image Acquisition and Sample Processing

All microscopic images of the failure interfaces were acquired using a VK-X1050 confocal laser scanning microscope (Keyence Deutschland GmbH, Neu-Isenburg, Germany), measuring both the color and the height of the sample in one acquisition process. Figure 5 shows a resulting 3D depiction of a microscoped sample of test series 1. The image shows the slight curvature due to plastic deformation of the originally flat sheet surface after the peel test.
The sample preparation and the image acquisition of the test series itself differs:
In test series 1, the fractures on the surfaces of the upper and lower plate, which were previously oriented towards the joint zone, are microscoped. The evaluation of both sides of the joint provides additional statistical security. The curvature of the samples resulting from peel testing is shown in Figure 5. For this reason, microscopy with reflected light can only produce images of very different local quality. To improve the images, the unwelded surface is colored by targeted oxidation in an oven before the tensile test to increase contrast, reduce the reflection on the unwelded surface and thus ease lighting and microscopy. The samples are heated for oxidation in the oven at 200 °C for 30 min in an ambient air atmosphere. This leads to oxidation on the copper sheet surface exposed to air, as shown in the introduction (Figure 1). The occurring discolorations can be used as an indicator of a non-bonded joint area. Previous trials using polymer paints, graphite paints, and boron nitride spray in different solvent concentrations to mark the non-bonded areas without exposing them to elevated temperatures were not successful. These were applied to the welded specimen prior to conducting peel tests but proved unsuitable due to the limited accessibility of the non-bonded areas under the tool imprint [4]. Due to the specific properties of copper oxidation, the resulting surface color is not as easily adjustable as, for example, tempering steel, which results in a certain scattering of surface properties despite the pre-treatment. For this reason, it is not possible to adopt our old method [14] for measuring the welding area, i.e., recording and evaluating the color alone, for the new tests. A new approach is developed: after image acquisition, the images are split into a plain color image (RGB) and a matrix containing the individual height information of each pixel. Figure 6 illustrates the overall data flow to obtain the joint area for test series 1 after splitting the data.
In test series 2, only the lower sheet is examined microscopically. Post mechanical testing, the lower sheet is still in a straight condition due to the 1.5 mm to 0.5 mm thickness difference and the surrounding clamping during testing. This condition aids in specimen illumination for image acquisition using both ring and coaxial illumination, effectively highlighting contrasts on the fracture surface. Thus, oven pre-treatment is unnecessary, as exemplified in Figure 7.
Figure 7 not only shows the fracture surfaces as dark marks on the surface but the the sonotrode imprint area is also clearly recognizable. The surface in this area is significantly lighter—more polished—than the surrounding sheet metal surface due to the relative motion of the parts during welding. Surface asperities are reduced [1,4]. Outside the welding area, but still below the upper plate, this effect is not visible. An analysis of the height measurement data of the dark areas clearly shows the characteristics of a fracture surface.

3. Modeling of Joint Quality and Joint Area

In the first step to access the joint quality over the different stages of joint formation, we derive models of the mechanical properties of the joint quality for each quality feature of both test series. We then present the results of the determination of the joint area for both test series and compare these with the respective mechanical quality information.

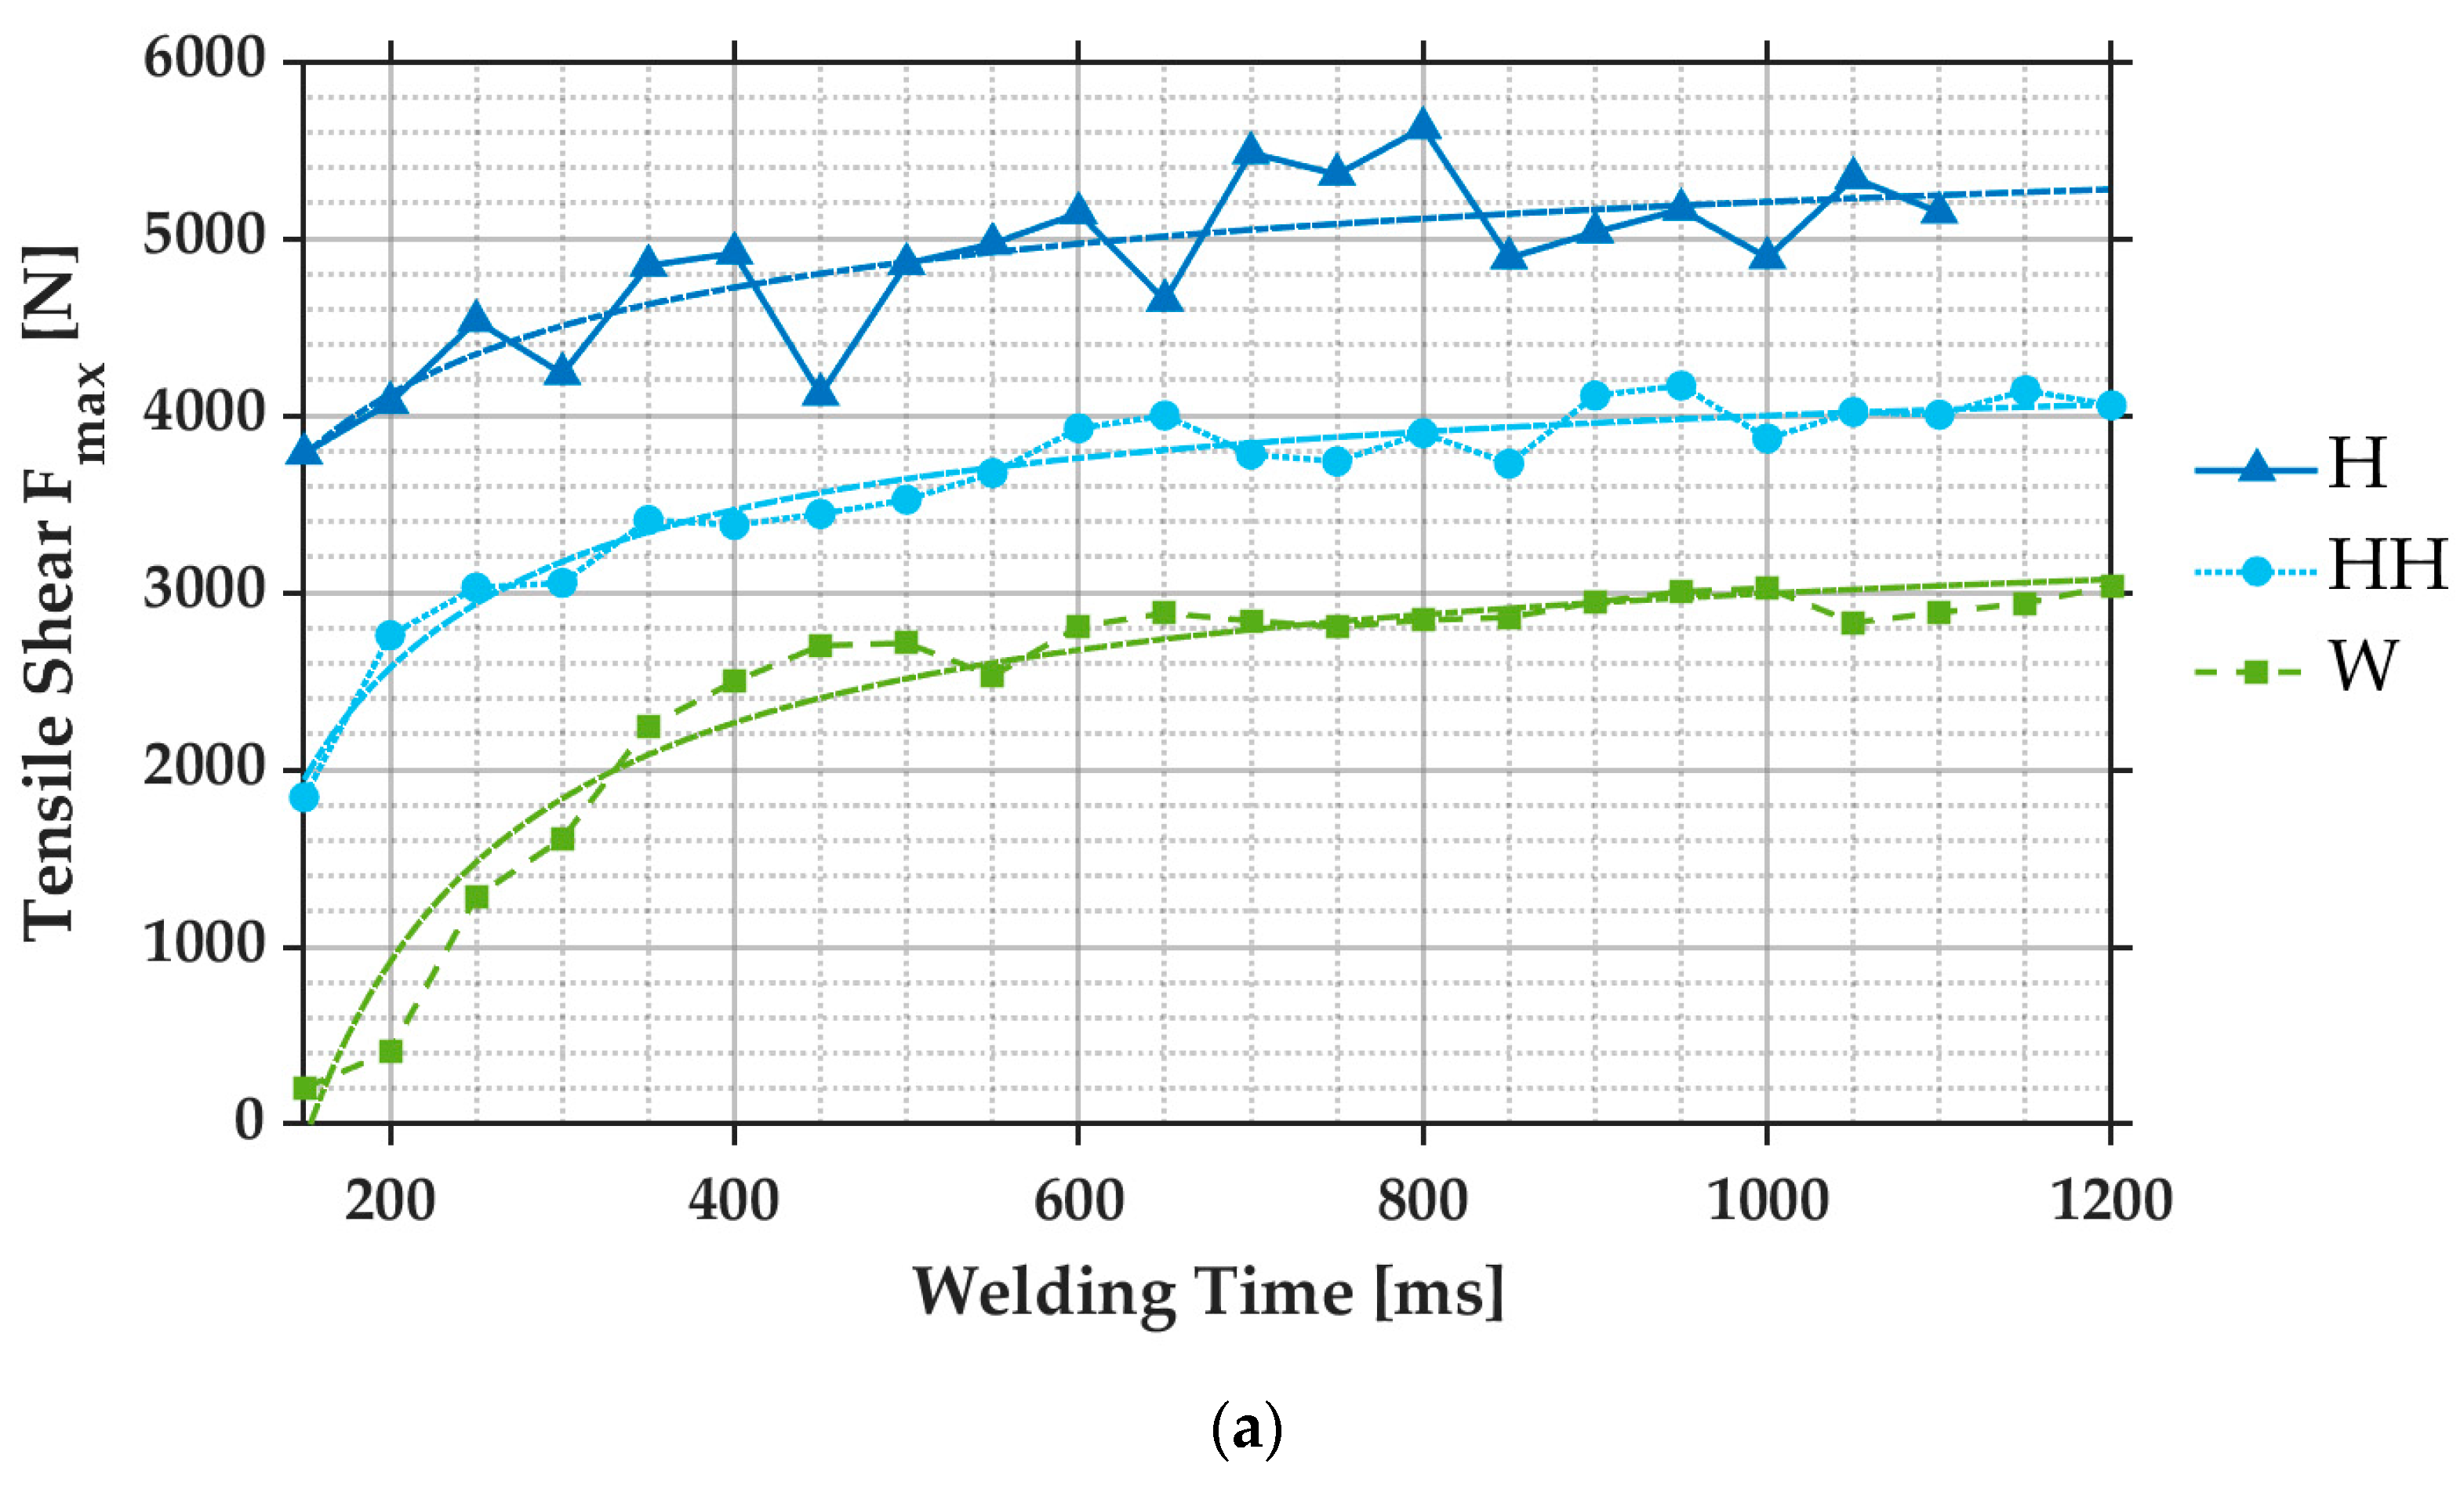
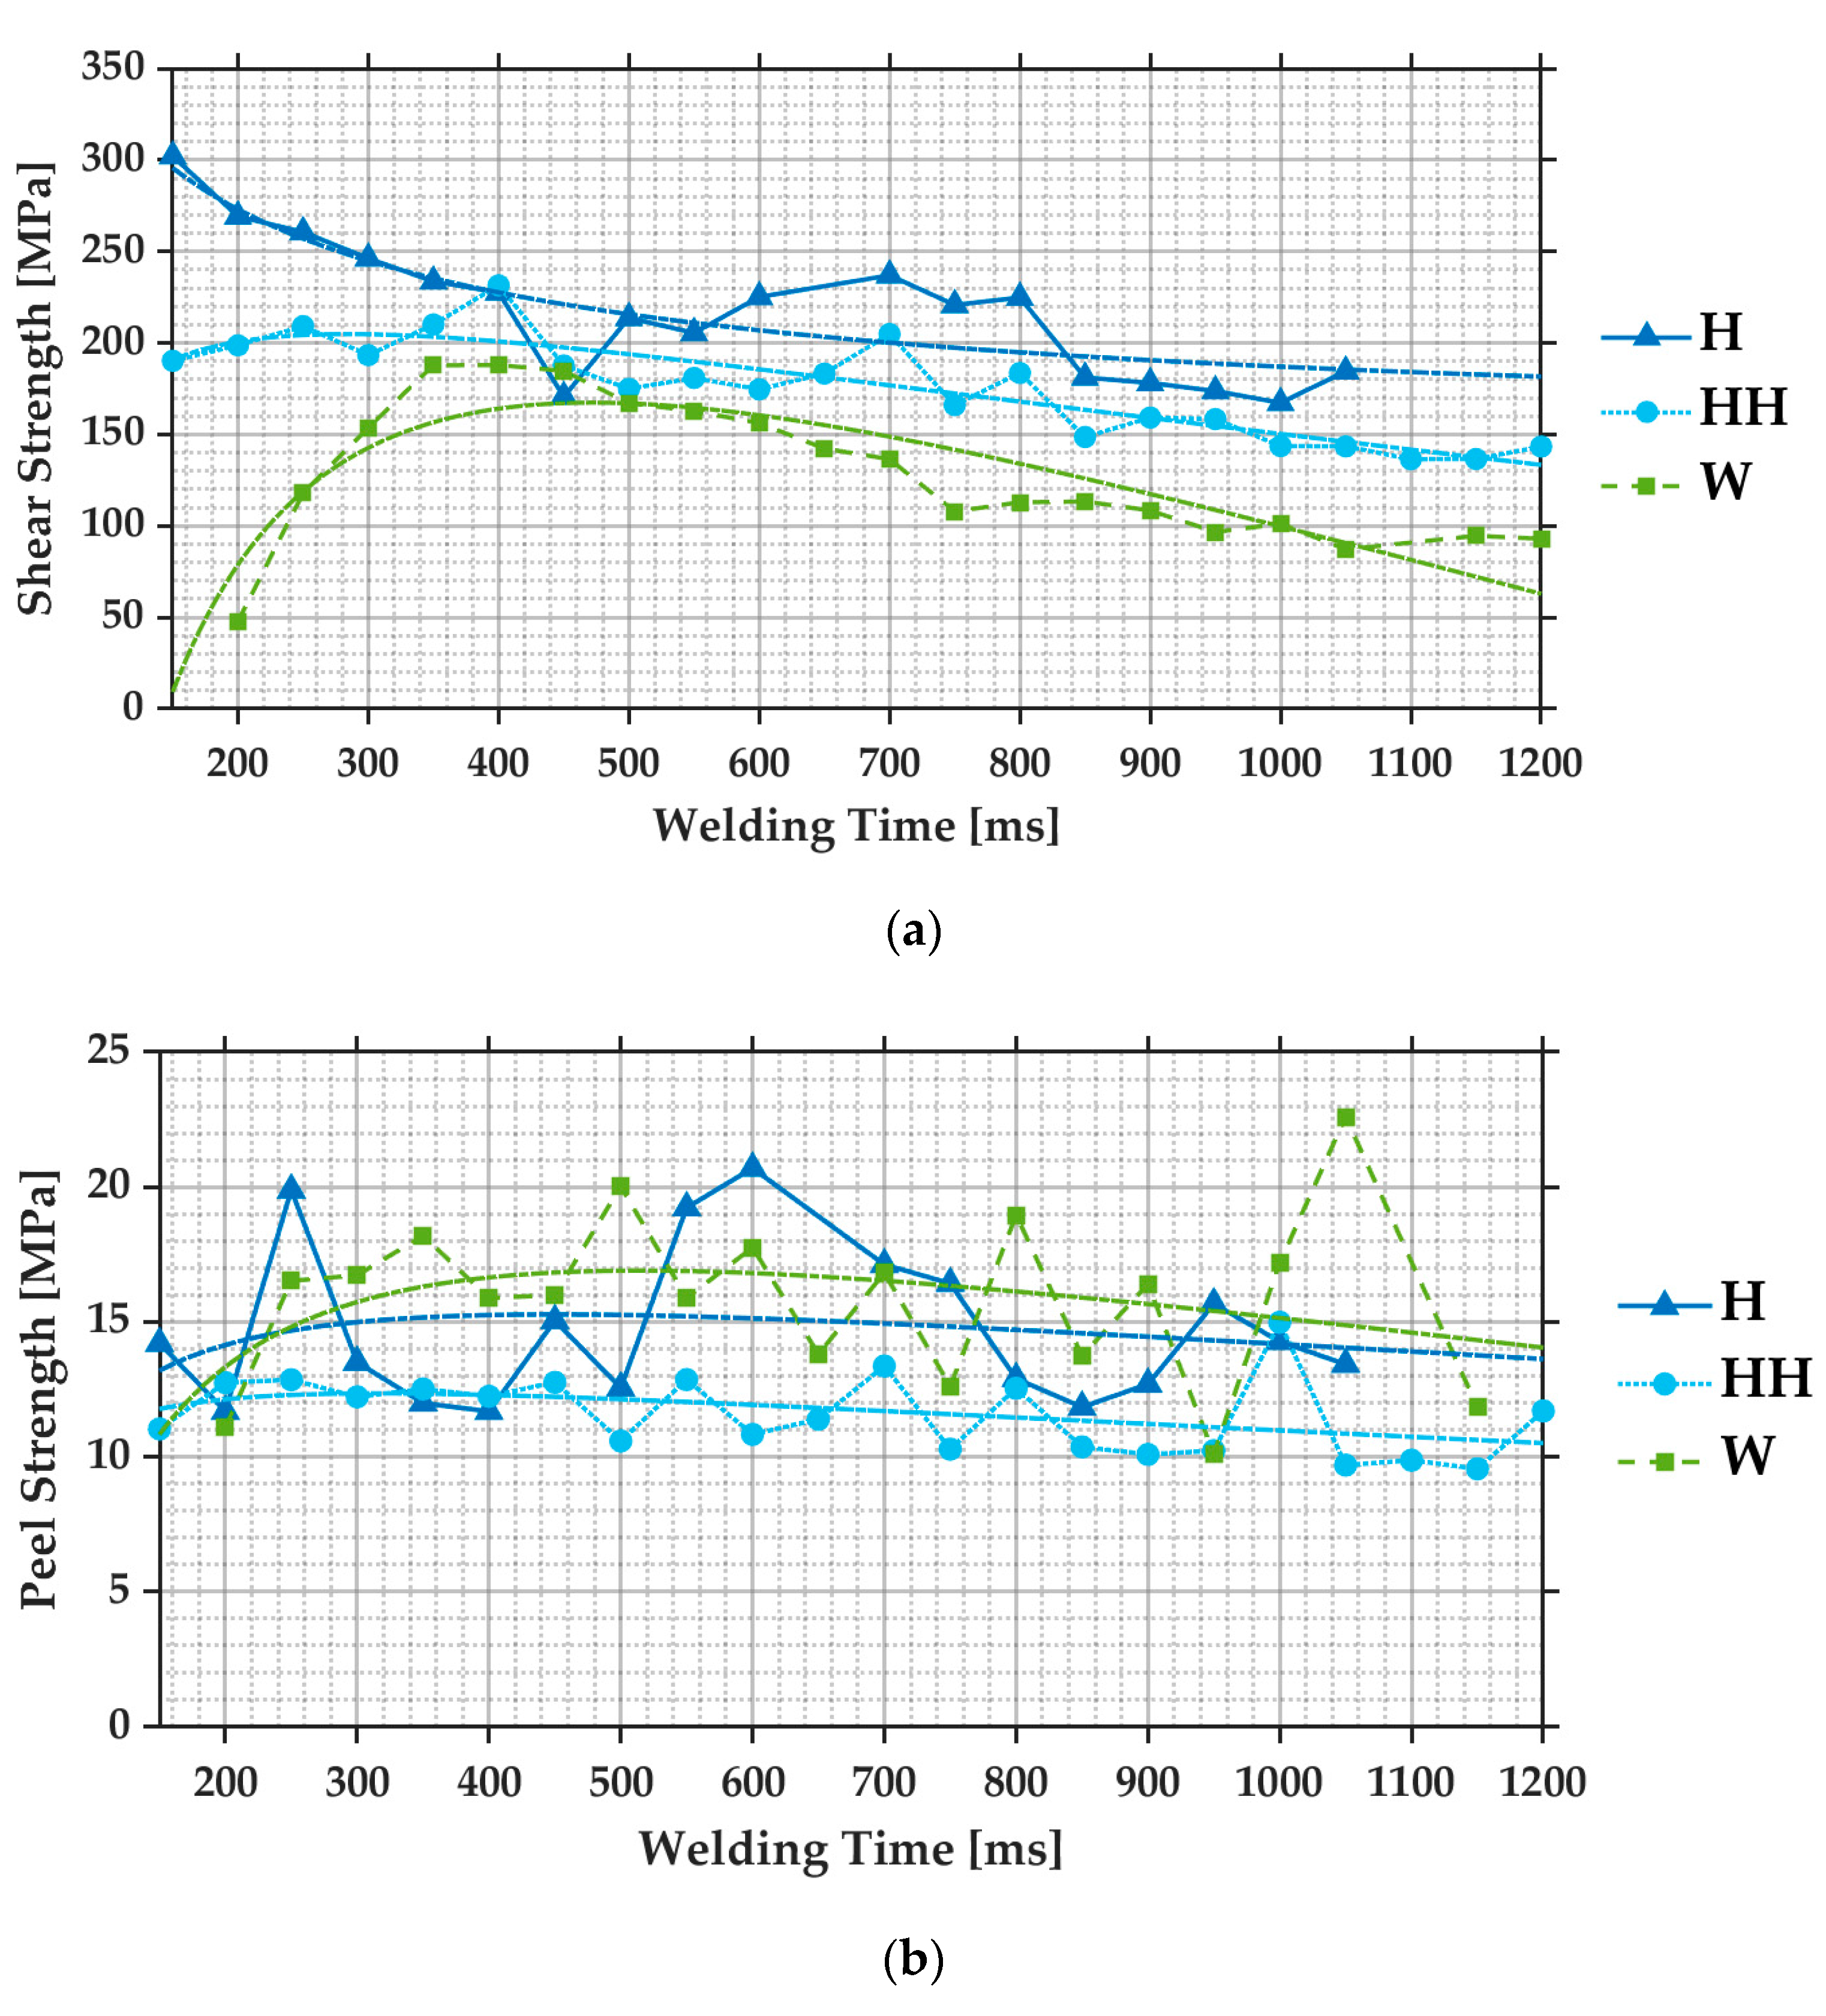
3.1. Mechanical Test Results—Joint Formation over Welding Time

The acquired quality features and thus the set-up models differ for each test series. For test series 1, the development of the maximum shear tensile force and maximum peel tensile force are modeled. Test series 2 results in models for the maximum peel tensile force and fracture work, an integral of the applied tensile force over the path of the test stand. The latter aims to evaluate not only the optimum and maximum firm line contact but also the entire welding surface at once.

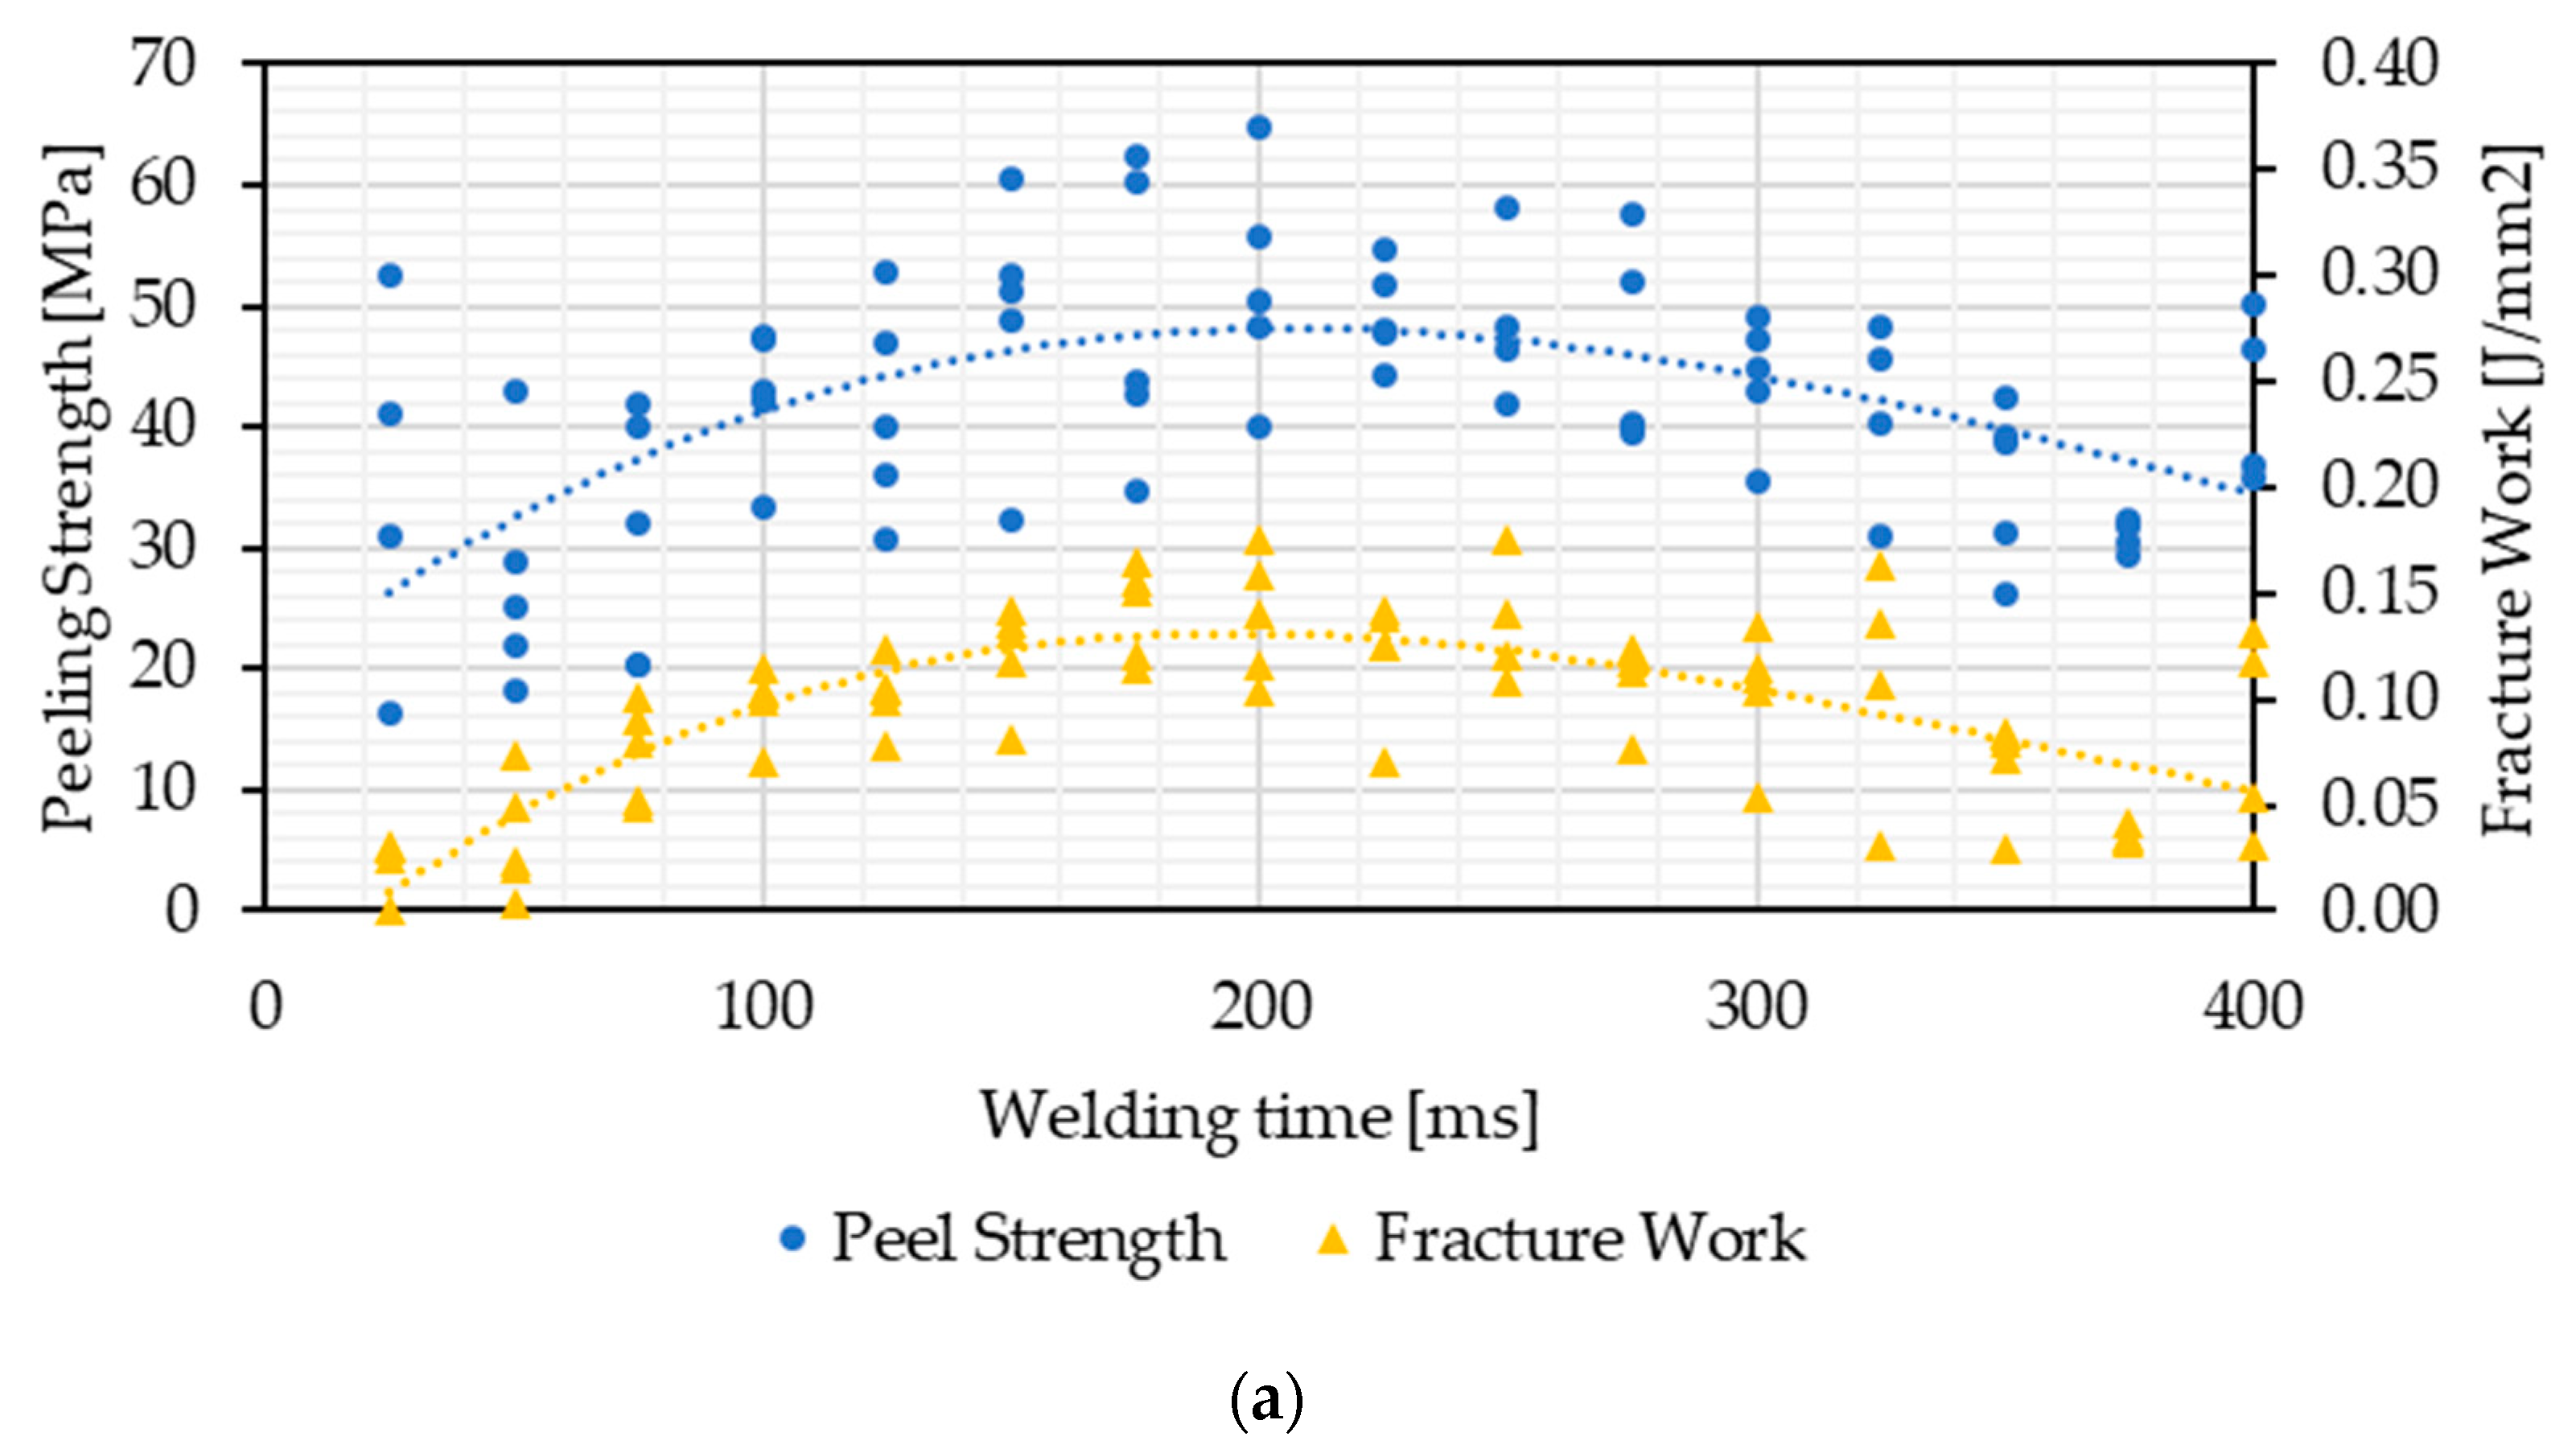
3.1.1. Joint Quality Models of Test Series 1

The achieved maximum test forces of the individual welding times and rolling conditions of test series 1 are depicted in Figure 7. The given shear forces are the mean values of the respective tests. All testing results show an increasing weld quality over welding time, which fits in with the findings presented in the literature, e.g., [4]. The tests carried out do not indicate over-welding, which would be noticeable by a decrease in the joint quality. Based on studies of the previous parameters, over-welding starts after 1050 ms [14]. The figure also includes a mathematical model of the quality feature depending on time, and for each rolling condition and test form, an individual model is fitted. The same basic form of the model (mathematical function) is used to calculate the F m a x  (shear or peel) over the welding time t of the respective quality parameter,
F m a x ( t ) = a ln t b + c
which demonstrated the best fit among several common mathematical models tested, including polynomial models, exponential models, and logarithmic models. All investigated one-variate empirical formulas only accounted for welding time. Table 4 lists the determined coefficients for the individual models of test series 1 and includes the coefficient of determination R2 of the respective model. The high coefficients of determination for the shear-tested welds of half-hard and soft materials indicate a good representation and stable welding process. For the hard material, the process scatters due to the boundary conditions [11,14]. The lower R2 of the peel tests indicate that the testing method itself scatters. The evaluation of the maximum peel test force does not reflect the quality of the complete weld but of a contact line.
Figure 8a indicates that three different rolling states of the used copper have a positive correlation between weld time and tensile shear strength in the investigated welding conditions. H refers to hard material, HH refers to half-hard material, and W refers to the soft rolling condition. This relationship becomes particularly linear when the weld time exceeds the inflection points of the mathematical model. As softer material is used, the inflection points of the assumed modeling shift to longer weld times. The maximum tensile shear force of material W is most sensitive to changes with relatively short welding time. This shows that the respective welding process with hard rolling conditions is not robust using the same material batch and geometry [11]: all welds used optimal parameters for material HH, but experiments with higher hardness showed significantly higher process scatter compared to other rolling conditions, supposedly due to approaching a critical geometry for USMW with a changed Young’s Modulus [11,18]. The shear force model curves of the different material hardnesses proceed separately from each other over the entire welding time, which indicates that the hardness of a material significantly influences its tensile shear force and defines the maximum achievable quality.
In Figure 8b, showing the corresponding tensile peel tests, no such clear conclusions can be drawn: the effect of material hardness on the tensile peeling force is not very clear, but materials H and W seem to lead to a higher tensile peeling force. Whether this reflects better quality or a larger area tested at the time due to the higher ductility of the material W compared to HH cannot be derived. For both materials, however, the course of the peel tensile forces over time is significantly more unsteady than for the reference state of material HH. The different approximation models intersect in the investigated time range, and the calculated coefficients of determination are significantly lower than those of the models of the shear tensile strengths. The R2 of the model of the peel-tested material H welds is the lowest, as with the shear tensile forces. It shows that hardness has a slight influence on peel tensile force over welding time. In the case of the shear tensile force, the relative change after a short time (e.g., 400 ms, 500 ms or the inflection point) is only very slight, whereas the relative change is significantly higher in the case of the peel tensile force.
The very different behavior of the three rolling conditions in the tensile tests shows that the two types of tensile tests cannot simply be transferred into one another. The different derived coefficients and their signs used to calculate the maximum tensile forces emphasize this. On the other hand, the tests show that the rolling condition has a very large influence on the joint quality and should therefore be specified closer than in the material standard for the respective rolling condition. It is particularly noticeable that the quality of the welds of material H could be modeled less well for both quality parameters, leading to lower R2.

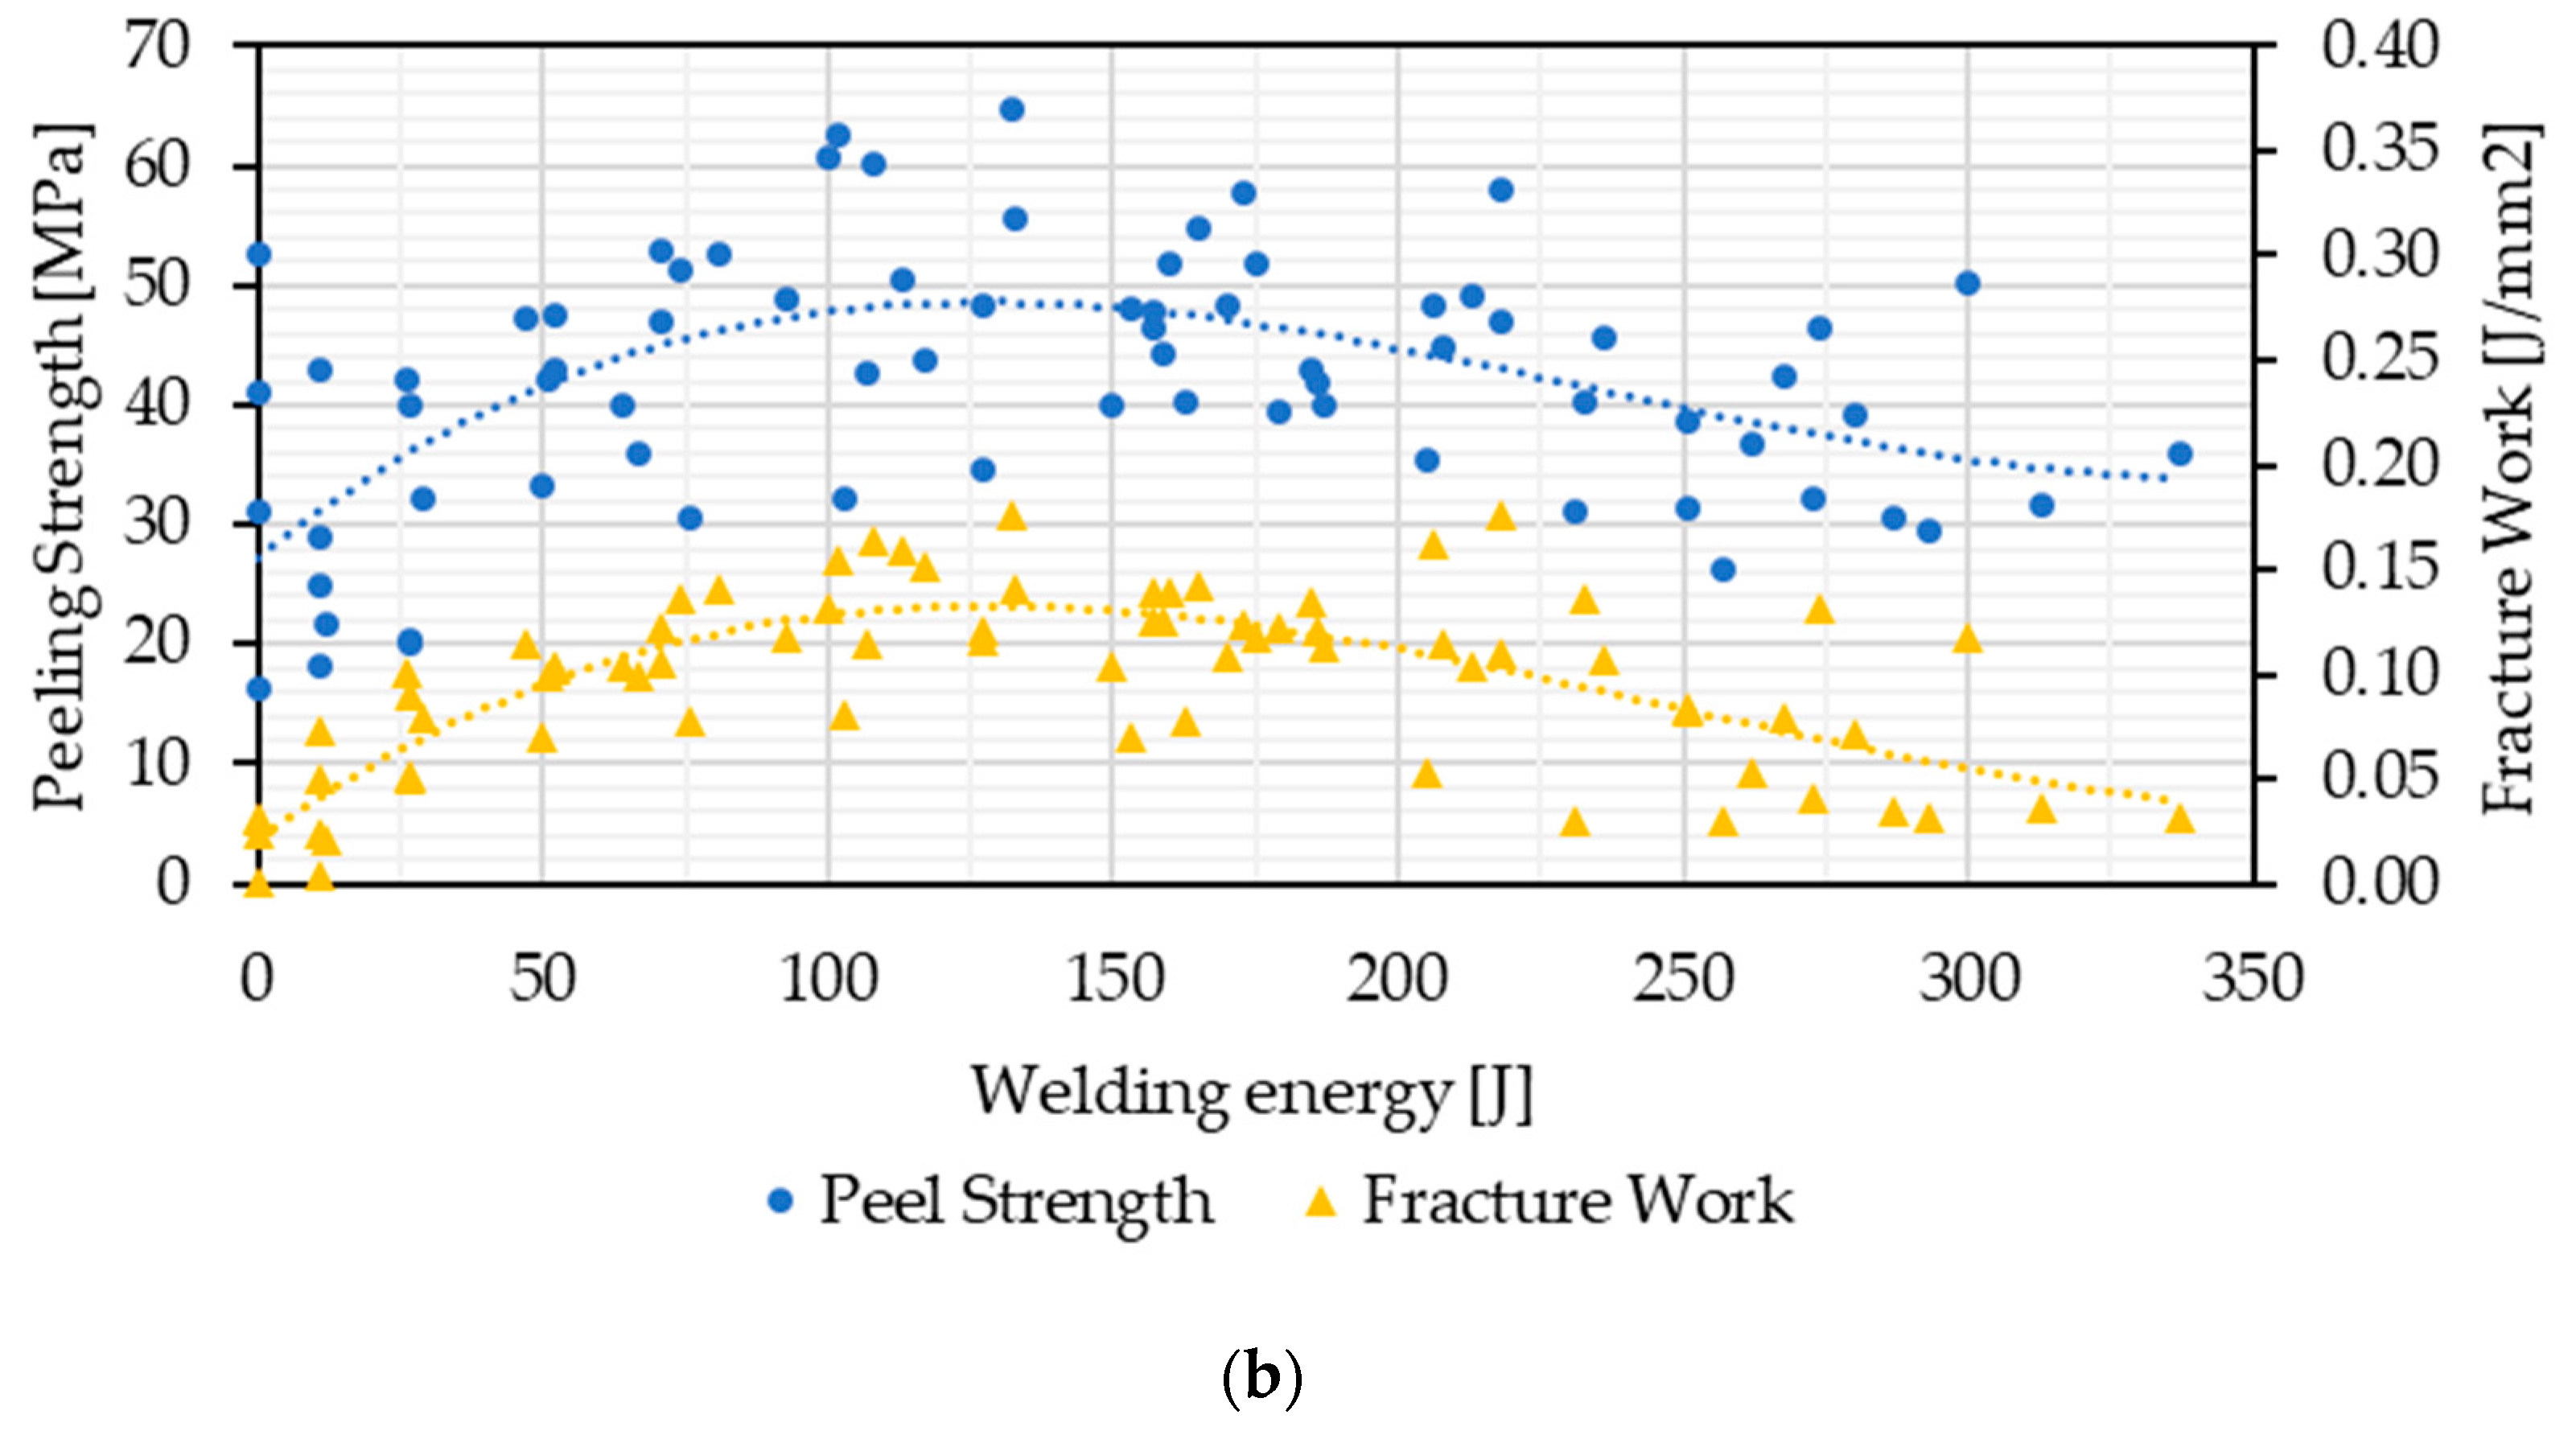
3.1.2. Joint Quality Models of Test Series 2

In test series 2, peel force and fracture work are assessed as quality features. Fracture work, the energy required to destroy the welded joint, is calculated using the trapezoidal method from tensile force and movement of the clamping in the same direction. A total of 500 data points per second can be used to derive the integral. It is hypothesized that the fracture work measures the quality of the entire joint area as opposed to the maximum force. Figure 9 shows specific qualities over time, modeled by a cubic polynomial. Figure 9a indicates that peel force peaks at around 300 ms and fracture work at 250 ms, both decreasing slightly thereafter, which is consistent with the over-welding phenomena described in the literature [1,4]. Figure 9b uses welding energy as the x-axis, showing similar trends. The maximum peel force peaks at around 250 J, and fracture energy at 200 J, with welding time proportional to welding energy.
Overall, the mechanical joint quality of test series 2 can be described by a model-based approach. A cubic polynomial model was identified as the most suitable approach, generalized as
Q t = a t 3 b t 2 + c t + d ,
and is used to fit the welding time or the welding energy to the corresponding quality feature Q , the maximum tensile peel force or the fracture work. The approximation of the quality via the welding energy is somewhat more accurate than via the welding time parameter. The coefficients of the model and the achieved R2 are given in Table 5. The modeling of the maximum tensile peel force is more accurate than that of the fracture work.
It is obvious that the models can also be specified as quadratic, as the polynomial function coefficient is quite low, the overall impression of the measurements supports this, and there is only a small loss of accuracy. The third degree was chosen primarily because it takes better account of the unsteady behavior of the fracture work. A closer look at Figure 9 also reveals the various fracture behaviors of the individual samples. For the initially occurring peel fractures, the testing results are quite close to each other, meaning they only show a minimal scatter (approx. up to 150 ms weld time). The peel fracture is followed by mixed fractures with significantly larger differences in the results, especially when considering the maximum tensile peel force. From the occurrence of a pure shear fracture (approx. starting from 325 ms weld time), there is a significant reduction in the fracture work. Although high forces occur, integration over the short test duration results in a low-quality rating for the affected joints. The investigations show that the quality features should not be evaluated without information on the occurring fracture types.

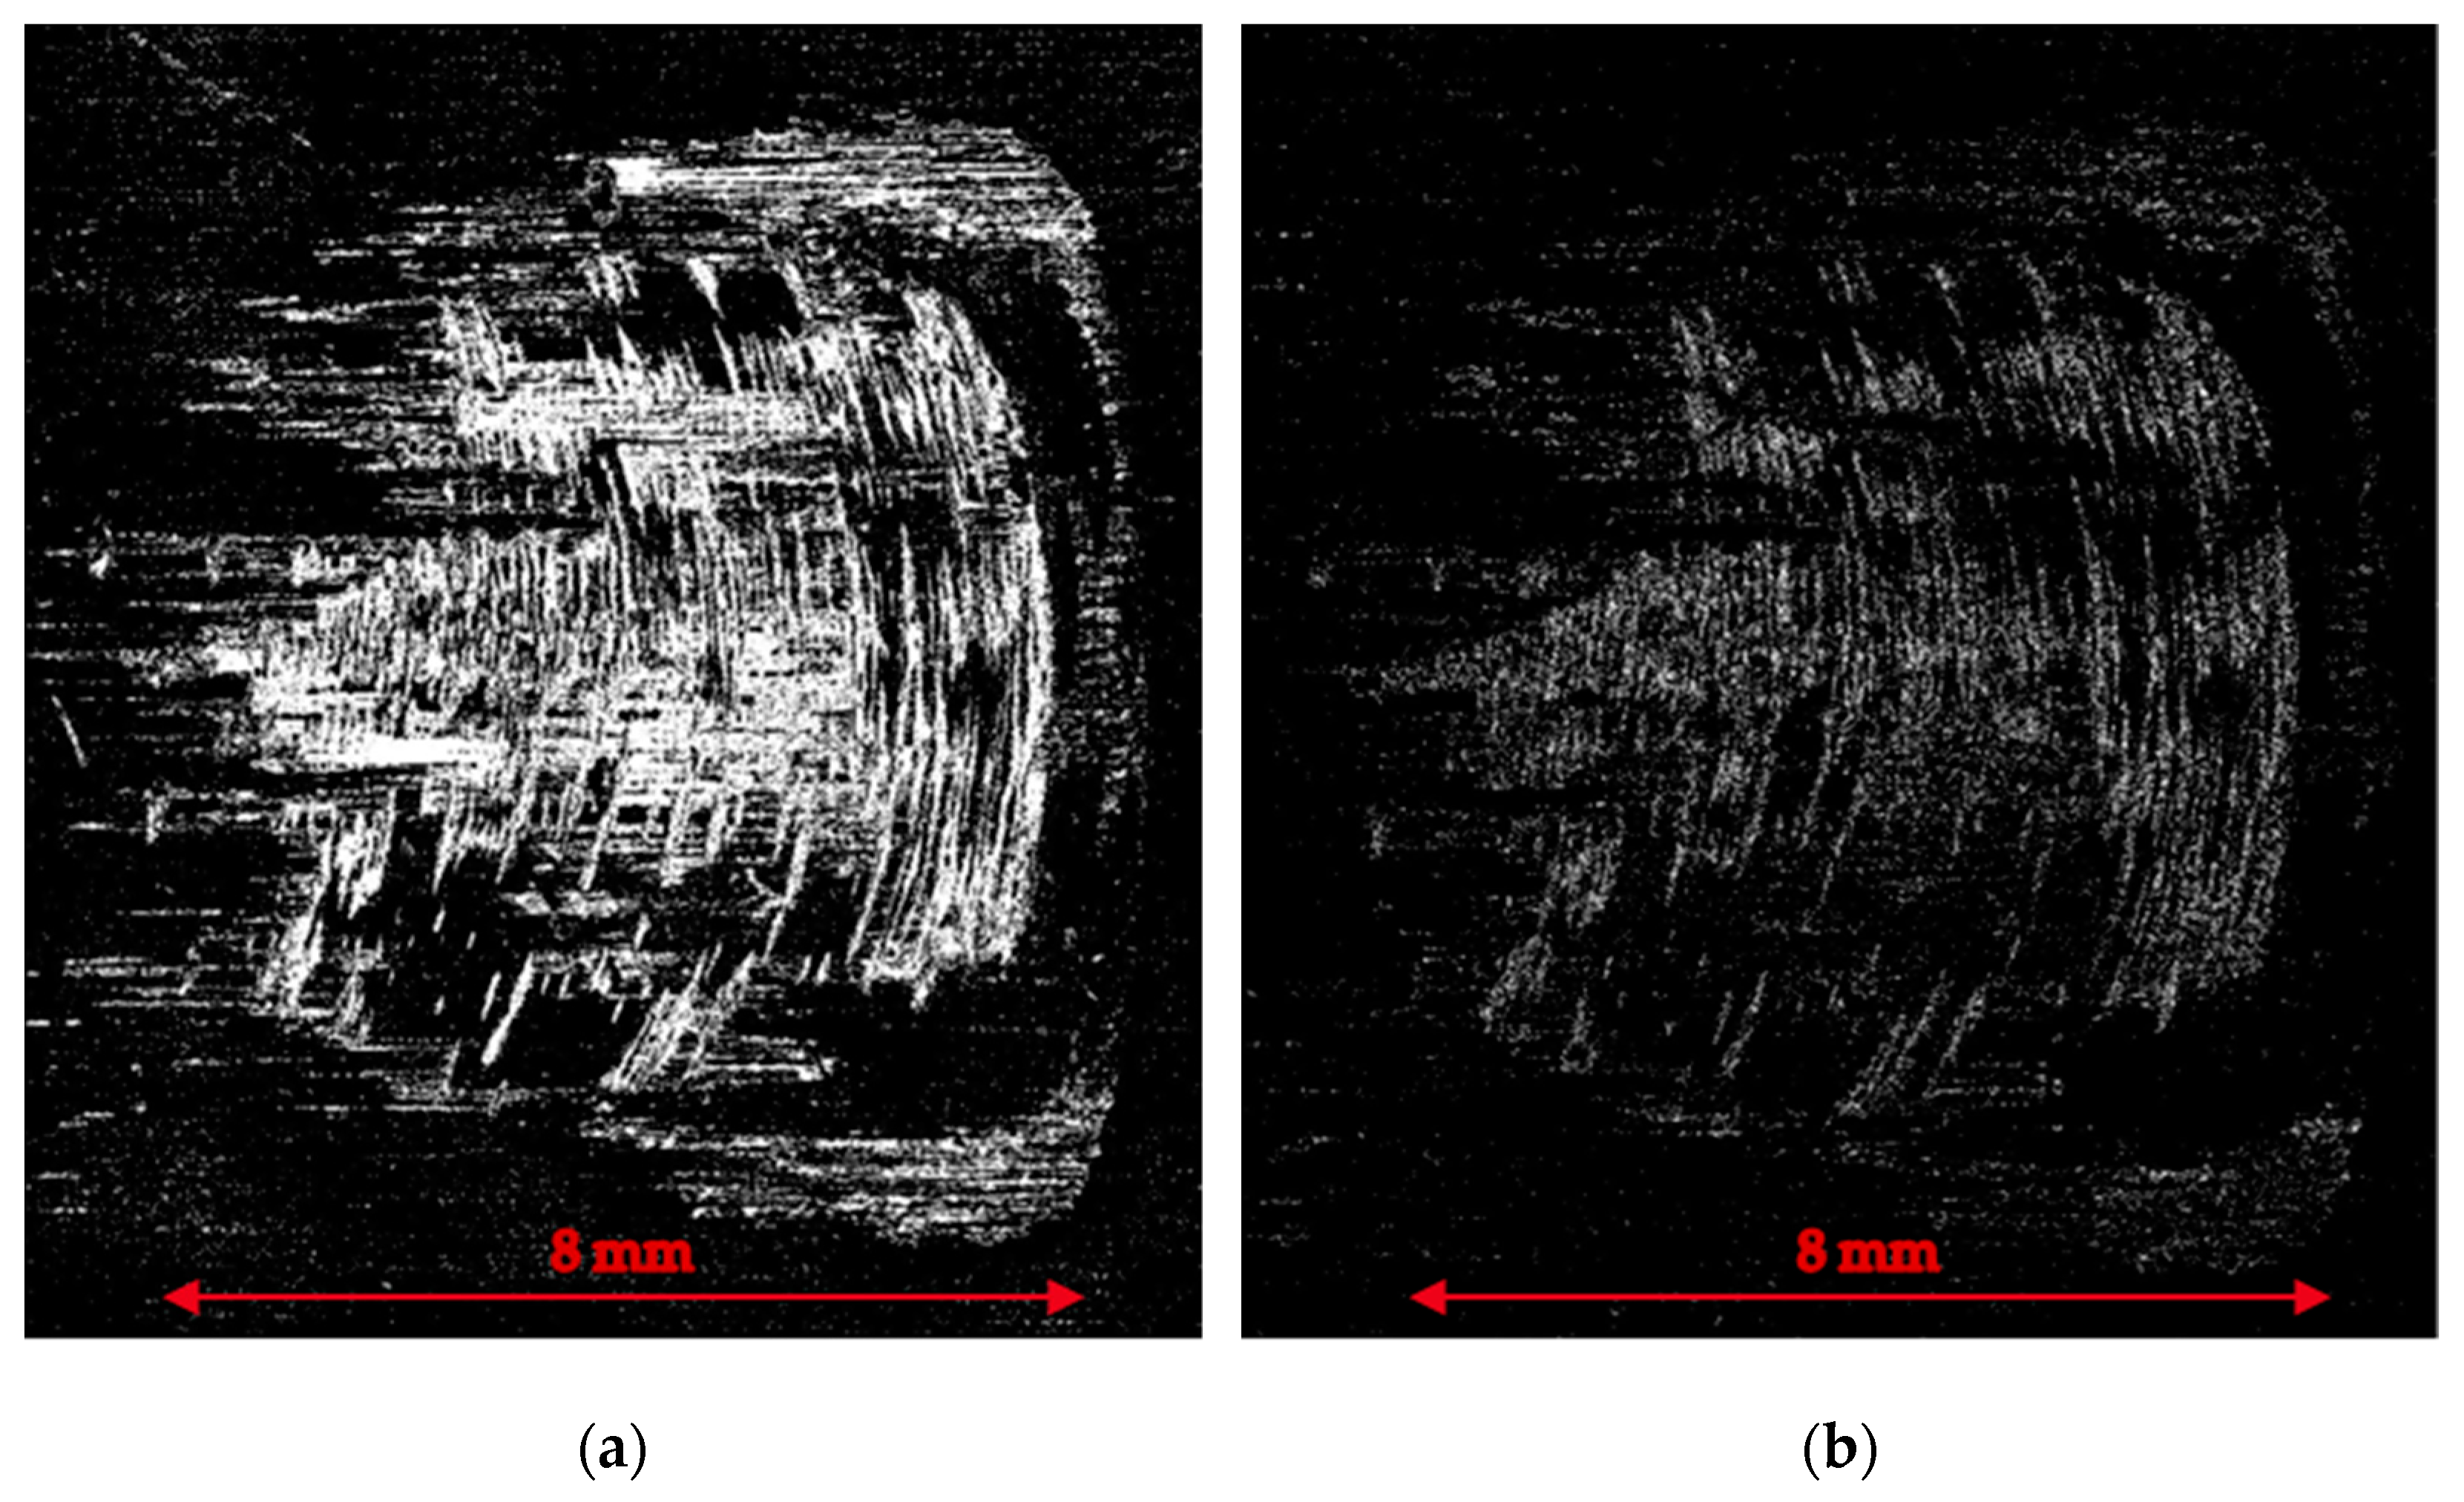
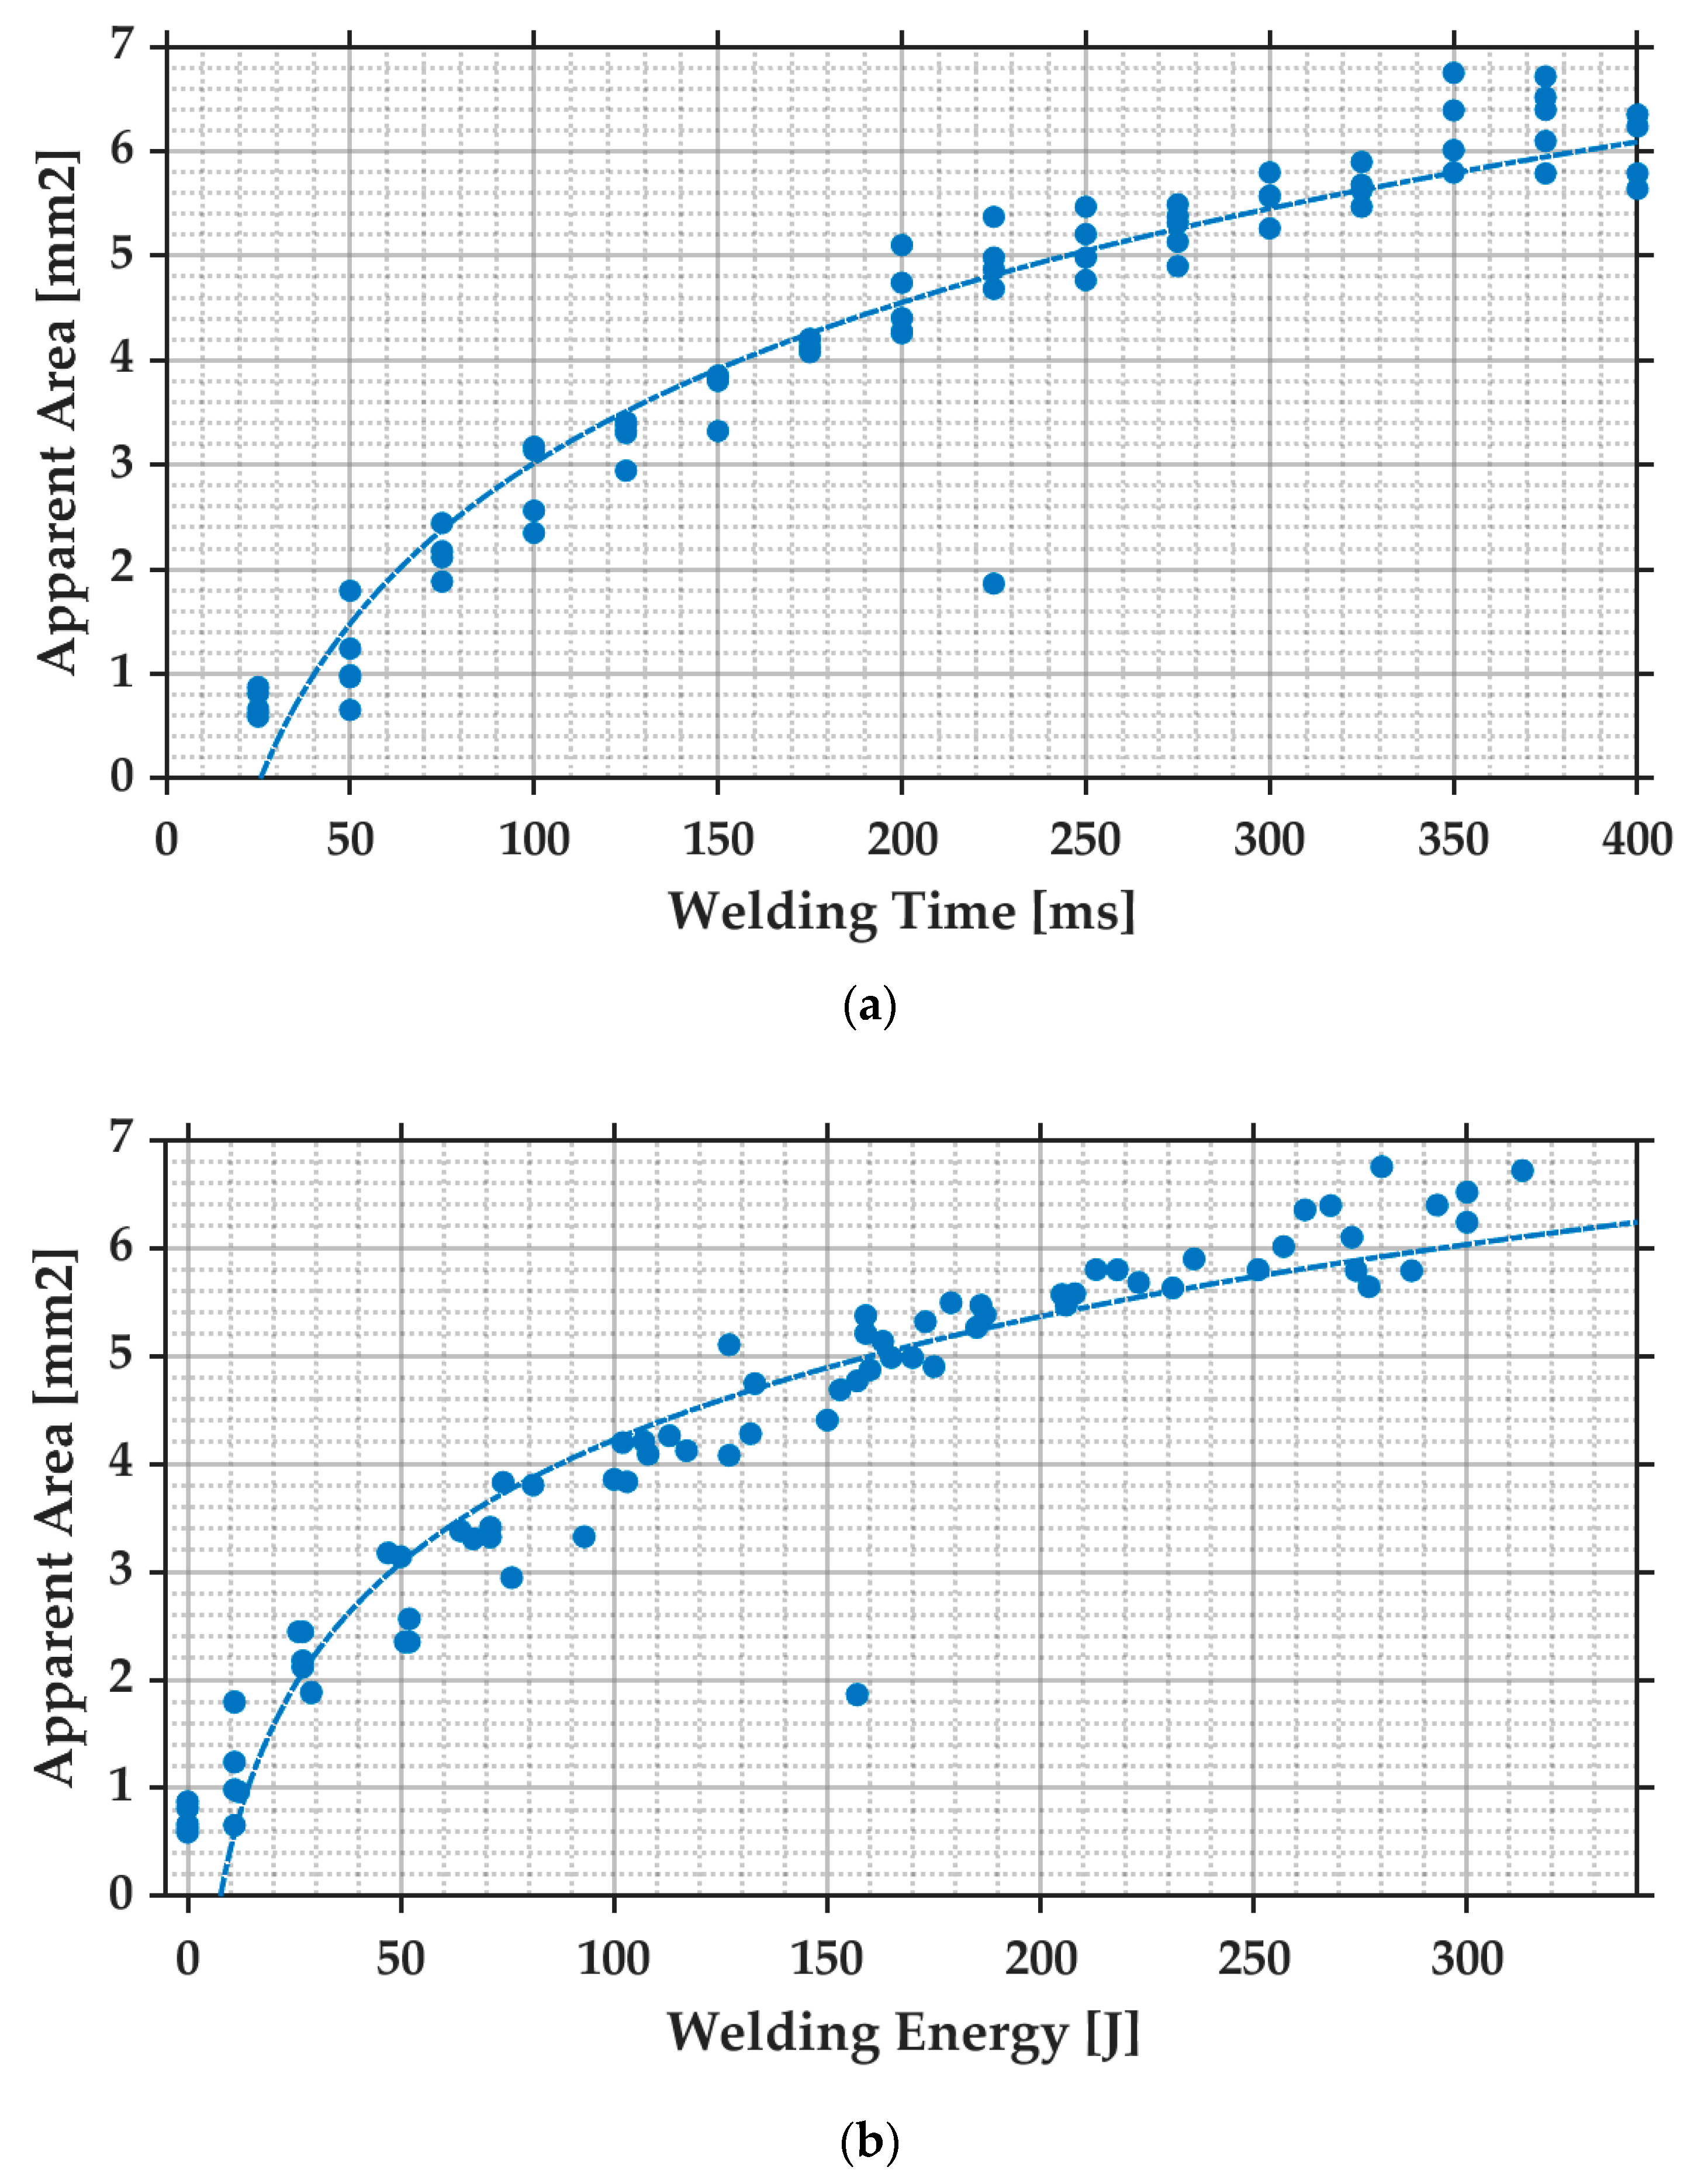
3.2. Joint Area Determination

Figure 10 shows two examples of microscopic pictures of test series 1 and 2, one at an early stage of joint formation, and one at a late stage. Figure 10a depicts the early stage of joint formation with a 150 ms weld time for test series 1, and Figure 10b shows after 1100 ms weld time. Both images are welds with hard material. The micro-welds show an asymmetrical image, which correlates with the asymmetrical position of the weld on the workpiece. There are different sheet lengths to the left and right of the direction of vibration, leading to an asymmetric relative motion of the workpieces in the joint zone. In fact, the micro-welds are even slightly curved. Both samples show the typical texture of micro-welds—smooth unwelded area and very dark edges. These dark edges are excess material pressed out of the welding zone and then oxidized in the oven—having a comparably rough surface, a dark taint is achieved, darker than the oxidation on the unwelded base material.
Figure 10c,d shows samples of test series 2: Figure 10c has a weld time of just 50 ms, 10d of 300 ms. The micro-welds visible here are oriented parallel to the direction of vibration. For the sample in 10d with longer welding time, the original right-angled edges of the upper joining part are curved outwards; here, the sonotrode has displaced material during indentation into the upper part.

3.2.1. Test Series 1

To achieve accurate measurements of the growth of the real joint area over welding time, we combine two different evaluation methods of the same data into one model. We perform a quantitative analysis by counting the number of pixels that the respective evaluation method has identified as a joint area. Method 1 roughly considers regions with significant slits and cracks. Oxidized, unwelded areas are filtered out beforehand, which is based on the selection of a specific gray value range. Method 2 uses the k-means clustering algorithm to fine-tune the assessment of the joint area, also taking into account the local roughness of the fracture surface. In Figure 11, Method 1 shows large clusters of pixels, while Method 2 shows small clusters of pixels. Then, the two results are weighted and combined to achieve the actual welding result. All three materials show a consistent increase in joint area over welding time. Soft material shows the most substantial increase, while half-hard material exhibits a slightly less steep trend.
Figure 12 shows the joint weld area over weld time in series 1. Figure 12a,b represents results by methods 1 and 2, respectively. However, they have a big difference and include some deviation. For method 1, it is challenging to exclude all the unwelded areas completely, while for method 2, the cluster provided by the k-means method misses some pixels of the weld area. To a certain extent, the former one by method 1 is larger and the latter one by method 2 is smaller compared to the true value. The value of method 1 is significantly greater than that of method 2. It is necessary to find a balanced weight to calculate the result.
To combine the results from the two different calculation methods, Formula (4) was designed to calculate a weighted average of joint area by method 1 and method 2 on a standardized and normalized basis, adjusting the weights through their ranges to obtain a new combined value. The weight part is obtained by adding m a x ( X ) m i n ( X ) ) and m a x ( Y ) m i n Y and multiplying the x i and y i by the corresponding weights, respectively. Figure 12c shows the final weighted average.
z i = m a x ( X ) m i n ( X ) m a x ( X ) m i n ( X ) + m a x ( Y ) m i n ( Y ) x i + m a x ( Y ) m i n ( Y ) m a x ( X ) m i n ( X ) + m a x ( Y ) m i n ( Y ) y i
Here, x i represents the joint weld area calculated by method 1, while y i denotes the joint weld area calculated by method 2, used to determine the weighted mean z i . It is striking that the joint surface is only a fraction of the possible hypothetical joint surface of 8 mm × 8 mm, i.e., 64 mm2. However, this matches the fracture pattern achieved; with very few exceptions, test series 1 consists of failures in the joint surface. The base material only has a cross-section of 30 mm2. Joints that significantly exceed this value should therefore lead to failure in the base material.
As before, the obtained result can be described by a time-dependent model. Like the shear tensile force, a logarithm function
A i t = a ln ( t ) + b
is used as the basis of the model, which achieves a relatively good fit to the data. Table 6 provides the model parameters as well as the coefficients of determination for all three rolling states of test series 1.
It is also noticeable that the models are shifted differently and have different gradients. The welds with hard material show a certain area early on and increase less over time. The softer the material, the later the weld surface forms, but the growth of the joint increases more strongly over time. This behavior is also consistent with the shear tensile tests and not consistent with the peel tensile tests. The growth of the joint area also appears to be quite steady, which promises a basic suitability as a quality parameter.

3.2.2. Test Series 2

As already mentioned, the better-illuminated images (due to a straight base material condition after testing) of test series 2 allow an alternative approach to evaluation and image analysis without pre-treatment of the parts prior to testing. Figure 13a,b shows the processing effect of a sample with a 100 ms weld time.
Foreground extraction was performed using the image segmentation algorithm based on the Simple Interactive Object Extraction (SIOX) algorithm [32], which operates within the GIMP platform implemented in ImageJ software (v1.54h). The region of interest (ROI) for the foreground was manually optimized through user interaction with the image. Resolution was adjusted to the maximum level, and the binary mask of the foreground was saved. For images where the foreground and background were highly integrated, additional processing methods were employed to eliminate extraneous background elements, for example, by selecting the surface outside the welding area where contamination leads to discoloration after welding and before testing. This area does not need to be evaluated. Figure 14 shows the apparent joint areas determined for test series 2. As for the measured quality features, the figure includes the joint growth over welding time (Figure 14a) and over welding energy (Figure 14b). Both figures show a similar progression.
The steady increase in the joint area after a sharp rise is best modeled using a logarithmic approach. The corresponding basic formula can be found in Formula (5). The fitting parameters and achieved R2 are listed in Table 7. The coefficients of determination achieved for the model are in the region of 90% and thus at a similar level to test series 1.
In addition to the models presented, other models were also evaluated. Although functions based on polynomials can depict the lower times well, they run exponentially at the higher times, possibly only shortly after the end of the period depicted in the experiments, which does not correspond to reality.
The determined growth of the joint area resembles the results of test series 1 and does not reflect the course of the determined quality features maximum force and fracture work. Thus, both mechanical quality features do not represent the growth of the joint area. Assessing mechanical quality based on energy used instead of welding time seems to be more precise.

4. Development of Joint Strength over Time

Based on the previous results for the mechanical qualities and real joint areas achieved, we determine the development of strength over time in the following. Furthermore, we evaluate the results and their significance for process parameterization.

4.1. Effective Strength

Based on the results of Section 3.1 and Section 3.2, we determine the effective weld strength for the different quality indicators. This results from the development of the individual quality values over the determined real area as a function of time, generally given as
S t r e n g t h ( t ) = Q u a l i t y ( t ) A r e a ( t )
which corresponds to the definition of ultimate tensile strength U T S based on the maximum tensile force F m a x and the load-bearing cross-section A
U T S ( t ) = F m a x ( t ) A ( t )

4.1.1. Effective Strength of Test Series 1

Figure 15 shows shear strength and peel strength over weld time in series 1, considering joint weld area of the combined model, shear force and peel force, calculated for the individual data points based on the measurement data of the quality feature and the determined area. In Figure 15a, hard material is initially the strongest in terms of shear strength but gets closer to the performance of half-hard material over time. Soft material starts with the lowest shear strength, sees an initial increase, and then slightly decreases after 350 ms. This slight decrease can be found in the other rolling states right from the start. This initial difference is mainly due to the delayed start of bond formation observed for the soft material. After 1050 ms, which corresponds to the optimum parameter set for the reference condition, the strengths reach the following values: hard material—59% base material strength, half-hard material—56%, soft material—43%. The soft material is relatively weakened the most by the welding process; in addition to the thermal load, the disintegration effects postulated during over-welding may occur here (see Balz [4]).
In Figure 15b, hard material and soft material provide relatively high and variable peel strength with fluctuations; in particular, soft material achieves the highest peel strength. It cannot be ruled out that the determined peel tensile strength results from the deformation behavior of the soft material in the peel tensile test, so that a larger joint cross-section (instead of a line of contact) can be loaded. Further tests with optical assessment of the part deformation during testing are necessary to validate this hypothesis. All peel tensile strengths decrease with increasing welding time, corresponding to the course of the shear strength.
Based on the formulas established so far for the maximum forces (1) and (2), and the joint surface (5) of test series 1, the following formula result is analogous to Formula (6):
S t r e n g t h ( t ) = F m a x ( t ) A r e a ( t )
which can be modeled as follows
S t r e n g t h t = a ln ( t ) 2 + b ln ( t ) + c
The model parameters are listed in Table 8, together with the R2.
The combination of the models for shear tensile force and joint area growth over welding time provides coefficients of determination within the region of 75%. The described progression of strength over time is therefore quite steady, and the modeling of shear strength over welding time is successful. It is worth noting that the shear tensile strengths achieved are close to the base material strength [31]. As expected, longer welding times inducing higher temperatures for longer times are leading to a decrease in the material strength in the joint area. Murzinova et al. present values between 24 MPa and 123 MPa in their literature research, using the sonotrode tool imprint as the reference surface area for copper welds [27]. We cannot confirm these values as we only consider the real joint area for our strength calculation.
The situation is different when analyzing the peel tensile strength. Here, the relationship between the peel tensile strength and the surface area cannot be linked. This is particularly interesting because the peel tensile forces determined ultimately originate from the samples whose surface was also analyzed further. This again supports the conclusion that the peel test force only corresponds to the joint area in a very limited way.

4.1.2. Effective Strength of Test Series 2

Analogous to test series 1, we analyze the development of the joint strength over time, but this time, we consider the fracture work and the maximum peeling tensile force as quality features. Figure 16a depicts the determined values for all welds over the welding time, and Figure 16b depicts the corresponding curves over welding energy. All curves show an increase in the first moments of welding, a maximum of strength, and finally a decrease over the further course. The decrease in strength tends to be linear, which is particularly evident in the welding energy.
The curves of Figure 16b are therefore similar to the shear tensile strength curve from test series A, especially for the soft material. This is because the first moments of joint formation and the strong growth at the beginning of the weld for the other material hardnesses in test series 1 are below the parameter range starting at 150 ms. This initial stage is part of test series 2 experiments. Due to their characteristic curve, the determined strengths can be better modeled with a polynomial function
Q t = a t 3 b t 2 + c t + d
than using a logarithm. The model parameters determined are given in Table 9.
The model accuracies achieved are rather moderate. It is noticeable that it makes a clear difference whether the welding time (as a welding parameter) or the welding energy (as part of the process response) is used as an input variable for modeling. In principle, the use of an output variable as an input variable in the model is valid, as the welding energy is known after each weld. Similarly, the resulting welding time could also be evaluated in an energy-controlled process.
In addition, a clear difference can be seen between the models of maximum peel tensile strength and work of fracture, with the former achieving an R2 of approx. 40% and the latter closer to 65%. This shows that there is not necessarily a direct correlation between the joint area and the peel tensile strength, but that the test methods or the fracture behavior of the samples have a decisive effect on the significance of the quality parameter.

4.2. Significance of the Results for Joint Formation

According to previous theories and models [4,8,16], mechanical-tested welding quality and welding joint area are expected to increase with the welding time until over-welding occurs, which our results confirm. Macroscopically, the joint area continues to grow (Figure 12 and Figure 14), with over-welding limited to joint part damage and a decrease in material strength, as described by Balz [4]. No failure of the previously welded area leading to a reduction in the real joint area could be observed. Future work should include the measurement of the actual joint area based on fracture surfaces for parameter optimization. In addition, the measurement of joint area is also desirable and valuable in describing joint mechanisms and factors influencing joint formation. Tensile peel tests can be used to create suitable samples for optical evaluation. The use of surface oxidation and roughness measurements enables the evaluation of complex geometries and similar material joints if the image quality is insufficient due to deformations in the welding process or mechanical testing.
The constant decrease in the average shear tensile strength over the welding time (Figure 15a) suggests that this is a continuous effect, not a sudden drop. It remains unclear if this weakening is solely due to material softening or involves some microstructural disintegration. Recrystallization around the weld interface occurs even with short welding times due to shear deformation and heating during ultrasonic welding [16], becoming more pronounced with longer times. The impact of recrystallization on weld quality needs further investigation. Data show that joint material strength is closer to the base material properties than often postulated.
The shear tensile strength curve, similar to relative velocity measurements [4,15], may indicate joint surface coupling. The observed turning points (Figure 15a,b and Figure 16a) align with the phases of cleaning, friction, and adhesion, where joint surface growth stabilizes, and shear tensile force increases slowly.

5. Conclusions and Outlook

5.1. Summary

As part of this study, the development of the joint strengths over the welding time was determined for two test series of Cu-Cu welds with different geometries. For this purpose, two mechanical quality criteria (test series 1: shear tensile force, peel tensile force and test series 2: peel tensile force, fracture work) were set in relation to the measured real joint area for each geometry. The joint area was successfully determined by analyzing laser confocal microscopy images based on the fracture surfaces of peel tensile tested samples.
The development of the specific joint quality over time was derived from the various test results obtained. For test series 2, the process phase of over-welding was also recorded. It was found that maximum shear tensile force and peel tensile force development differ significantly from each other: for the welding configuration investigated, the most significant gain in shear tensile force is already completed after a fraction of the optimum welding time, after which the joint quality increases only slightly. Conversely, the peel tensile strength increases significantly more over the further welding time. For test series 2, the fracture work was determined as an additional quality measure to peel tensile force. Both criteria indicate over-welding through a drop in quality.
The automated image evaluation of contrasts in height, roughness and color has proven to be a suitable method for recording the achieved real joint area. By using peel-tested samples to analyze the real joint area, a very good distinction can be made between the fracture surface and the unbonded surface. When analyzing the joint area of the 1 mm thick sheets of test series 1, the intended oxide layer formation by heating in the atmosphere before the mechanical test could be used very well as a pre-treatment. This method yields solid results despite the deformation caused by the peel test, which makes microscopy considerably more difficult. We were also able to show with test series 2 that pre-treatment prior to mechanical testing and image acquisition can be omitted for certain part geometries. In principle, both test series and their respective weld processes show a continuous growth of the joint area. The growth is particularly rapid in the first phases of joint formation, and steadier as the process continues. We hypothesize that the inflection point coincides with the time of the process phase change from much to little relative motion between the parts. From this moment on, the energy is introduced into the process through friction between the tools and the sheets, and no longer through friction between the sheets themselves [4,15]. For both geometries investigated, relative joint areas below 50% of the sonotrode surface area were determined. For test series 2, measuring the joint area appears to be a comparatively robust method of quality assessment. In addition, it can be seen that the joint area still increases at the end of the test parameter range, but both mechanical quality parameters indicate over-welding.
Finally, the strength of the joints was calculated based on the total assessed real weld area. In addition to the shear tensile strength, the peel tensile strength and the strength of the fracture work were also determined. It was found that the tensile shear strength depends on the base material strength, i.e., the rolling condition, and decreases continuously over the course of the welding time. In the early stages of welding, similar strengths as in the base material can be determined, especially for material in hard rolling conditions. The peel tensile strength is more of a pseudo-strength, as the maximum force is determined for a line-shaped area during the test, but the entire joint area is taken into account. A slight deterioration can also be observed over the increasing welding time. Overall, it is highly scattered due to the maximum peel tensile force, which is also highly scattered. With the area-specific work of fracture, another parameter can be introduced that basically behaves similarly to the tensile shear strength. However, it is sensitive to the fracture behavior, i.e., shear fractures in the base material due to material thinning. For this reason, it cannot meaningfully represent the over-welding parameter range.

5.2. Conclusions

We can conclude the following:
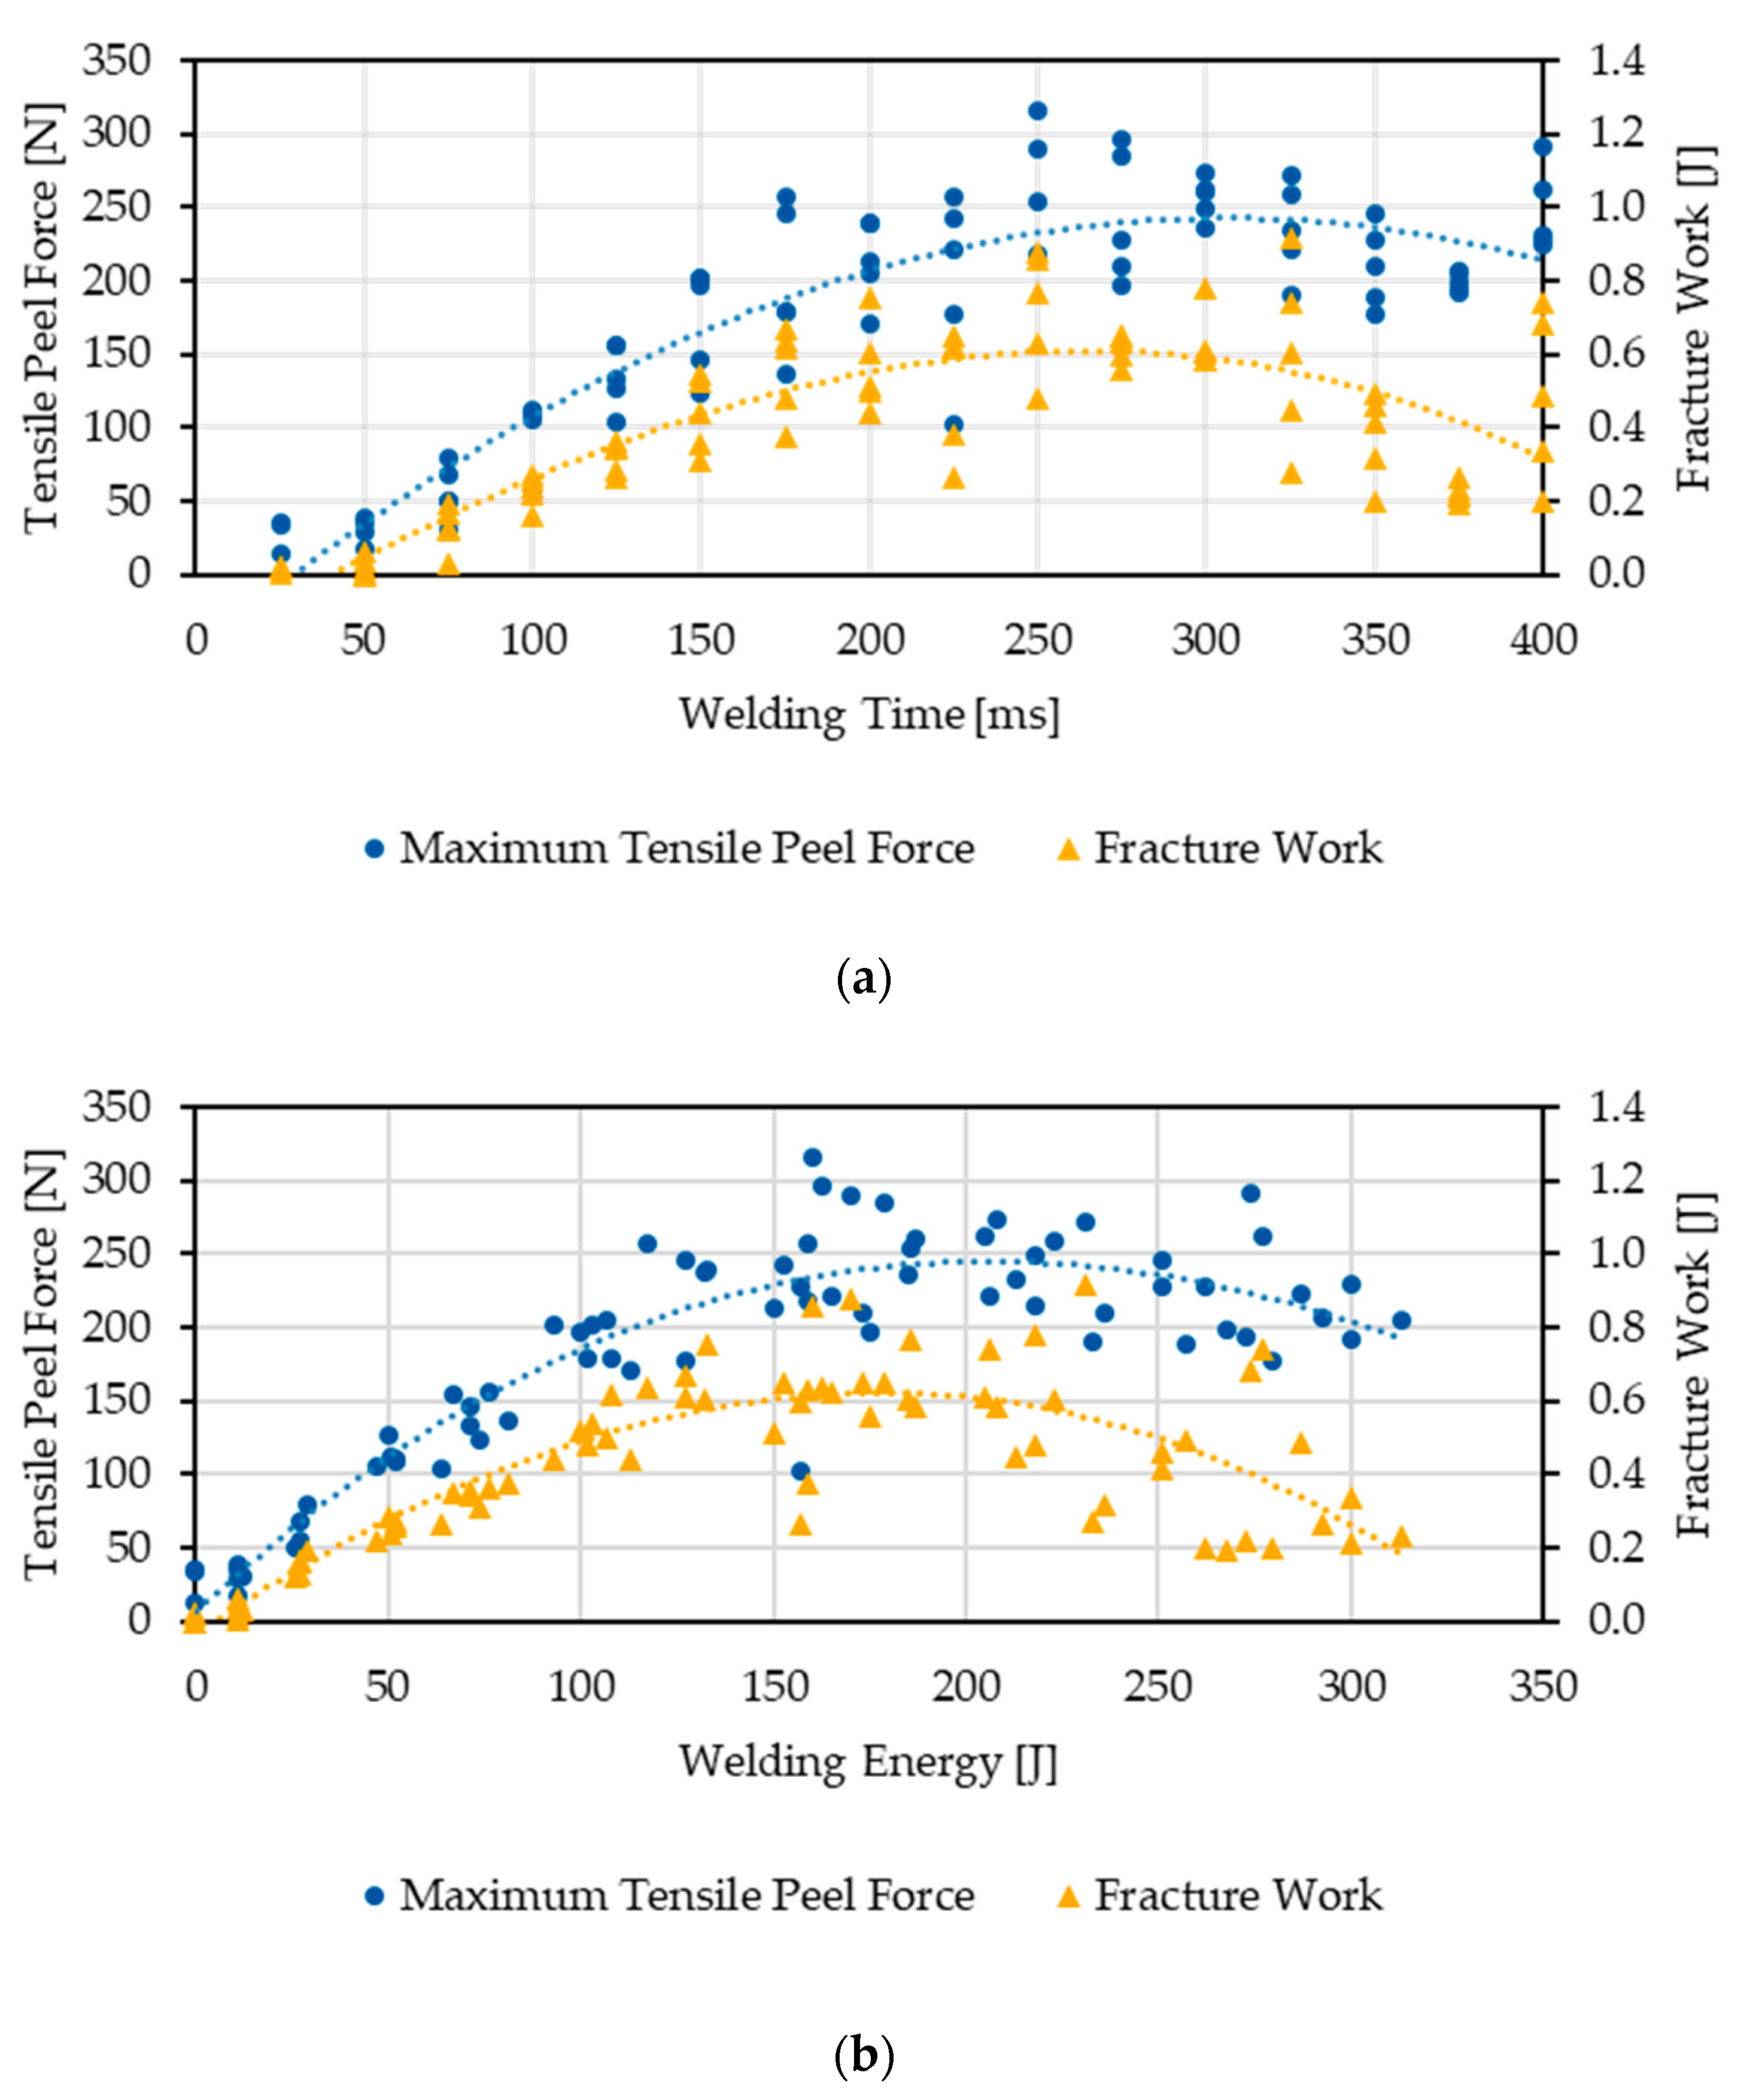
  • Maximum shear tensile force, peel tensile force and fracture work are not linearly related quality features. The shear tensile force increases sharply, especially at the beginning of the weld, and then continues to grow slowly over the course of welding. The characteristic values based on the peel tensile test grow more continuously but have significantly more scatter. This is also observable in models with R2 of up to 95% for shear forces, 70–80% for maximum peel test forces, depending on test setup and part geometry, and 60% for fracture work. Accordingly, several quality parameters should be taken into account as part of process development and qualification.
  • The fracture surface analysis is suitable to determine the real joint area based on peel tensile tested samples. Even for similar material joints, using 3D images and aids such as targeted oxidation for coloring, sufficient accuracy can be achieved.
  • The growth of the joint area is comparable to the growth of the maximum tensile shear force, rapidly growing in the beginning and slowly growing in the latter stages of joint formation. Softer material rolling states delay joint formation, but the final joint area is impacted in neglectable ways. A real weld area of 1/3 to 1/2 of the sonotrode surface area is a plausible value for an optimized parameter set of copper–copper welds. We can report a joint area of 30 mm2 of 64 mm2 for test series 1 and 6 mm2 of 16mm2 for test series 2.
  • For test series 2, measuring the joint area appears to be a comparatively robust method of quality assessment. The results can be described as a model with an R2 of 91%, while for the mechanical tests, which are subject to a high degree of scatter, only an R2 of 81% for the peel tensile force and 64% for the fracture work can be determined.
  • The tensile shear strength strongly depends on the base material strength, is similar to this at the beginning of the weld, and decreases with the welding time, e.g., for hard material with a determined base material strength of 305 MPa, a maximum strength of 300 MPa can be observed at the beginning of the welding process.
  • Depending on the original rolling condition, between 43% and 59% of the original material strength can be identified as the resulting material strength in the joint area.

5.3. Outlook

The results obtained suggest that determining a joint quality based on the real joint surface is a viable solution. This applies in particular to applications where, for geometric reasons, only a peel test is possible, e.g., test series 2. This results in several possible research approaches for further investigations.
  • Sample preparation and the determination of the joint area must be optimized and standardized so that it can be repeatedly used for different joints and material combinations.
  • By efficiently automating the process, the necessary data can be collected to correlate process data, relative movements of the components to each other and the behavior of the micro-welds or weld surface growth.
  • It should be investigated whether the actual weld area can also serve as a target value for predicting the joint quality, and if the acquired models do perform better than the equivalent models predicting maximum peel forces.

Author Contributions

Conceptualization, F.W.M., H.Z., A.S. and U.R.; methodology, F.W.M. and A.S.; software, H.Z.; validation, F.W.M. and H.Z.; formal analysis, F.W.M. and H.Z.; investigation, F.W.M. and H.Z.; resources, F.W.M., A.S. and U.R.; data curation, F.W.M.; writing—original draft preparation, F.W.M. and H.Z.; writing—review and editing, A.S. and U.R.; visualization, F.W.M. and H.Z.; supervision, A.S. and U.R.; project administration, F.W.M., A.S. and U.R.; funding acquisition, U.R. All authors have read and agreed to the published version of the manuscript.

Funding

This research was funded by the Deutsche Forschungsgemeinschaft (DFG—German Research Foundation), grant number 470052705.

Data Availability Statement

The raw data supporting the conclusions of this article will be made available by the corresponding author upon request.

Acknowledgments

The authors would like to thank L. Steenbuck, B. Staneczek and L. Deng for their support during the welding experiments and microscopy.

Conflicts of Interest

The authors declare no conflicts of interest. The funders had no role in the design of the study; in the collection, analyses, or interpretation of data; in the writing of the manuscript; or in the decision to publish the results.

Appendix A

Appendix A summarizes additional tests to characterize the base material used in the experiments.
Table A1. Mechanical and surface parameters of material as delivered.
Material 1 RM 2
[MPa]
Thickness
[mm]
Hardness 3
[HV]
SA 4
[µm]
SZ 4
[µm]
Free Surface Energy 5
[mN/m]
EN CW004A soft232 1.0540.6784.04326.71
EN CW004A half-hard2571.0710.1331.71921.51
EN CW004A hard3051.0990.1592.49823.57
EN CW008A half-hard2591.5780.1584.53437.65
EN CW004A half-hard2490.5820.4158.10436.76
1 Material specification and rolling state according to DIN EN 13599:2014 [31]. 2 Mean value determined in a tensile test of 5 (test series 1) or 7 (test series 2) samples according to DIN EN ISO 6892-1:2020 [30]. 3 Mean Vickers Hardness, measured according to DIN EN ISO 6507-1:2024 [33] using a HV0.1 load, 20 tests per specimen. 4 Mean arithmetical height of the surface SA and maximum height of the surface SZ measured according to DIN EN ISO 25178-2:2023 [34] using a laser scanning microscope according to DIN EN ISO 25178-6:2010 [35]; 3 tests per specimen. 5 Mean measured according to EN ISO 19403-2:2020 [36] using diiodomethane and distilled water, calculation of surface energy according to Owens, Wendt, Rabel and Kaelble; 5 tests per specimen.
Table A2. Mean chemical composition of materials tested with optical emission spectroscopy in %; 5 tests per specimen.
Material 1EN CW004AEN CW004AEN CW004AEN CW004AEN CW008A
Rolling State 1SoftHalf-HardHardHalf-HardHalf-Hard
Thickness1 [mm]1 [mm]1 [mm]0.5 [mm]1.5 [mm]
Zn0.01640.02360.01770.00500.0049
Pb<0.0008<0.0008<0.0008<0.00030<0.00030
Sn<0.0001<0.0001<0.00010.000310.00024
P0.00050.00220.00120.00048<0.00020
Mn<0.0010<0.0010<0.0010<0.00010<0.00010
Fe0.01750.01850.01760.00350.00035
Ni0.00440.00510.00420.000750.00053
Si<0.00050.00060.00060.000790.0063
Mg0.00010.00020.00010.000140.00030
Cr<0.00020.0004<0.0002<0.00020<0.00020
Te ---<0.00030<0.00030
As<0.00010.00010.0001<0.00020<0.00020
Sb<0.0005<0.0005<0.0005<0.00100<0.00100
Cd---<0.00010<0.00010
Bi<0.0007<0.0007<0.0007<0.00050<0.00050
Ag0.00100.00130.00110.000560.00048
Co0.00430.00470.0050<0.00040<0.00040
Al0.00940.01040.01030.03100.0124
S0.00040.00110.00140.000710.0010
Be0.02290.02340.0235<0.00010<0.00010
Zr0.00030.00030.00030.000640.00068
Au---<0.00050<0.00050
B---<0.00020<0.00020
Ti---<0.00020<0.00020
Se---<0.00030<0.00030
Pt---<0.00020<0.00020
CuRem (99.9)Rem (99.9)Rem (99.9)Rem (99.9)Rem (100.0)
1 Material specification and rolling state according to DIN EN 13599:2014-12 [31].

References

  1. De Vries, E. Mechanics and Mechanisms of Ultrasonic Metal Welding. Ph.D. Thesis, Ohio State University, Columbus, OH, USA, 2004. Available online: http://rave.ohiolink.edu/etdc/view?acc_num=osu1078415529 (accessed on 1 June 2024).
  2. Nishimura, J.; Kido, K.; Momose, F.; Goto, T. Development of ultrasonic welding for IGBT module structure. In Proceedings of the 22nd International Symposium on Power Semiconductor Devices & IC’s (ISPSD), Hiroshima, Japan, 6–10 June 2010; pp. 293–296. [Google Scholar]
  3. Lee, S. Process and Quality Characterization for Ultrasonic Welding of Lithium-Ion Batteries. Ph.D. Thesis, University of Michigan, Ann Arbor, MI, USA, 2013. Available online: https://hdl.handle.net/2027.42/99803 (accessed on 1 June 2024).
  4. Balz, I. Prozessanalyse der Thermo-Mechanischen Vorgänge Während der Verbindungsbildung beim Metall-Ultraschallschweißen. Dissertation Thesis, RWTH Aachen University, Aachen, Germany, 2020. [Google Scholar] [CrossRef]
  5. Balle, F.; Magin, J. Ultrasonic Spot and Torsion Welding of Aluminum to Titanium Alloys: Process, Properties and Interfacial Microstructure. Phys. Procedia 2015, 70, 846–849. [Google Scholar] [CrossRef]
  6. Li, J.; Zillner, J.; Balle, F. In-Depth Evaluation of Ultrasonically Welded Al/Cu Joint: Plastic Deformation, Microstructural Evolution, and Correlation with Mechanical Properties. Materials 2023, 16, 3033. [Google Scholar] [CrossRef] [PubMed]
  7. Al-Sarraf, Z.; Lucas, M. A study of weld quality in ultrasonic spot welding of similar and dissimilar metals. MPSVA. J. Phys. Conf. Ser. 2012, 382, 012013. [Google Scholar] [CrossRef]
  8. Wu, X.; Liu, T.; Cai, W. Microstructure, welding mechanism, and failure of Al/Cu ultrasonic welds. J. Manuf. Process. 2015, 20, 321–331. [Google Scholar] [CrossRef]
  9. Schwarz, E.B.; Bleier, F.; Guenter, F.; Mikut, R.; Bergmann, J.P. Improving process monitoring of ultrasonic metal welding using classical machine learning methods and process-informed time series evaluation. J. Manuf. Process. 2022, 77, 54–62. [Google Scholar] [CrossRef]
  10. Harthoorn, J.L. Ultrasonic Metal Welding. Ph.D. Thesis, Technische Hogeschool Eindhoven, Eindhoven, The Netherlands, 1978. [Google Scholar] [CrossRef]
  11. Müller, F.W.; Mirz, C.; Weil, S.; Schiebahn, A.; Corves, B.; Reisgen, U. Weld quality characterization by vibration analysis for ultrasonic metal welding processes. J. Adv. Join. Process. 2023, 8, 100149. [Google Scholar] [CrossRef]
  12. USCAR38-2; Performance Specification for Ultrasonically Welded Wire Terminations. SAE International: Warrendale, PA, USA, 2023. [CrossRef]
  13. USCAR45; Performance Specification for Welded Wire-to-Wire Splices. SAE International: Warrendale, PA, USA, 2018. [CrossRef]
  14. Müller, F.W.; Mirz, C.; Weil, S.; Reisgen, U.; Schiebahn, A.; Corves, B. Schlussbericht zum Vorhaben IGF-Nr.: 20.161N/Systemidentifikation und Monitoring von Metall-Ultraschallschweißprozessen; DVS Forschungsvereinigung: Dusseldorf, Germany, 2021; ISBN 978-3-96870-507-1. [Google Scholar]
  15. Li, J.; Balle, F. In-situ observation of the bond formation process during ultrasonic metal welding of Al/Cu joints using Laser Doppler Vibrometry. J. Manuf. Process. 2023, 106, 1–11. [Google Scholar] [CrossRef]
  16. Fujii, H.T.; Goto, Y.; Sato, Y.S.; Kokawa, H. Microstructure and lap shear strength of the weld interface in ultrasonic welding of Al alloy to stainless steel. Scr. Mater. 2016, 116, 135–138. [Google Scholar] [CrossRef]
  17. Bergmann, J.P.; Regensburg, A.; Schürer, R.; Petzoldt, F.; Herb, A. Effect of the interface characteristics on the joint properties and diffusion mechanisms during ultrasonic metal welding of Al/Cu. Weld. World 2017, 61, 499–506. [Google Scholar] [CrossRef]
  18. Müller, F.; Liu, J.; Schiebahn, A.; Reisgen, U. Influence of workpiece geometry and natural frequencies on ultrasonic metal welding. Proc. Inst. Mech. Eng. Part L J. Mater. Des. Appl. 2024. [Google Scholar] [CrossRef]
  19. Huang, H.; Chen, J.; Feng, Z.; Sun, X. Modal Analysis of Ultrasonic Spot Welding for Lightweight Metals Joining. Metals 2023, 13, 1735. [Google Scholar] [CrossRef]
  20. Li, P.; Wang, Z.; Diao, M.; Guo, C.; Wang, J.; Zhao, C.; Jiang, F. Effect of processing parameters on bond properties and microstructure evolution in ultrasonic additive manufacturing (UAM). Mater. Res. Express 2021, 8, 036507. [Google Scholar] [CrossRef]
  21. Watanabe, T.; Yanagisawa, A.; Konuma, S.; Yoneda, A.; Ohashi, O. Effect of oxide film on bond strength of ultrasonically welded joints, and welding process. Study of ultrasonic welding of dissimilar metals (2nd Report). Weld. Int. 1999, 13, 936–944. [Google Scholar] [CrossRef]
  22. Yang, J.; Ni, Z.; Nazarov, A.A.; Ye, F. Effect of Alcohol on the Mechanical and Electrical Properties of Ultrasonic Spot Welded Cu/Cu Joints. Metals 2023, 13, 21. [Google Scholar] [CrossRef]
  23. Müller, F.W.; Chen, C.Y.; Schiebahn, A.; Reisgen, U. Application of electrical power measurements for process monitoring in ultrasonic metal welding. Weld. World 2023, 67, 395–415. [Google Scholar] [CrossRef]
  24. IEC 60352-9:2024; Solderless Connections—Part 9: Ultrasonically Welded Connections—General Requirements, Test Methods and Practical Guidance. Danish Standards: Copenhagen, Denmark, 2024.
  25. Lindamood, L.; Mohr, L.; Moghaddas, A.; Kitt, A.; Frech, T. Investigation of monitoring methods for ultrasonic metal welding. In Proceedings of the SPIE 11591. Sensors and Smart Structures Technologies for Civil, Mechanical, and Aerospace Systems 2021, Online, 22–27 March 2021; p. 115910I. [Google Scholar] [CrossRef]
  26. Nunes, R.; Faes, K.; De Meester, S.; Kubit, A. Influence of welding parameters and surface preparation on thin copper–copper sheets welded by ultrasonic welding process. Int. J. Adv. Manuf. Technol. 2022, 123, 373–388. [Google Scholar] [CrossRef]
  27. Murzinova, M.A.; Shayakhmetova, E.R.; Mukhametgalina, A.A.; Sarkeeva, A.A.; Nazarov, A.A. Local Plastic Deformation and Quality of Cu-Cu Joints Obtained by Ultrasonic Welding. Metals 2023, 13, 1661. [Google Scholar] [CrossRef]
  28. Satpathy, M.P.; Sahoo, S.K. Mechanical performance and metallurgical characterization of ultrasonically welded dissimilar joints. J. Manuf. Process. 2017, 25, 443–451. [Google Scholar] [CrossRef]
  29. Kong, C.Y.; Soar, R.C.; Dickens, P.M. A model for weld strength in ultrasonically consolidated components. Proc. Inst. Mech. Engineers. Part C J. Mech. Eng. Sci. 2005, 219, 83–91. [Google Scholar] [CrossRef]
  30. EN ISO 6892-1:2020-06; Metallic Materials—Tensile Testing—Part 1: Method of Test at Room Temperature (ISO 6892-1:2019). German version EN ISO 6892-1:2019; DIN: Berlin, Germany, 2019. [CrossRef]
  31. EN 13559:2014; Copper and Copper Alloys–Copper Plate, Sheet and Strip for Electrical Purposes. German Version EN 13599:2014; DIN: Berlin, Germany, 2014. [CrossRef]
  32. Friedland, G.; Jantz, K.; Rojas, R. SIOX: Simple interactive object extraction in still images. In Proceedings of the Seventh IEEE International Symposium on Multimedia (ISM’05), Irvine, CA, USA, 14 December 2005; p. 7. [Google Scholar] [CrossRef]
  33. DIN EN ISO 6507-1:2024-01; Metallic Materials—Vickers Hardness Test—Part 1: Test Method (ISO 6507-1:2023). German Version EN ISO 6507-1:2023; DIN: Berlin, Germany, 2024. [CrossRef]
  34. DIN EN ISO 25178-2:2023-09; Geometrical Product Specifications (GPS)—Surface Texture: Areal—Part 2: Terms, Definitions and surface Texture Parameters (ISO 25178-2:2021). German Version EN ISO 25178-2:2022; DIN: Berlin, Germany, 2023. [CrossRef]
  35. DIN EN ISO 25178-6:2010-06; Geometrical Product Specifications (GPS)—Surface Texture: Areal—Part 6: Classification of Methods for Measuring Surface Texture (ISO 25178-6:2010). German Version EN ISO 25178-6:2010; DIN: Berlin, Germany, 2010. [CrossRef]
  36. DIN EN ISO 19403-2:2020-04; Paints and Varnishes—Wettability—Part 2: Determination of the Surface Free Energy of Solid Surfaces by Measuring the Contact Angle (ISO 19403-2:2017). German Version EN ISO 19403-2:2020; DIN: Berlin, Germany, 2020. [CrossRef]
Figure 1. Oxidized samples of a previous investigation: (a) picture of welded and oxidized sample; (b) macroscopic picture of the failure surface of two oxidized sheets after peel testing, 250 ms welding time.
Metals 14 00892 g001
Figure 2. Schematic representation of the approach in this study.
Metals 14 00892 g002
Figure 3. Specimen geometry of test series 1 and 2: (a) test series 1 in shear test configuration; (b) test series 1 in peel test configuration, rotated upper plate by 180°; (c) test series 2 configuration.
Metals 14 00892 g003
Figure 4. Tensile test setups for the test series: (a) test series 1 in the shear tensile test; (b) test series 1 in the peel tensile test; (c) test series 2 in the peel tensile test; (d) photograph of clamping mask and sample prior test.
Metals 14 00892 g004aMetals 14 00892 g004b
Figure 5. Example of a 3D microscopic image of a fracture surface of test series 1.
Metals 14 00892 g005
Figure 6. Flow chart of the extraction approach in test series 1.
Metals 14 00892 g006
Figure 7. Example of a microscopic image of a fracture surface of test series 2.
Metals 14 00892 g007
Figure 8. Maximum tensile force of test series 1: (a) shear test configuration; (b) peel test configuration. Dashed line shows the corresponding model.
Metals 14 00892 g008aMetals 14 00892 g008b
Figure 9. Maximum tensile peel force and fracture work of test series 2: (a) welding time; (b) welding energy. Dashed line shows the corresponding model.
Metals 14 00892 g009
Figure 10. Sample picture of test series 1 and 2: (a) H150 (upper one) in test series 1, (b) H1100 (lower one) in series 1, (c) 50 ms in test series 2, (d) 300 ms in test series 2.
Metals 14 00892 g010aMetals 14 00892 g010b
Figure 11. Sample picture of test series 1: (a) H150 (upper plate) by method 1; (b) H150 (upper plate) by method 2; (c) H1100 (lower plate) by method 1; (d) H1100 (lower plate) by method 2.
Metals 14 00892 g011aMetals 14 00892 g011b
Figure 12. Joint area of test series 1: (a) by method 1; (b) by method 2; (c) weighted average, dashed line shows the corresponding model.
Metals 14 00892 g012aMetals 14 00892 g012b
Figure 13. Sample images of test series 2: (a) original image with 100 ms weld time; (b) image preprocessed by ImageJ.
Metals 14 00892 g013
Figure 14. Derived joint area of individual welds of test series 2: (a) welding time; (b) welding energy. Dashed line shows the corresponding model.
Metals 14 00892 g014
Figure 15. Joint strength of test series 1: (a) shear strength; (b) peel strength. Dashed line shows the corresponding model.
Metals 14 00892 g015
Figure 16. Joint strength of test series 2: (a) welding time; (b) welding energy. Dashed line shows the corresponding model.
Metals 14 00892 g016aMetals 14 00892 g016b
Table 1. Mechanical parameters of cold-rolled copper material used in experiments.
Test SeriesMaterial and Rolling State 1AbbreviationReal 2 RM
[MPa]
Specified 1 RM
[Mpa]
Thickness [mm]
1EN CW004A—softW232 220–2601.0
1EN CW004A—half-hardHH257 240–3001.0
1EN CW004A—hardH305 290–3601.0
2EN CW008A—half-hard-259 240–3001.5
2EN CW004A—half-hard-249240–3000.5
1 Material specification and rolling state according to DIN EN 13599:2014-12 [31] 2 Mean value determined in a tensile test of 5 (test series 1) or 7 (test series 2) samples.
Table 2. Welding and welding tool parameters.
Test SeriesSonotrode—Λ/2 LongitudinalForce 1Amplitude 1Time Range 1
18 mm × 8 mm imprint
0.8 mm pyramids, 90°, flattened by 0.1 mm, diagonal to oscillation
2500 N25 µm150 ms to 1200 ms
50 ms steps
Optimum 1050 ms
25 mm × 5 mm imprint
0.5 mm pyramids, 90°, diagonal to oscillation
1250 N24 µm25 ms to 400 ms
25 ms steps
Optimum 250 ms
1 Force and amplitude are optimized parameters, time ranges from the start of weld formation to the optimum and over-welding.
Table 3. Mechanical testing parameters.
Test SeriesLoad TypeTesting SpeedFree LengthTest End Criteria
1Shear10 mm/min50 mmForce drop of 80%
1Peel10° mm/min50 mmForce drop of 95%
2Peel10° mm/min20 mmForce drop of 95%
Table 4. Coefficients of force model in test series 1.
Load TypeMaterialabcR2
ShearH−2.111 × 10⁵−2.768621066.31%
ShearHH−8.823 × 10⁶−5.054450494.94%
ShearW−4.237 × 10⁷−5.806356194.58%
PeelH−3.66 × 10⁴−2.776576.956.68%
PeelHH2.7692.4124−0.662271.10%
PeelW3.343 × 10−47.2285.0271.47%
Table 5. Coefficients of welding quality feature models of test series 2.
Quality FeatureVariableabcdR2
Peel Forcetime−2 × 10−70.0031.9128−53.16781.22%
Fracture worktime−1 × 10⁻⁸−6 × 10−60.0054−0.208164.42%
Peel Forceenergy3 × 10−6−0.0072.45746.39386.14%
Fracture workenergy−1 × 10⁻⁸−2 × 10−50.007−0.031472.02%
Table 6. Model parameters for the calculation of area of test series 1.
Quality FeatureMaterialabR2
AreaH8.1905−28.19993.68%
AreaHH9.1669−37.02990.43%
AreaW14.971−74.85892.02%
Table 7. Model parameters for calculation of area of test series 2.
Quality FeatureMaterialVariableabR2
AreaHHtime7.792−25.2791.35%
AreaHHenergy5.789−11.8388.56%
Table 8. Model parameters for calculation of joint strength of test series 1.
Quality FeatureMaterialVariable abcR2
Shear StrengthHtime13.22−214.8104072.26%
Shear StrengthHHtime−34.4388.6−892.678.35%
Shear StrengthWtime−120.11479−438676.57%
Peel StrengthHtime−1.72121.03−48.973.70%
Peel StrengthHHtime−1.03711.94−22.0218.04%
Peel StrengthWtime3.99149.84−138.710.06%
Table 9. Model parameters for calculation of area of test series 2.
Quality FeatureVariable abcdR2
Peel Strengthtime2.477 × 10−7−3.619 × 10−40.09087.66142.30%
Fracture Work Strengthtime1.713 × 10−9−1.933 × 10−65.702 × 10−4−0.0128361.70%
Peel Strengthenergy1.443 × 10−7−2.398 × 10−40.083345.44432.11%
Fracture Work Strengthenergy3.063 × 10−9−2.693 × 10−65.622 × 10−40.00393269.59%
Disclaimer/Publisher’s Note: The statements, opinions and data contained in all publications are solely those of the individual author(s) and contributor(s) and not of MDPI and/or the editor(s). MDPI and/or the editor(s) disclaim responsibility for any injury to people or property resulting from any ideas, methods, instructions or products referred to in the content.

