
Low-Carbon Steel Formed by DRECE Method with Hot-Dip Zinc Galvanizing and Potentiodynamic Polarization Tests to Study Its Corrosion Behavior


Abstract
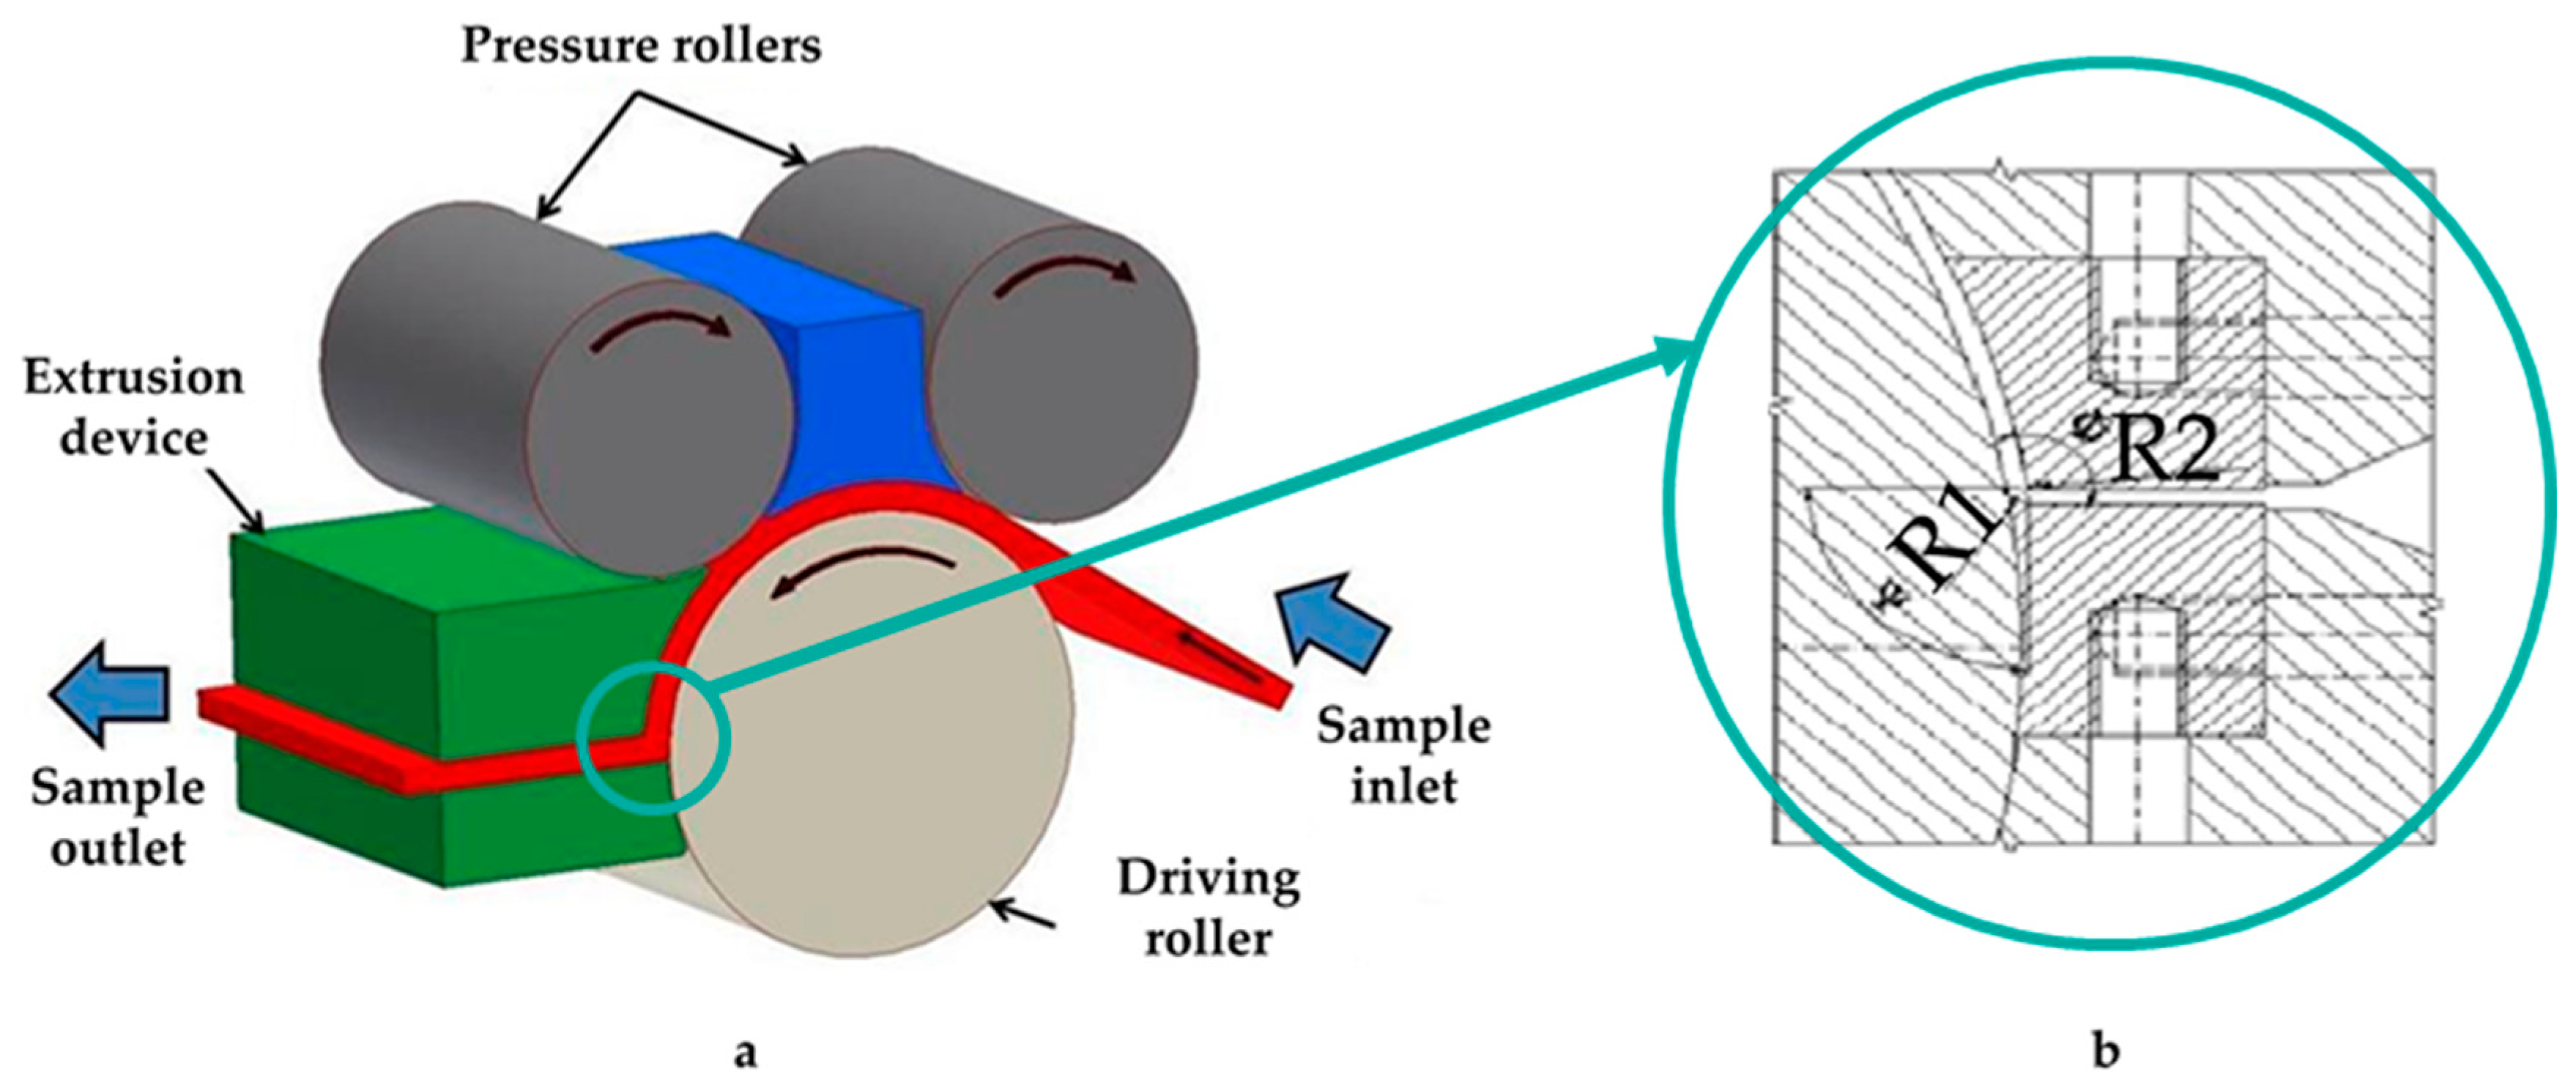
:1. Introduction
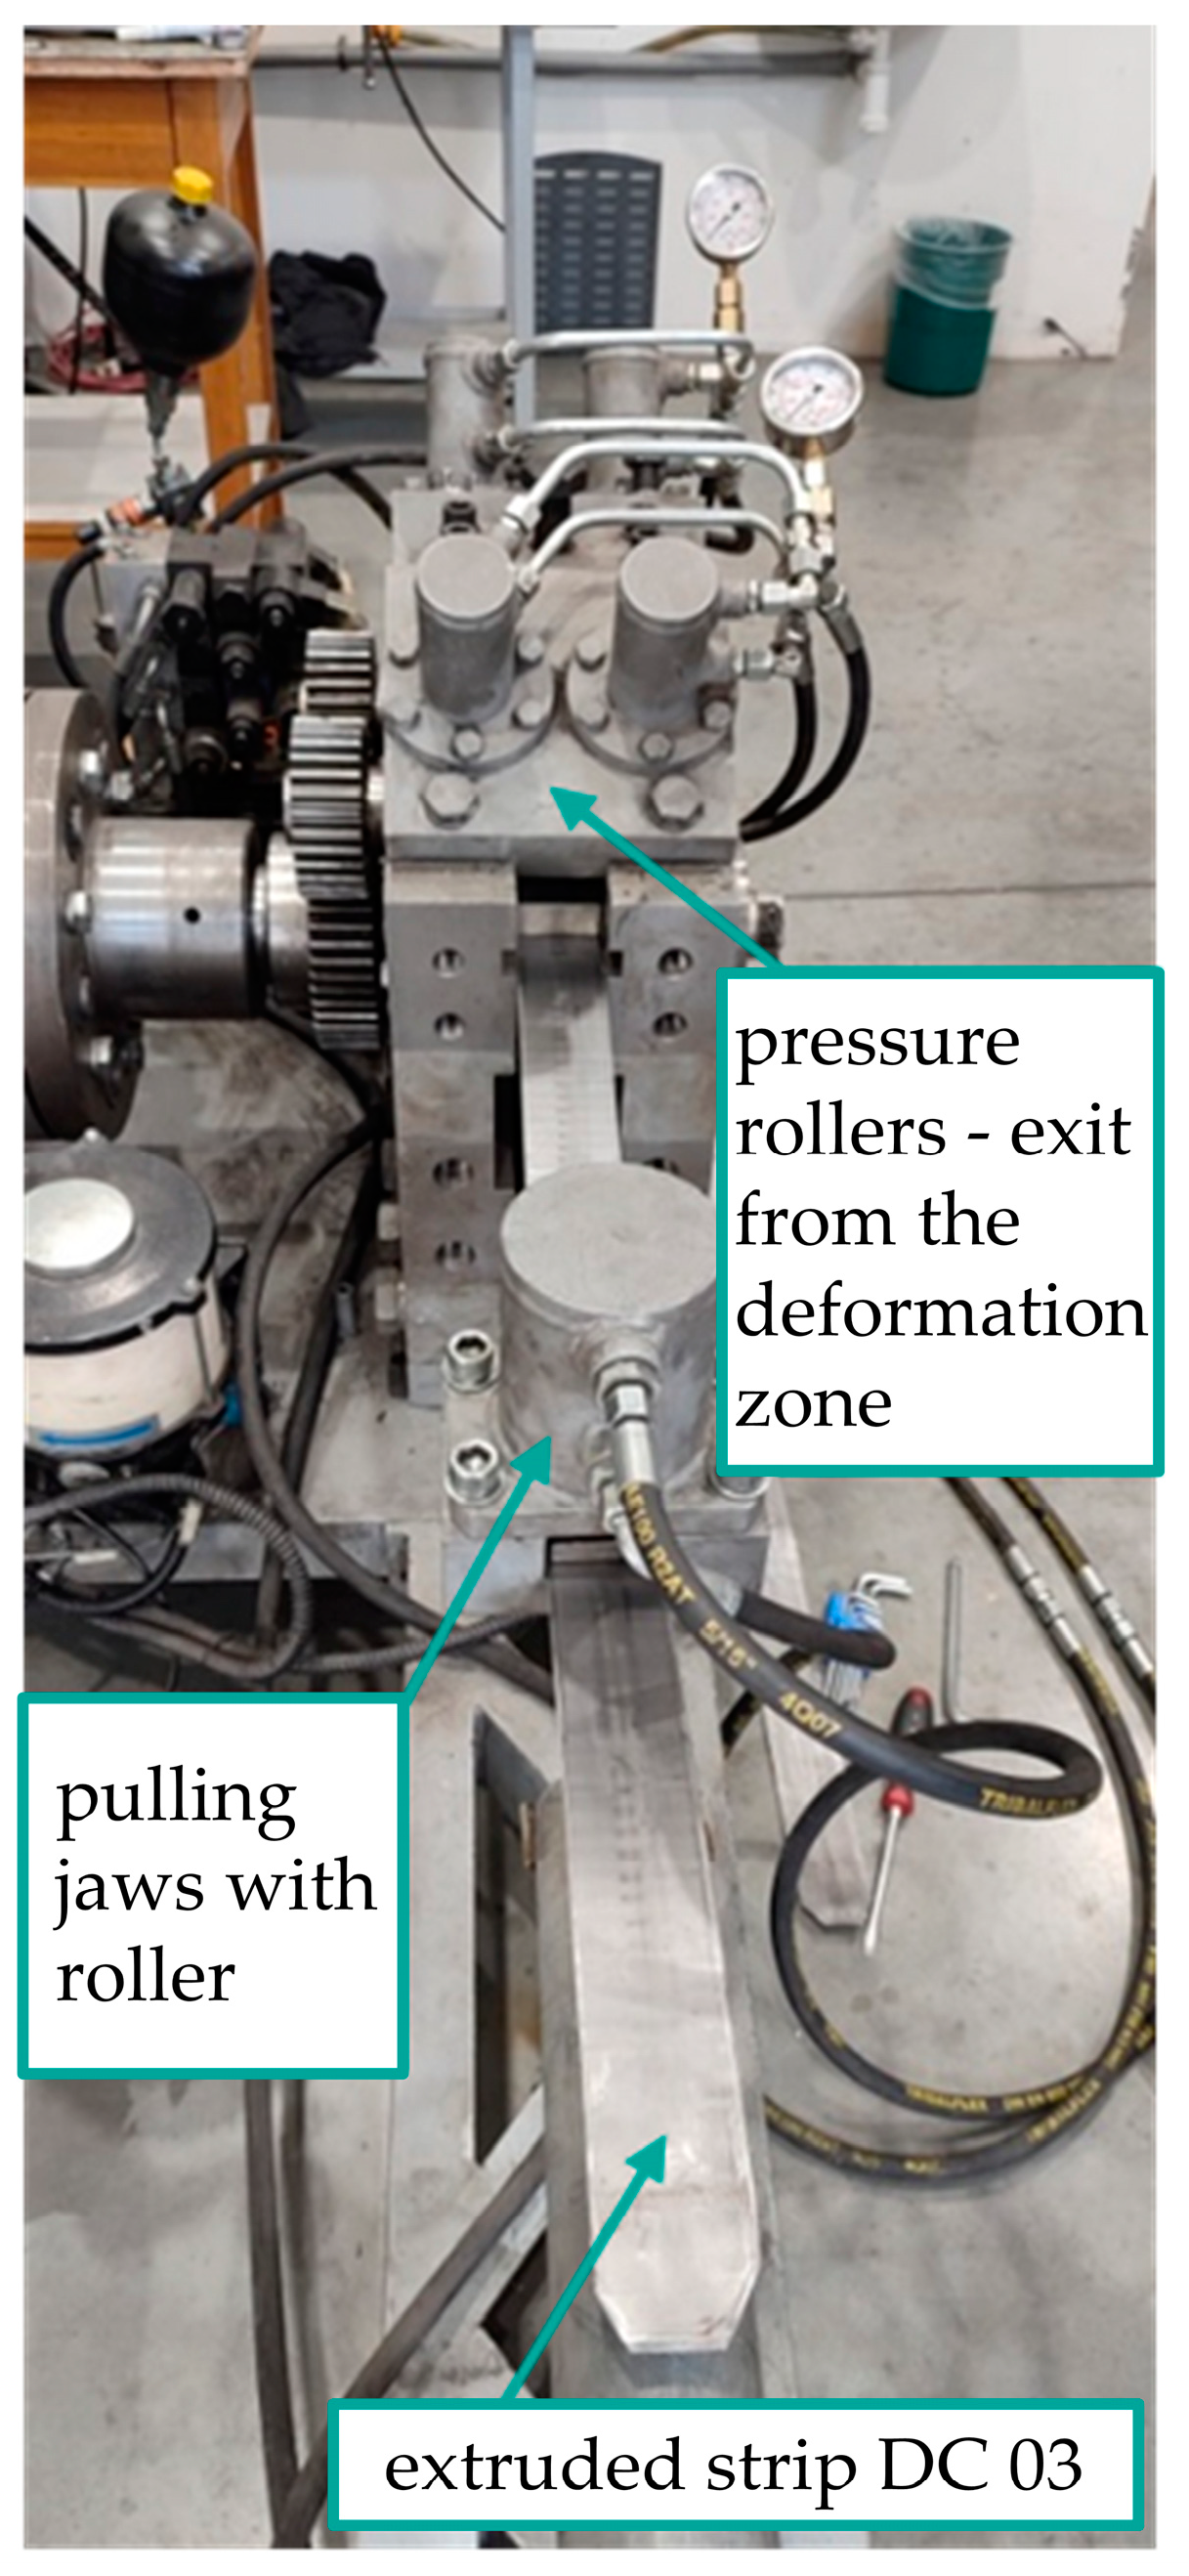
2. Materials and Methods
3. Results and Discussion
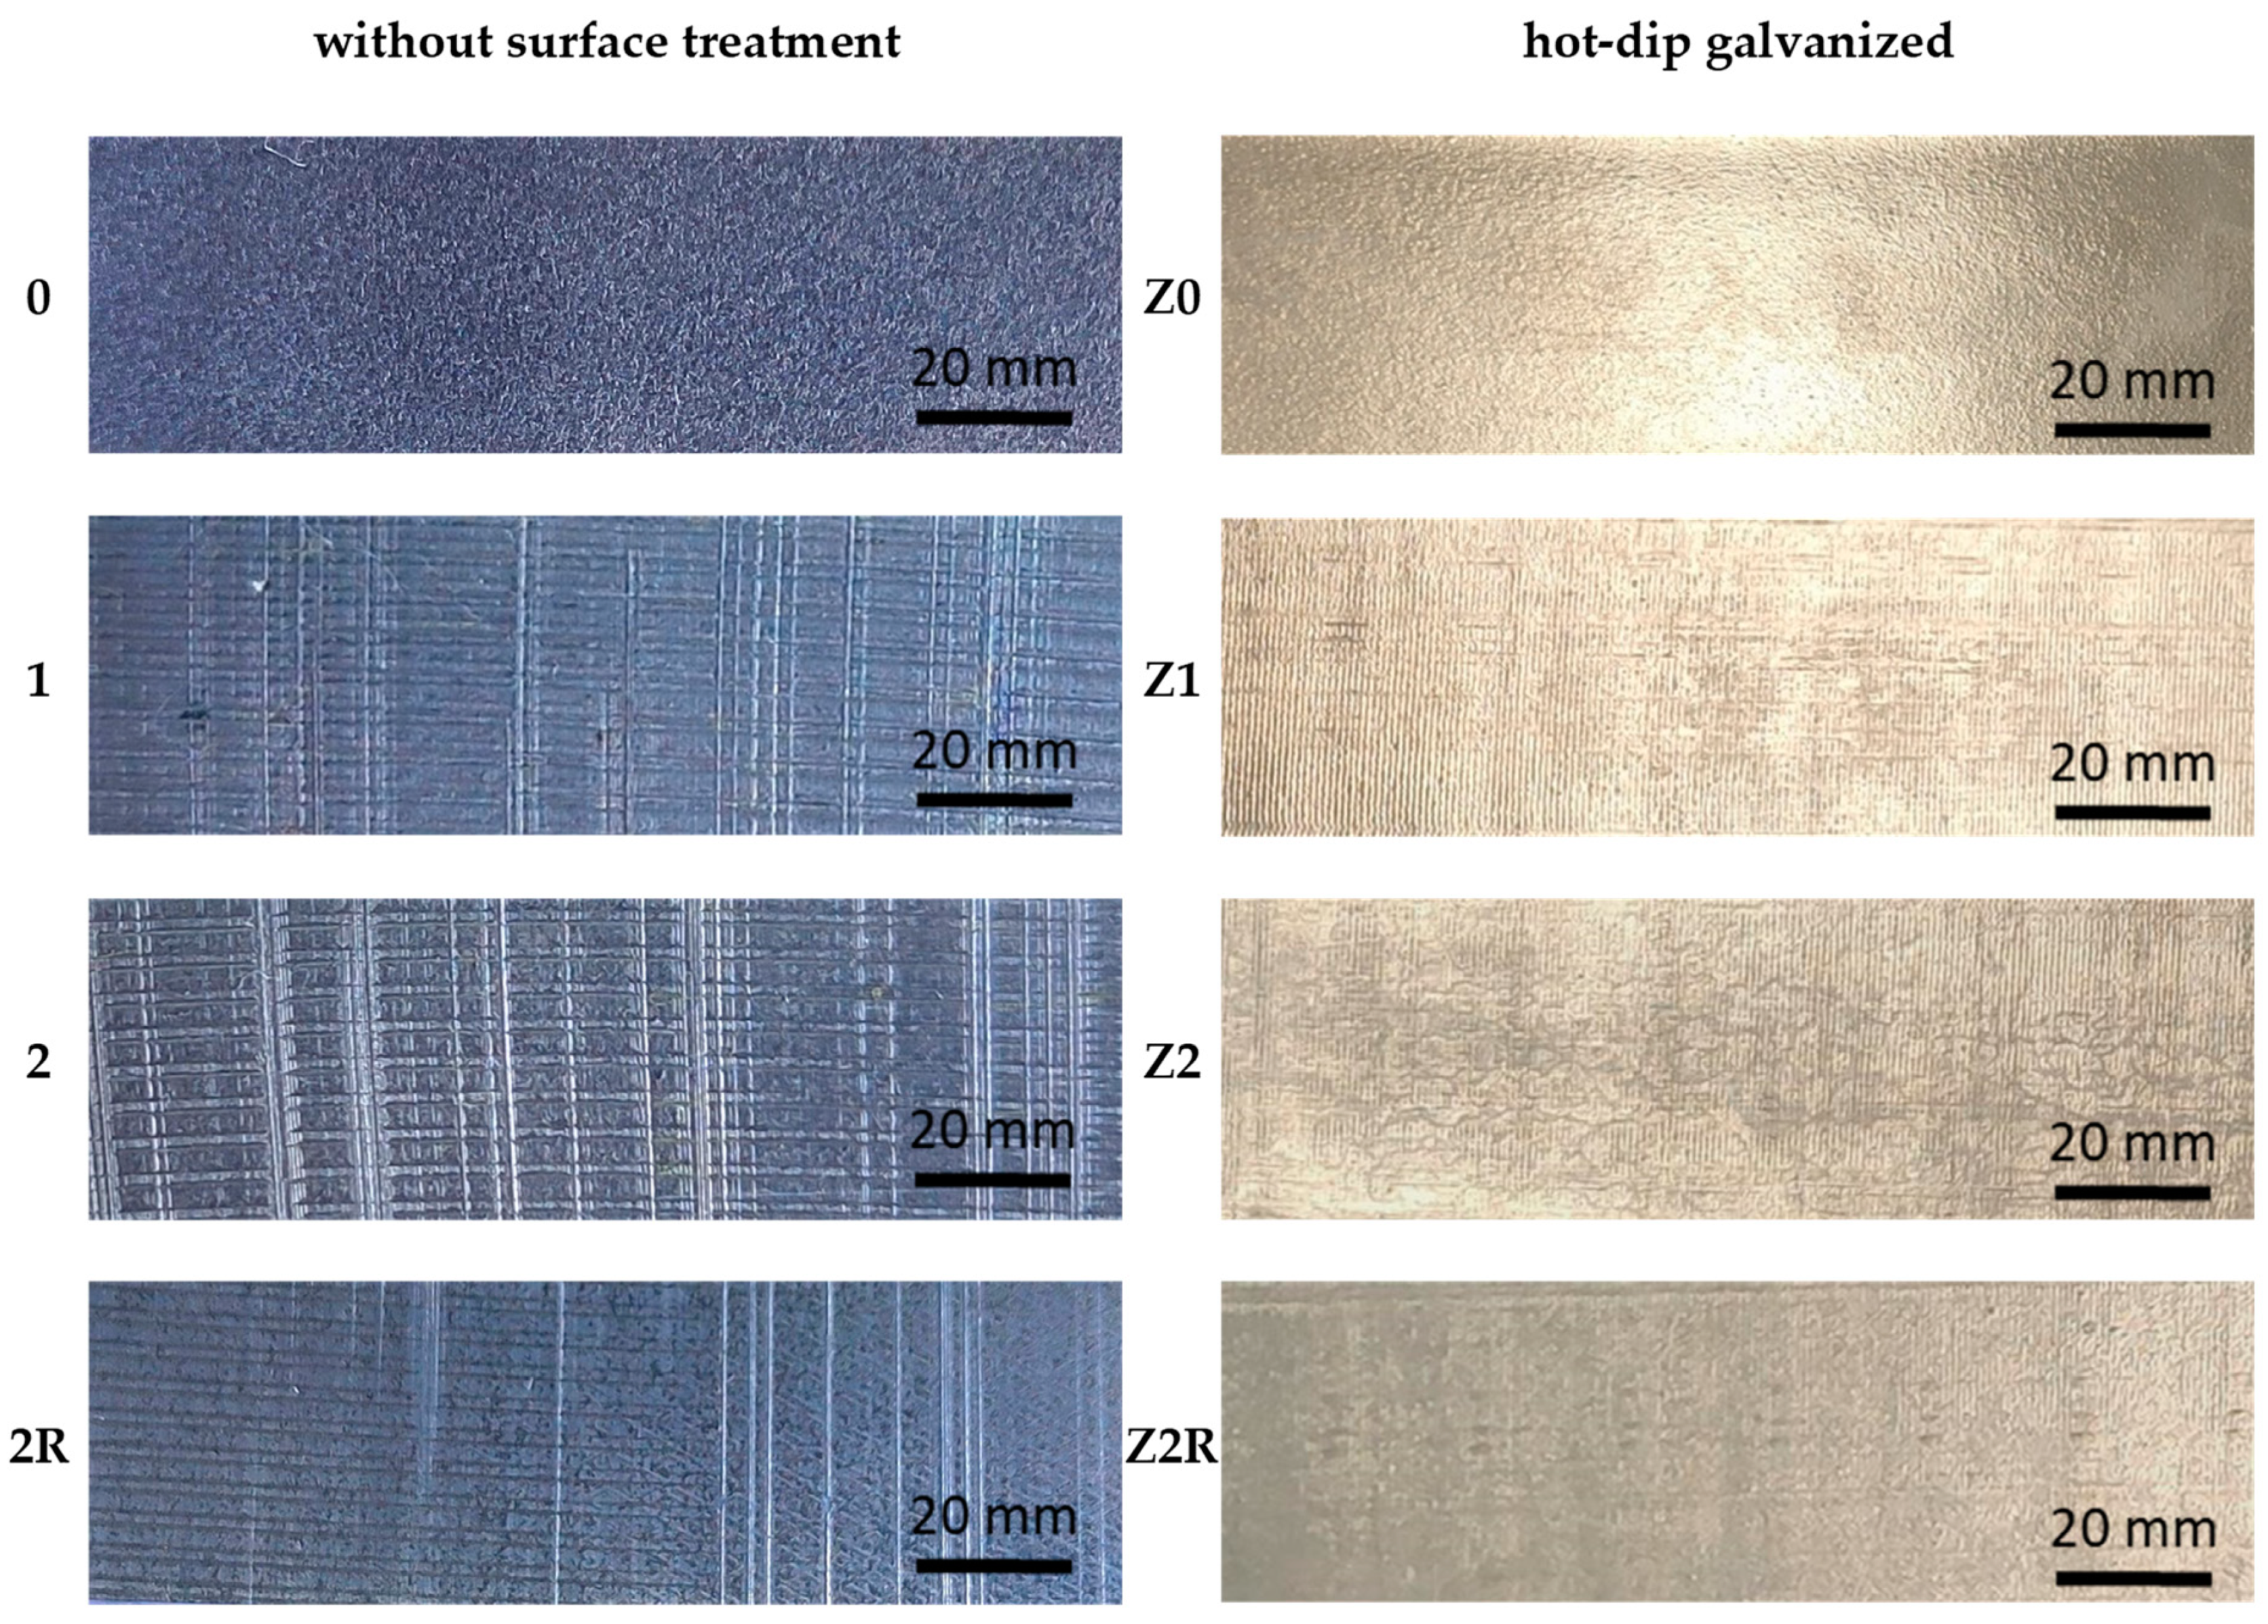
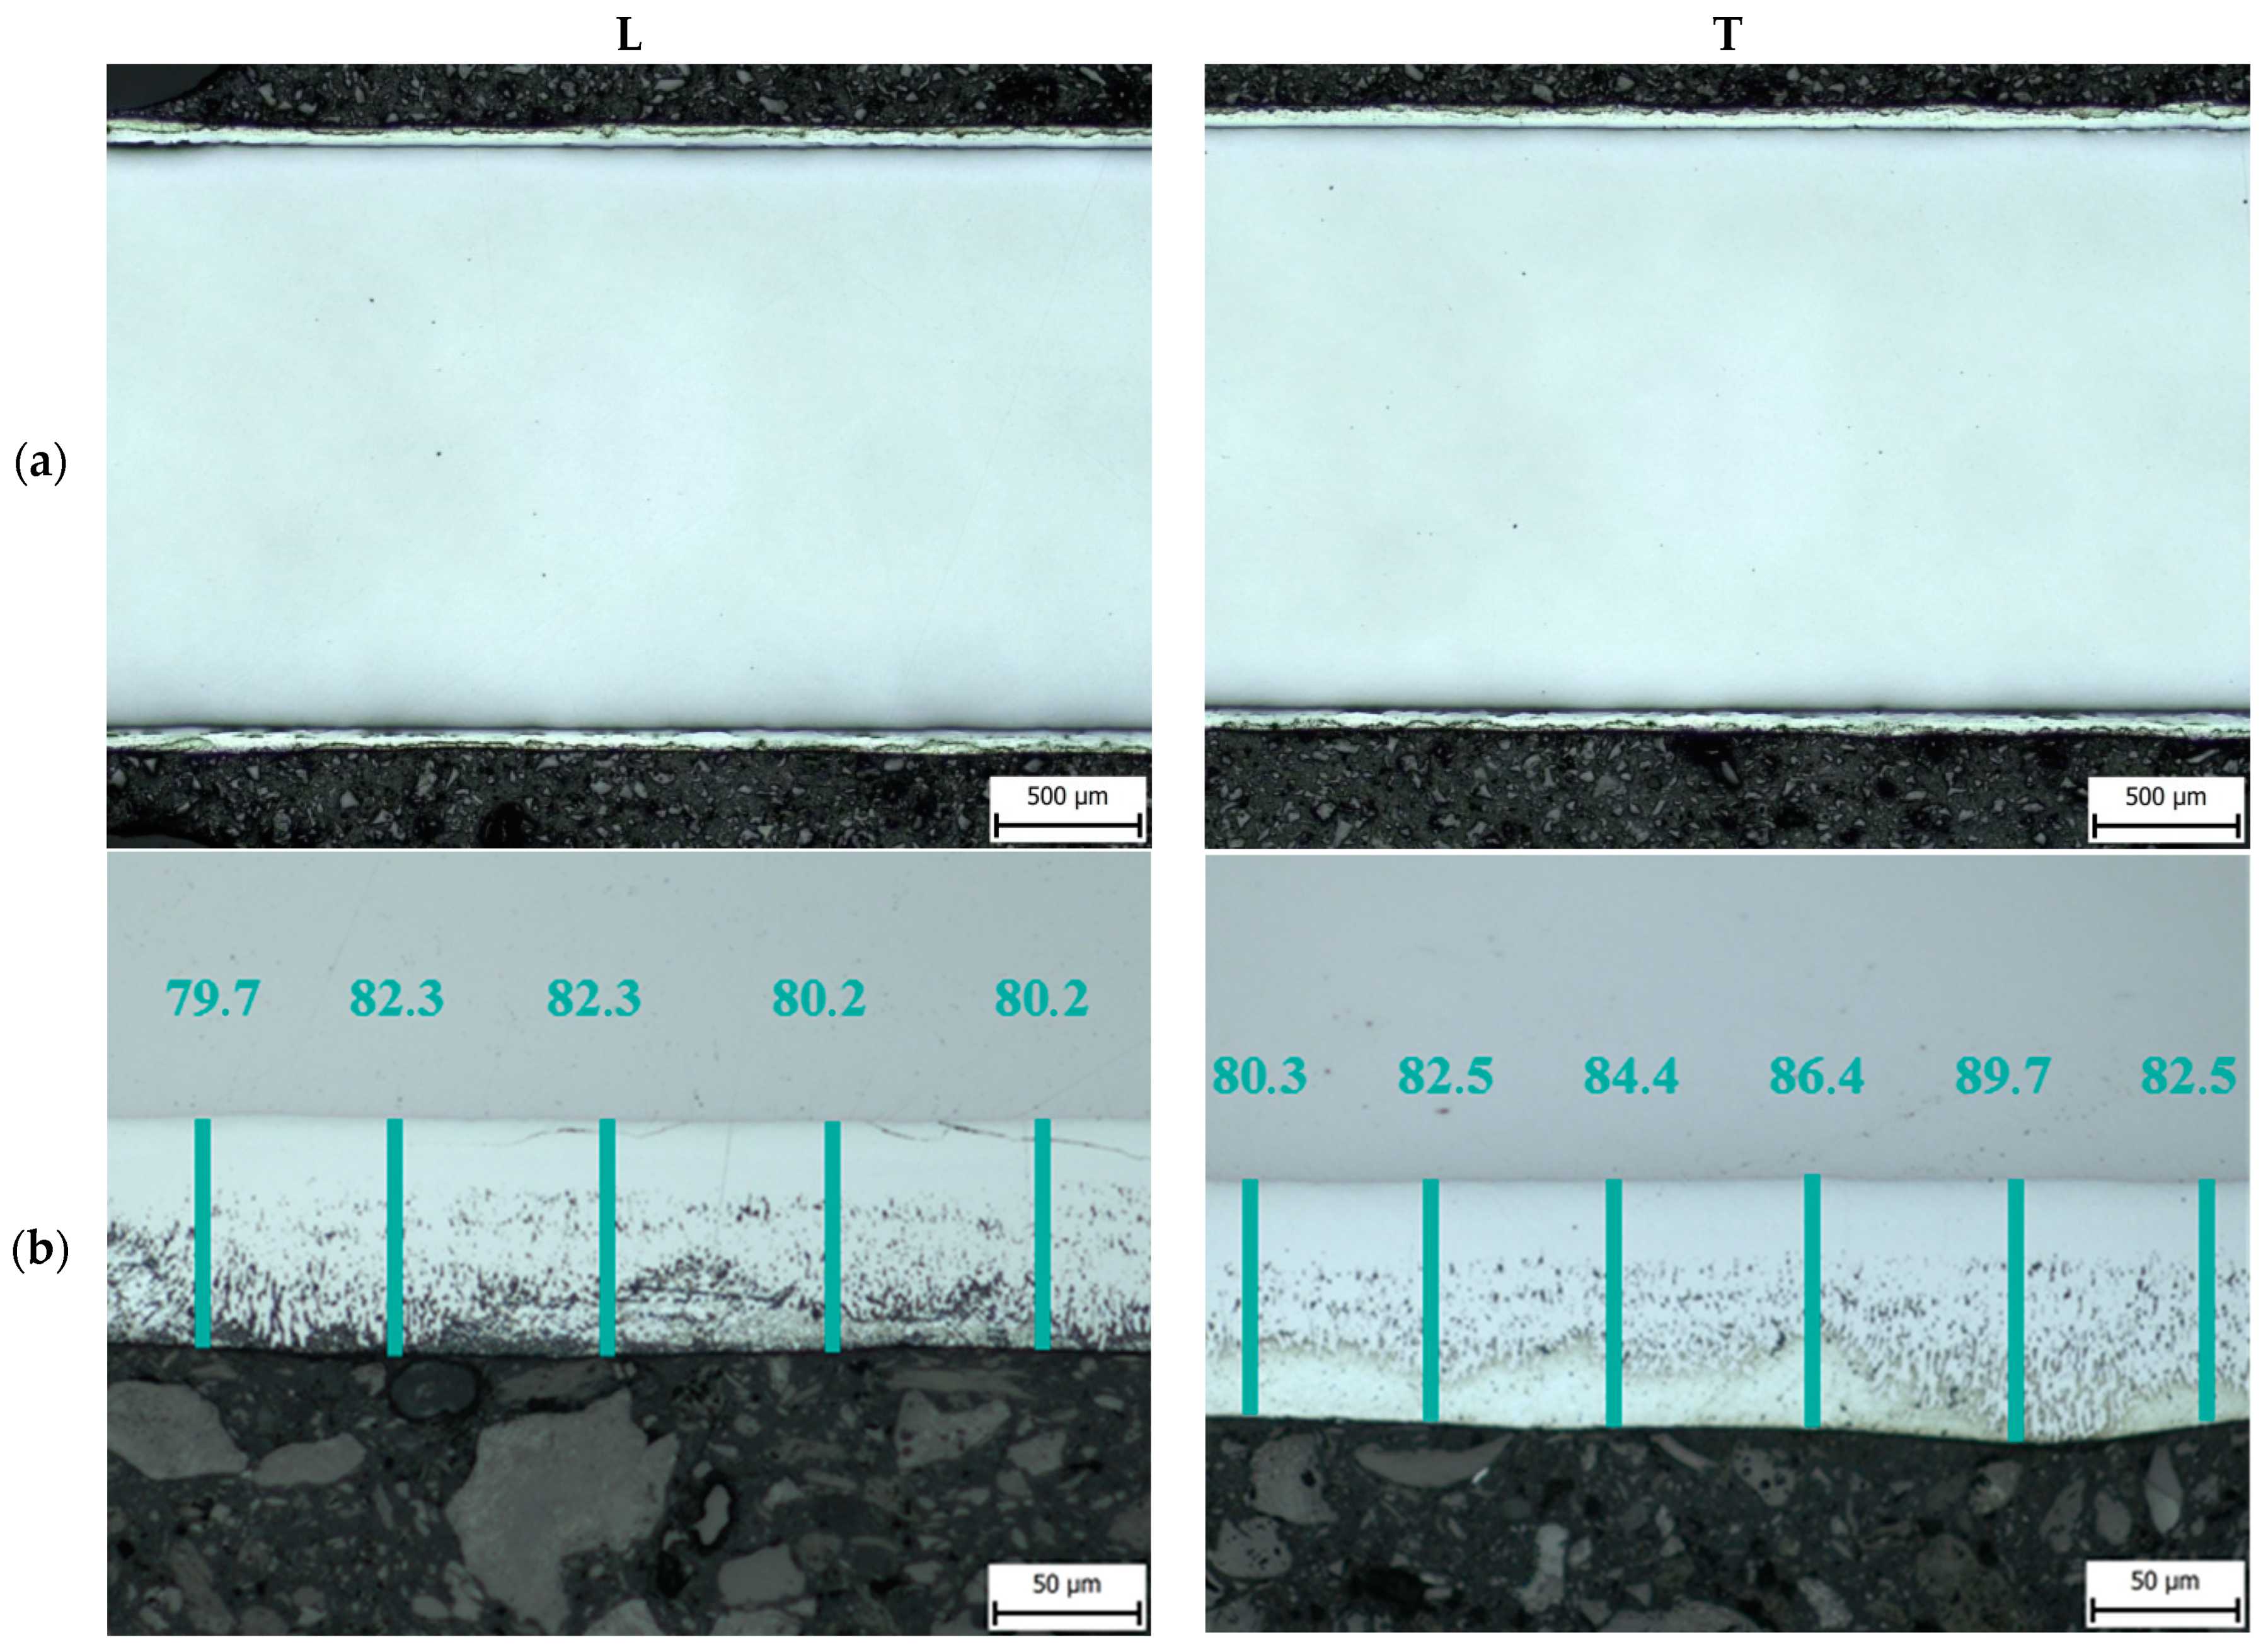
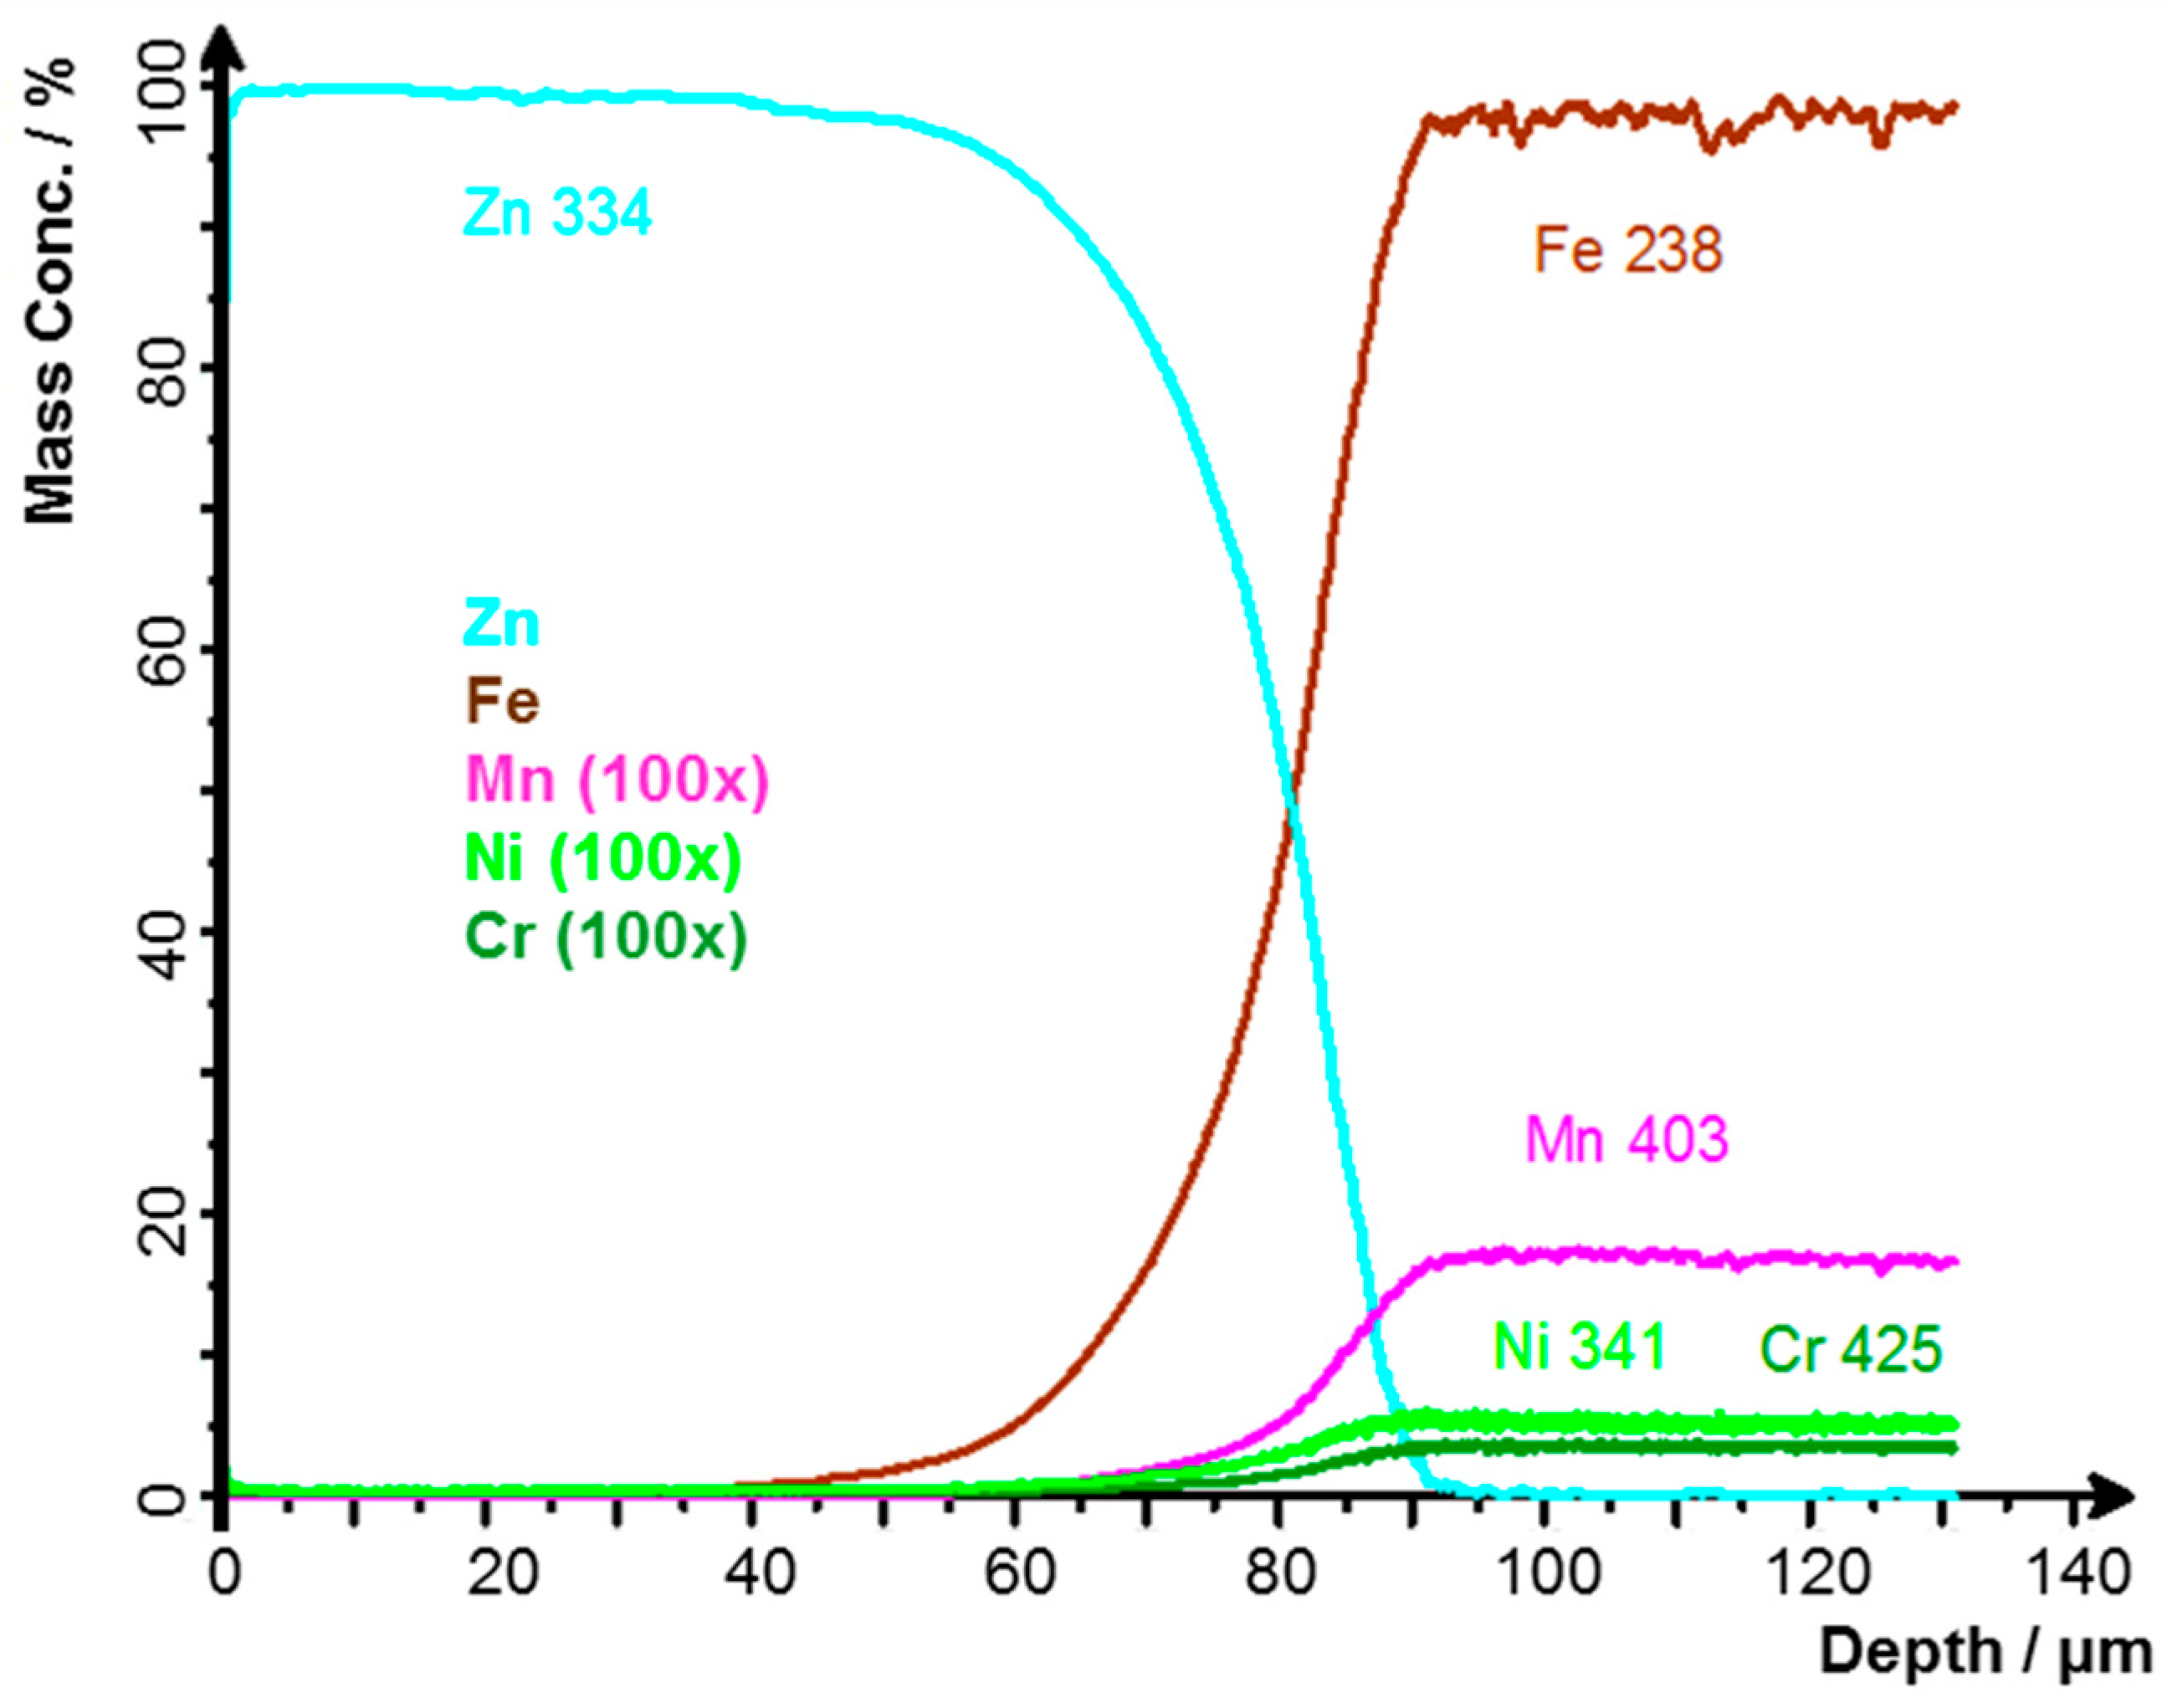
3.1. Thickness of the Zinc Layer
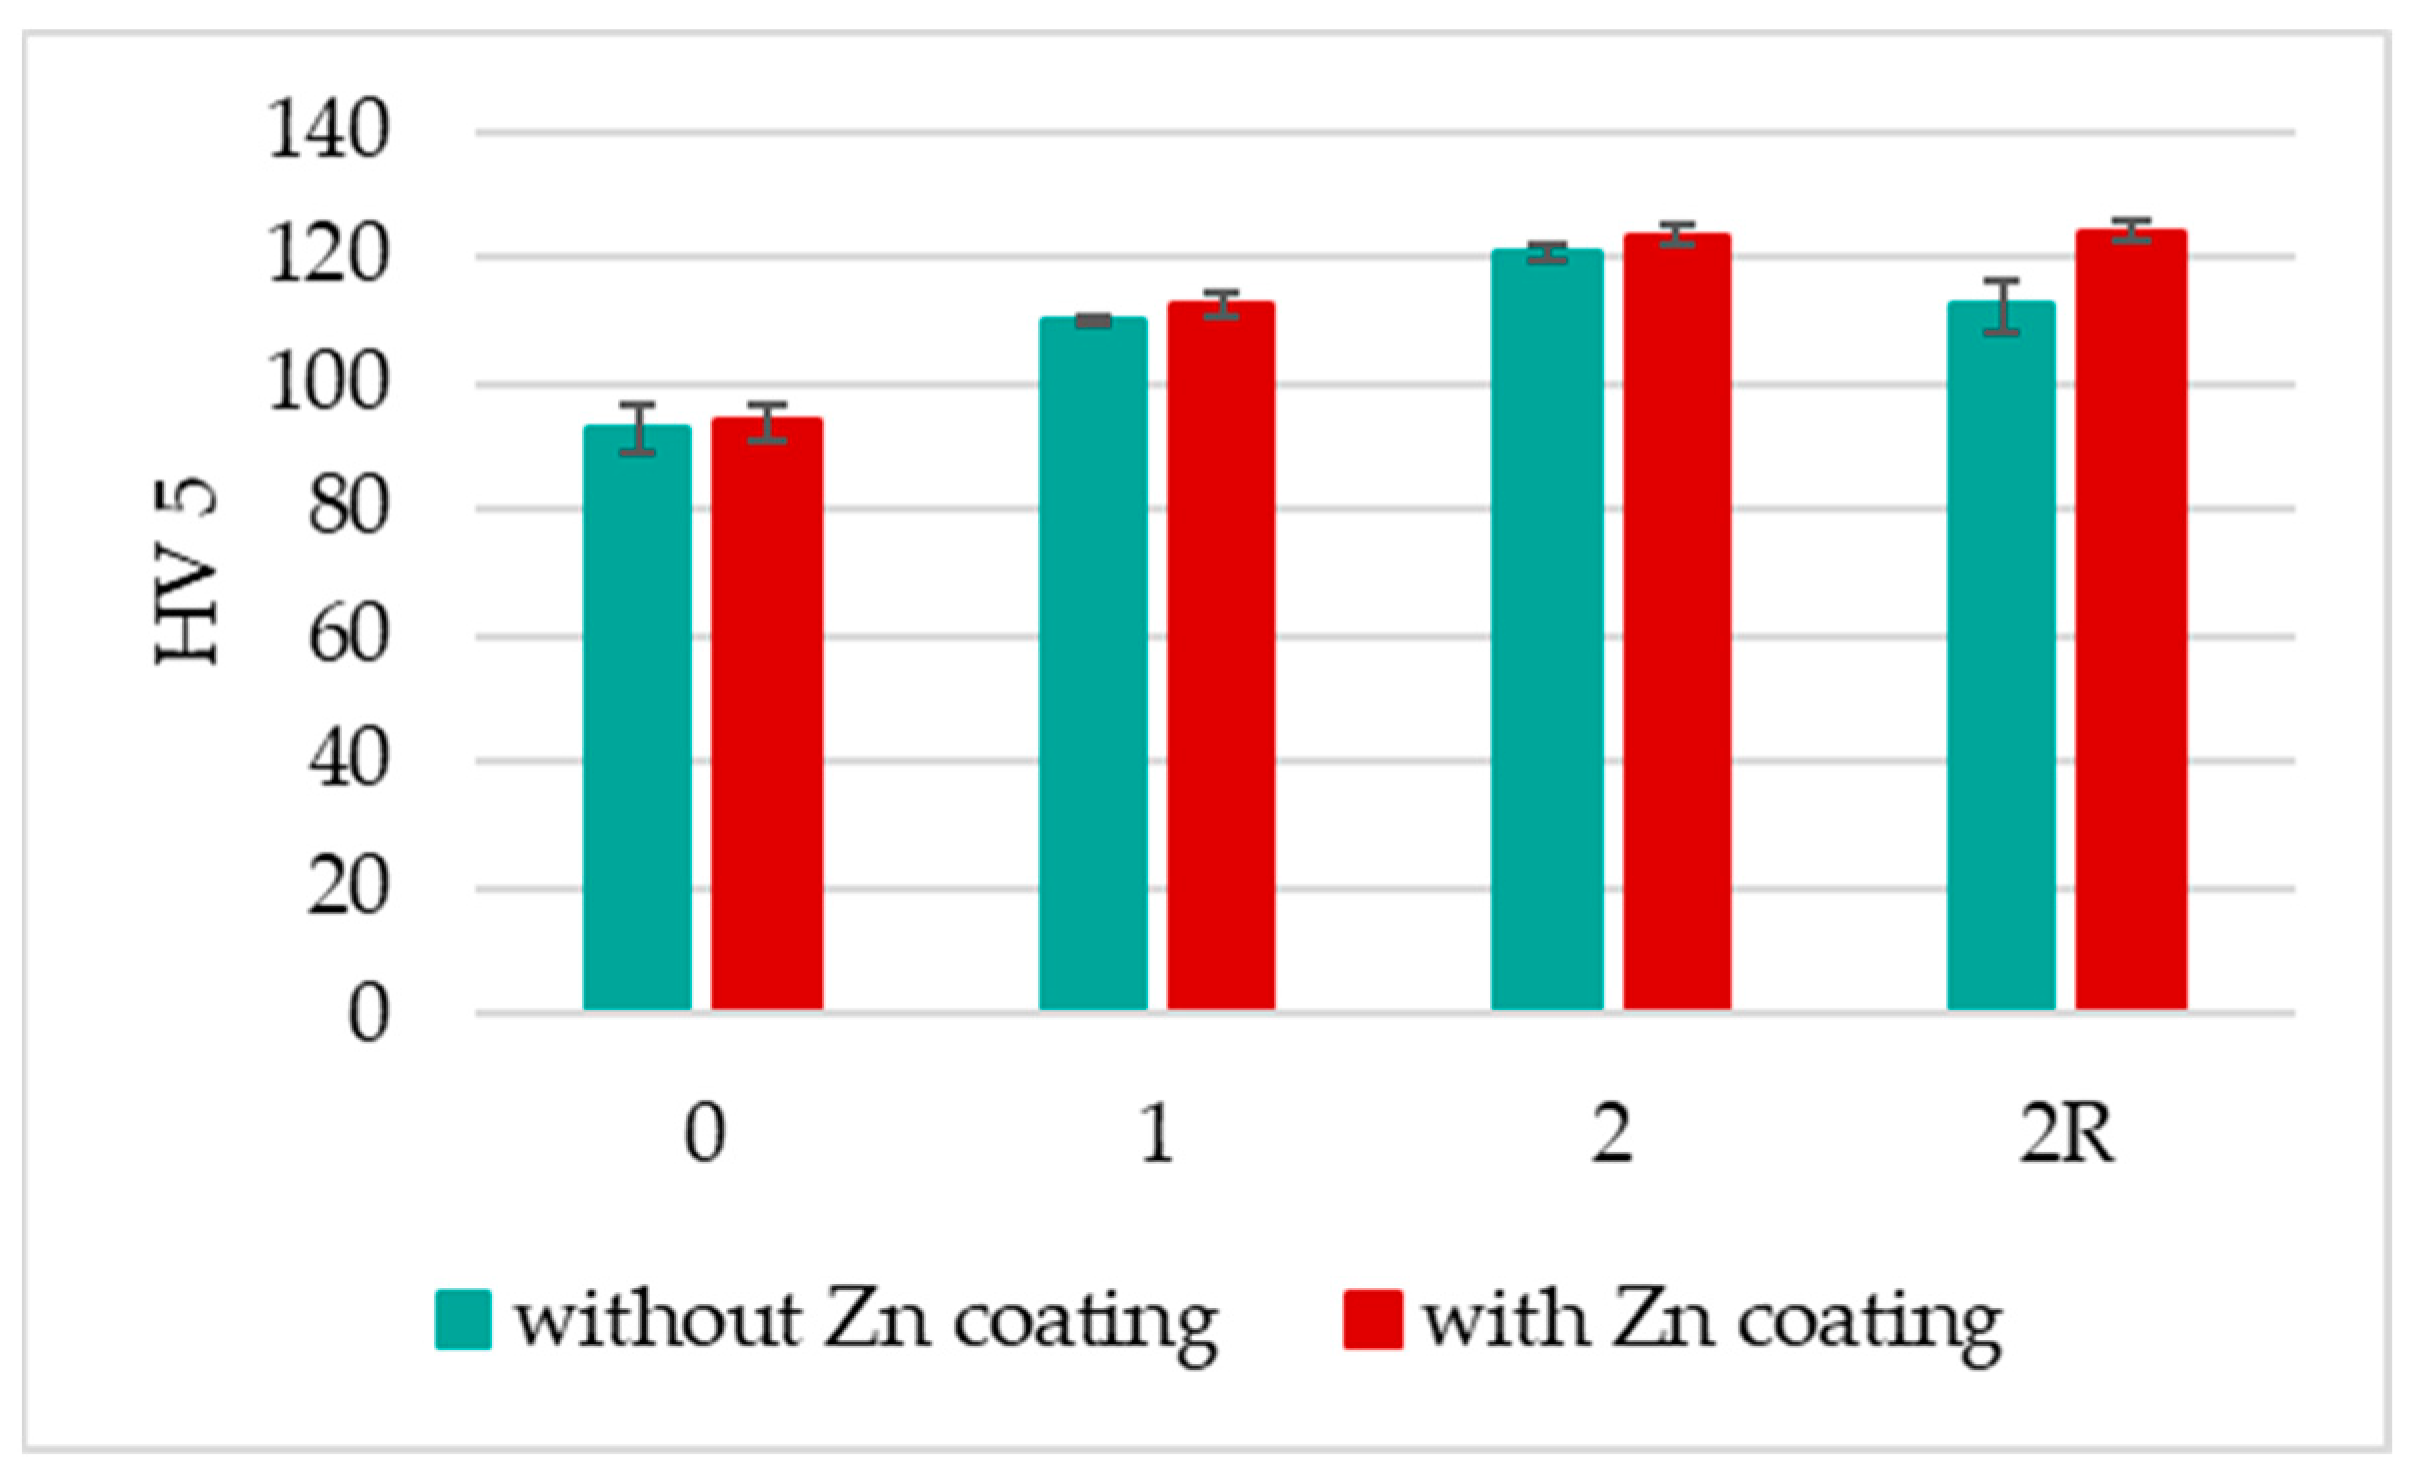
3.2. HV 5 Hardness
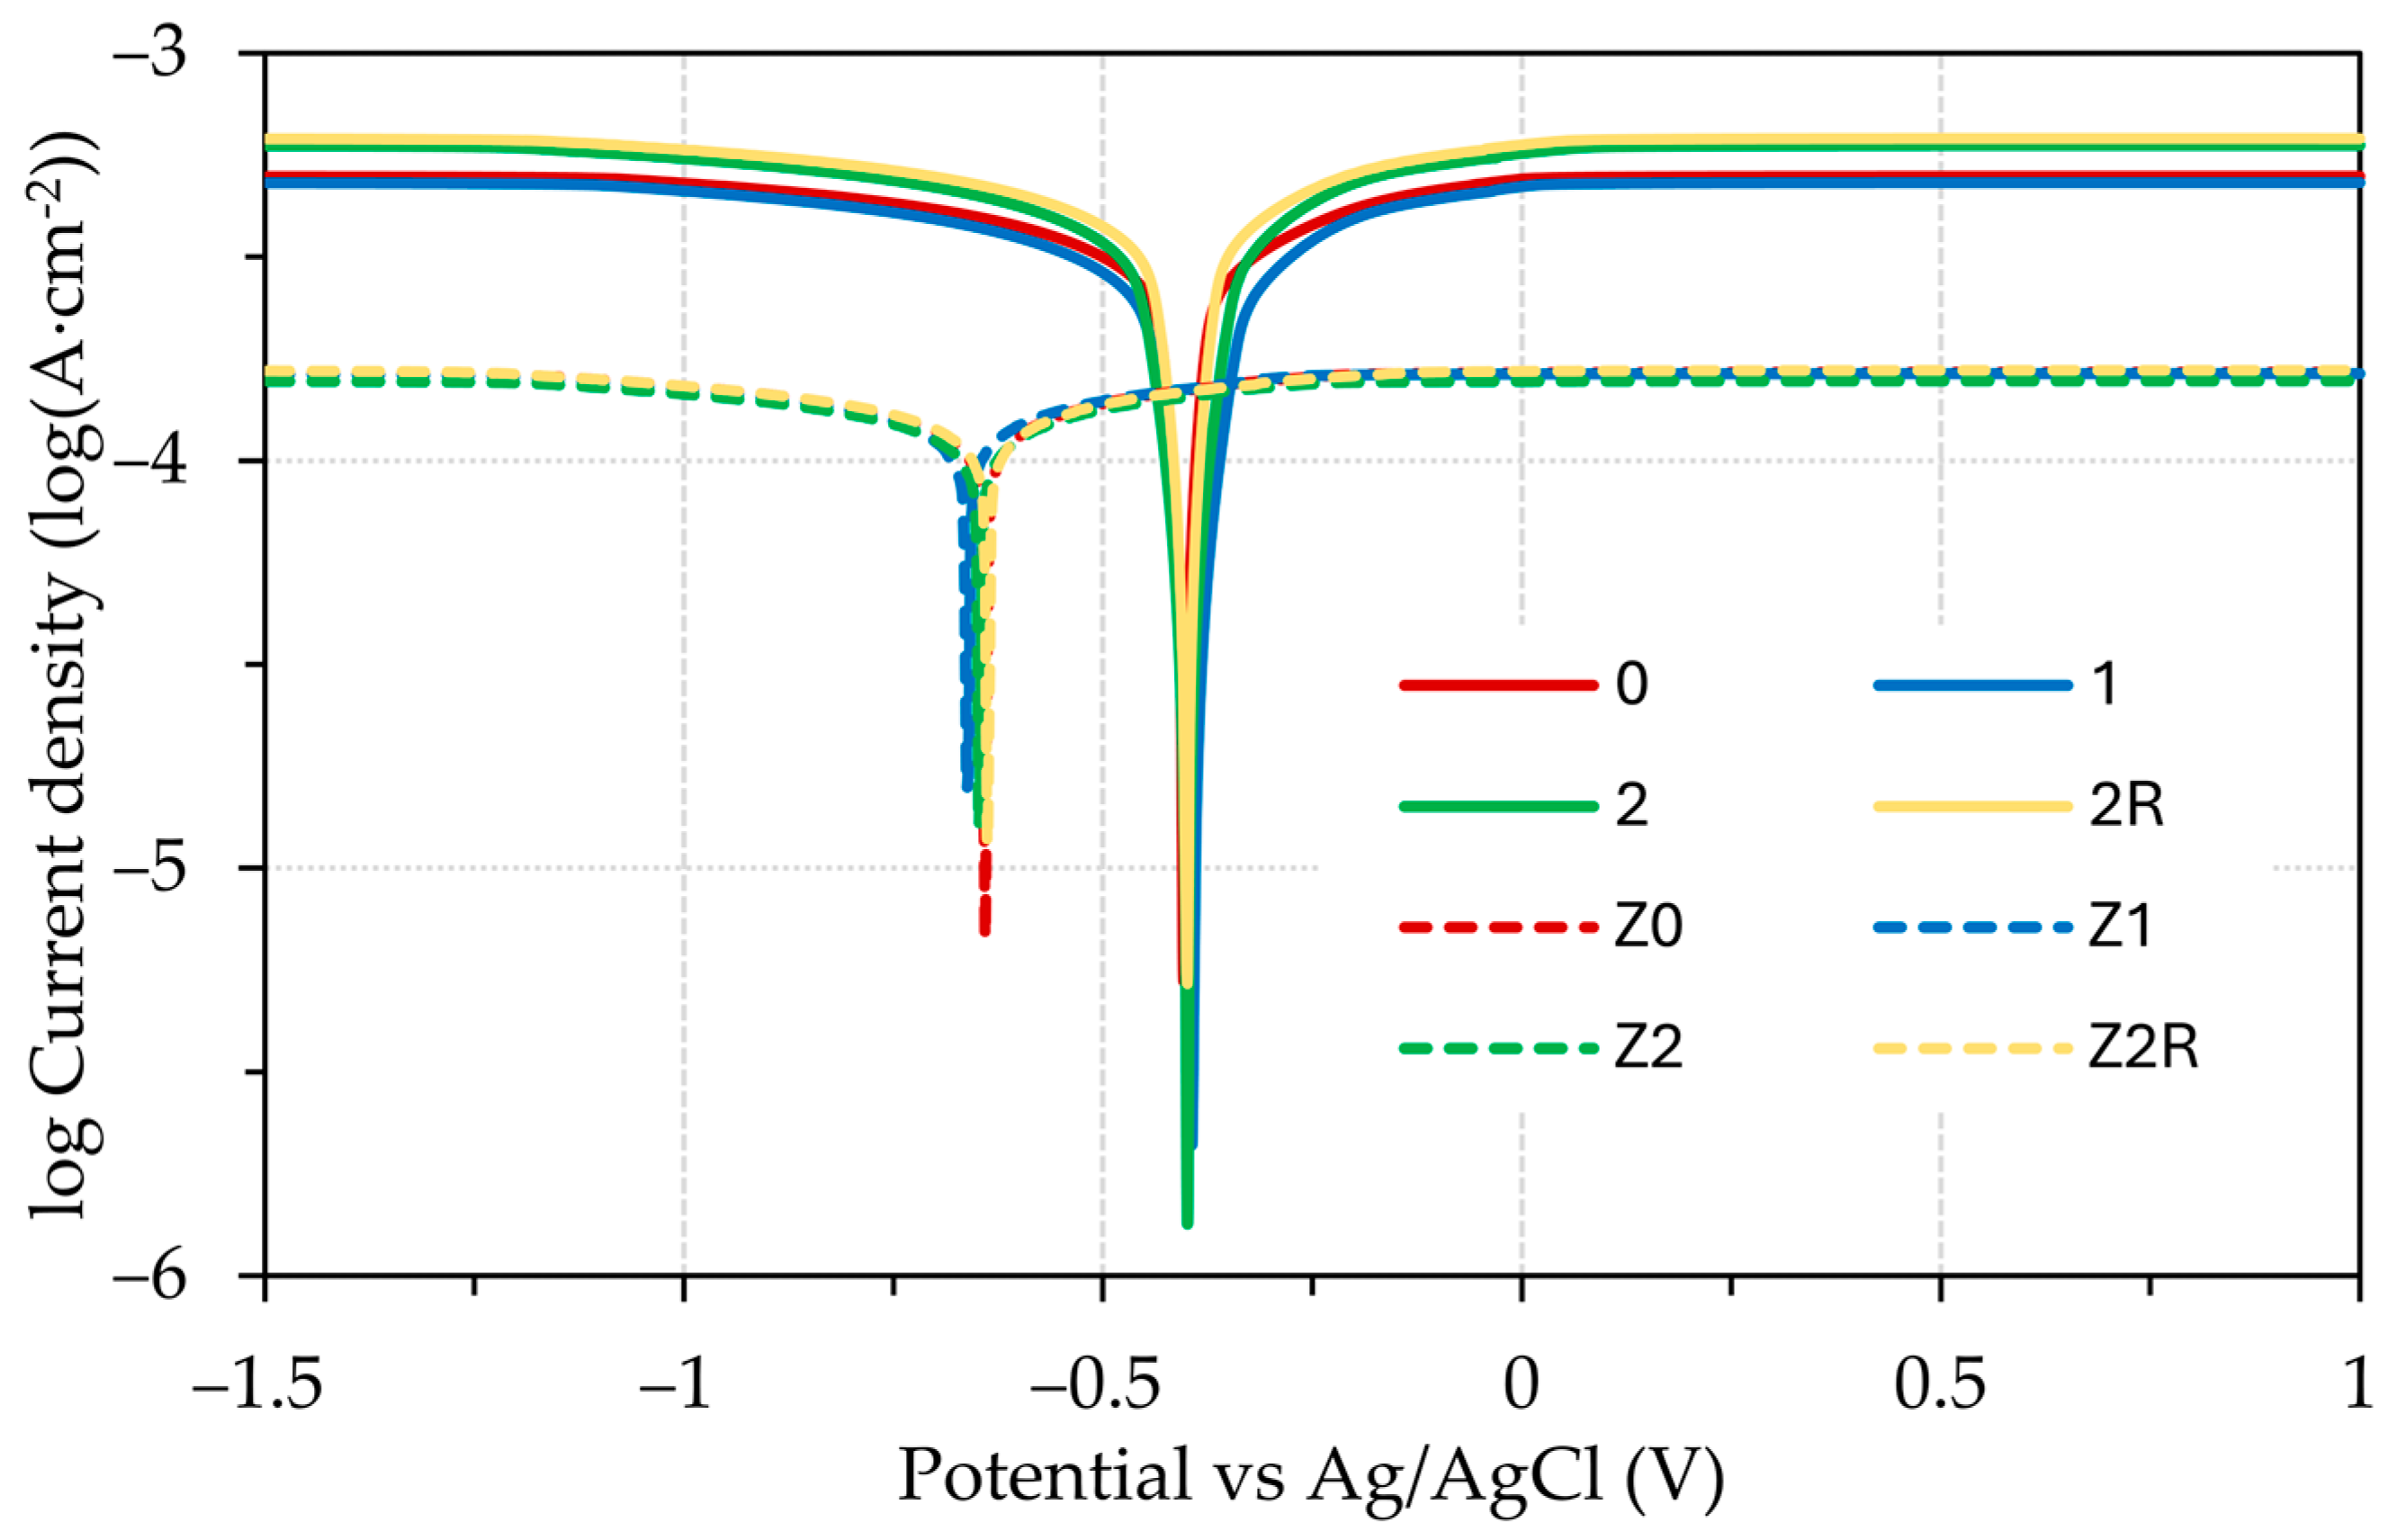
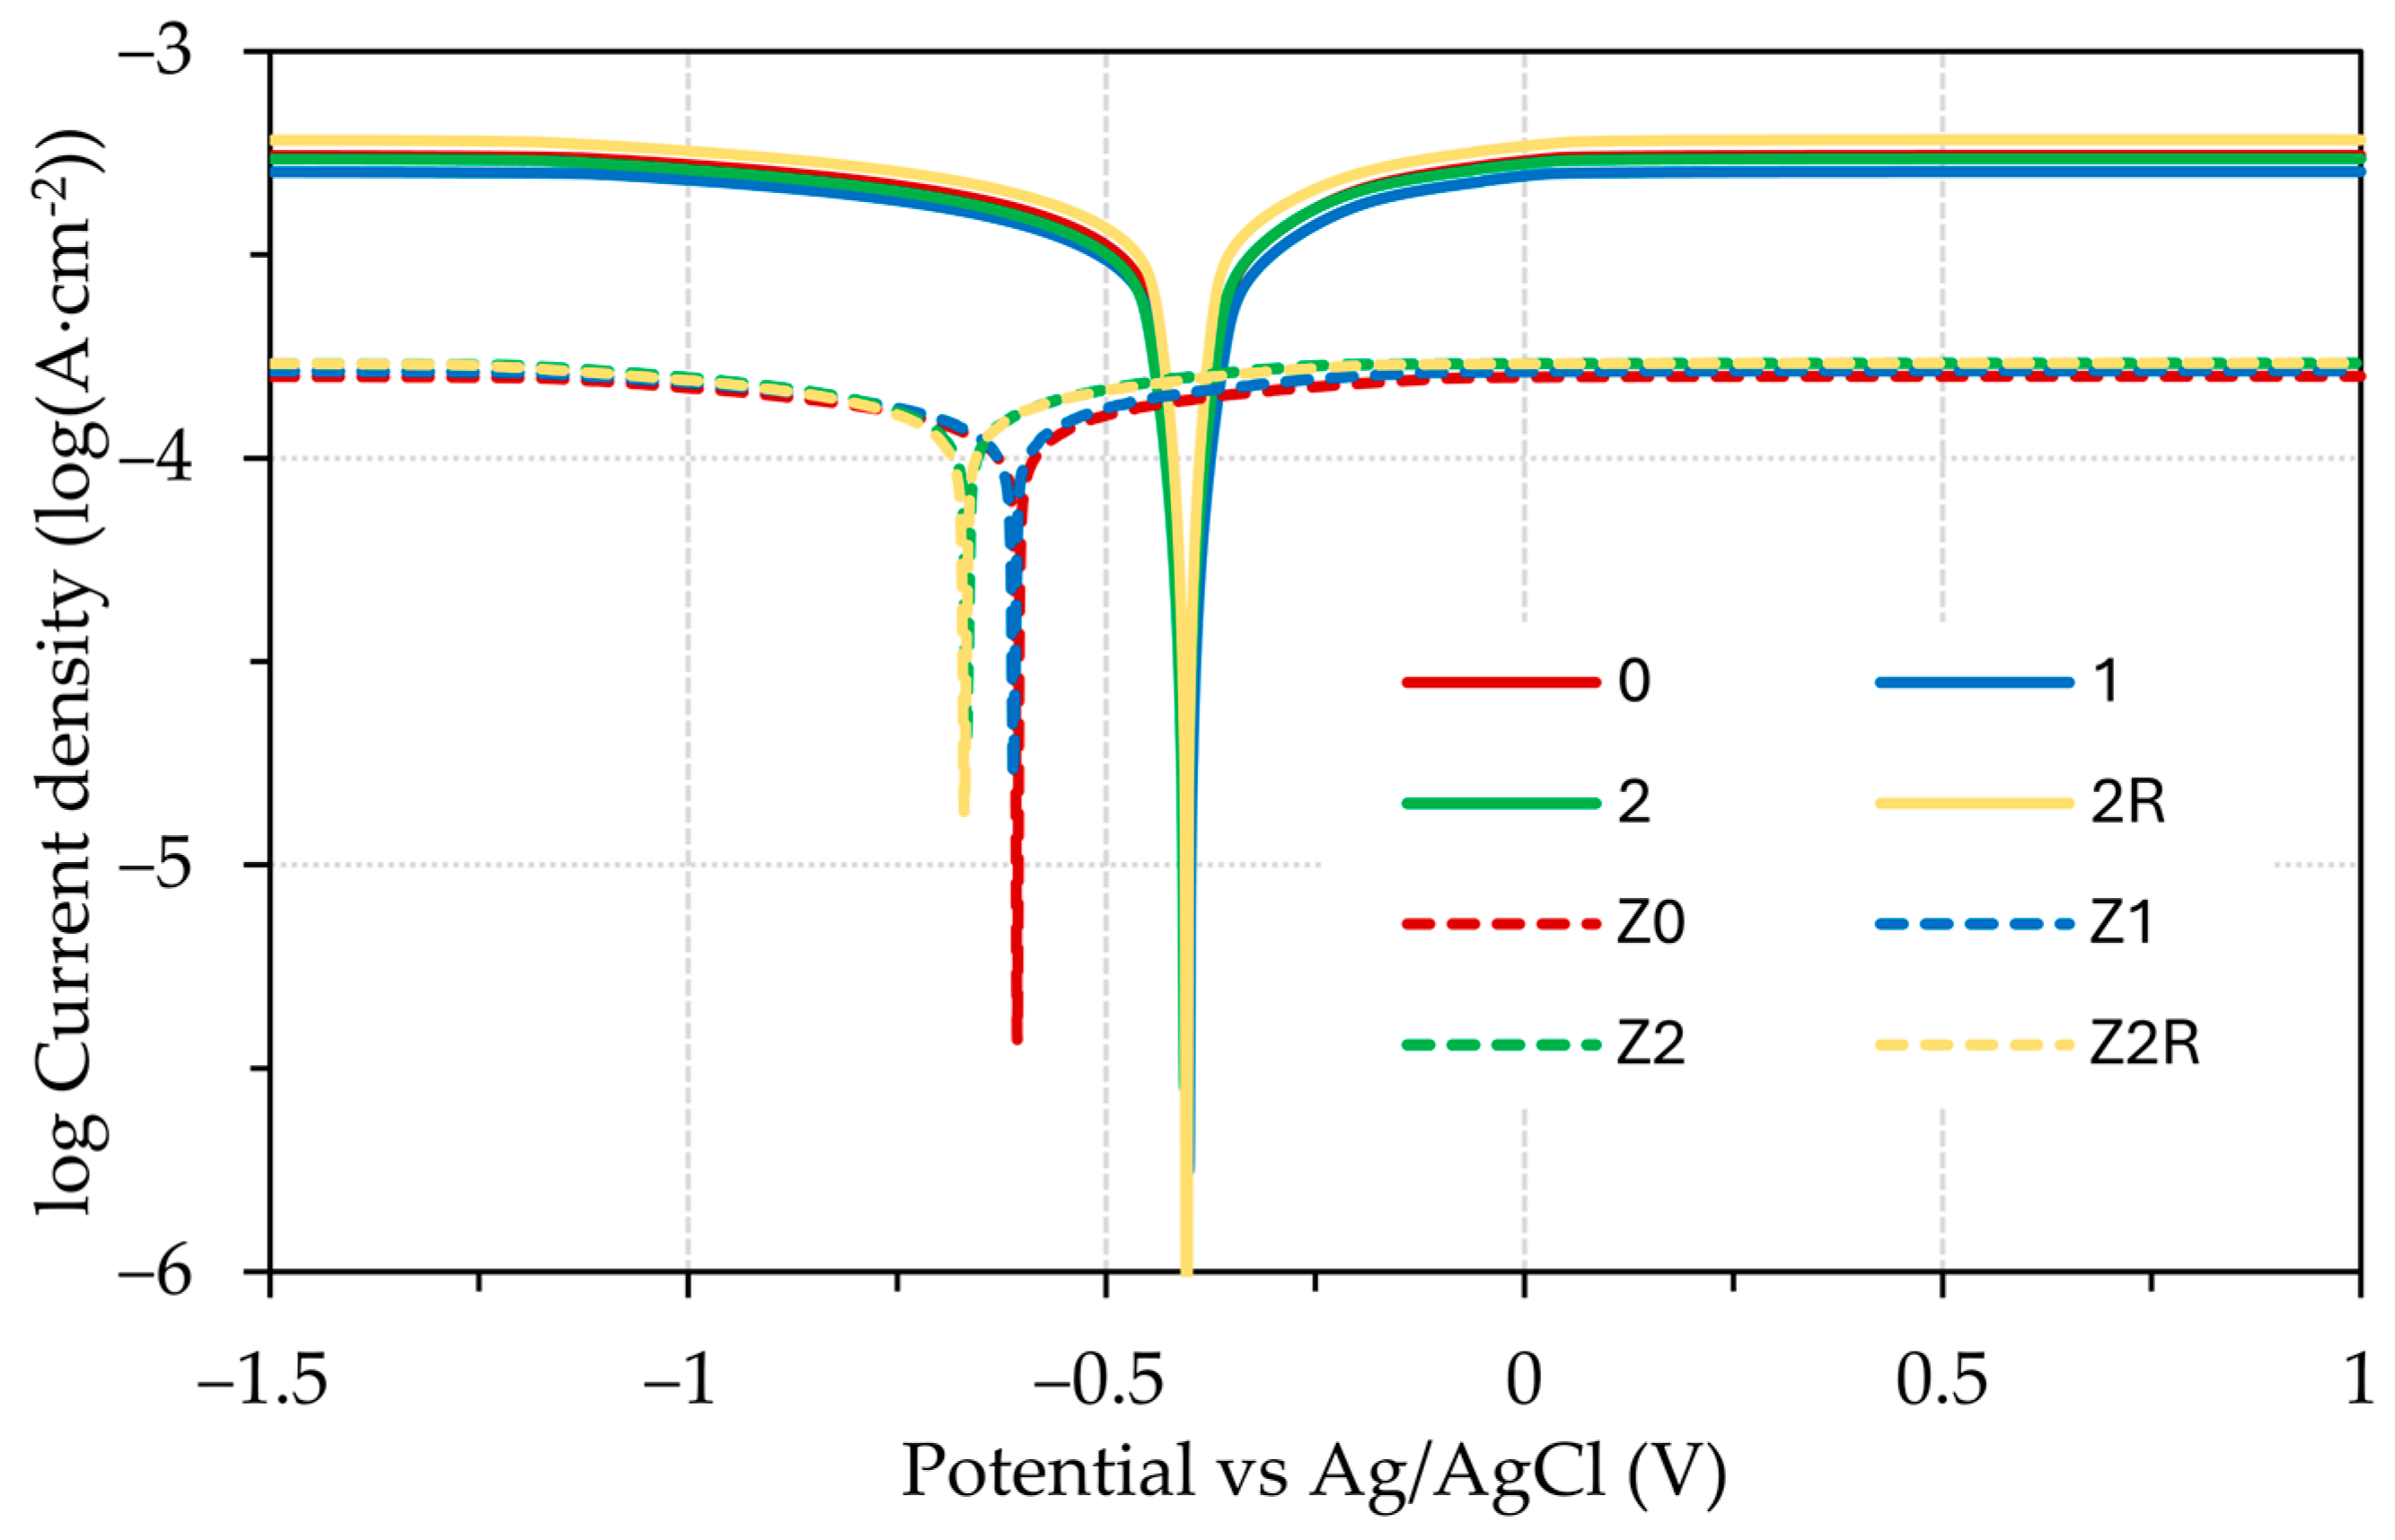
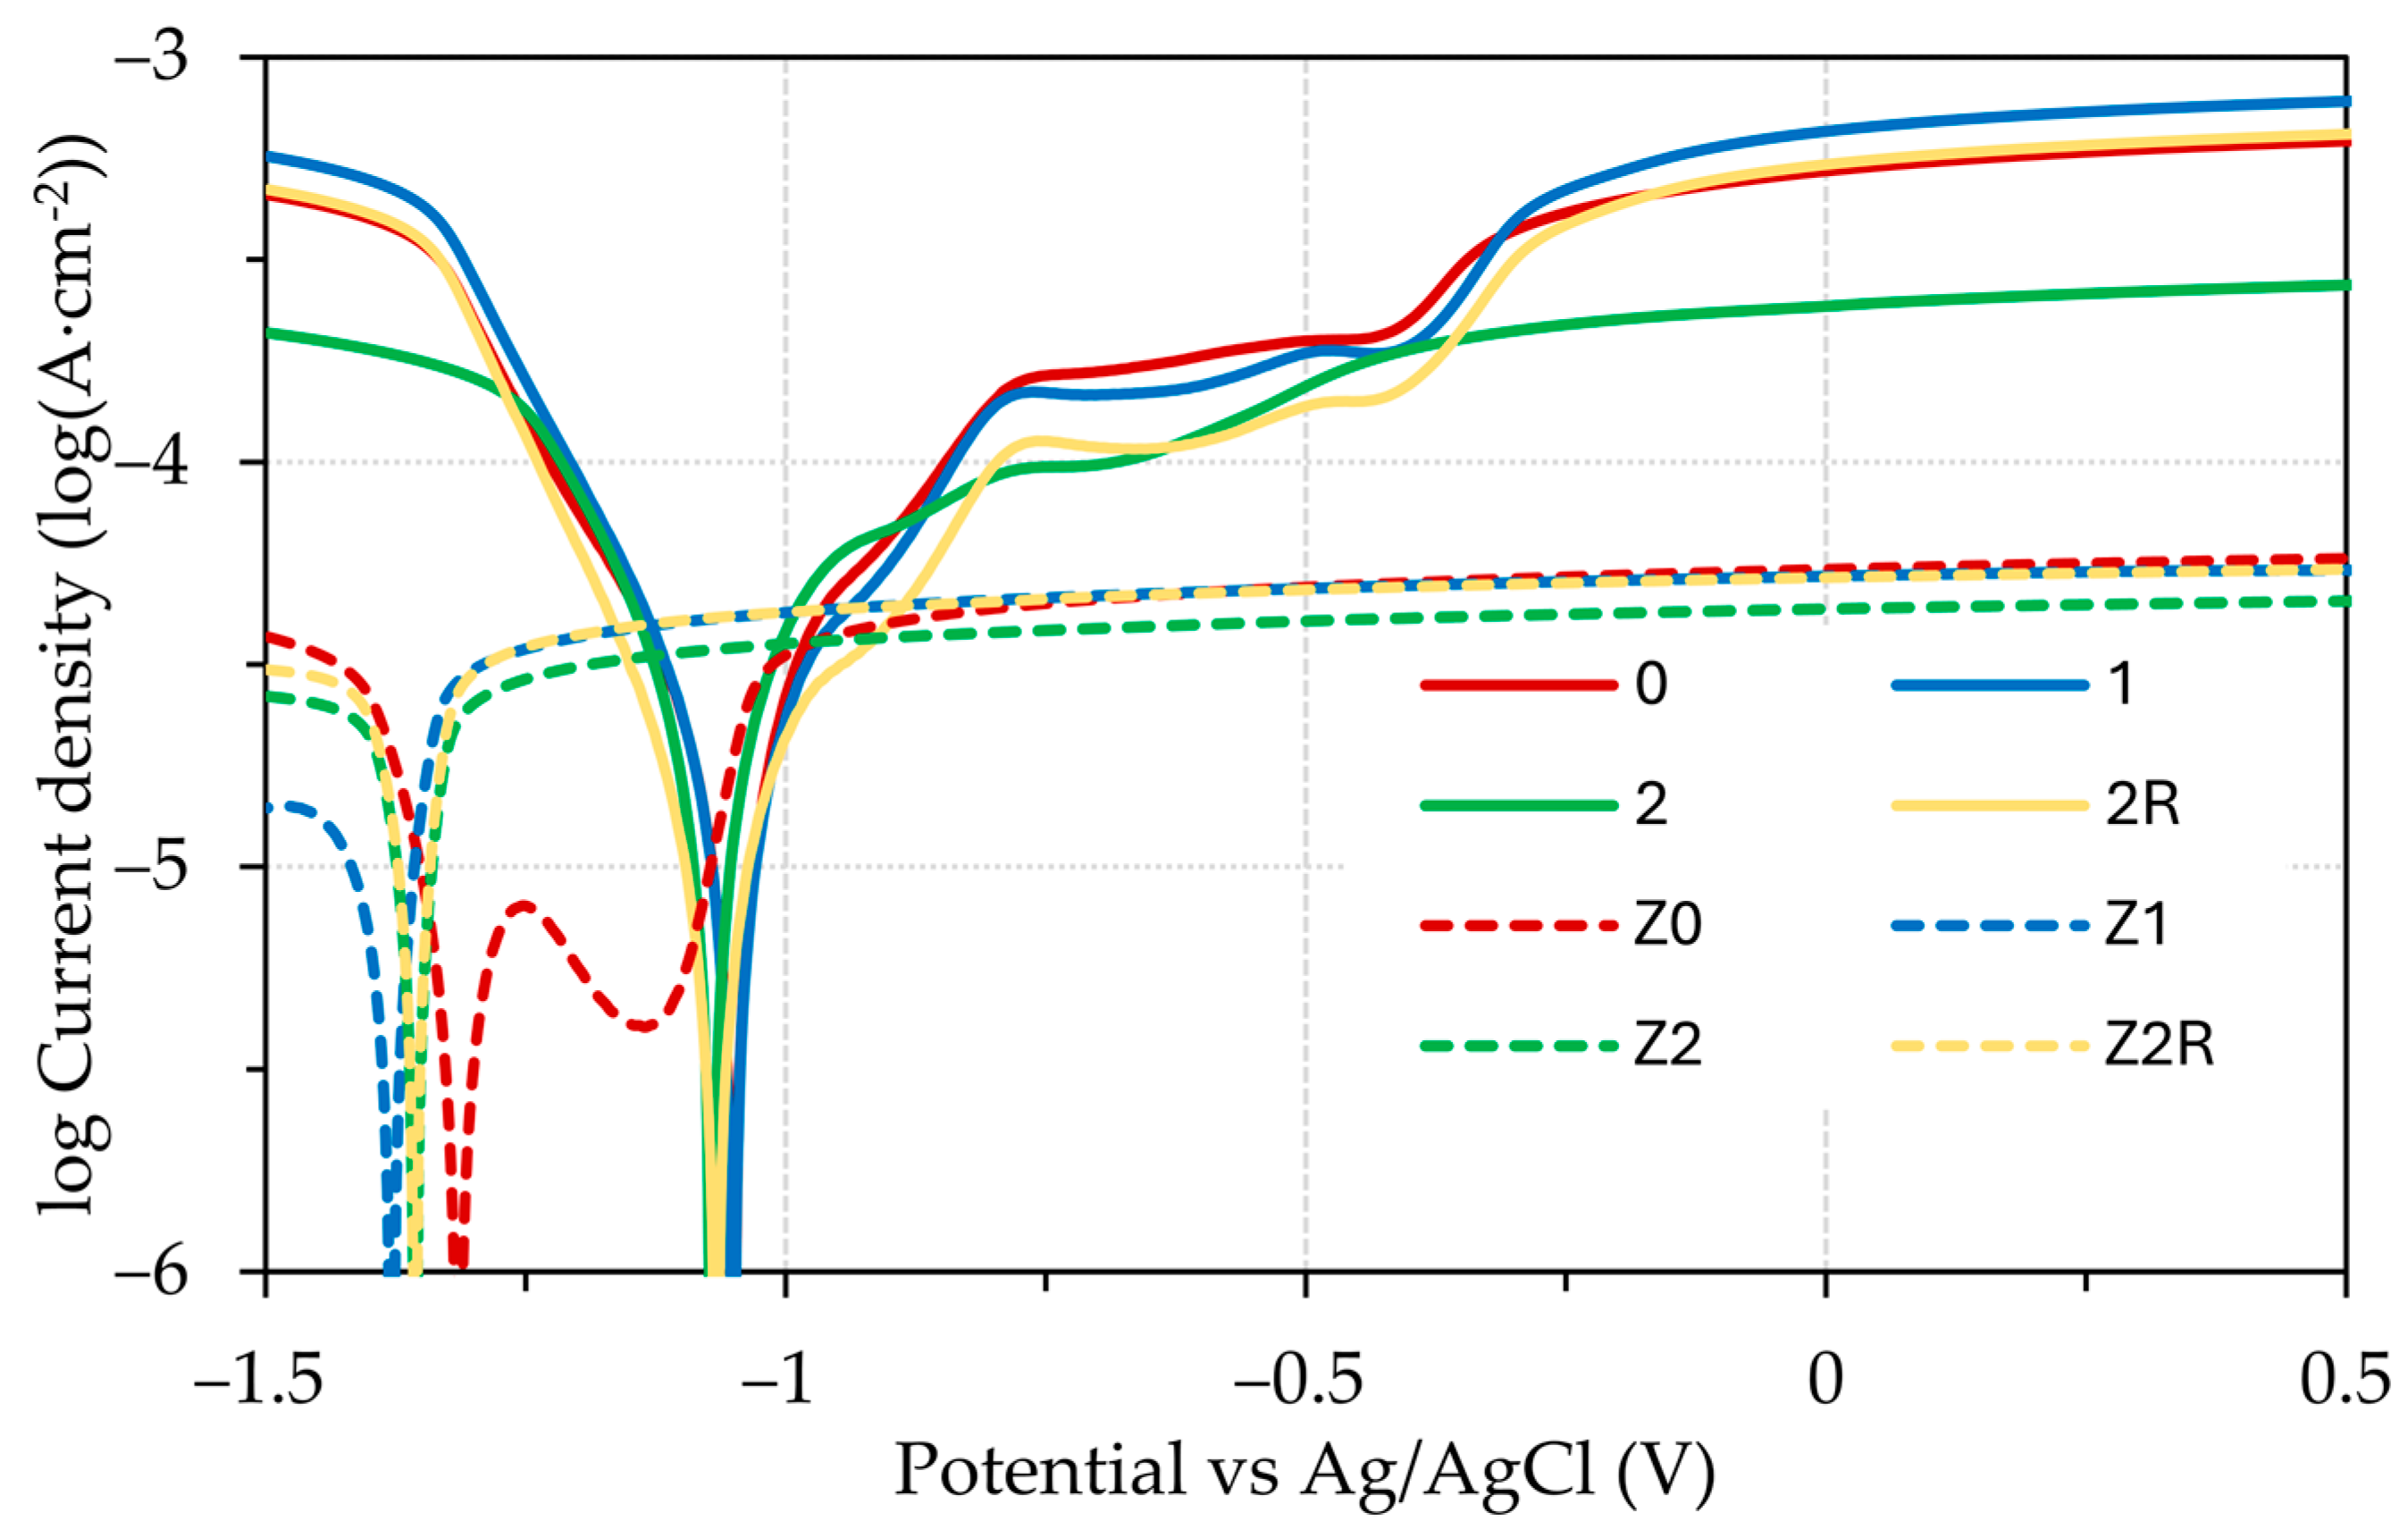
3.3. Electrochemical Testing
4. Conclusions
- The DRECE method showcases its potential to enhance the hardness of the non-alloy structural steel under examination;
- It is established that applying the DRECE method does not diminish the thickness of the zinc coating of the steel specimens;
- Tafel extrapolation confirmed that the DRECE method has no effect on the corrosion resistance of the tested steel specimens;
- According to Tafel extrapolation, the impact of the DRECE method on corrosion resistance is negligible. Conversely, the hot-dip galvanizing of steel significantly enhances its corrosion resistance, which was demonstrated by a 3–4 fold reduction in the corrosion rate and a drop in the corrosion potential value;
- The influence of the electrolyte used is minimal in the case of the 0.1 M HCl and H2SO4 solution. However, when a 5% NaCl solution is employed, the corrosion rate experienced a significant decrease.
Author Contributions
Funding
Institutional Review Board Statement
Informed Consent Statement
Data Availability Statement
Conflicts of Interest
References
- Toth, L.S.; Gu, C. Ultrafine-Grain Metals by Severe Plastic Deformation. Mater. Charact. 2014, 92, 1–14. [Google Scholar] [CrossRef]
- Valiev, R.Z.; Islamgaliev, R.K.; Alexandrov, I.V. Bulk Nanostructured Materials from Severe Plastic Deformation. Prog. Mater. Sci. 2000, 45, 103–189. [Google Scholar] [CrossRef]
- Zrnik, J.; Dobatkin, S.V.; Mamuzič, I. Processing of Metals by Severe Plastic Deformation (SPD)—Structure and Mechanical Properties Respond. Metalurgija 2008, 47, 211–216. [Google Scholar]
- Rusz, S.; Čízek, L.; Michenka, V.; Dutkiewicz, J.; Salajka, M.; Hilšer, O.; Tylšar, S.; Kedroň, J.; Klos, M. New Type of Device for Achievement of Grain Refinement in Metal Strip. Arch. Mater. Sci. Eng. 2014, 69, 38–44. [Google Scholar] [CrossRef]
- Rusz, S.; Klyszewski, A.; Salajka, M.; Hilser, O.; Cizek, L.; Klos, M. Possibilities of Application Methods DRECE in Forming of Non-Ferrous Metals. Arch. Metall. Mater. 2015, 60, 3011–3016. [Google Scholar] [CrossRef]
- Rusz, S.; Hilser, O.; Ochodek, V.; Cada, R.; Svec, J.; Szkandera, P. Influence of SPD Process on Low-Carbon Steel Mechanical Properties. MM Sci. J. 2019, 2019, 2910–2914. [Google Scholar] [CrossRef]
- Rusz, S.; Kraus, M.; Hilšer, O.; Švec, J.; Kedroň, J.; Čížek, L.; Donič, T.; Tański, T.; Krejčí, L. Increasing the Quality of DC01 Steel by Drece Method. In Proceedings of the METAL 2017-26th International Conference on Metallurgy and Materials, Conference Proceedings, Brno, Czech Republic, 24–26 May 2017. [Google Scholar]
- Švec, J.; Rusz, S.; Hilšer, O.; Ochodek, V.; Krejčí, L. Mechanical Properties of Steel DC01 Formed by Drece Method. Trans. VŠB-Tech. Univ. Ostrav. Mech. Ser. 2017, 63, 63–72. [Google Scholar] [CrossRef] [PubMed]
- Jabłońska, M.B.; Kowalczyk, K.; Tkocz, M.; Bulzak, T.; Bednarczyk, I.; Rusz, S. Dual Rolls Equal Channel Extrusion as Unconventional SPD Process of the Ultralow-Carbon Steel: Finite Element Simulation, Experimental Investigations and Microstructural Analysis. Arch. Civil. Mech. Eng. 2021, 21, 1–11. [Google Scholar] [CrossRef]
- Kowalczyk, K.; Jabłońska, M.; Rusz, S.; Bednarczyk, I. Influence of the Drece Process of Severe Plastic Deformation on the Mechanical Properties of the Ultra-Low Carbon Interstitial Free Steel. Arch. Metall. Mater. 2018, 63, 2095–2100. [Google Scholar] [CrossRef]
- Marder, A.R. Metallurgy of Zinc-Coated Steel. Prog. Mater. Sci. 2000, 45, 191–271. [Google Scholar] [CrossRef]
- Kania, H. Structure and Corrosion Resistance of Coatings Obtained by the Batch Double Hot Dip Method in Eutectoid ZnAl Bath with the Addition of Mg and Si. Coatings 2022, 12, 1207. [Google Scholar] [CrossRef]
- Bhat, R.S.; Balakrishna, M.K.; Parthasarathy, P.; Hegde, A.C. Structural Properties of Zn-Fe Alloy Coatings and Their Corrosion Resistance. Coatings 2023, 13, 772. [Google Scholar] [CrossRef]
- Kania, H.; Mendala, J.; Kozuba, J.; Saternus, M. Development of Bath Chemical Composition for Batch Hot-Dip Galvanizing—A Review. Materials 2020, 13, 4168. [Google Scholar] [CrossRef]
- Bellini, C.; Di Cocco, V.; Iacoviello, F.; Mocanu, L.P. Impact of Copper, Tin and Titanium Addition on Bending-Induced Damage of Intermetallic Phases in Hot Dip Galvanizing. Metals 2022, 12, 2035. [Google Scholar] [CrossRef]
- Kreislova, K.; Knotkova, D. The Results of 45 Years of Atmospheric Corrosion Study in the Czech Republic. Materials 2017, 10, 394. [Google Scholar] [CrossRef]
- EN ISO 1461; Hot Dip Galvanized Coatings on Fabricated Iron and Steel Articles Specifications and Test Methods. ISO: Geneva, Switzerland, 2022.
- ISO 14713-2; Zinc Coatings—Guidelines and Recommendations for the Protection against Corrosion of Iron and Steel in Structures—Part 2: Hot Dip Galvanizing. ISO: Geneva, Switzerland, 2019.
- Sánchez, C.; Bustos, O.; Artigas, A.; Bruna, H. Silicon Effect and Microstructural Evolution of Hot Dip Galvanized Coating of Structural Steels. Metals 2023, 13, 1892. [Google Scholar] [CrossRef]
- Vontorová, J.; Mohyla, P. Use of GDOES Method for Evaluation of the Quality and Thickness of Hot Dip Galvanised Coating. Trans. IMF 2018, 96, 313–318. [Google Scholar] [CrossRef]
- Kuklík, V.; Kudláček, J. Hot-Dip Galvanizing of Steel Structures; Elsevier, Butterworth-Heinemann: Amsterdam, The Netherlands, 2016; ISBN 9780081007532. [Google Scholar]
- Xu, W.; Wang, Y.; Yang, H. Analysis of Measurement Accuracy of Zn–Fe Alloy Coatings under Two Take-off Angles. Vacuum 2022, 205, 111456. [Google Scholar] [CrossRef]
- Vontorová, J.; Mohyla, P.; Kreislová, K. Quality of Zinc Coating Formed on Structural Steel by Hot-Dip Galvanizing after Surface Contamination. Coatings 2024, 14, 493. [Google Scholar] [CrossRef]
- Housecroft, C.E.; Sharpe, A.G. Inorganic Chemistry, 4th ed.; Pearson Education Limited: Harlow, UK, 2012; ISBN 978-0-273-74275-3. [Google Scholar]
- Gellings, P.J.; Gierman, G.; Koster, D.; Kuit, J. Synthesis and Characterization of Homogeneous Intermetallic Fe-Zn Compounds. Int. J. Mater. Res. 1980, 71, 70–75. [Google Scholar] [CrossRef]
- Belin, R.; Tillard, M.; Monconduit, L. Redetermination of the Iron-Zinc Phase FeZn13. Acta Crystallogr. C 2000, 56, 267–268. [Google Scholar] [CrossRef] [PubMed]
- Okamoto, N.L.; Kashioka, D.; Inomoto, M.; Inui, H.; Takebayashi, H.; Yamaguchi, S. Compression Deformability of Γ and ζ Fe–Zn Intermetallics to Mitigate Detachment of Brittle Intermetallic Coating of Galvannealed Steels. Scr. Mater. 2013, 69, 307–310. [Google Scholar] [CrossRef]
- Okamoto, N.L.; Inomoto, M.; Adachi, H.; Takebayashi, H.; Inui, H. Micropillar Compression Deformation of Single Crystals of the Intermetallic Compound ς-FeZn13. Acta Mater. 2014, 65, 229–239. [Google Scholar] [CrossRef]
- Okamoto, N.L.; Tanaka, K.; Yasuhara, A.; Inui, H. Structure Refinement of the Δ1p Phase in the Fe-Zn System by Single-Crystal X-Ray Diffraction Combined with Scanning Transmission Electron Microscopy. Acta Crystallogr. B Struct. Sci. Cryst. Eng. Mater. 2014, 70, 275–282. [Google Scholar] [CrossRef]
- Okamoto, N.L.; Yasuhara, A.; Inui, H. Order–Disorder Structure of the Δ1k Phase in the Fe–Zn System Determined by Scanning Transmission Electron Microscopy. Acta Mater. 2014, 81, 345–357. [Google Scholar] [CrossRef]
- Hu, X.; Watanabe, T. Relationship between the Crystallographic Structure of Electrodeposited Fe-Zn Alloy Film and Its Thermal Equilibrium Diagram. Mater. Trans. 2001, 42, 1969–1976. [Google Scholar] [CrossRef]
- Yu, J.; Liu, J.; Zhou, W.; Zhang, J.; Wu, J. Cross-Sectional TEM Observation of Iron–Zinc Intermetallic Γ and Γ1 Phases in Commercial Galvannealed IF Steel Sheets. Mater. Des. 2007, 28, 249–253. [Google Scholar] [CrossRef]
- Hu, X.; Zhou, X. Effects of Steel Coatings Microstructure on Weldability in Resistance Spot Welding of Galvannealed Steel Sheets. Adv. Mater. Res. 2010, 139–141, 610–613. [Google Scholar] [CrossRef]
- Weiss, Z. Emission Yields and the Standard Model in Glow Discharge Optical Emission Spectroscopy: Links to the Underlying Physics and Analytical Interpretation of the Experimental Data. Spectrochim. Acta Part. B At. Spectrosc. 2006, 61, 121–133. [Google Scholar] [CrossRef]
- Priamushko, T.S.; Mikhaylov, A.A.; Babikhina, M.N.; Kudiiarov, V.N.; Laptev, R.S. Glow Discharge Optical Emission Spectrometer Calibration Using Hydrogenated Zr-2.5Nb Alloy Standard Samples. Metals 2018, 8, 372. [Google Scholar] [CrossRef]
- Veverka, J.; Vilémová, M.; Chlup, Z.; Hadraba, H.; Lukáč, F.; Csáki, Š.; Matějíček, J.; Vontorová, J.; Chráska, T. Evolution of Carbon and Oxygen Concentration in Tungsten Prepared by Field Assisted Sintering and Its Effect on Ductility. Int. J. Refract. Met. Hard Mater. 2021, 97, 105499. [Google Scholar] [CrossRef]
- Drápala, J.; Brožová, S.; Szurman, I.; Konečná, K.; Kostiuková, G.; Vontorová, J.; Jonšta, P.; Sobotková, K. Influence of Selected Rare Earth Metals on Structural Characteristics of 42CrMo4 Steel. Metalurgija 2016, 55, 757–760. [Google Scholar]
- ISO 643:2024; Steels—Micrographic Determination of the Apparent Grain Size. ISO: Geneva, Switzerland, 2024.
- ISO 6507-1:2023; Metallic Materials—Vickers Hardness Test, Part 1: Test Method. ISO: Geneva, Switzerland, 2023; p. 35.
- Esmailzadeh, S.; Aliofkhazraei, M.; Sarlak, H. Interpretation of Cyclic Potentiodynamic Polarization Test Results for Study of Corrosion Behavior of Metals: A Review. Prot. Met. Phys. Chem. Surf. 2018, 54., 976–989. [Google Scholar] [CrossRef]
- Zhang, X.L.; Jiang, Z.H.; Yao, Z.P.; Song, Y.; Wu, Z.D. Effects of Scan Rate on the Potentiodynamic Polarization Curve Obtained to Determine the Tafel Slopes and Corrosion Current Density. Corros. Sci. 2009, 51, 581–587. [Google Scholar] [CrossRef]
- Duarte, T.; Meyer, Y.A.; Osório, W.R. The Holes of Zn Phosphate and Hot Dip Galvanizing on Electrochemical Behaviors of Multi-Coatings on Steel Substrates. Metals 2022, 12, 863. [Google Scholar] [CrossRef]
- Vontorová, J.; Váňová, P. Determination of Carburized Layer Thickness by GDOES Method. AIMS Mater. Sci. 2018, 5, 34–43. [Google Scholar] [CrossRef]


| C* | Mn | Si | P | S* | Cr | Ni | Mo | Cu |
| wt% | ||||||||
| 0.0406 | 0.170 | 0.007 | 0.013 | 0.0140 | 0.028 | 0.037 | 0.002 | 0.061 |
| Ti | Co | B | Pb | V | W | Al | Nb | |
| wt% | ||||||||
| <0.001 | 0.006 | 0.0004 | <0.001 | 0.001 | <0.001 | 0.034 | <0.001 | |
| Without Surface Treatment | Hot-Dip Galvanized | ||
|---|---|---|---|
| 0 | DC03 | Z0 | DC03 |
| 1 | DC03, 1× DRECE | Z1 | DC03, 1× DRECE |
| 2 | DC03, 2× DRECE | Z2 | DC03, 2× DRECE |
| 2R | DC03, 2× DRECE with rotation | Z2R | DC03, 2× DRECE with rotation |
| Sample Label | Thickness of Zn Coating/µm | |
|---|---|---|
| L | T | |
| Z0 | 80.9 ± 3.1 | 84.3 ± 3.5 |
| Z1 | 78.9 ± 3.9 | 83.6 ± 5.2 |
| Z2 | 72.5 ± 3.8 | 71.2 ± 5.3 |
| Z2R | 70.7 ± 3.5 | 75.4 ± 3.8 |
| 0 | 1 | 2 | 2R | Z0 | Z1 | Z2 | Z2R | |
|---|---|---|---|---|---|---|---|---|
| 0.1 M HCl | ||||||||
| Ecorr (V) | −0.404 ± 0.0471 | −0.394 ± 0.0305 | −0.404 ± 0.0316 | −0.404 ± 0.0522 | −0.641 ± 0.0312 | −0.663 ± 0.0311 | −0.649 ± 0.0304 | −0.642 ± 0.0369 |
| icorr (mA·cm−2) | 0.369 ± 0.0300 | 0.350 ± 0.0315 | 0.422 ± 0.0311 | 0.447 ± 0.0314 | 0.127 ± 0.0374 | 0.125 ± 0.0309 | 0.122 ± 0.0301 | 0.128 ± 0.0319 |
| βa (V·decade−1) | 0.315 | 0.333 | 0.326 | 0.315 | 0.291 | 0.310 | 0.277 | 0.259 |
| βc (V·decade−1) | −0.192 | −0.197 | −0.196 | −0.190 | −0.225 | −0.248 | −0.219 | −0.215 |
| Corrosion rate (mm·year−1) | 4.376 | 4.143 | 4.999 | 5.300 | 1.504 | 1.478 | 1.449 | 1.515 |
| Polarization resistance (Ω) | 2318 | 2348 | 1972 | 1922 | 6638 | 6240 | 7154 | 7153 |
| 0.1 M H2SO4 | ||||||||
| Ecorr (V) | −0.409 ± 0.0570 | −0.405 ± 0.0500 | −0.411 ± 0.0420 | −0.409 ± 0.0549 | −0.610 ± 0.0403 | −0.614 ± 0.0523 | −0.675 ± 0.0439 | −0.672 ± 0.0452 |
| icorr (mA·cm−2) | 0.403 ± 0.0451 | 0.374 ± 0.0410 | 0.394 ± 0.0437 | 0.441 ± 0.0400 | 0.117 ± 0.0461 | 0.121 ± 0.0427 | 0.132 ± 0.0517 | 0.130 ± 0.0423 |
| βa (V·decade−1) | 0.316 | 0.303 | 0.321 | 0.308 | 0.368 | 0.384 | 0.296 | 0.302 |
| βc (V·decade−1) | −0.199 | −0.188 | −0.193 | −0.187 | −0.323 | −0.317 | −0.248 | −0.244 |
| Corrosion rate (mm·year−1) | 4.774 | 4.437 | 4.673 | 5.225 | 1.384 | 1.428 | 1.559 | 1.539 |
| Polarization resistance (Ω) | 2093 | 2360 | 2141 | 1991 | 5378 | 5141 | 6063 | 6132 |
| 5% NaCl | ||||||||
| Ecorr (V) | −1.052 ± 0.0327 | −1.049 ± 0.0310 | −1.070 ± 0.0596 | −1.062 ± 0.0321 | −1.304 ± 0.0524 | −1.364 ± 0.0375 | −1.366 ± 0.0300 | −1.364 ± 0.0356 |
| icorr (mA·cm−2) | 0.018 ± 0.0331 | 0.017 ± 0.0302 | 0.019 ± 0.0422 | 0.011 ± 0.0343 | 0.004 ± 0.0380 | 0.004 ± 0.0302 | 0.004 ± 0.0304 | 0.004 ± 0.0409 |
| βa (V·decade−1) | 3.764 | 3.674 | 4.119 | 4.363 | 7.535 | 31.218 | 14.500 | 11.622 |
| βc (V·decade−1) | −4.237 | −4.862 | −4.894 | −5.549 | −8.728 | −6.952 | −24.901 | −22.506 |
| Corrosion rate (mm·year−1) | 0.211 | 0.201 | 0.230 | 0.125 | 0.048 | 0.049 | 0.046 | 0.049 |
| Polarization resistance (Ω) | 3044 | 3004 | 2488 | 4170 | 6602 | 2737 | 2850 | 3085 |
Disclaimer/Publisher’s Note: The statements, opinions and data contained in all publications are solely those of the individual author(s) and contributor(s) and not of MDPI and/or the editor(s). MDPI and/or the editor(s) disclaim responsibility for any injury to people or property resulting from any ideas, methods, instructions or products referred to in the content. |
© 2024 by the authors. Licensee MDPI, Basel, Switzerland. This article is an open access article distributed under the terms and conditions of the Creative Commons Attribution (CC BY) license (https://creativecommons.org/licenses/by/4.0/).
Share and Cite
Vontorová, J.; Novák, V.; Váňová, P. Low-Carbon Steel Formed by DRECE Method with Hot-Dip Zinc Galvanizing and Potentiodynamic Polarization Tests to Study Its Corrosion Behavior. Metals 2024, 14, 993. https://doi.org/10.3390/met14090993
Vontorová J, Novák V, Váňová P. Low-Carbon Steel Formed by DRECE Method with Hot-Dip Zinc Galvanizing and Potentiodynamic Polarization Tests to Study Its Corrosion Behavior. Metals. 2024; 14(9):993. https://doi.org/10.3390/met14090993
Chicago/Turabian StyleVontorová, Jiřina, Vlastimil Novák, and Petra Váňová. 2024. "Low-Carbon Steel Formed by DRECE Method with Hot-Dip Zinc Galvanizing and Potentiodynamic Polarization Tests to Study Its Corrosion Behavior" Metals 14, no. 9: 993. https://doi.org/10.3390/met14090993