3. Results and Discussion
After creep tests, creep data, such as minimum creep rate (
) and rupture time (
tr), for all three groups of P91 steel specimens were extracted from the creep curves, which are listed in
Table A1 (see
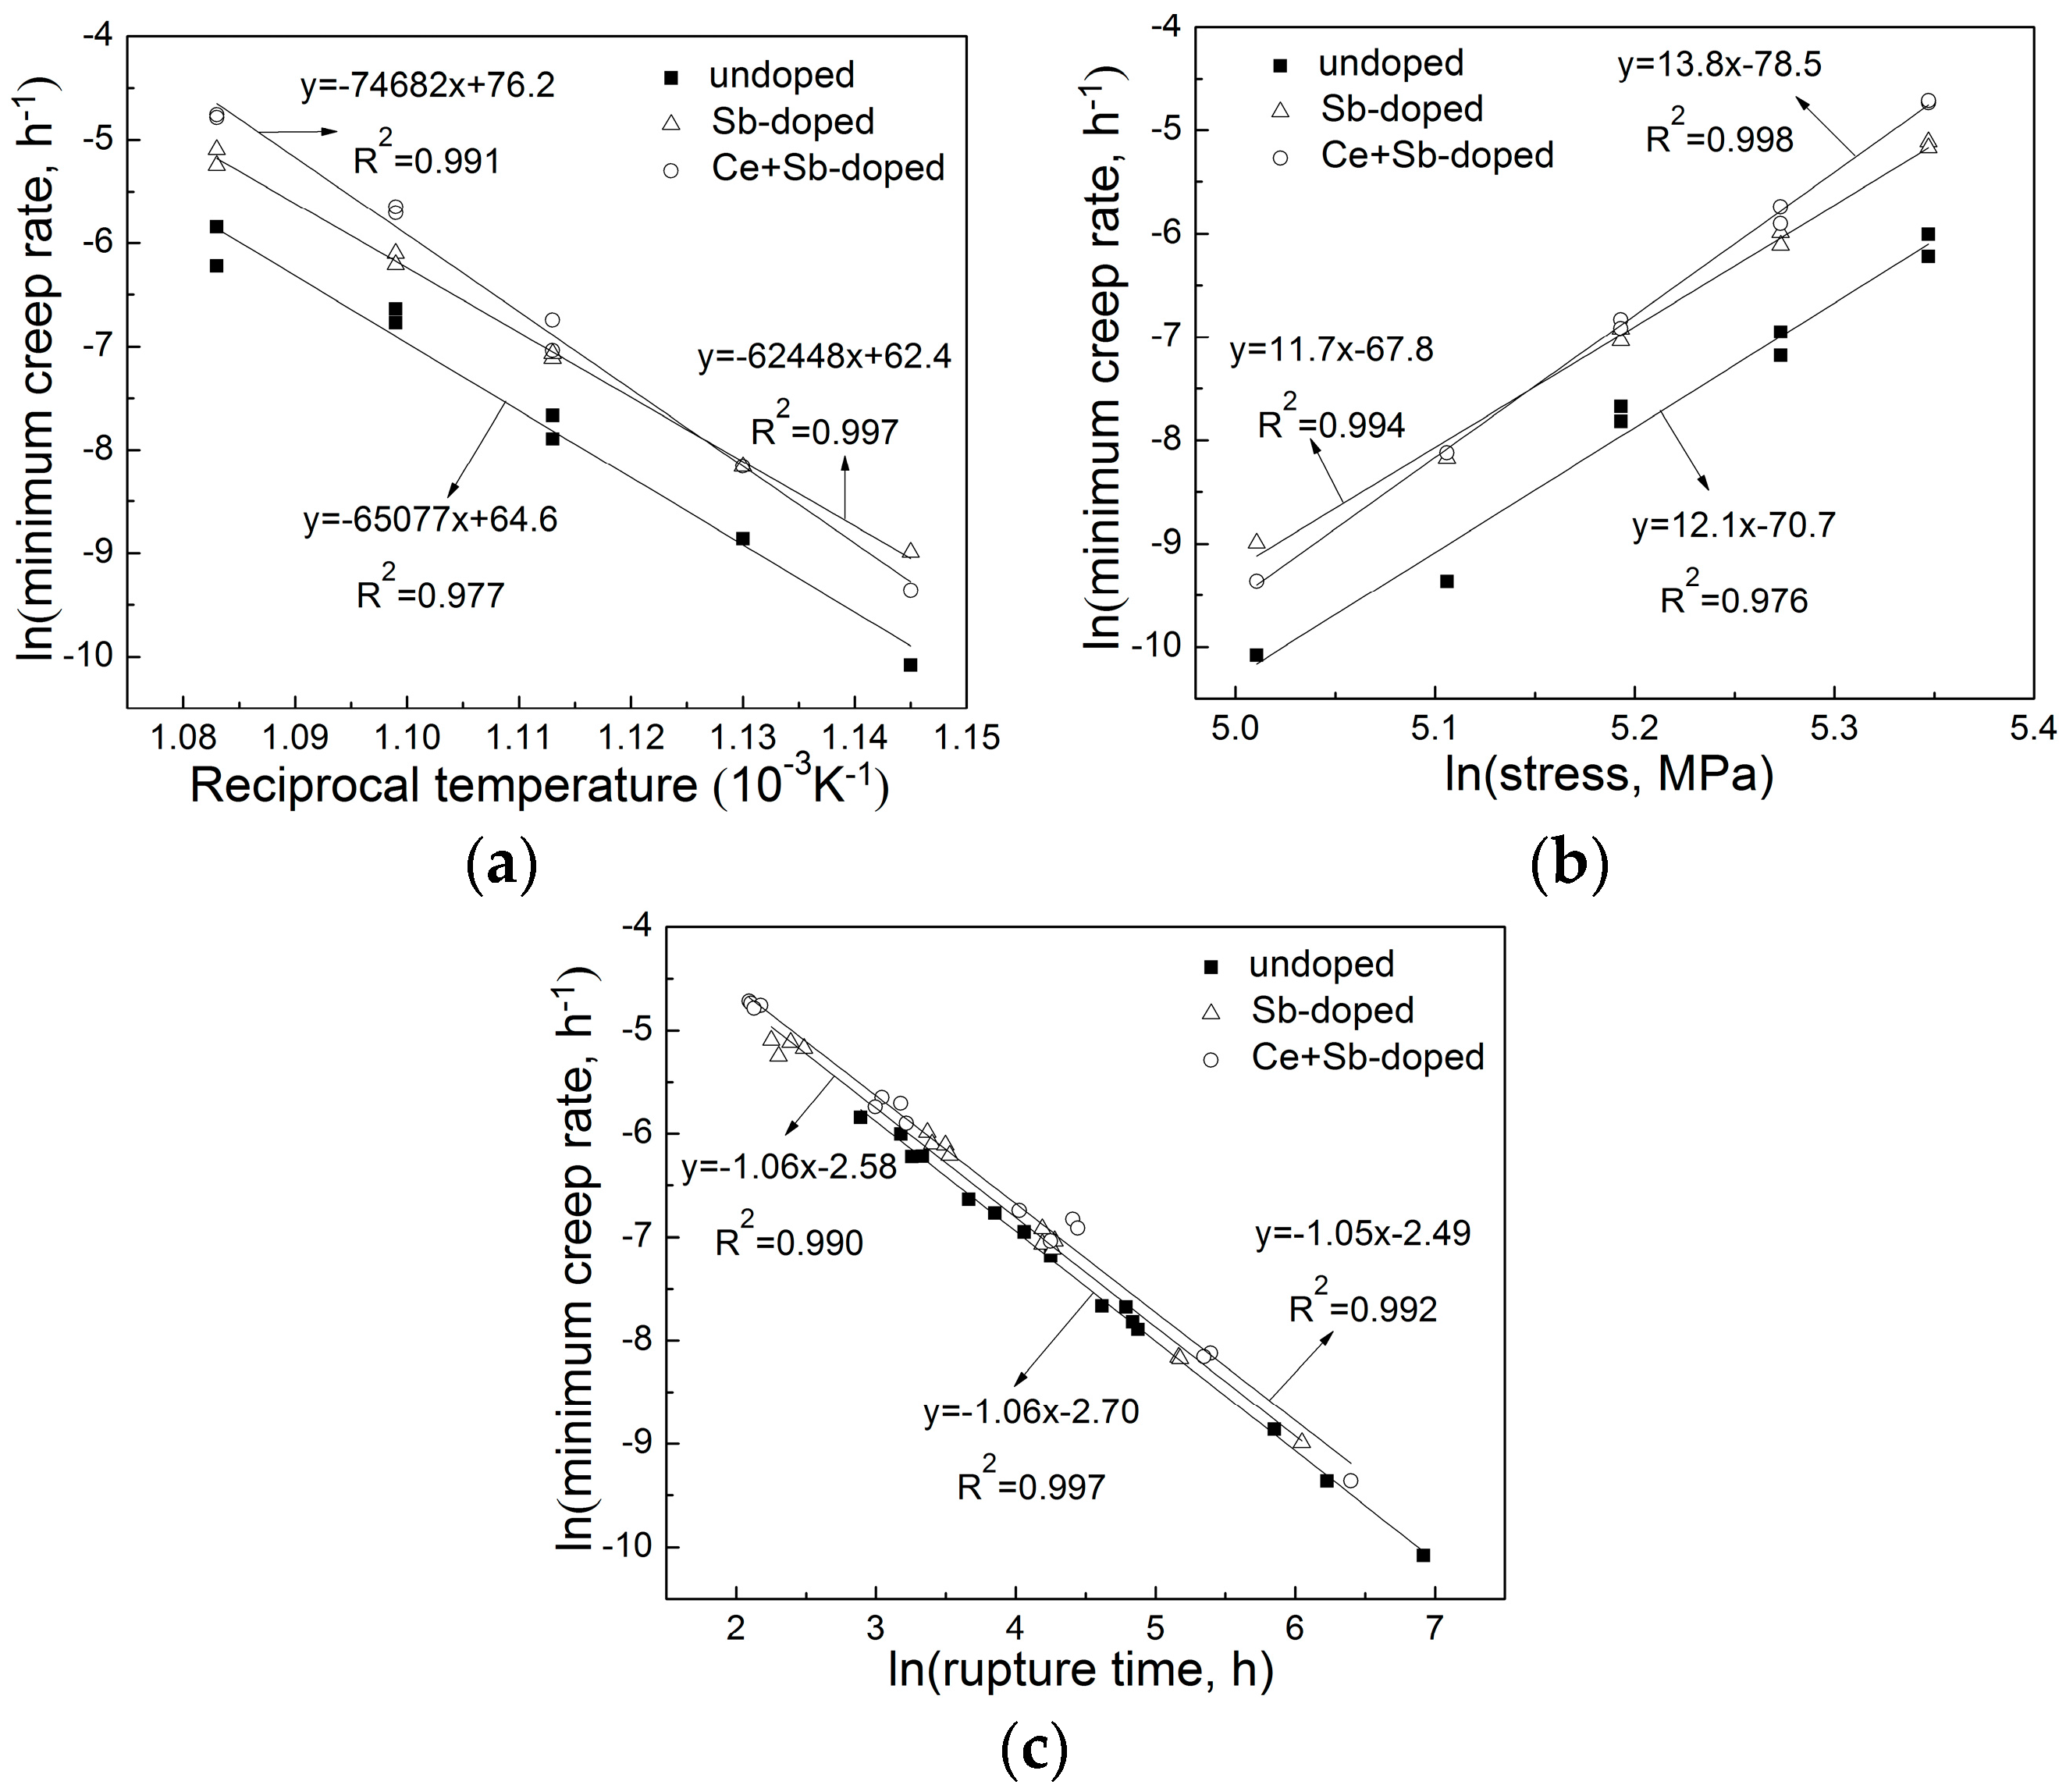
Appendix A). Based on these data, ln(minimum creep rate) is plotted as a function of reciprocal temperature (1/
T) and ln(stress), as shown in
Figure 1a,b, respectively. Clearly, there is a linear relationship between ln(minimum creep rate) and reciprocal temperature with
R-squared values of 0.977, 0.997, and 0.991 (see
Figure 1a) or between ln(minimum creep rate) and ln(stress) with
R-squared values of 0.976, 0.994, and 0.998 (see
Figure 1b) for the undoped, Sb-doped, and Sb+Ce-doped steels, respectively. As can be seen, the fitted line for the undoped steel is located under those for the Sb-doped and Sb+Ce-doped steels, showing a better creep behavior. The fitted lines for the Sb-doped and Sb+Ce-doped steels intersect at a certain temperature, indicating that they have different slopes, i.e., different creep activation energy (
Qc) and stress exponent (
n) values. Since the lines for the Sb+Ce-doped steel are steeper than those for the Sb-doped one, the former has higher
Qc and
n values.
For the undoped steel, the linear fitting gives:
Experimentally, it is frequently observed that, during the steady-state creep, the strain rate or the minimum creep rate (
) depends on the applied stress (σ) and exponentially on the absolute temperature (
T) in the form of the temperature-compensated power law [
13]:
where
A is a constant,
n is the stress exponent for creep,
R is the gas constant (8.314 J/mol K), and
Qc is the apparent activation energy for creep. These values are frequently used to estimate the creep properties of steel. The temperature-compensated power law can be rewritten as:
Comparing Equation (4) with Equations (1) and (2), one can obtain
Qc = 541 (kJ/mol),
n = 12.1 and:
with Equations (5) and (6), the two values of
A may be acquired as
A1 = 61.2 h
−1 and
A2 = 48.2 h
−1. Evidently, these two values are roughly close to each other, implying that there is a fixed value of
A in the temperature and stress ranges considered. Hence, the mean value of the two values may be taken as the measured one, i.e.,
A=54.7 h
−1. Similarly, for the Sb-doped steel and Sb+Ce-doped steel, one can obtain
Qc = 519 (kJ/mol),
n = 11.7 and
A = 42.7 (Sb-doped steel), and
Qc = 621 (kJ/mol),
n = 13.8 and
A = 1152.3 (Sb+Ce-doped steel). Thus, the temperature-compensated power law of creep for the steel may be expressed as:
where
is in h
−1, σ is in MPa, and
T is the absolute temperature.
As shown in Equations (7)–(9), the obtained values of stress exponent (
n = 12.1,
n = 11.7 and
n = 13.8 for the undoped, Sb-doped, and Sb+Ce-doped steels, respectively) indicate that all steels deform by the dislocation creep mechanism [
18,
19]. The acquired values of apparent activation energy (
Qc = 541 kJ/mol,
Qc = 519 kJ/mol and
Qc = 621 kJ/mol for the undoped, Sb-doped, and Sb+Ce-doped steels, respectively) are apparently higher than the activation energy for self-diffusion in iron (close to 240 kJ/mol), which also indicates a dislocation creep mechanism. In addition, the value of
Qc for the undoped steel is apparently higher than that for the Sb-doped one while the values of
A and
n are close to each other, indicating that at the same temperature and engineering stress the minimum creep rate of the Sb-doped steel is much higher than that of the undoped one. As for the Sb+Ce-doped steel, although the values of
A and
n are higher than those of the other two steels, the value of
Qc is much higher. This means that, at relatively low temperature and engineering stress where the creep process is mainly dominated by the value of
Qc, the minimum creep rate of the Sb+Ce-doped steel is much lower than that of the other two steels. The changes of stress exponent
n and apparent activation energy
Qc in the three steels indicate that the minor additions of Sb and Ce significantly affect the creep process of P91 steel.
As is well known [
20], the selection of a material employed at high temperatures needs to take its creep properties into account in engineering design. The creep lifetime of the material under a certain engineering stress or the creep rupture strength of 10
5 h creep lifetime is usually used as a reference. To estimate the above creep properties of the steel we need to further consider the Monkman-Grant relation, an empirical equation that links the minimum creep rate to the rupture time, which is given by:
where
is the minimum creep rate,
tr is the rupture time, and
m and
C are constants. According to the data in
Table A1, ln(minimum creep rate,
) is plotted as a function of ln(rupture,
tr) for the three steels in
Figure 1c, demonstrating a sound linear relationship with
R-square values of 0.997, 0.990; and 0.992, respectively. The linear fitting gives:
Equation (10) can be rewritten as:
with Equations (11)–(14), one can obtain
m = 1.06 and
C = 0.067 for the undoped steel,
m = 1.06 and
C = 0.076 for the Sb-doped steel, and
m = 1.05 and
C = 0.083 for the Sb+Ce-doped steel. As a consequence, there are:
where
is in h
−1 and
tr is in h.
As seen, the values of parameter
m or
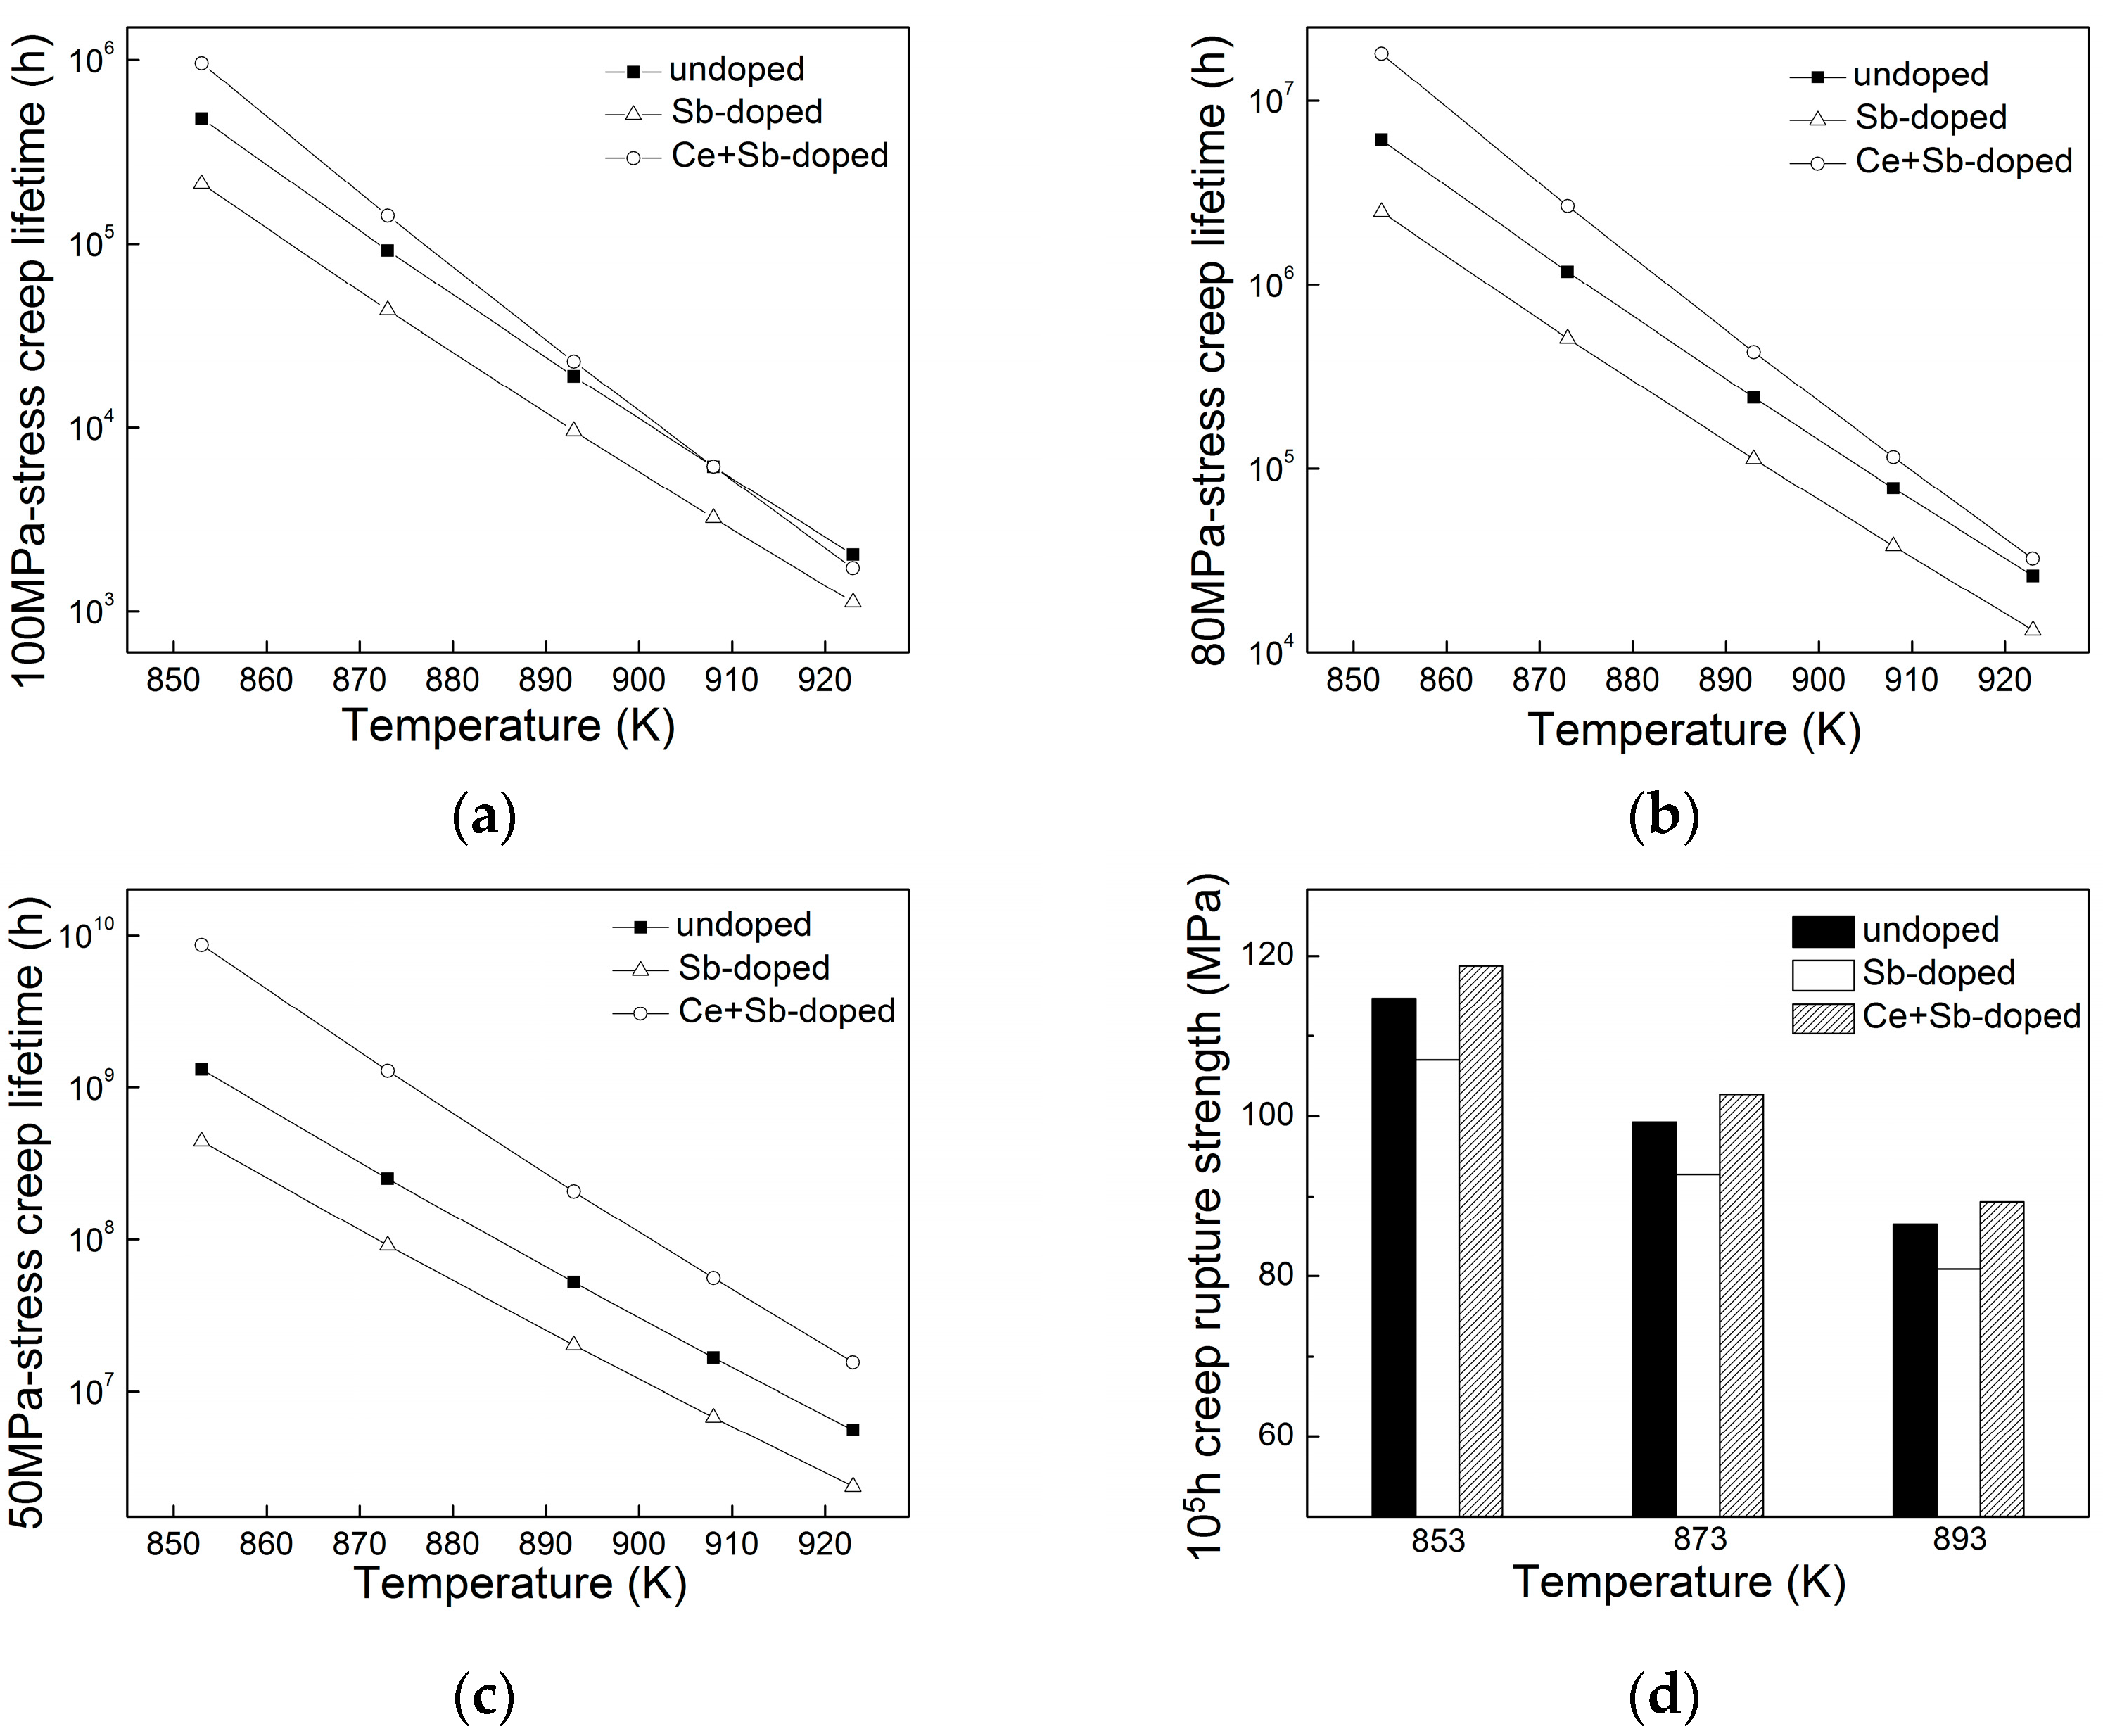
C are very close to each other for the three steels, indicating that impurity Sb or rare earth Ce does not influence the Monkman-Grant relation of the material. Using Equations (7)–(9) along with Equations (15)–(17), one can estimate the creep lifetime at any temperature under any stress with the assumption that both the temperature-compensated power law and the Monkman-Grant equations are valid under the temperature and stress conditions considered. Owing to the fact that the P91 steel is usually employed at a temperature below 923 K and at a stress below 100 MPa in engineering [
15], we estimate the 50 MPa, 80 MPa, and 100 MPa stress creep lifetimes at temperatures between 853 K and 923 K, and the creep rupture strengths of 10
5 h creep lifetime at 853 K, 873 K, and 893 K, respectively. The estimated results are shown in
Figure 2. Obviously, the 100 MPa stress creep lifetime for the Sb-doped steel is much shorter (up to fifty percent shorter) than that for the undoped steel in the range 853–923 K, while the 100 MPa stress creep lifetime for the Sb+Ce-doped steel is close to that for the undoped steel in the range 893–923 K. However, in the range 853–893 K where the P91 steel is usually employed in engineering, the 100 MPa stress creep lifetime for the Sb+Ce-doped steel is apparently longer (1.1 to 1.8 times longer) than that for the undoped steel. Similarly, under 80 MPa and 50 MPa which are closer to the service stress of the P91 steel, the creep lifetime for the Sb-doped steel is much shorter (about fifty percent shorter) than that for the undoped-steel (see
Figure 2b,c), indicating that the creep properties of the Sb-doped steel worsen significantly due to the effect of impurity Sb. As for the Sb+Ce-doped steel under the above condition, the creep lifetime is much longer (about 10 times longer) than that for the undoped steel (see
Figure 2b,c), implying that the creep properties of the steel are significantly improved due to the effect of rare earth Ce. The estimates of the creep rupture strength of 10
5 h creep lifetime at 853 K, 873 K, and 893 K also show that the creep rupture strength for the Sb-doped steel is about 7% lower than that for the undoped steel, but it is about 3% higher for the Sb+Ce-doped steel (see
Figure 2d).
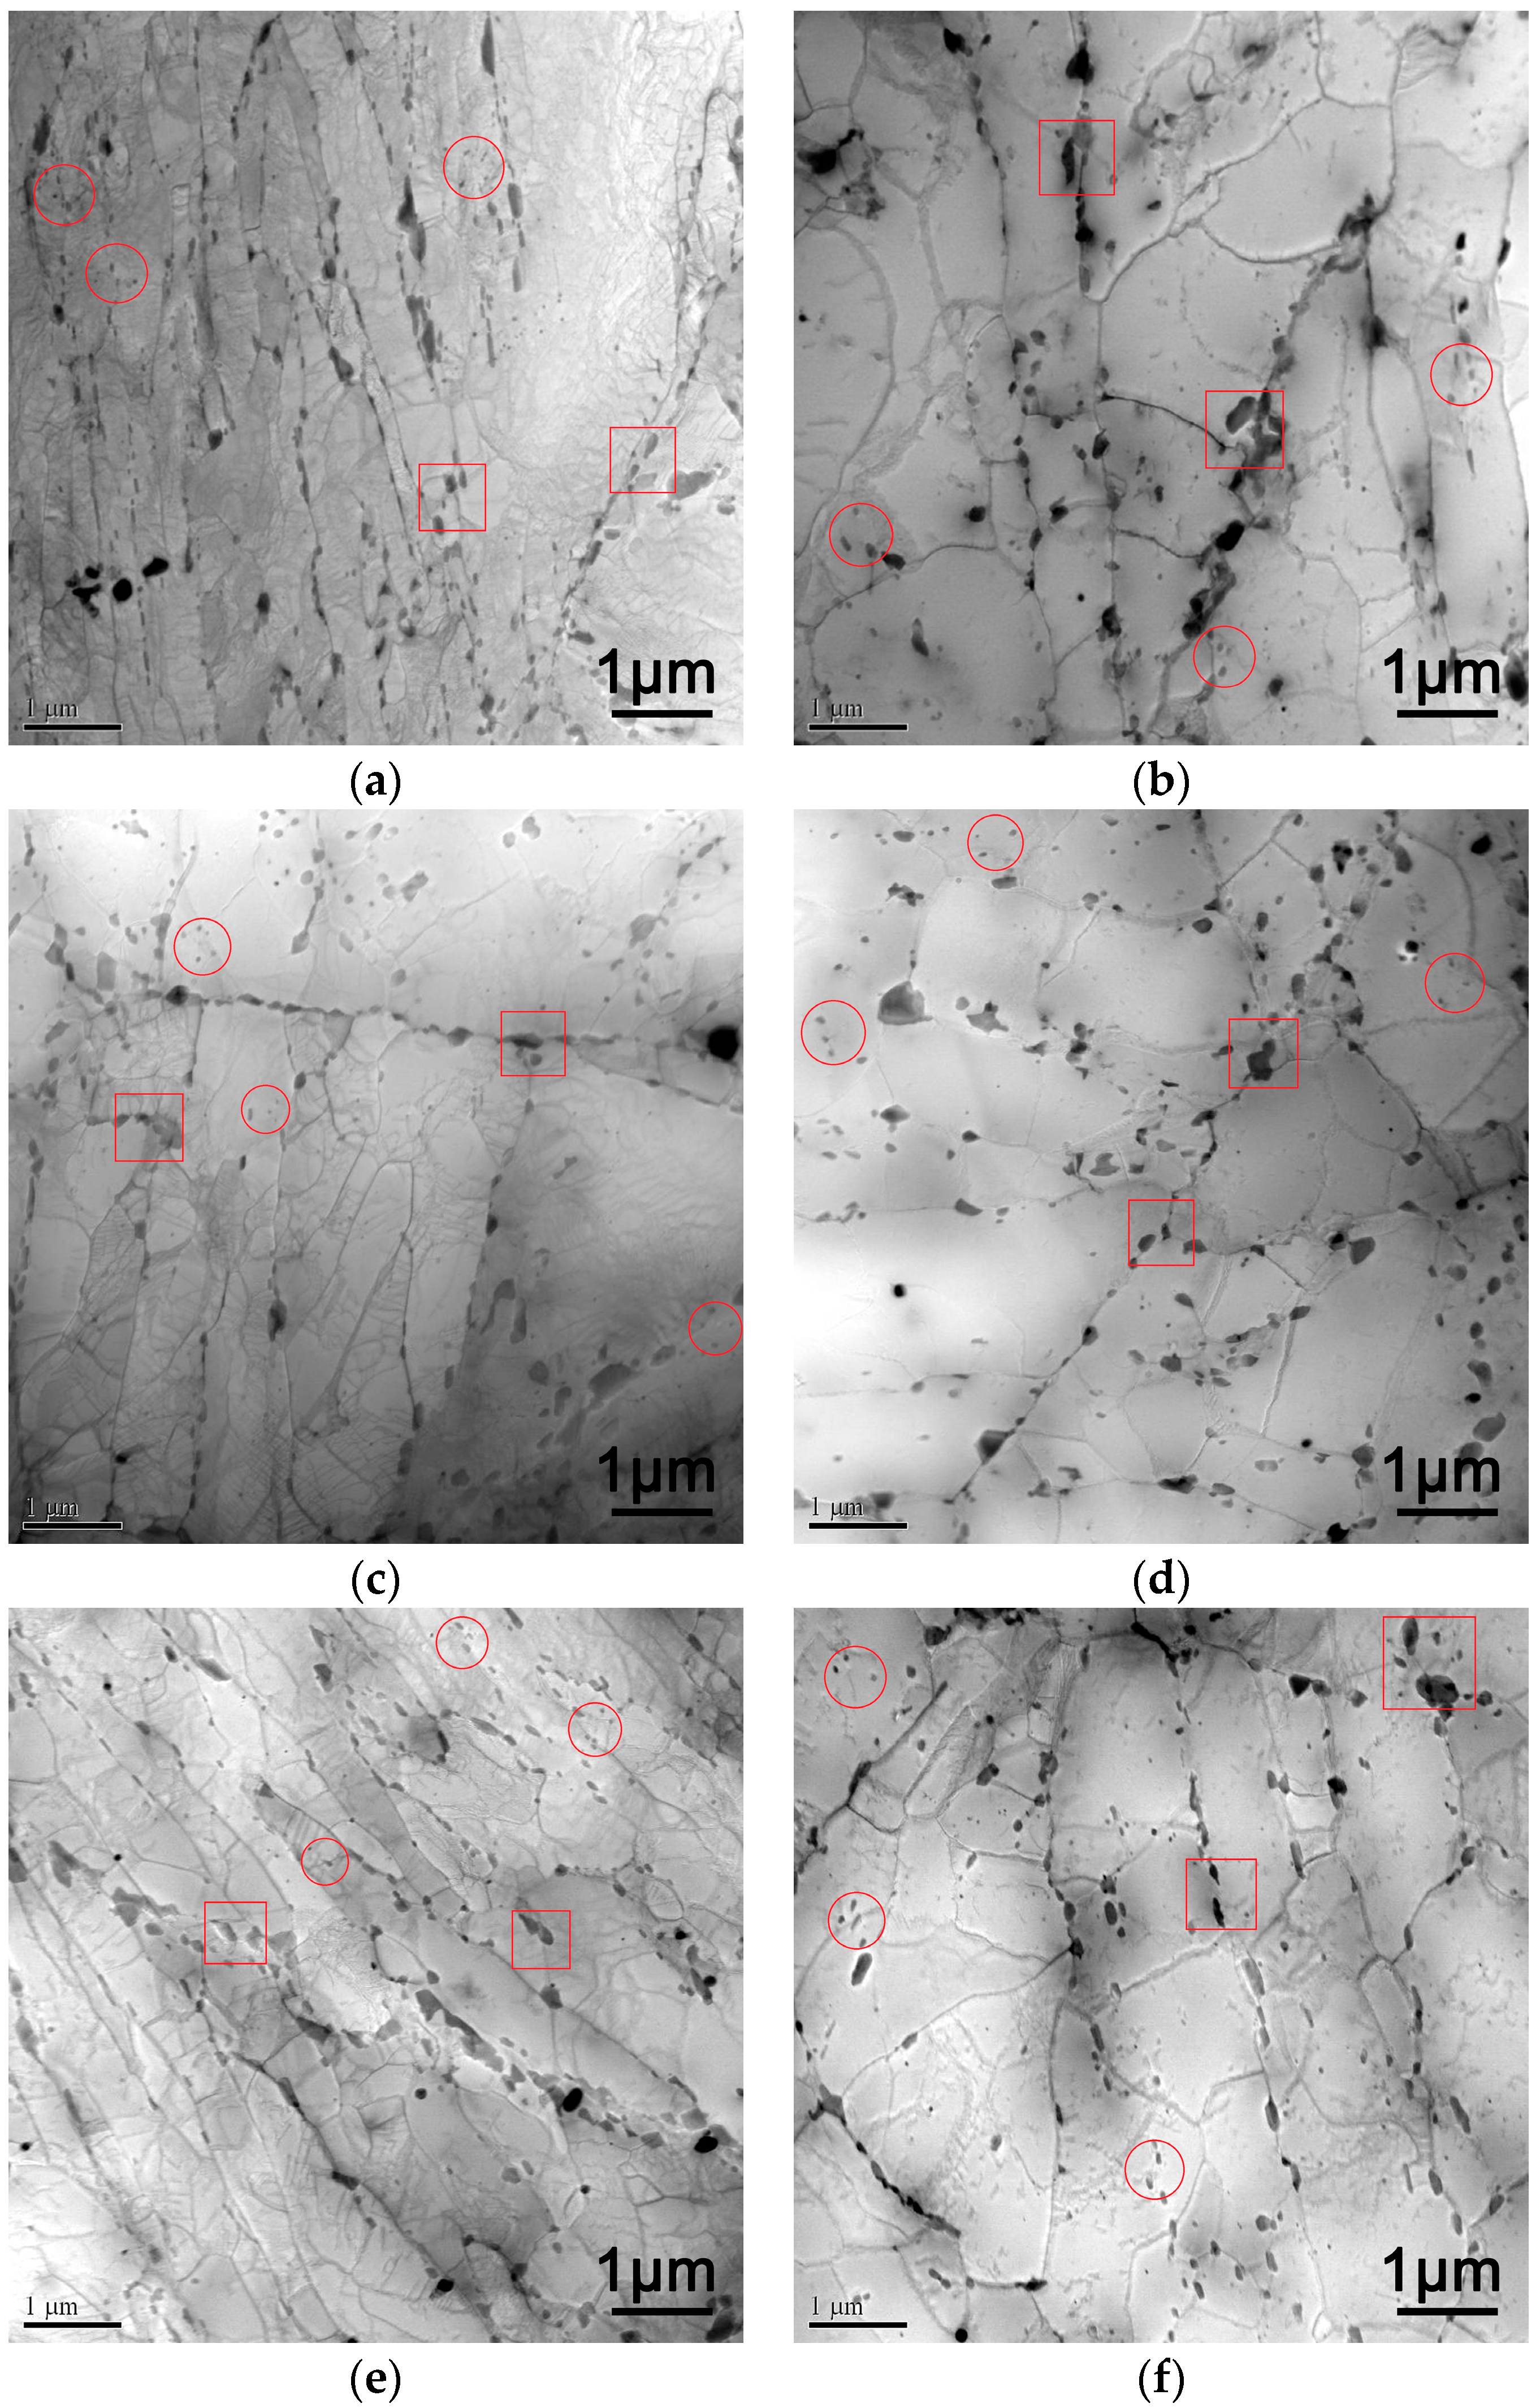
The evolution of the microstructure of P91 steel plays a crucial role in the creep processes of the material. Normally, during creep, microstructure coarsening, such as precipitate coarsening, dislocation density decrease, and subgrain disappearance, occurs, which deteriorates the creep properties of the steel. In order to explore the effect of impurity Sb and rare earth Ce on the microstructure evolution, TEM micrographs were taken from the as-tempered specimens, as well as the specimens crept at 873 K under 150 MPa for the three steels, which are shown in
Figure 3. As seen, the as-tempered specimens (
Figure 3a,c,e) exhibit a typical tempered martensite microstructure. The microstructure is with a high density of dislocations and precipitates shown as black dots, which are distributed along prior austenite grain boundaries or martensite lath boundaries. It is indicated by EDS microanalysis that there are two types of precipitates: coarser ones with sizes ranging from 100 nm to 200 nm, which mainly contain Cr, and finer ones with sizes less than 100 nm, which mainly contain Nb and V. Accordingly, the coarser precipitates, such as those marked by square in
Figure 3, could be M
23C
6-type carbides and the finer ones, such as those marked by circle in
Figure 3, could be MX-type carbides [
6]. The precipitates in the undoped (
Figure 3a) and Sb+Ce-doped steels (
Figure 3e) are a little more than those in the Sb-doped steel (
Figure 3c) and their dislocation density are somewhat higher. As shown in
Figure 3b,d,f, the dislocation density is reduced apparently and the precipitates as well as the martensite laths are coarsened after the creep test. However, there are still some dislocations and subgrains remaining in the undoped and Sb+Ce-doped steels after the creep test, but there are almost no dislocations or subgrains remaining in the Sb-doped steel. This means that the degradation in microstructure is accelerated due to impurity Sb in the creep process, while rare earth Ce can stabilize the microstructure, thus significantly offsetting the detrimental effect of impurity Sb.
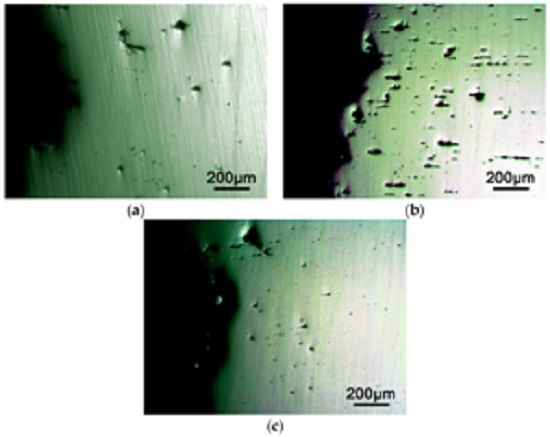
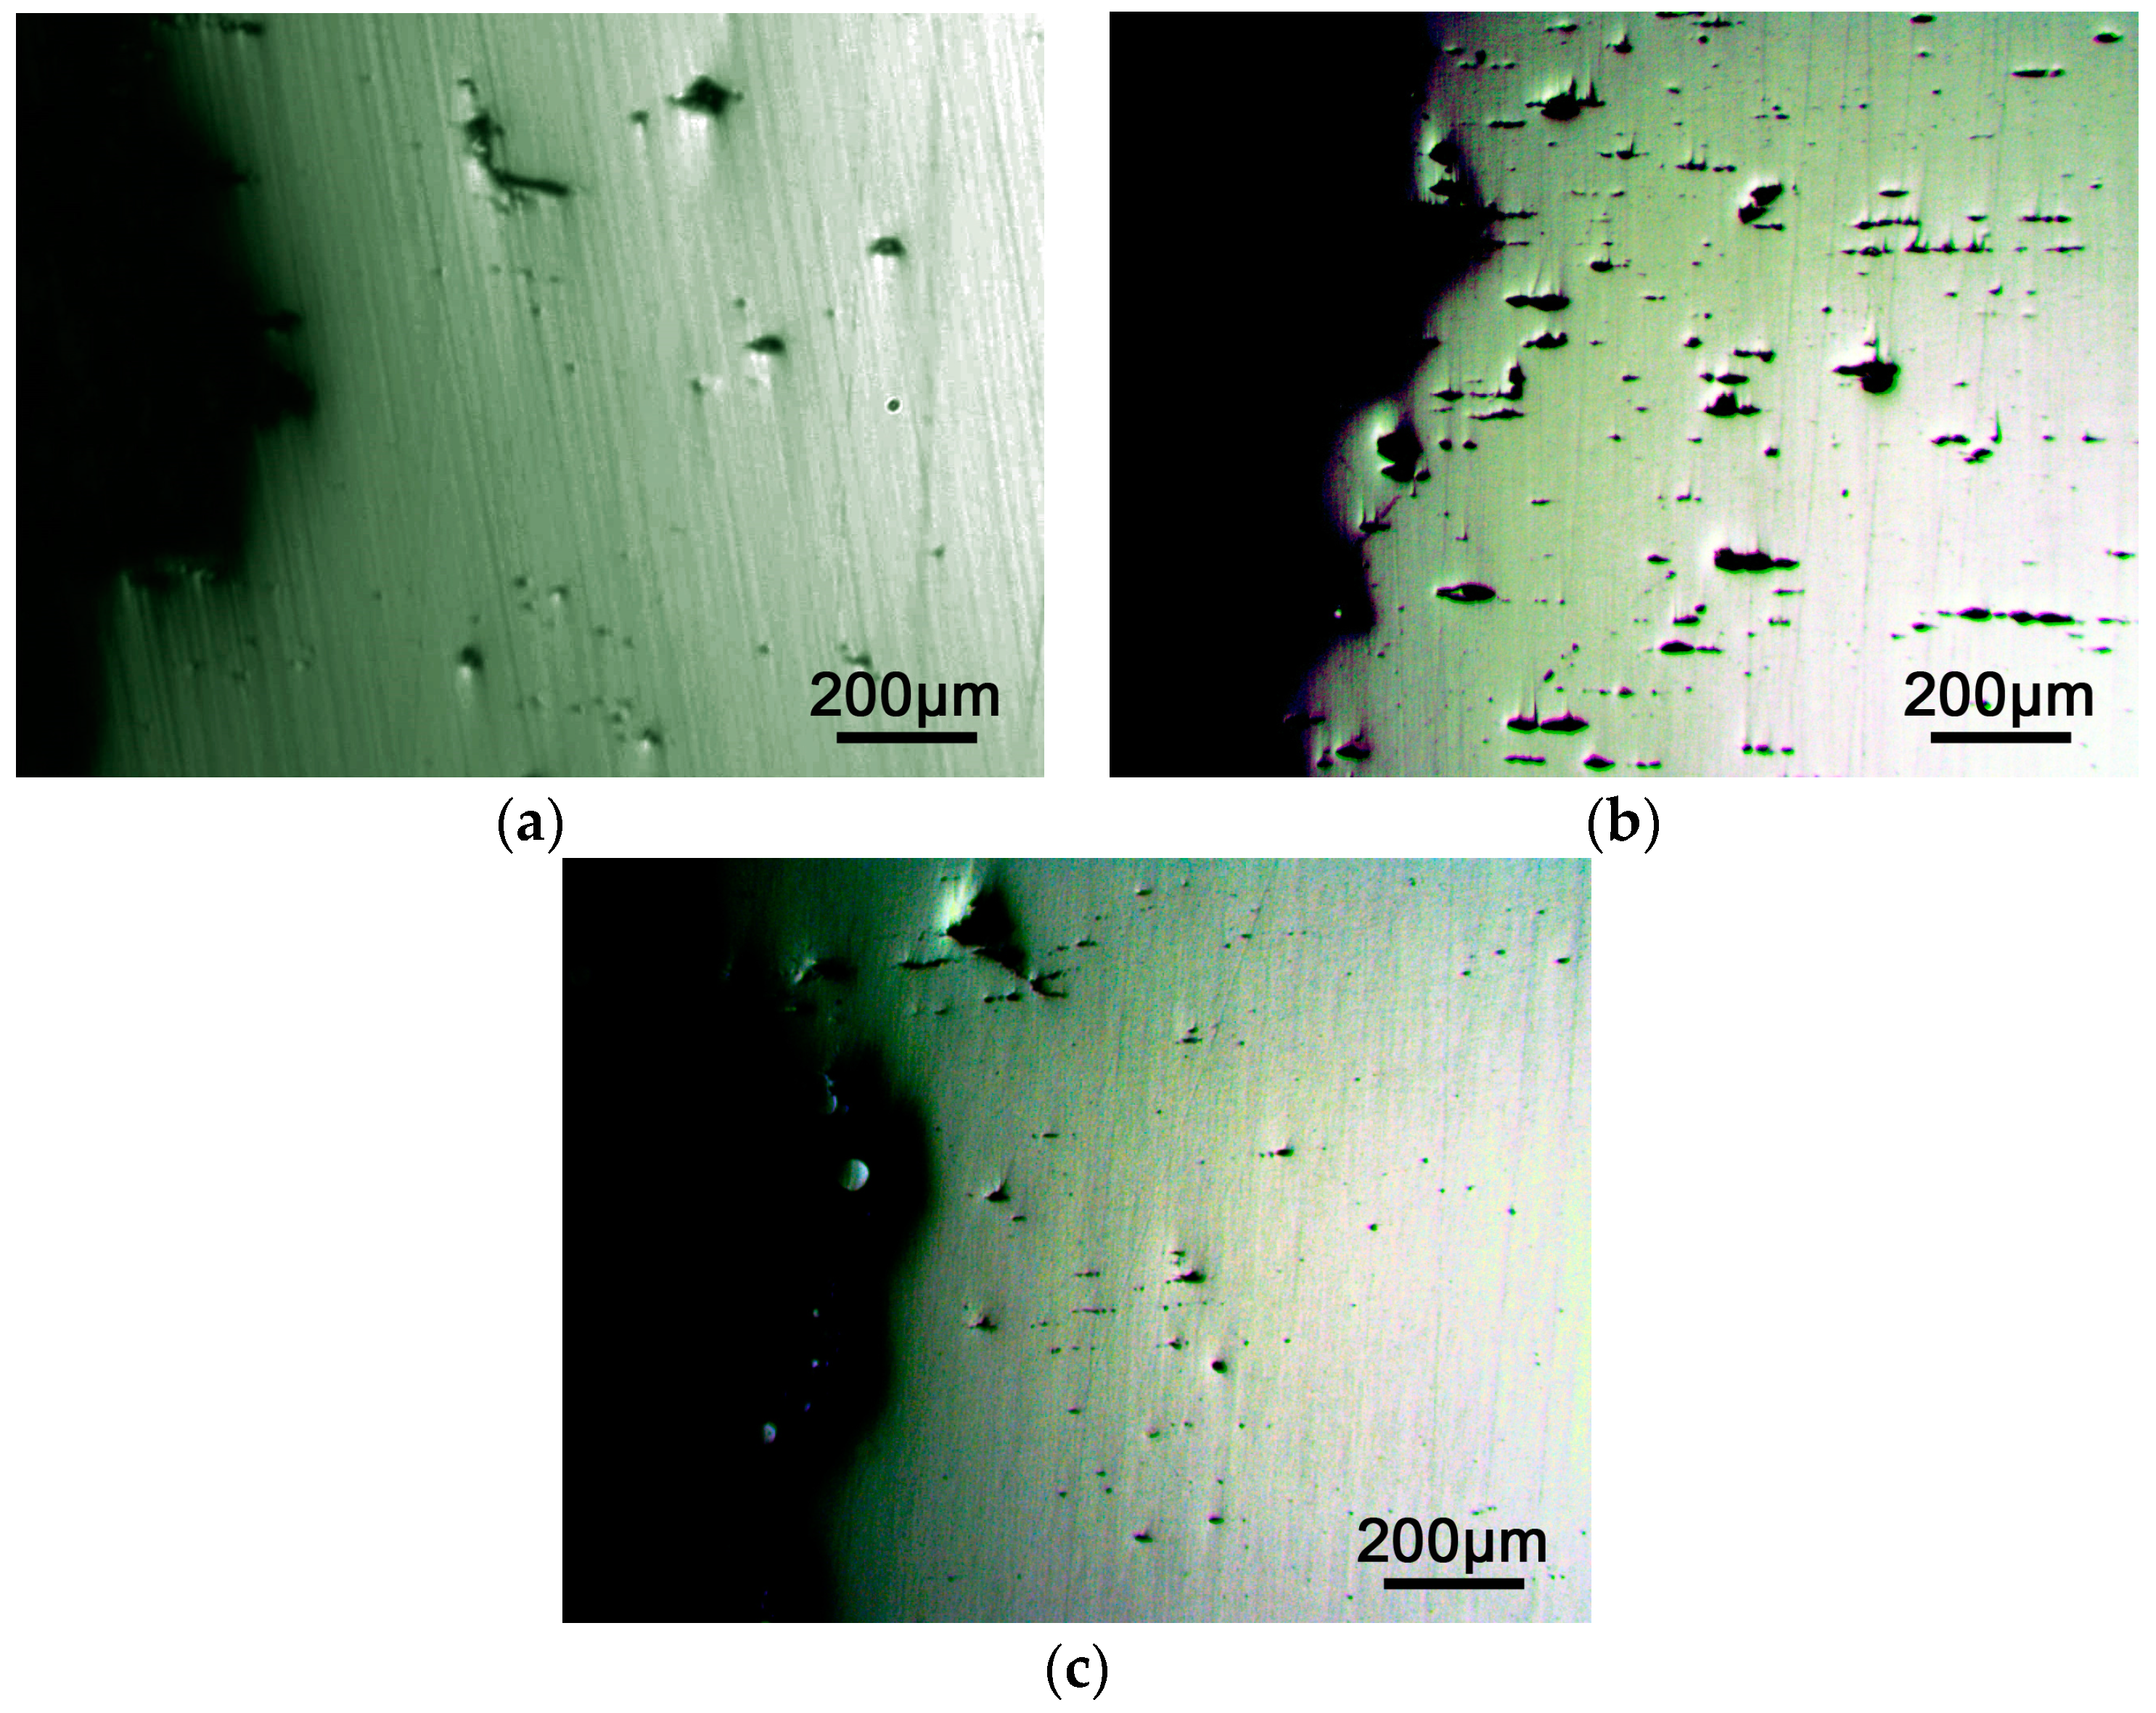
Creep rupture is also related to the voids that nucleate, grow and cluster during creep. Study by Otto et al. [
21] indicates that the small addition of impurity elements significantly deteriorates the creep properties in Cu-0.008 wt. % Bi and Cu-0.092 wt. % Sb, which is associated with the promotion of the formation of intergranular creep damage such as cavities and microcracks by Bi and Sb. Therefore, we observed the morphology of voids near the fracture tip for the three kinds of specimens tested at 873 K under 150 MPa, which are shown in
Figure 4. As can be seen, the voids in the Sb-doped specimens (see
Figure 4b) are much more than those in the undoped (see
Figure 4a) and Sb+Ce-doped specimens (see
Figure 4c) where the void morphology is similar to each other. Accordingly, Sb can promote the nucleation of voids while the nucleation of voids is restrained in the Sb+Ce-doped steel. It may be claimed that the promoted formation of voids in the Sb-doped steel may deteriorate its creep properties and thus accelerate creep rupture while the minor addition of Ce can suppress the effect of Sb, thereby improving the creep properties. In addition, as shown in
Figure 4b, many voids in the Sb-doped steel have linked together and formed linear cracks parallel to the applied stress. With consideration of the deformation texture of the specimens near the fracture tip where the grains are elongated along the direction of the applied stress unless recrystallization takes place, it can be envisaged that the voids are initiated from the boundaries parallel to the applied stress. This is reasonable because during creep the vacancies migrate from the boundaries perpendicular to the applied stress to those parallel to the applied stress. It may be stated from the aforementioned results that the enhancement of void formation in the Sb-doped specimen may be related to the Sb boundary segregation, while the significant decrease of voids in the Sb+Ce-doped specimen may be related to the effect of Ce boundary segregation.
During creep, both impurity element tin and rare earth element cerium can segregate to the grain or subgrain boundaries [
22,
23]. The equilibrium segregation may occur during isothermal holding prior to creep loading and the non-equilibrium segregation may take place during creep, which is related to a vacancy-solute complex effect or boundary diffusion effect [
24,
25]. The segregation of impurity element can reduce considerably the grain boundary cohesion in steel, thus promoting the nucleation of cavities on the grain boundaries [
10,
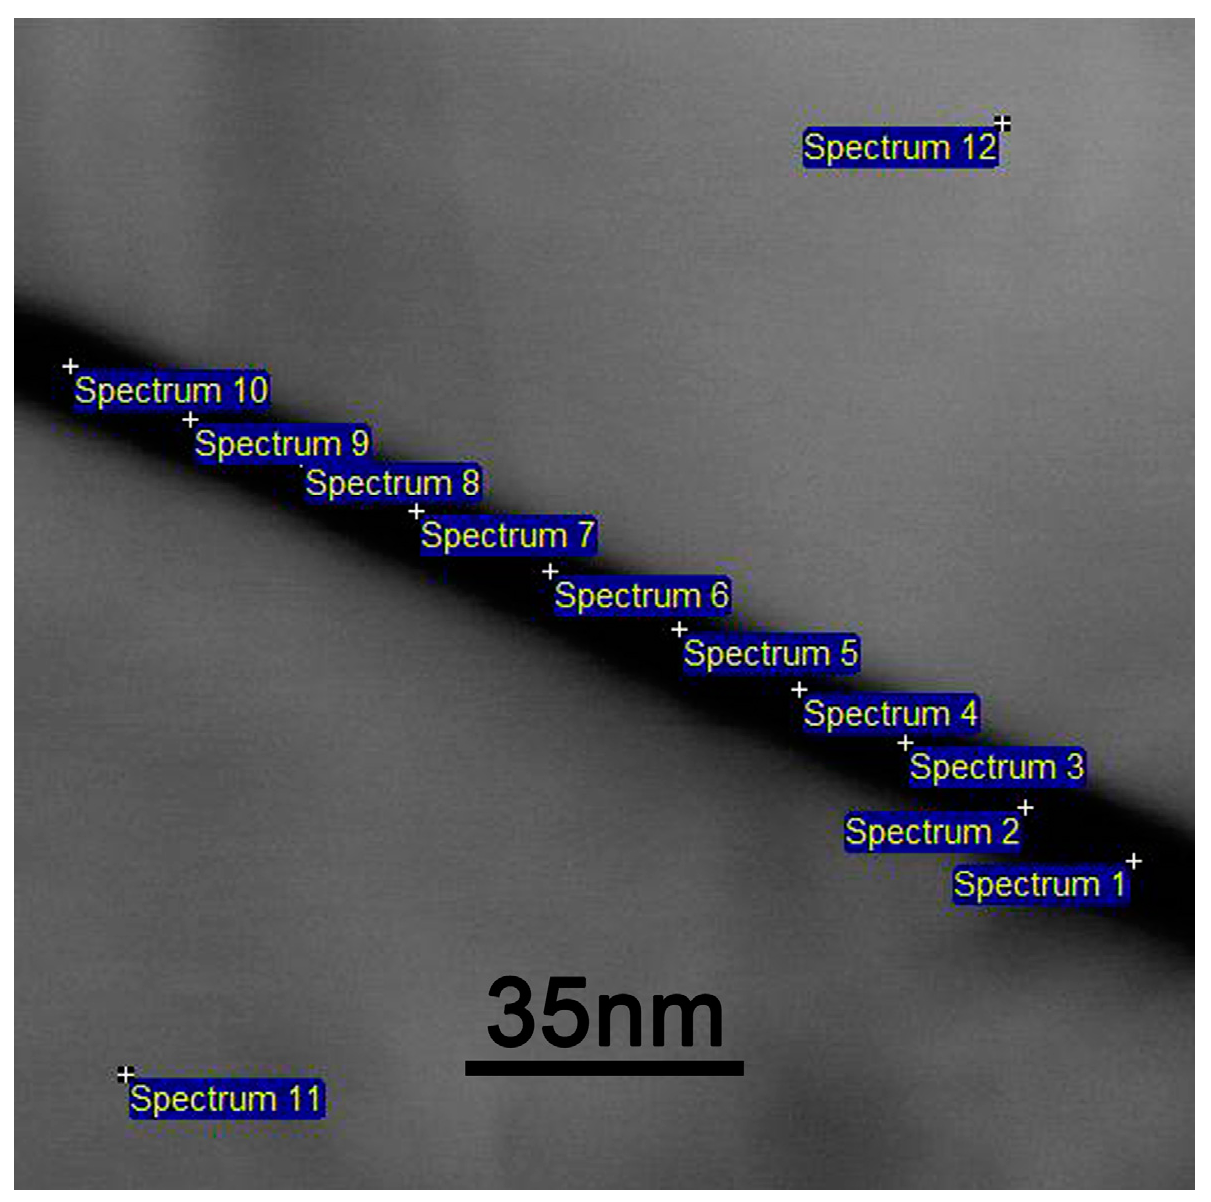
21] and deteriorating the creep properties of the steel. Nevertheless, the rare earth element can increase the grain boundary cohesion in steel, thus improving the creep properties of the steel. To explore the segregation behavior in the Sb-doped and Sb+Ce-doped specimens, the concentrations of Sb and Ce at the boundaries were measured with the use of FEGSTEM after the specimens were tempered and creep-tested at 873 K under 150 MPa.
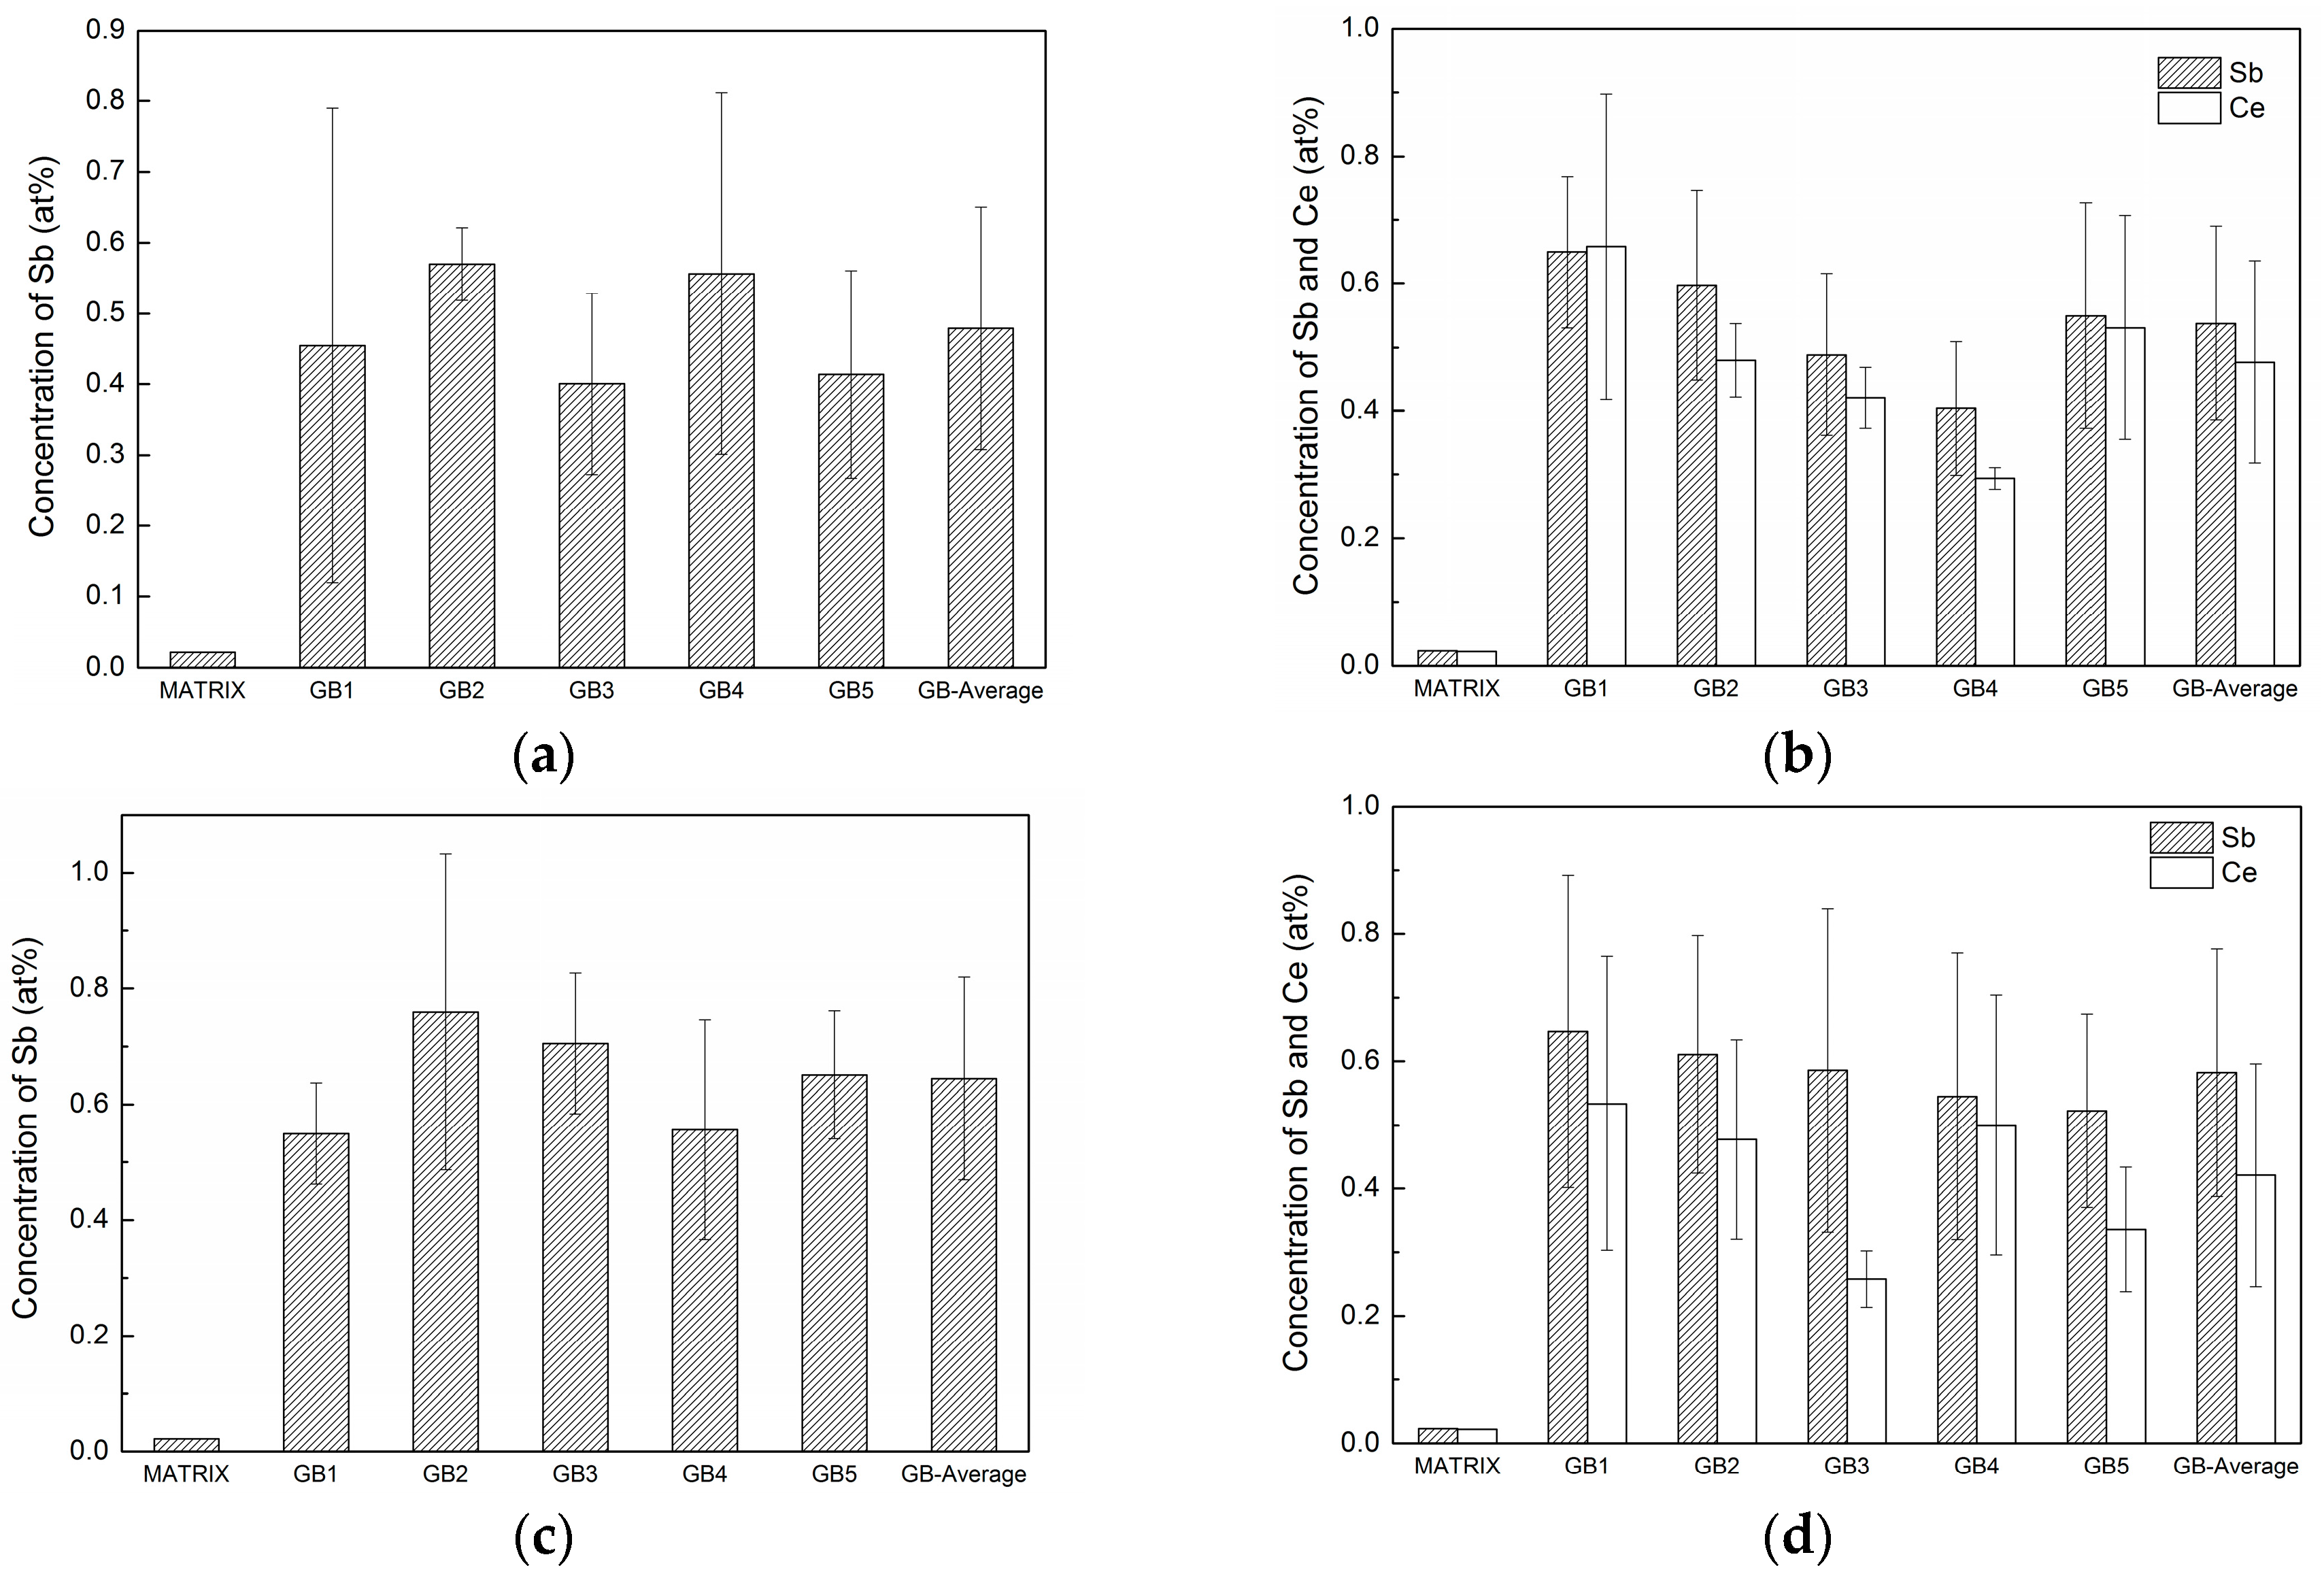
Figure 5 represents an FEGSTEM image showing a segment of grain boundary analyzed, which is free from precipitates. Moreover, the boundary is quite parallel to the incident electron beam, which is suitable for FEGSTEM boundary microanalysis. The boundary concentrations of Sb and Ce are given in
Figure 6 with its matrix concentration plotted for comparison. Obviously, both impurity Sb and rare earth Ce segregate apparently to the boundaries in the specimens as tempered or creep-tested. The boundary levels of both Sb and Ce are over 20 times higher than their matrix levels. The average boundary concentration of Sb in the Sb-doped specimen increases by approximately 40% after creep-tested (from 0.47 at. % to 0.64 at. %, see
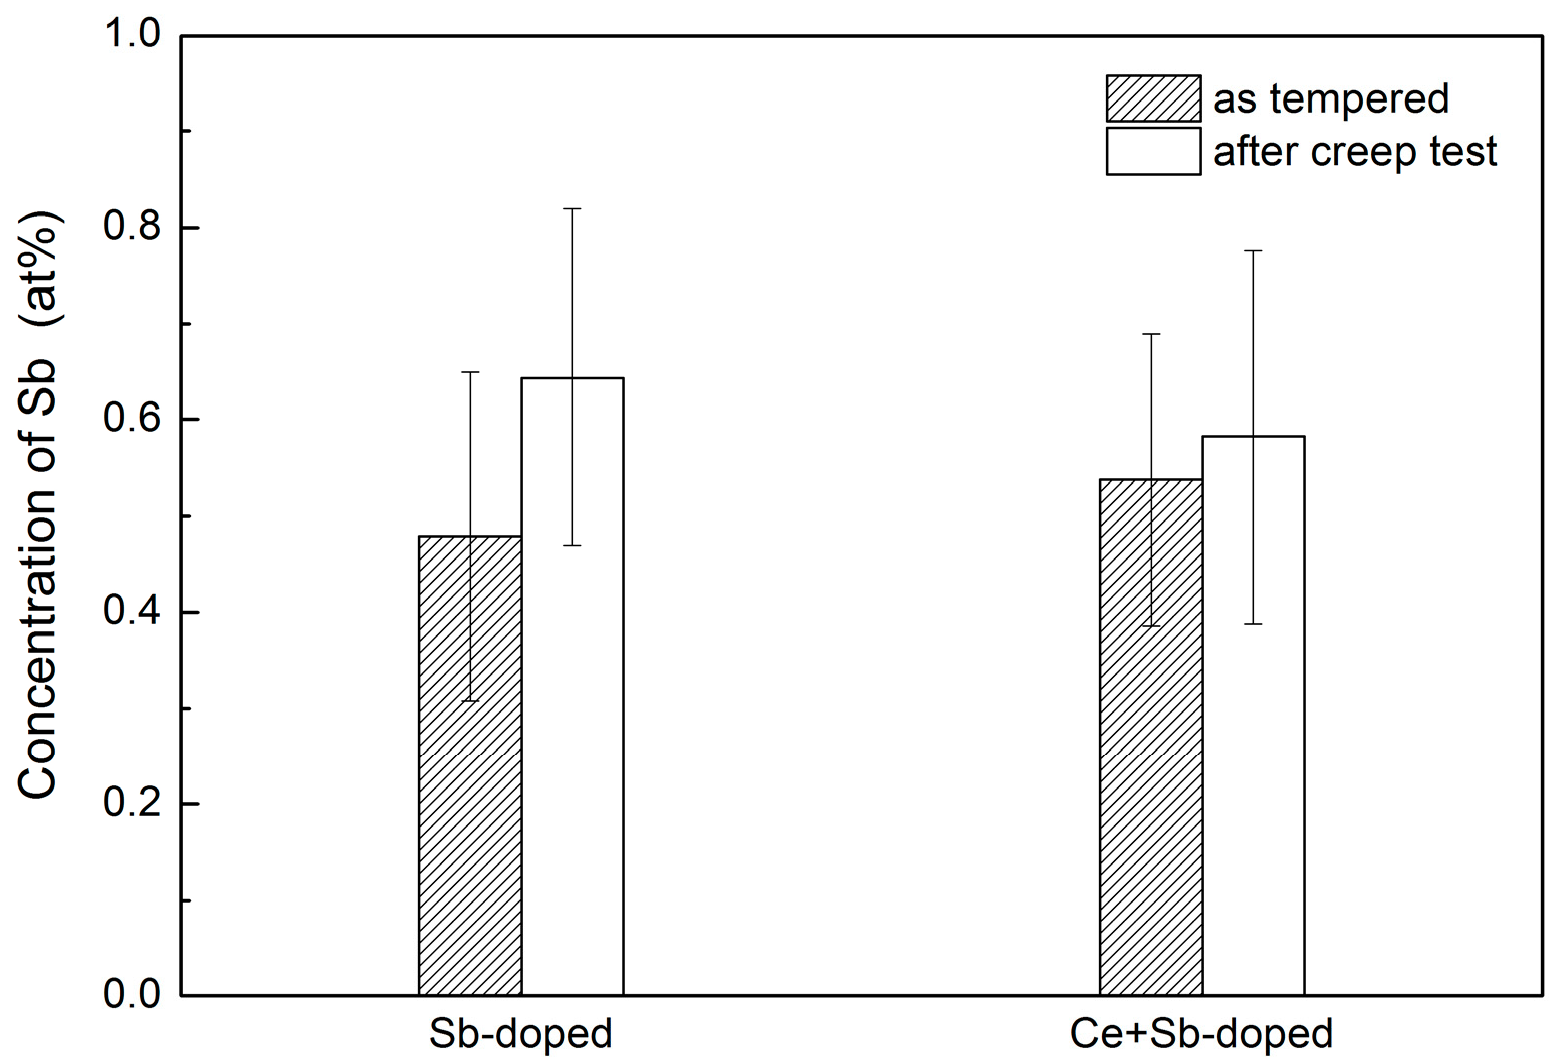
Figure 6a,c), while the average boundary concentration of Sb in the Sb+Ce-doped specimen as tempered (0.53 at. %) is almost the same as that in the Sb+Ce-doped specimen creep-tested (0.58 at. %). For clarity, the average boundary concentrations of Sb in the Sb-doped and Sb+Ce-doped specimens as tempered and creep-tested are represented in
Figure 7.
As discussed above, the boundary cohesion can be considerably increased by the boundary segregation of Ce, which can compensate the detrimental effect of Sb and thereby restrain the initiation of cavities and microcracks. In other words, rare earth Ce can strengthen the boundary in steel. Moreover, rare earth Ce could also segregate to dislocations, which may restrict the slip and climb of the dislocations, thus stabilizing the dislocations and leading to a higher apparent activation energy for creep (621 kJ/mol). With these mechanisms, rare earth Ce can stabilize the microstructure of the steel during creep, which may be the reason why there are more dislocations and subgrains remaining in the Sb+Ce-doped specimen than in the Sb-doped specimen after creep test, and the microstructure in the Sb+Ce-doped specimen are not apparently coarsened as compared with that in the Sb-doped specimen. In addition, as shown in
Figure 7, the rare earth Ce in the Sb+Ce-doped steel can reduce the boundary segregation of Sb, thus suppressing the effect of Sb to a certain degree. Consequently, the creep properties of the Sb+Ce-doped steel are apparently better than those of the Sb-doped steel.


