1. Introduction
Steel structures located in the outdoor environment are exposed to factors of atmospheric corrosion causing the formation of corrosion products on the metal surface and consequently a decrease in the thickness of the material. Among the main factors of atmospheric corrosion belong mainly humidity, temperature, aggressive stimulants present in the atmosphere such as SO
2, Cl
−, NO
x, solid particulate matter, and others [
1]. The inappropriate use of structural carbon steel without corrosion protection in the outdoor environment and others reasons has led to the development of new types of low-alloy steels [
2]. The first steel with increased resistance to atmospheric corrosion, the so-called weathering steel, was patented in the USA in 1933. In 1964, weathering steel was first used for the design of the main supporting structure of a bridge [
3,
4]. The alloying elements contained in weathering steel remain within 2 wt. % and are primarily represented by Cu, Cr, P, and Ni. What matters is the balance of individual alloying elements, especially the Cu–P–Cr combination.
Weathering steel is mainly used in designing bridge structures, lattice towers from sections and tubes, but also as roofing and cladding materials or decorative material. The increased resistance to corrosion in the atmosphere results from the development of a compact adhesive corrosion layer on the surface that reduces corrosion rate to a technically permissible limit. The corrosion layer with protective properties, the so-called “patina”, forms after 3 to 7 years of exposure under suitable environmental conditions with respect to the concentration of SO
2 in the atmosphere. The necessary atmospheric conditions include, in particular, regular wetting and drying of the steel surface and also an environment remaining within the permissible limits of aggressive corrosion stimulators. In order to ensure a favourable development of the protective corrosion layer, it is necessary to ensure regular maintenance of the structure as well as regular inspections, mainly in the first years after construction, revealing places prone to accumulation of dust particles, impurities, or moisture. When designing structures increased attention must be paid to the layout design of the bridge structure, the structural details, and the design of the drainage system for the bridge [
5].
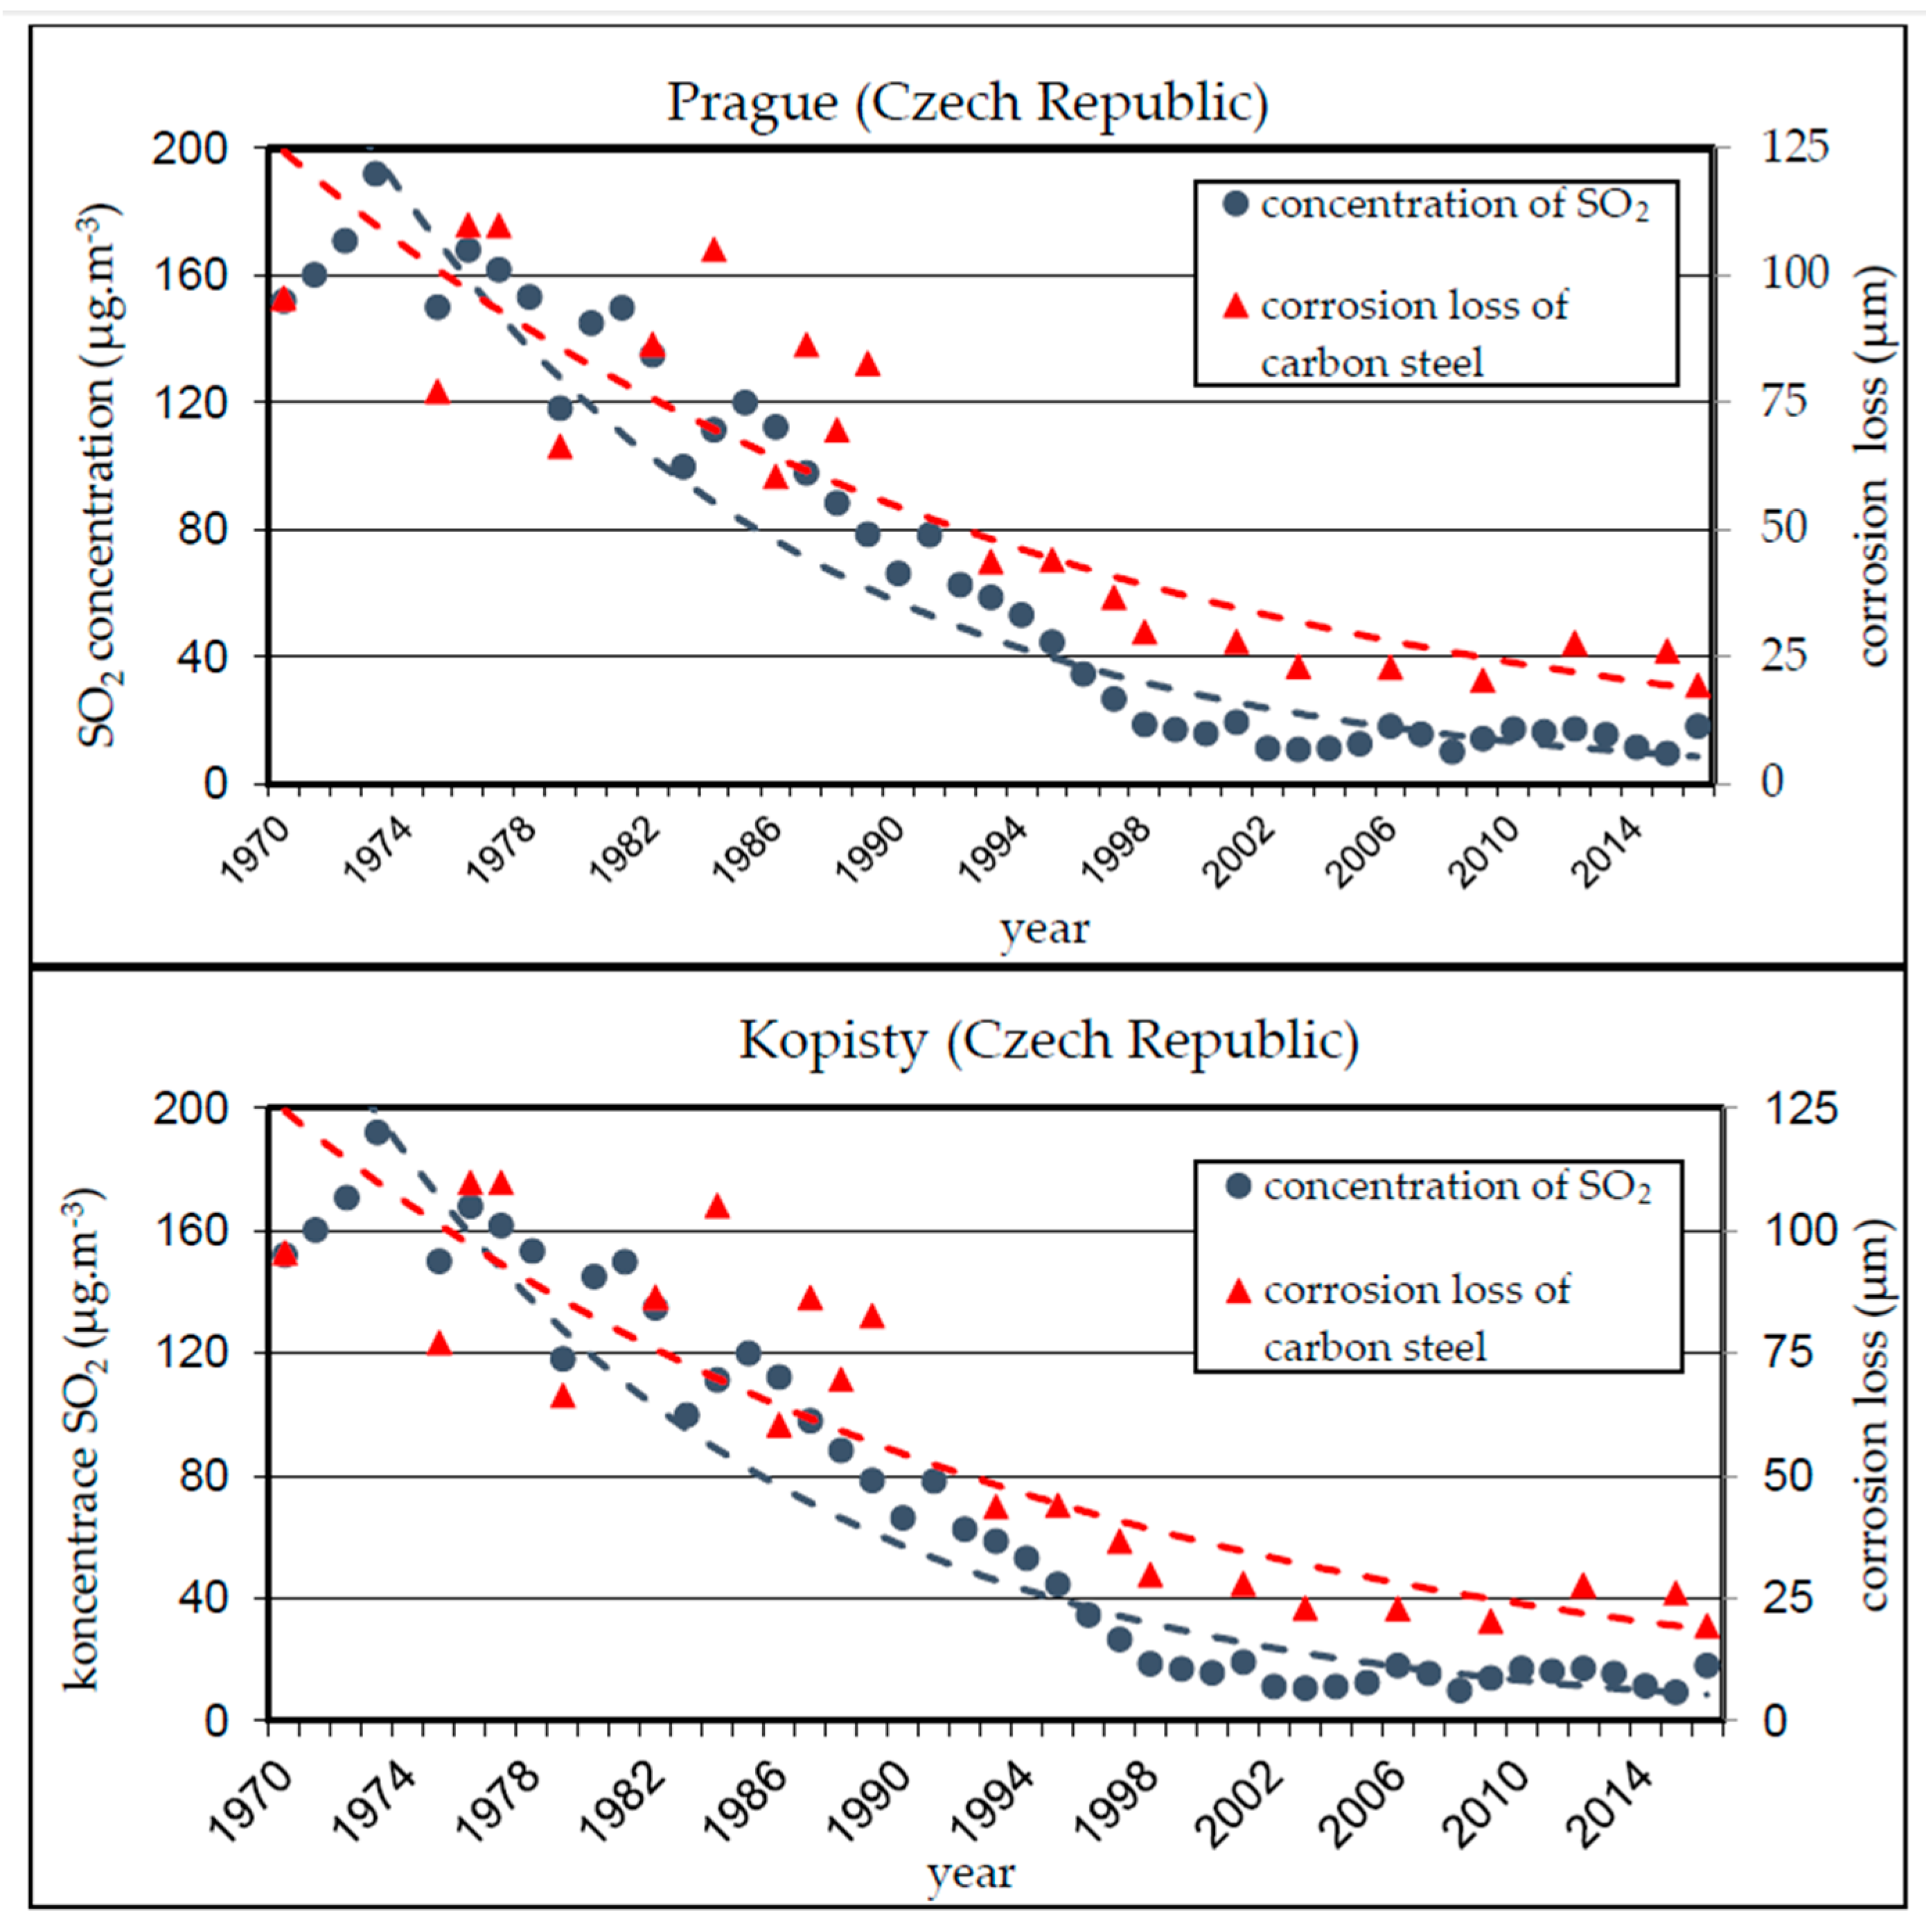
As mentioned above, the most important aggressive corrosion stimulators occurring in the atmosphere include sulphur dioxide (SO
2) and chloride ions (Cl
−). Sulphur dioxide is brought to the air primarily as a product of fossil fuel combustion. It had the greatest impact on steel corrosion rate in the Czech Republic between 1970 and 1980. The subsequent introduction of desulphurization units brought a substantial reduction of SO
2 concentration in the atmosphere and the corrosion losses of carbon steel in the Czech Republic, current values stay below 10 µg/m
3 [
6,
7,
8], see
Figure 1.
Due to the notable decline in SO
2 concentrations, chlorine ions (Cl
−) originating from de-icing salt used for winter road maintenance have become much more important factors of corrosive damage. The action of the chlorides leads to the formation of a corrosion layer at an increased rate, the resulting layer being thick and layered with numerous pores limiting the protective function of the corrosion layer on the surface of the weathering steel [
8,
9]. In coastal areas, the deposition rate of chlorides ranges from 250 mg·m
−2·day
−1 to 2000 mg·m
−2·day
−1, which is mainly sea salt aerosol in the air [
8]. In inland areas, chlorides are spreading from de-icing chemicals used during the winter. In the Czech Republic, road maintenance mainly uses sodium chloride (NaCl). In the vicinity of roads so treated, the chloride deposition rate can then be expected to reach values otherwise typical for coastal areas. Significant deposition can be expected during the winter period, although certain studies indicate that higher deposition rates can still be measured for up to two and a half months after the last application of de-icing agents [
9,
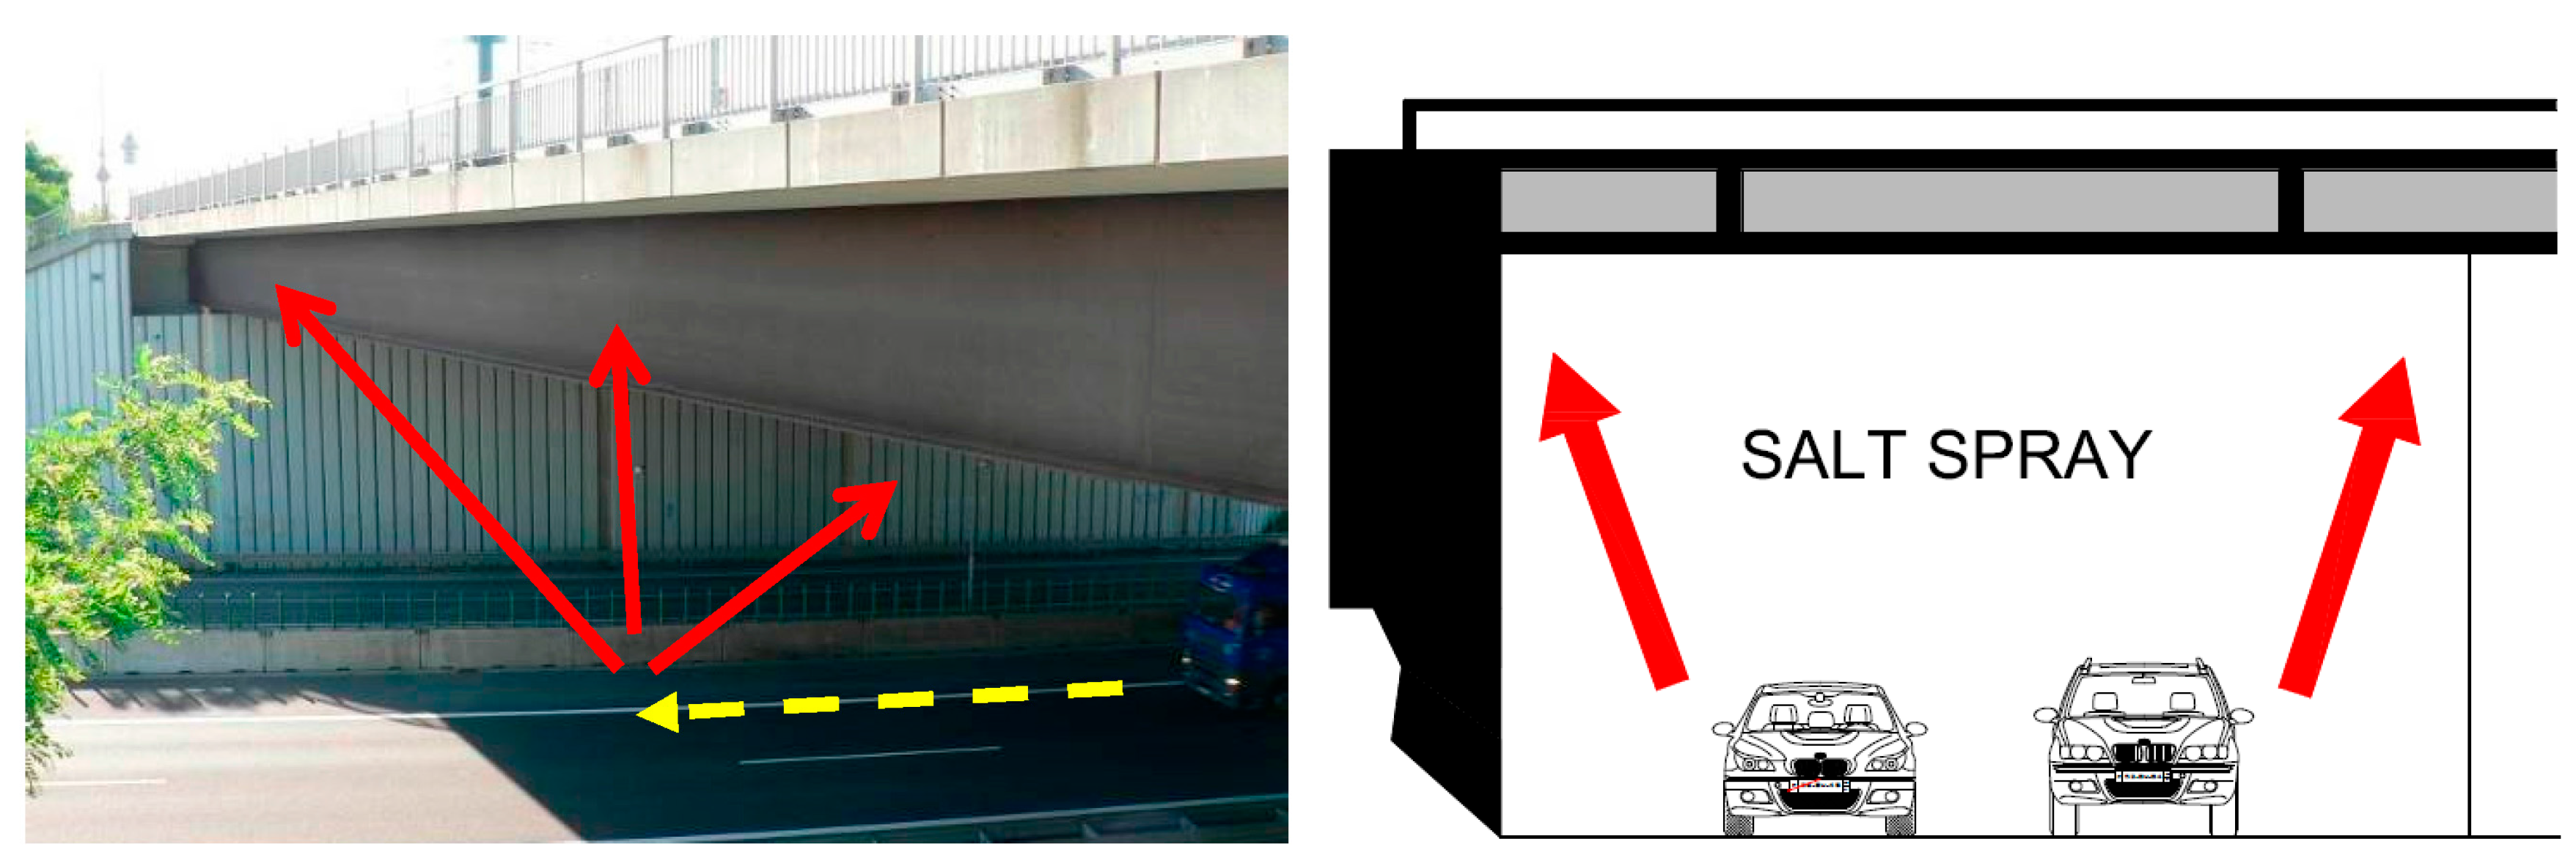
10]. It is thus currently needed to concentrate more intensively on the issue of chlorides spreading around bridge structures. Increased chloride deposition can cause significant corrosive damage and reduce the formation of the protective layer on the weathering steel surface.
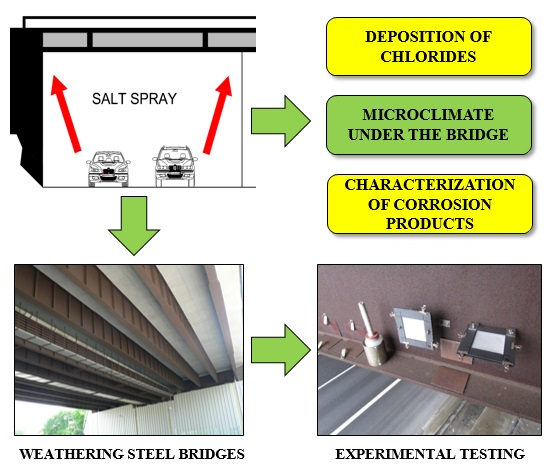
In view of the above, this article presents an experimental monitoring of chloride deposition on a supporting steel structure of selected bridges designed from weathering steel. The measurement results are evaluated in relation to the results of atmospheric corrosion tests carried out in parallel with the chloride deposition measurements. The main objective of the research is to monitor the influence of the environment under the bridge structure (especially the impact of increased chloride deposition from road transport under the bridge) on the development of the corrosion layer and its protective properties.
4. Discussion
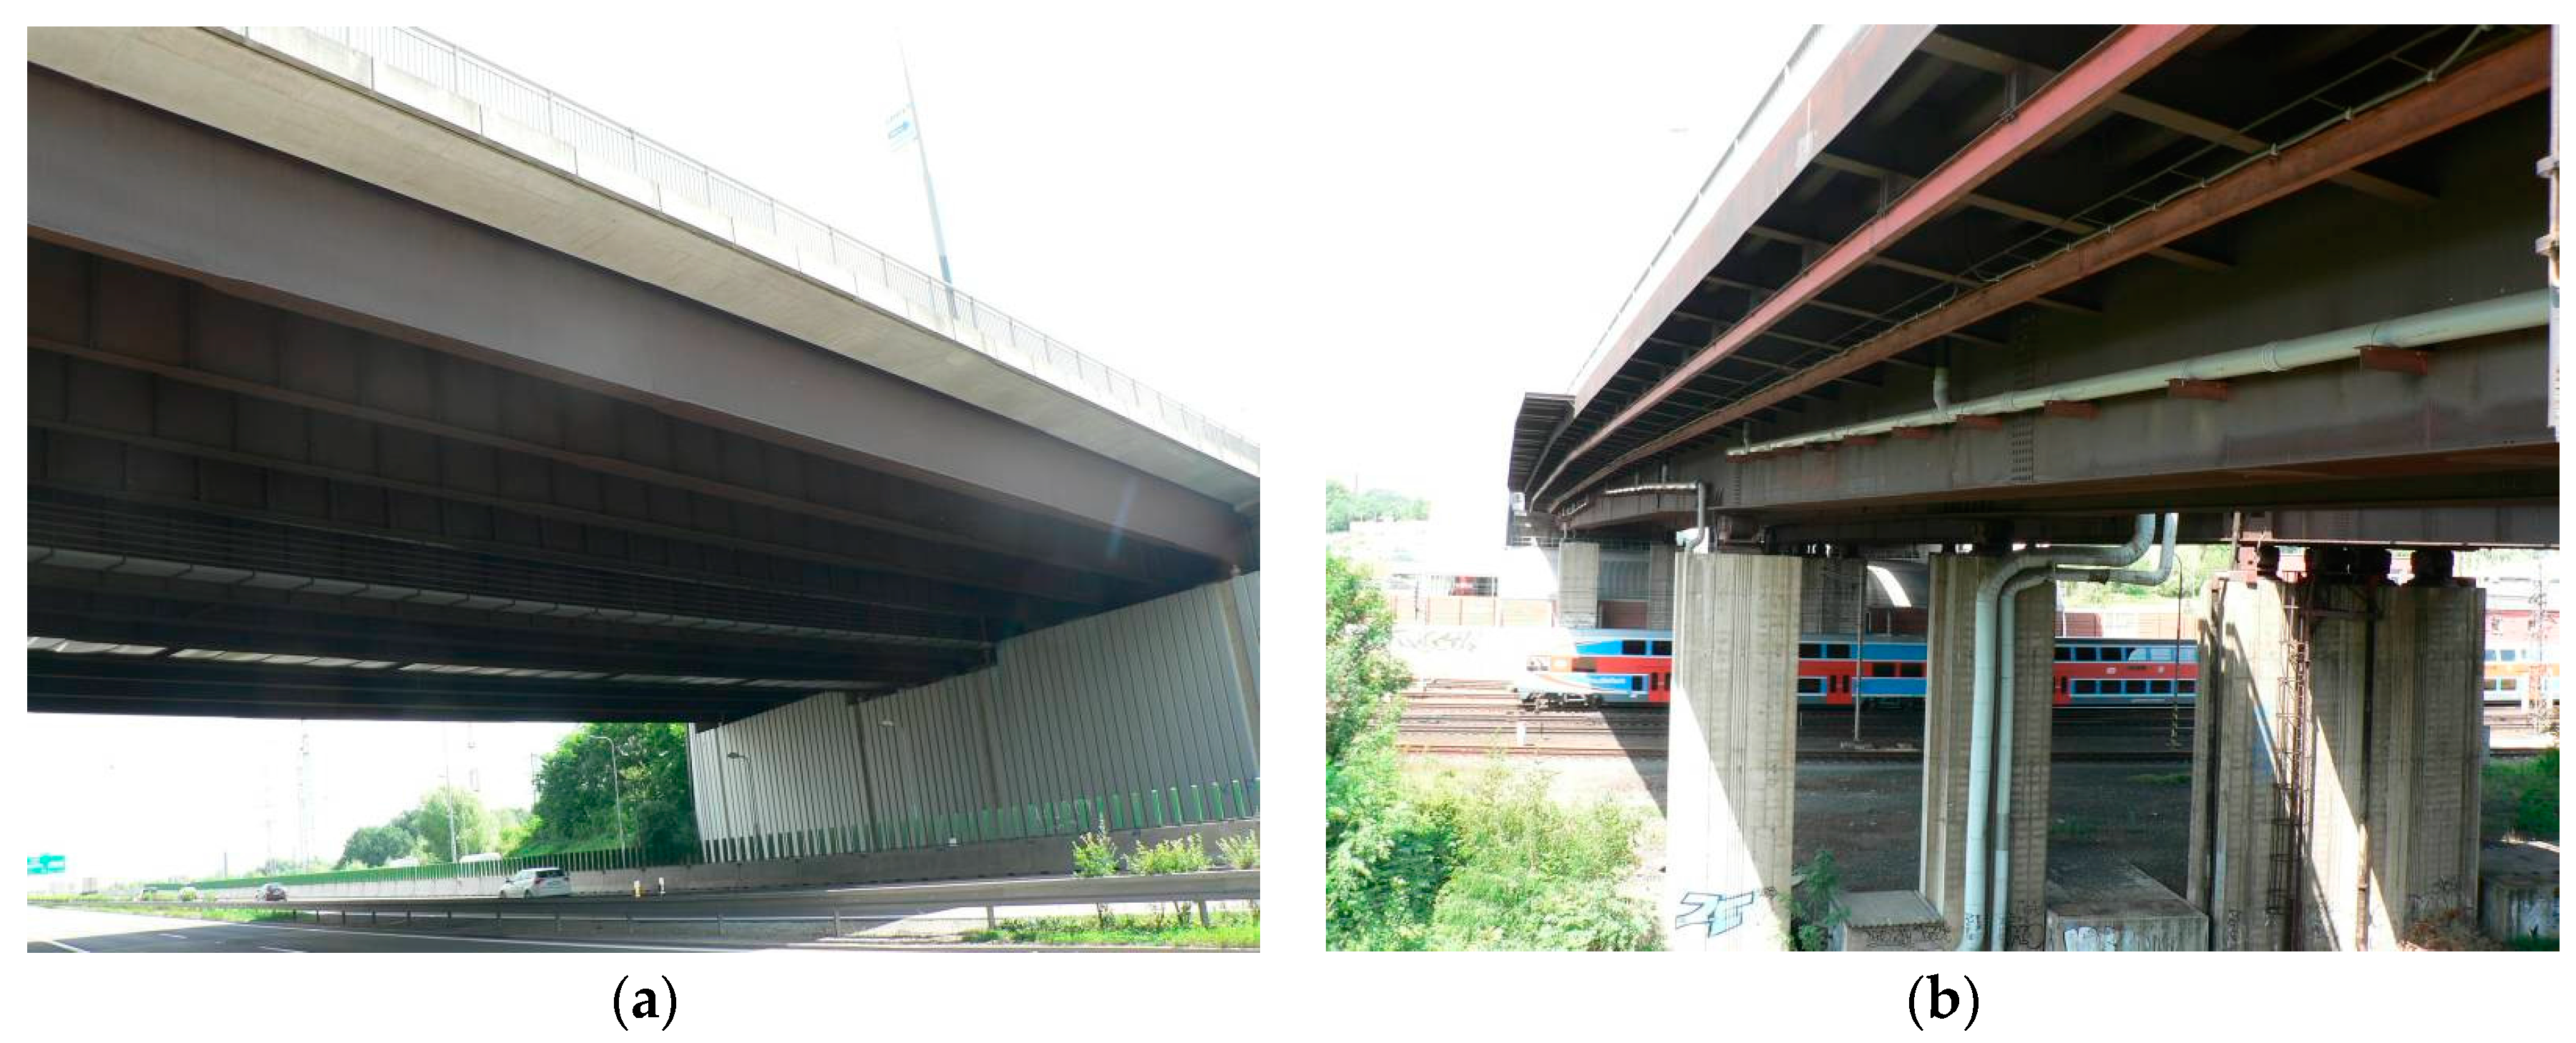
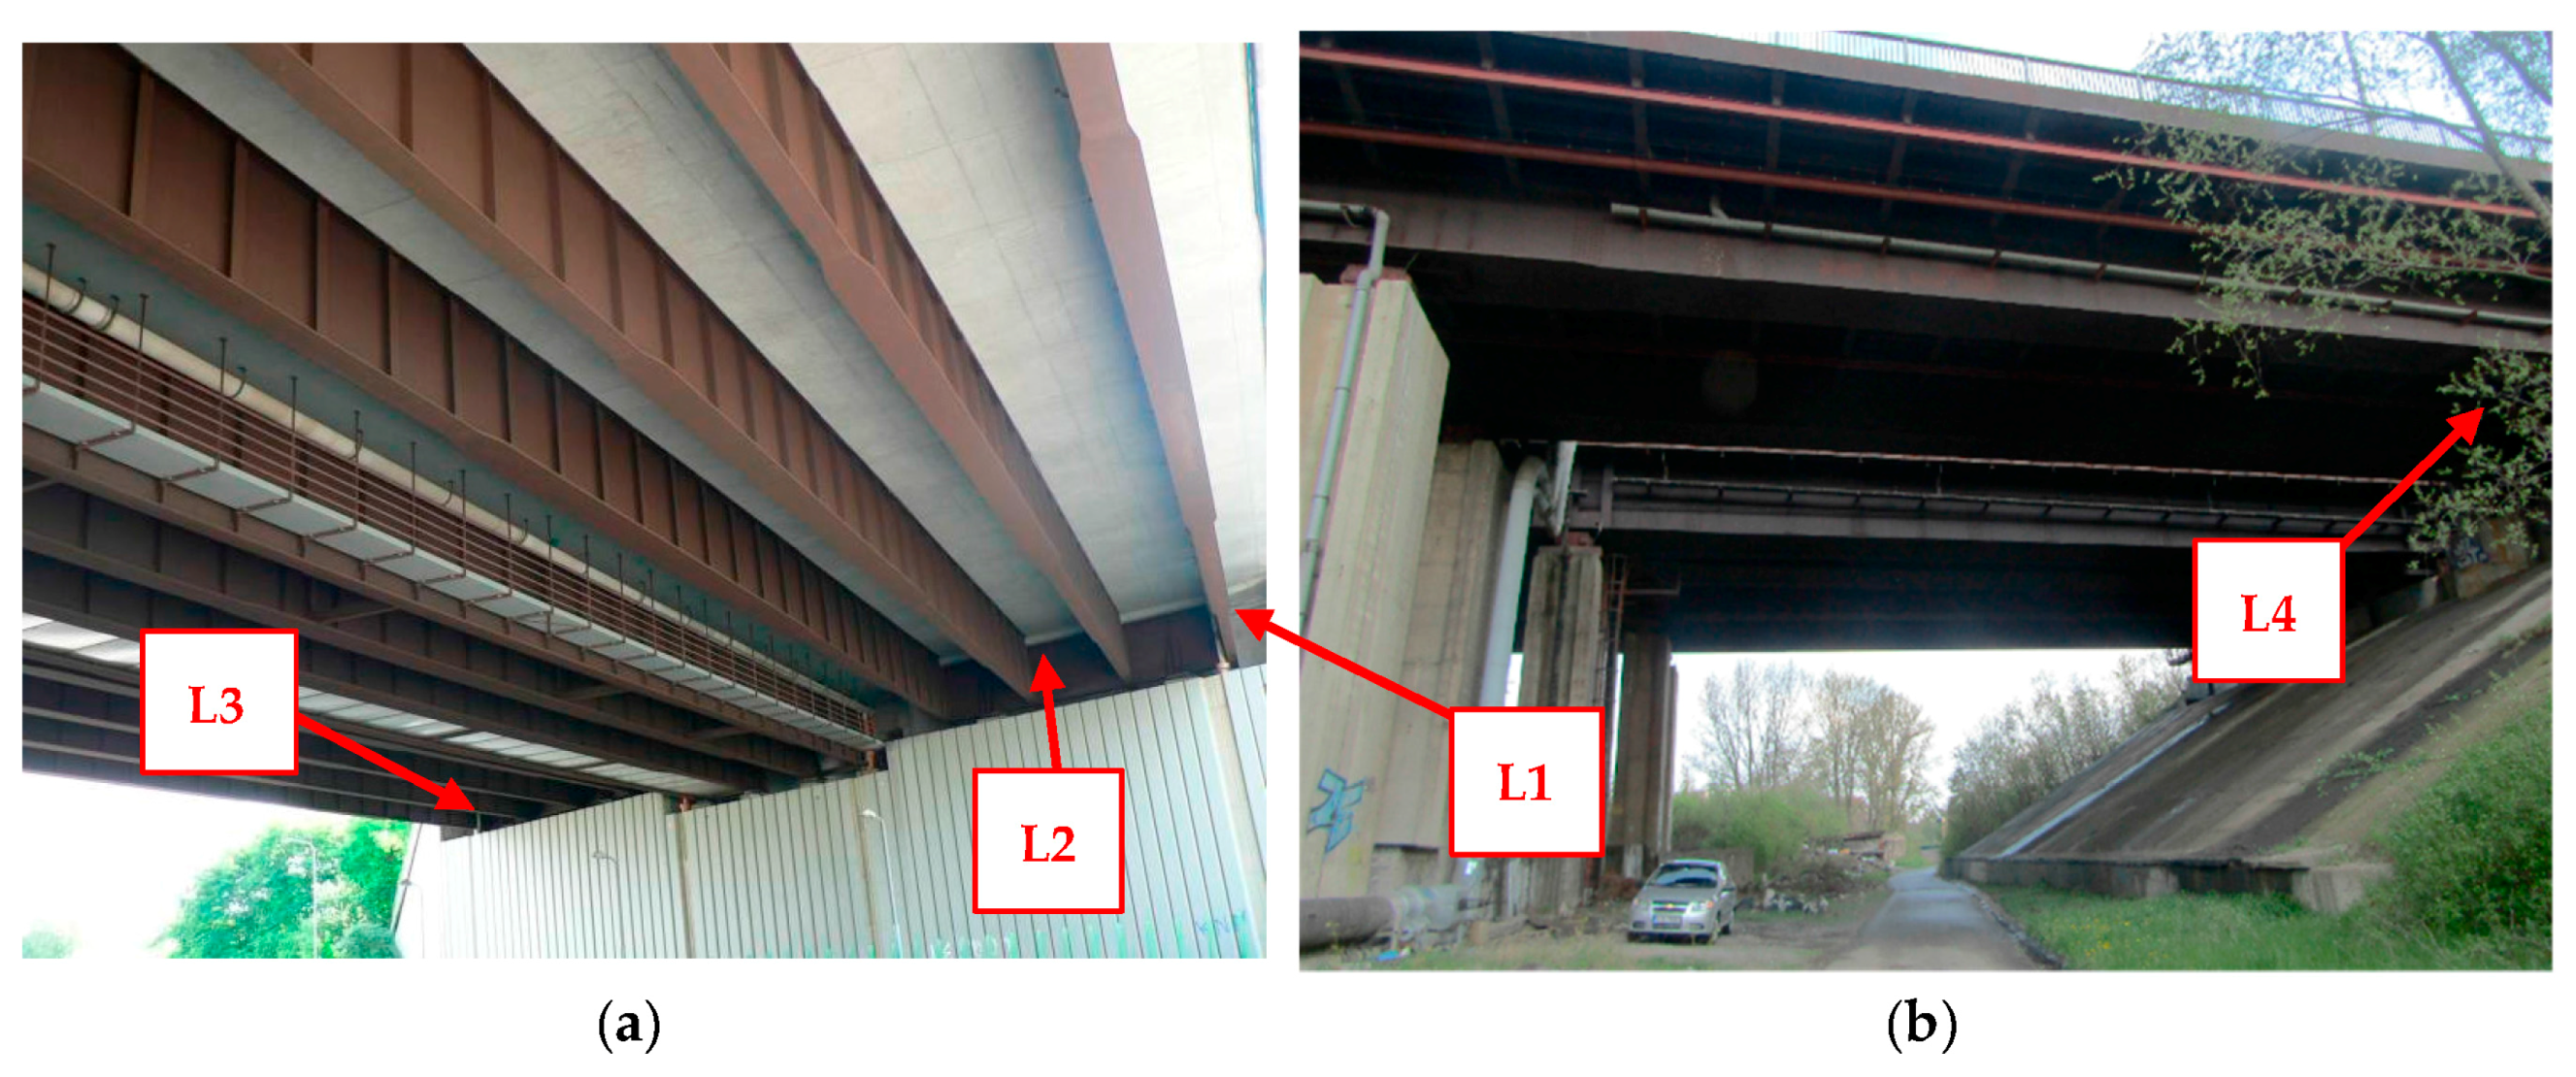
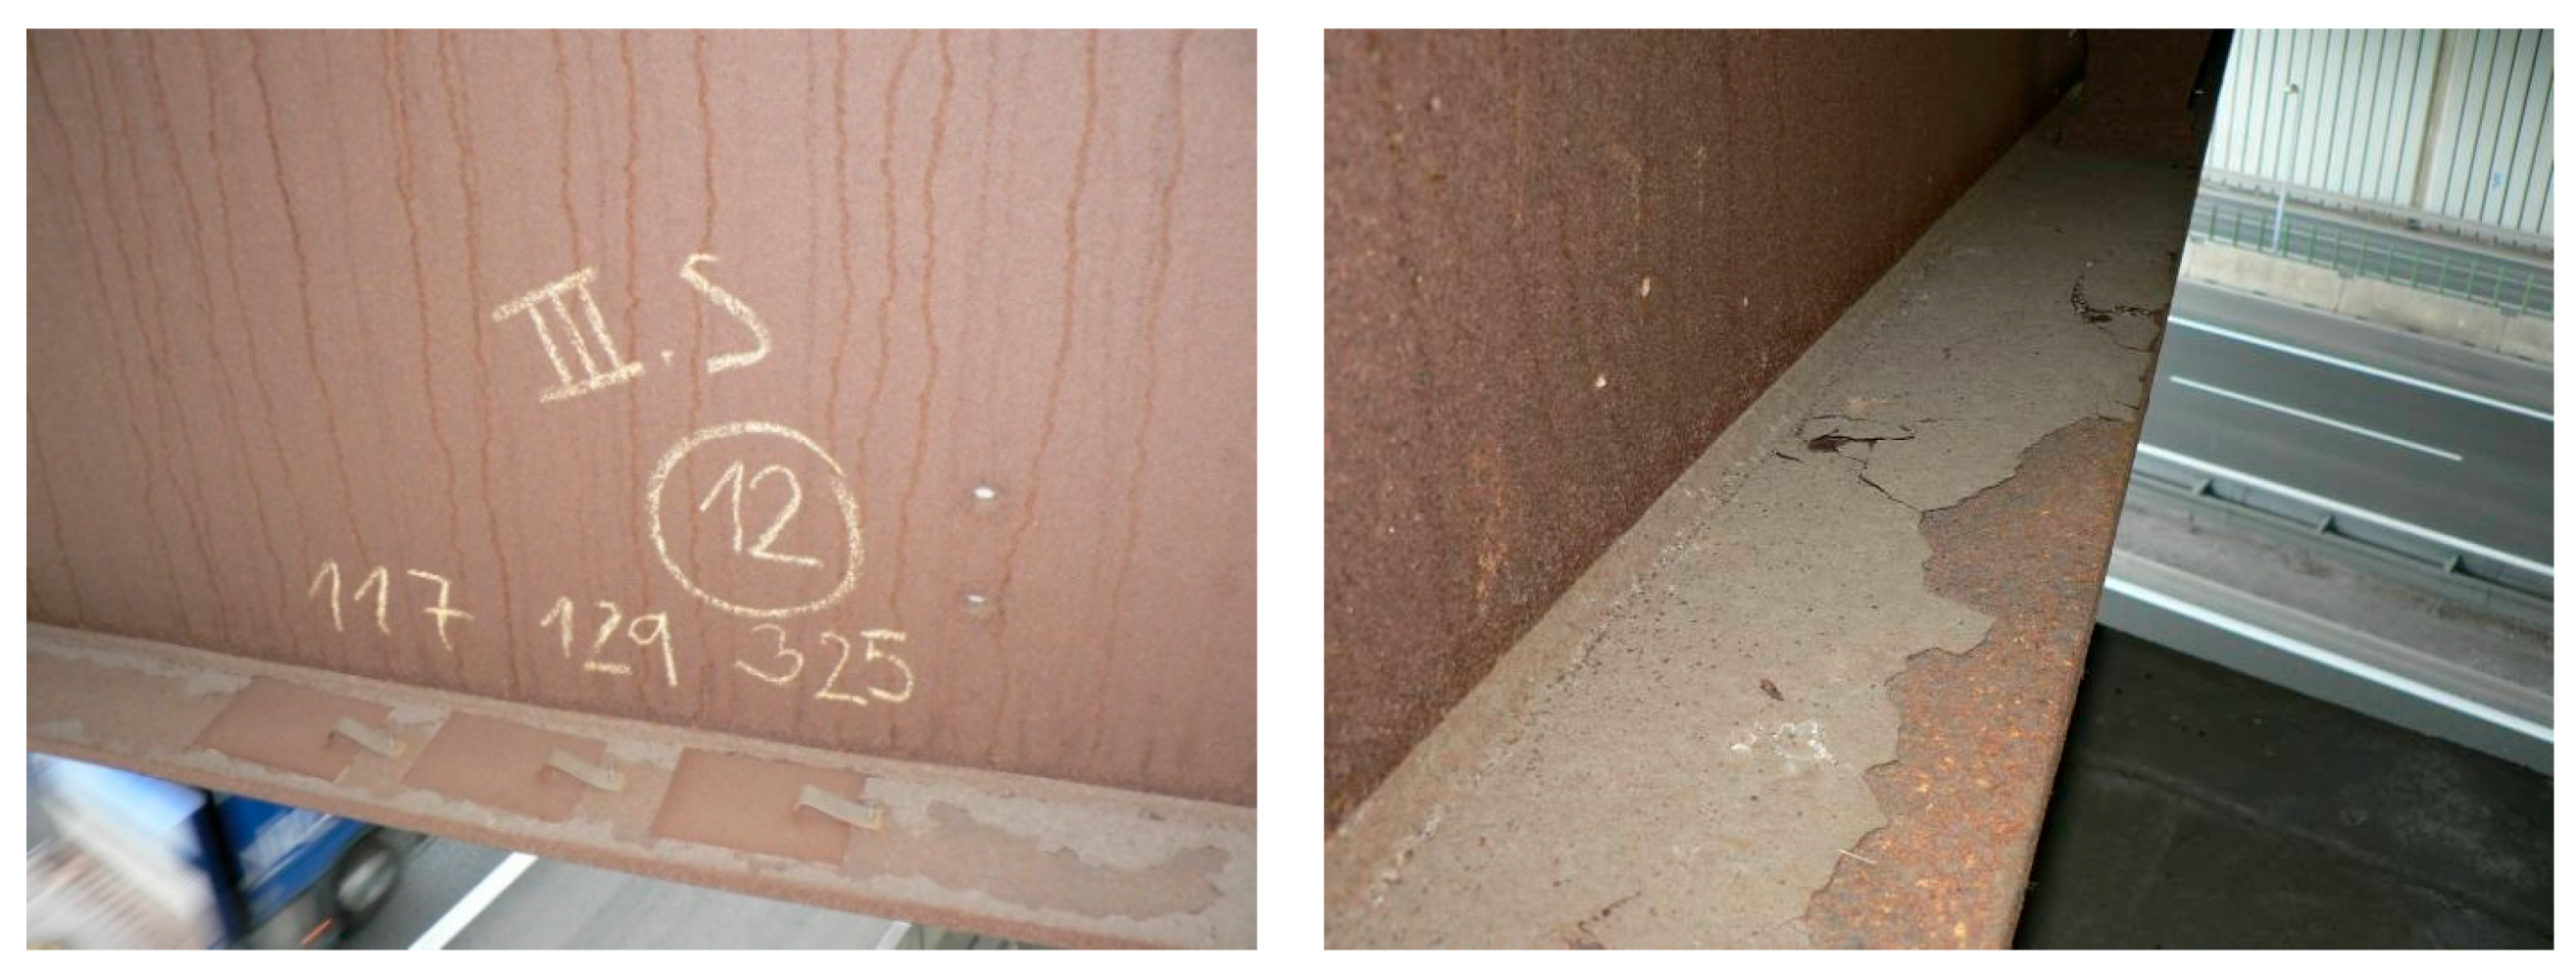
All experimentally determined data clearly show that the development of corrosion products largely depends on the local microclimate under the bridge structure. Intense road traffic under the bridge becomes the source of increased dust and chloride deposition on the bridge bearing elements. The most affected areas of the load-bearing steel structure are the internal surfaces of the bottom flanges of the I-shaped cross-sections, unlike the external ones, these horizontal surfaces do not benefit from sufficient washing from regular rainfall and blowing of the dust deposits by the wind.
Experimental measurements have also shown that dust and chloride deposition on the load-bearing steel structure coming from road traffic on the bridge is significantly lower than the deposition resulting from the traffic underneath. For that, however, some basic constructional principles must be observed regarding the design of bridges with an upper deck. The supporting structure under the deck is then protected against the corrosive effects of the traffic on the bridge.
To evaluate the development of corrosion products on the typical surfaces of bridge structures, various methods can be used. A basic visual assessment should always be supplemented by a measurement of the corrosion products’ average thickness. Measurements are easily taken with portable thickness gauges and the results are readily available. Average thickness of corrosion products of 350 to 400 μm is usually considered as the limit value of a favorable development of the protective corrosion layer for long-exposed bridges [
19,
22]. The values of corrosion product thickness measured during the initial bridge’s exposure can be used for an accurate estimation of the corrosion rate, as there is a strong correlation between thickness of corrosion products and corrosion loss [
21].
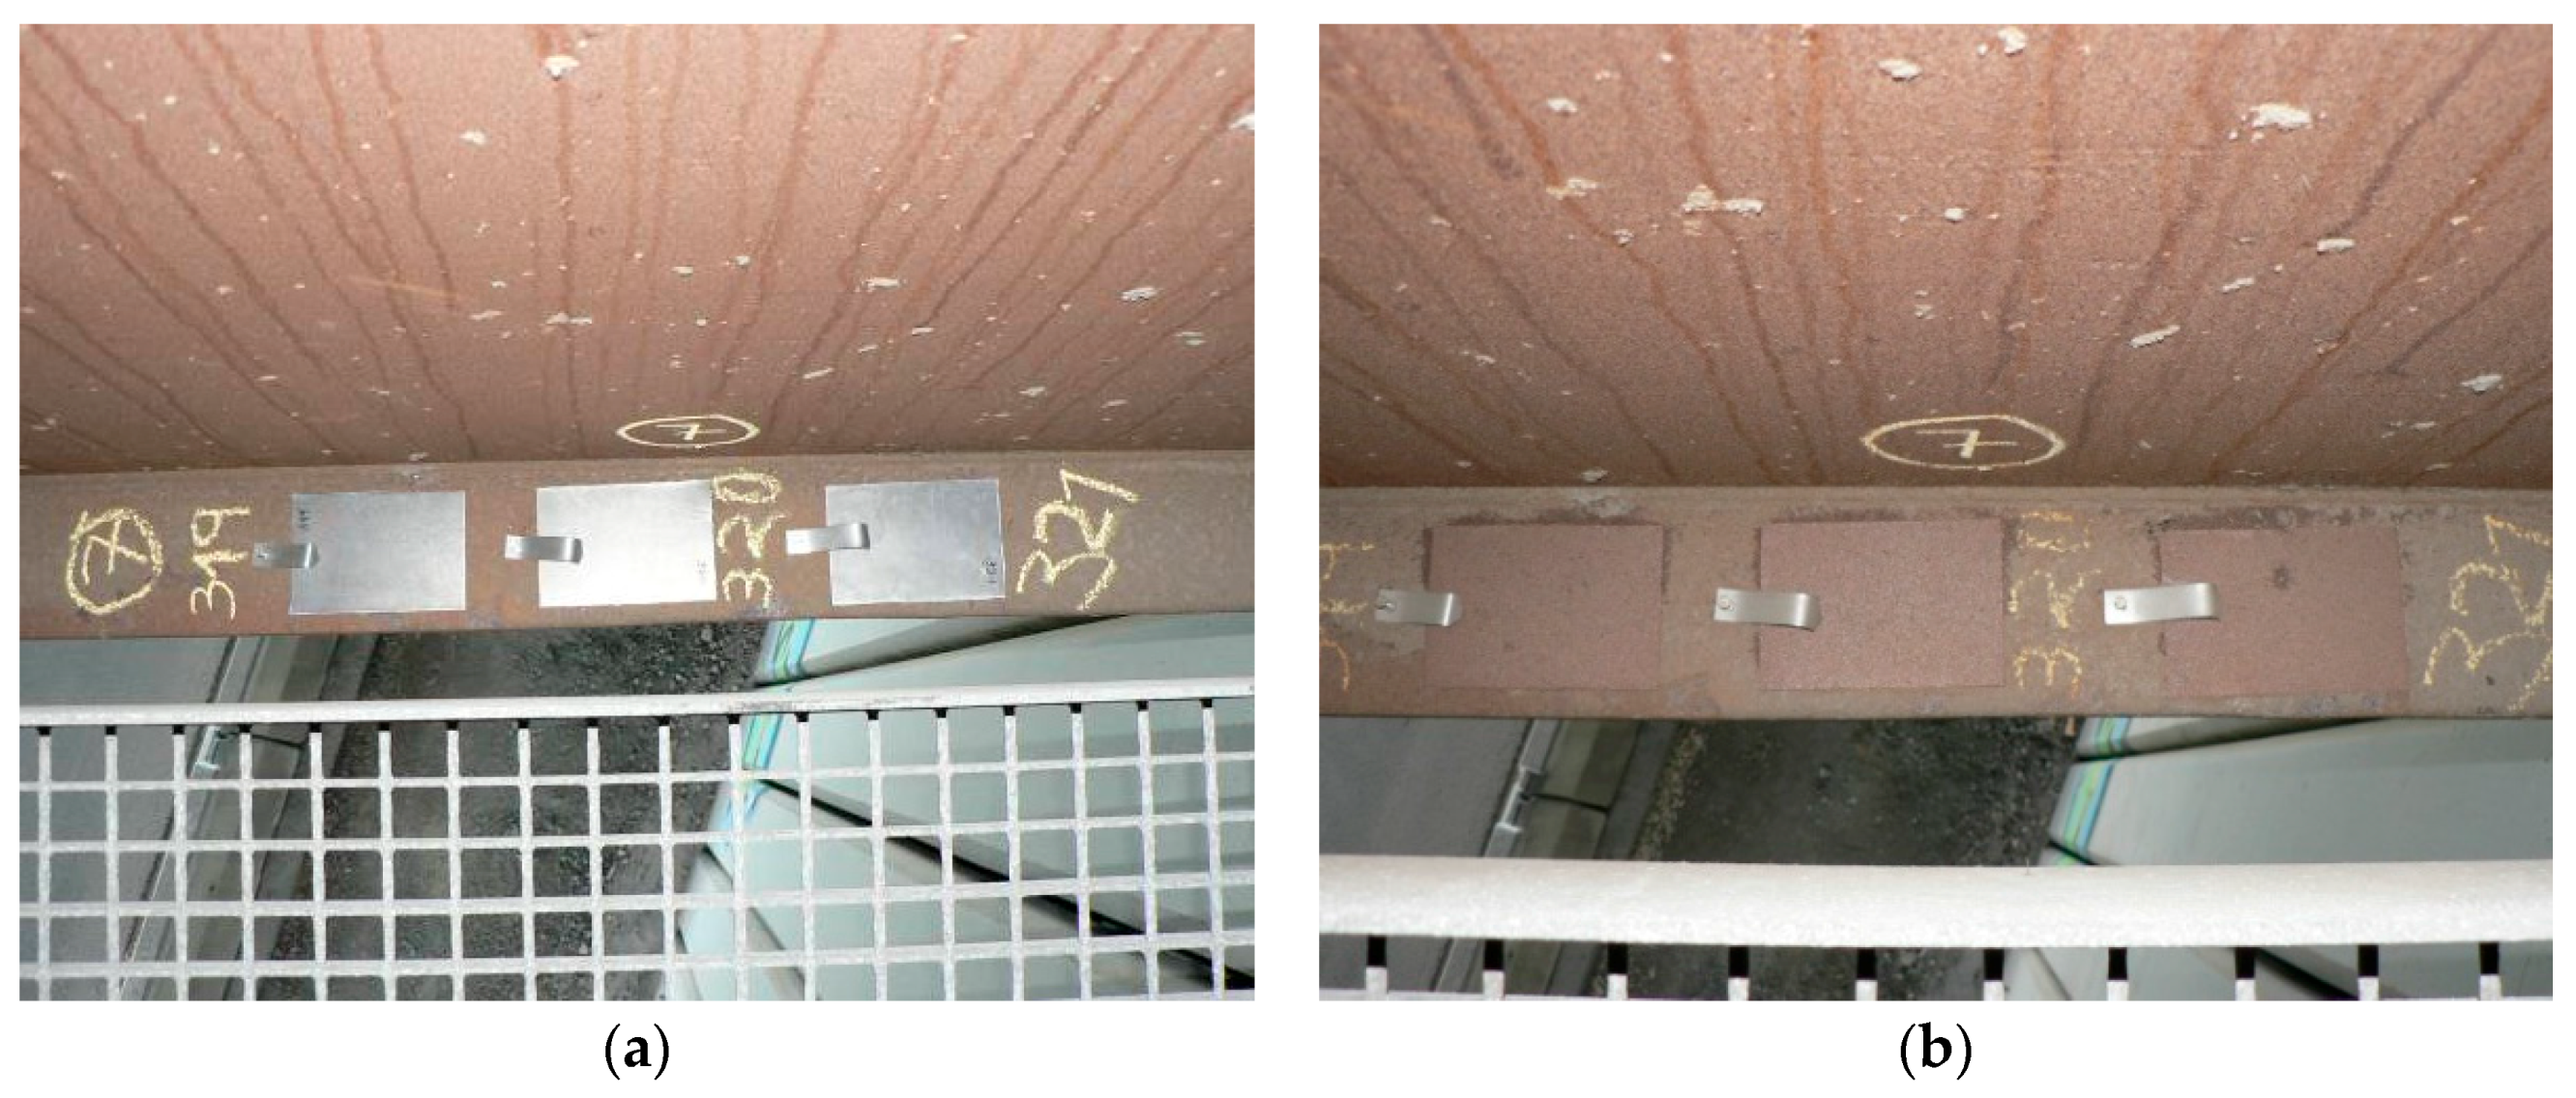
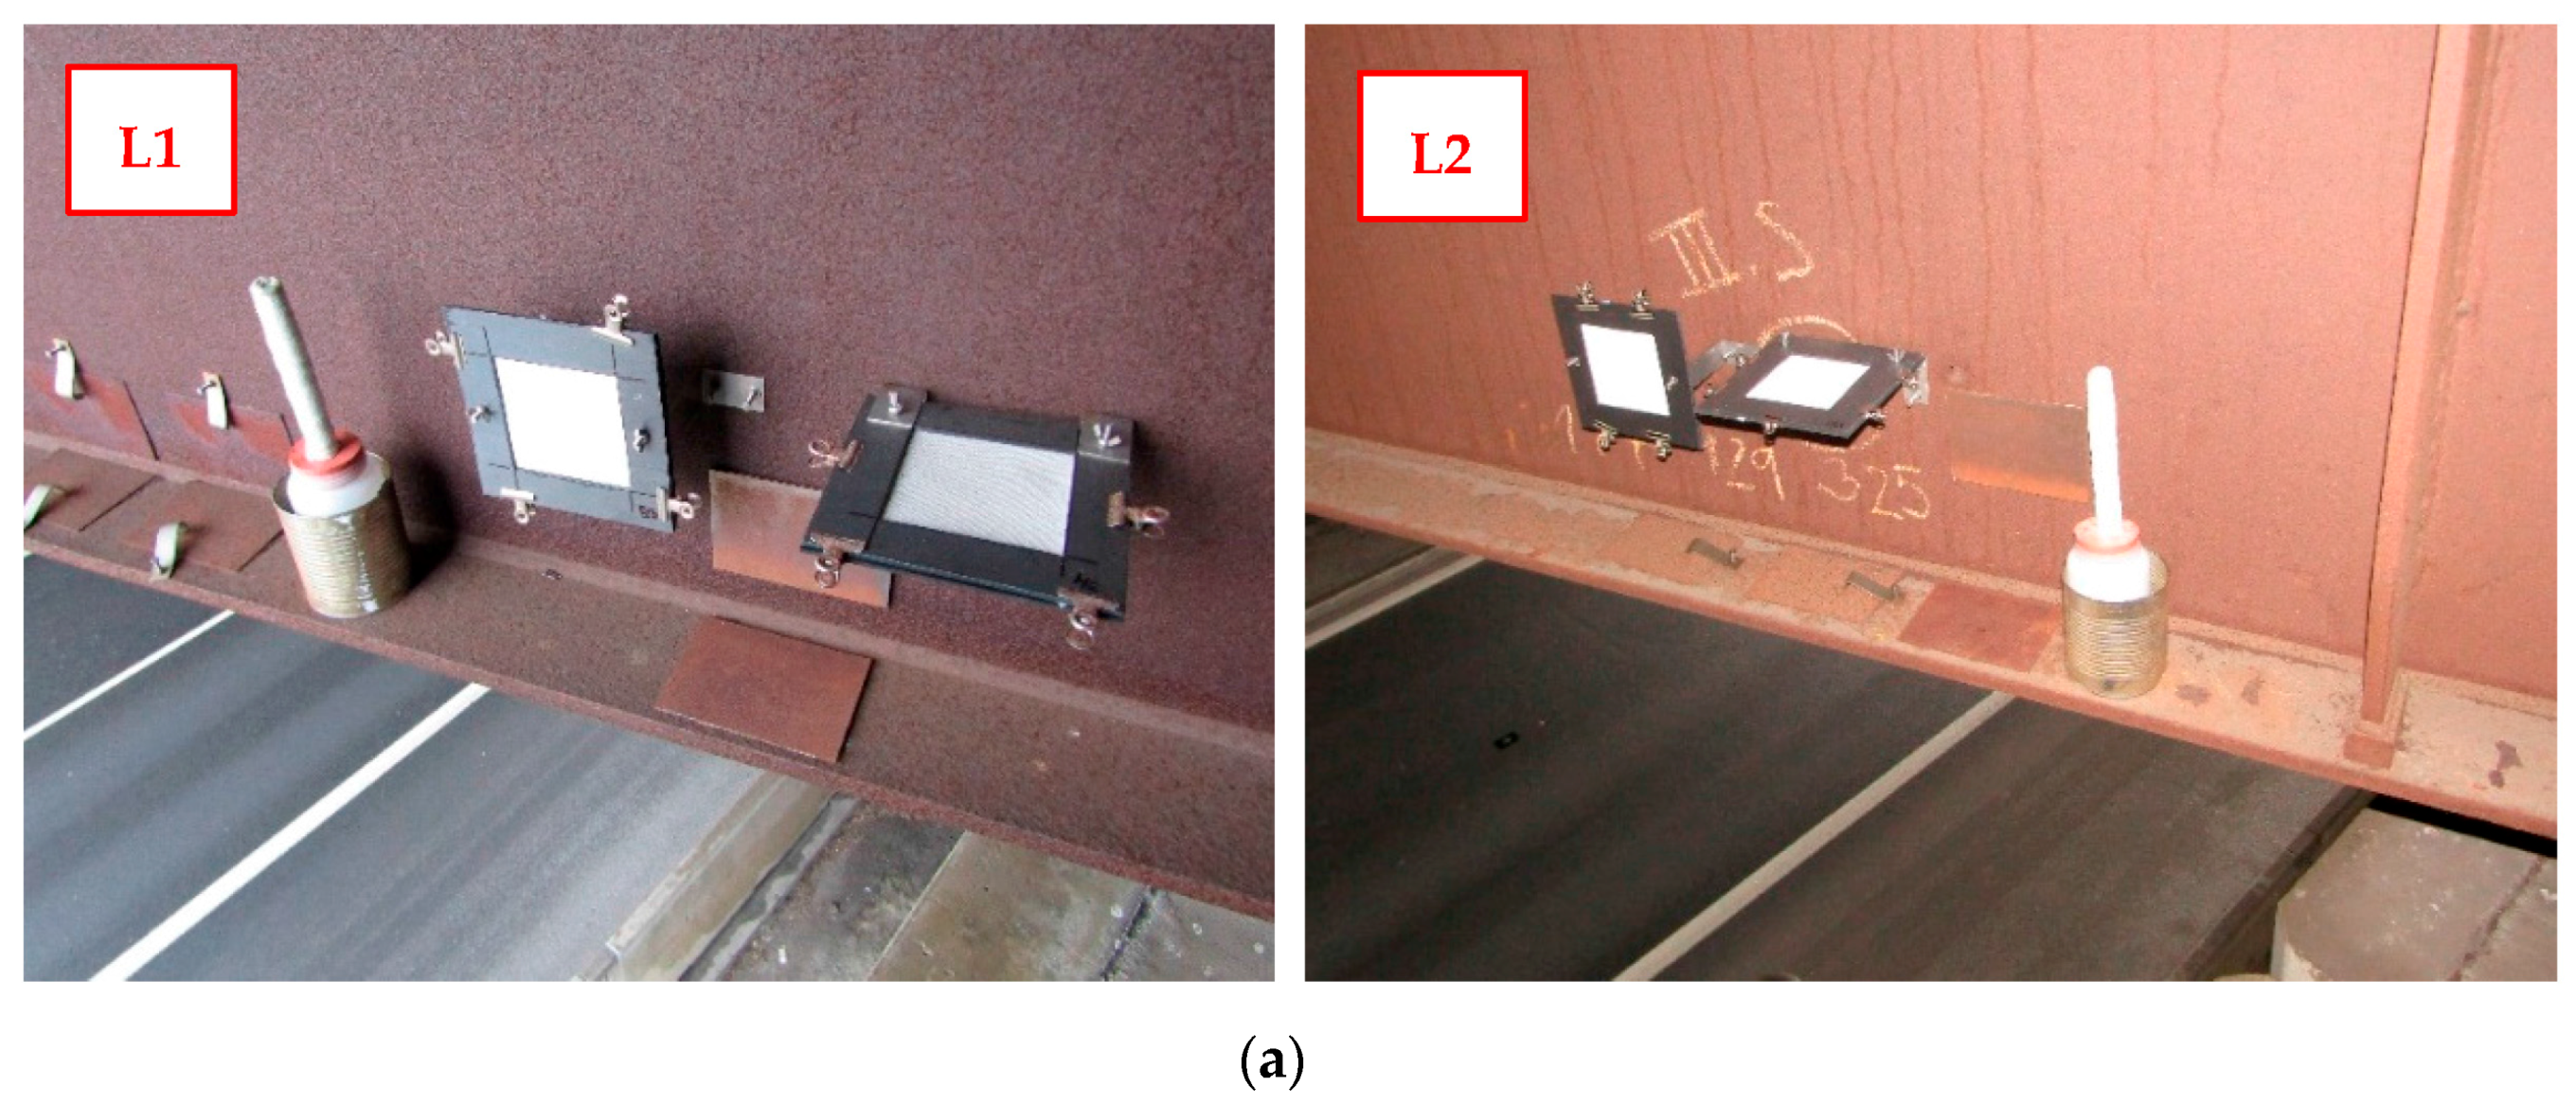
The atmospheric corrosion tests using corrosion samples installed on the surfaces of the bridge structure provides the most valuable data on the development of corrosion processes. By applying a sufficiently large number of corrosion samples to the surface of the structure, it is possible to obtain data on the corrosion product development in time. The progression of corrosion loss, changes in the thickness of the corrosion layer and the chemical composition of the corrosion products can be observed. An important finding resulting from the atmospheric corrosion tests is the fact that the development of corrosion products is significantly affected by the location of the evaluated surface within the structure [
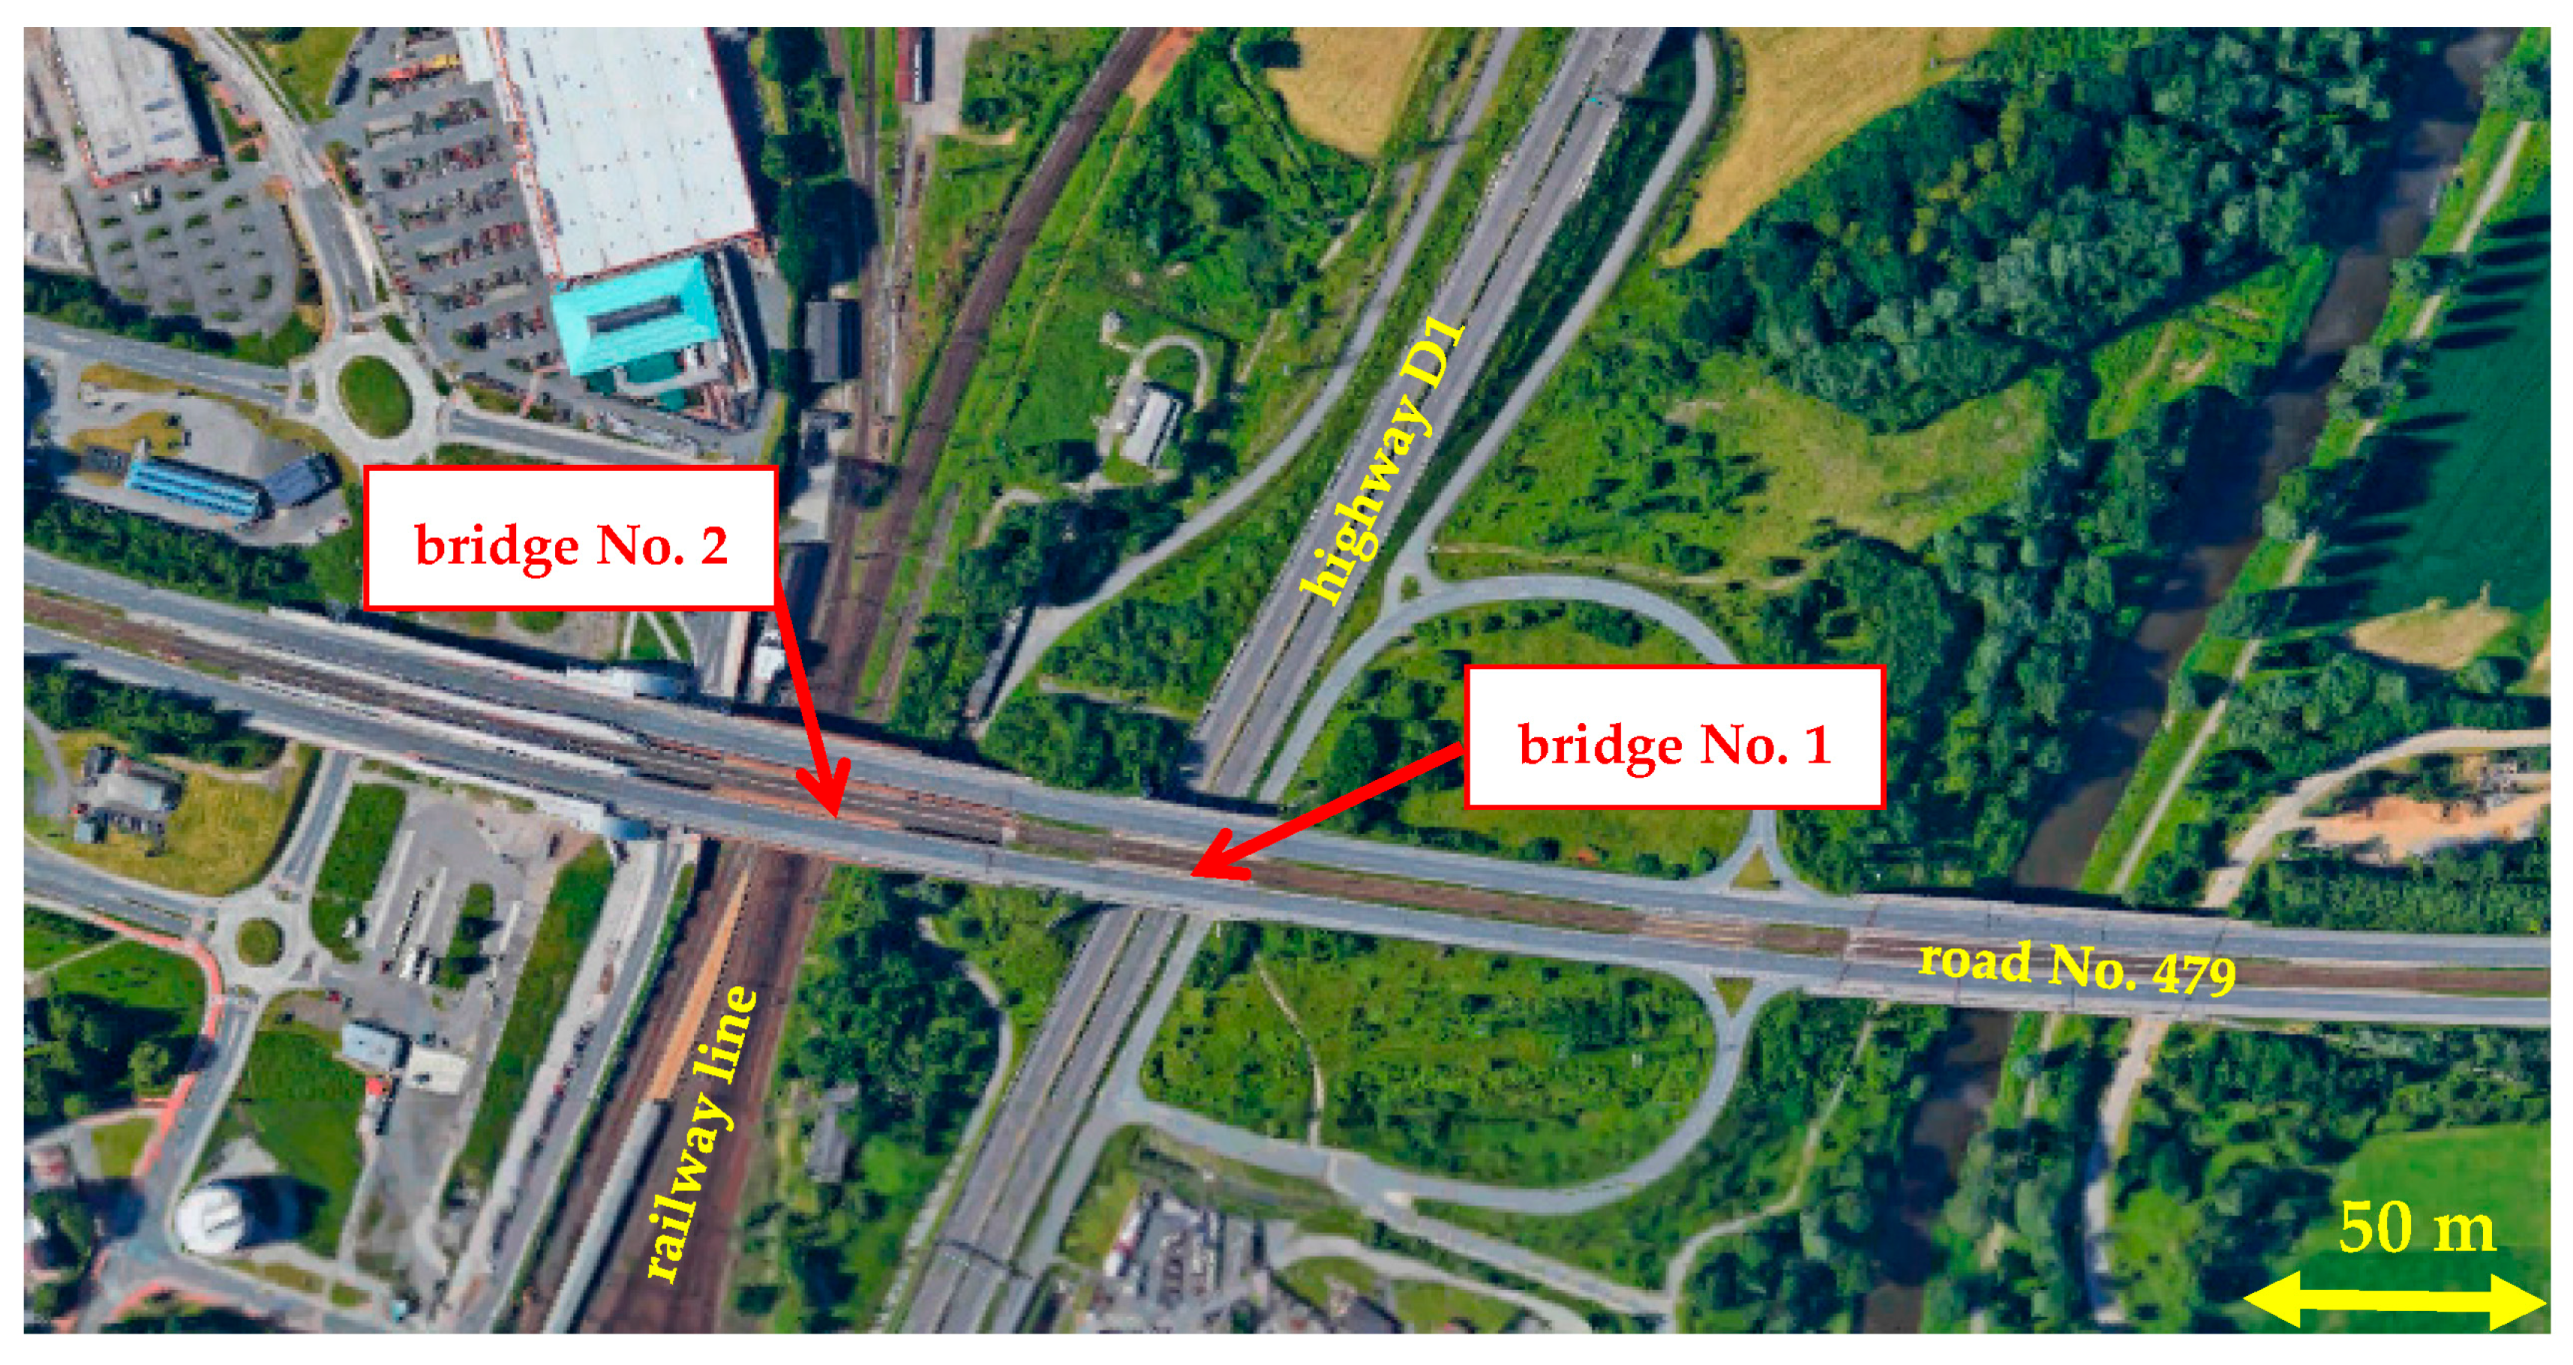
21]. For example, on bridge No. 1, corrosion losses after one year of exposure to the bottom external surface of the flanges are approximately four times higher compared to the bottom surface of the upper flanges:
Bridge No. 1, surface P4, 1 year exposure: rcorr = 8.5 μm·year−1;
Bridge No. 1, surface P5, 1 year exposure: rcorr = 35.2 μm·year−1.
The composition analysis of corrosion products can be used to identify the decisive stimulators of corrosion. The increased deposition of road salt results in a higher mass ratio of chlorine (Cl) in the corrosion products. Higher ratios of silicon (Si) and aluminium (Al) in corrosion products indicate increased deposition of dust. There is not yet enough statistical data to estimate the permissible limit values for chlorine concentrations in the corrosion product layer. The results obtained from bridge No. 1 indicate that during the development of corrosion layer on a surface suffering from the deposition of chlorides, the concentration of chloride in the corrosion products is gradually increasing:
Bridge No. 1, surface P1, 1 year exposure: wt. % Cl = 0.311 (see
Table 5);
Bridge No. 1, surface P1, 14 years exposure: wt. % Cl = 1.297 (see
Table 3).
The increased chloride deposition rate also reflected in the phase composition of corrosion products determined by X-ray diffraction analysis, see
Table 4. Corrosion products developed in combination with an increased deposition of chlorides also show high ratios of akaganeite. A greater presence of akaganeite was reflected in the values of the protective ability indexes
PAIα and
PAIβ. The literature states [
17,
18] that a fully protective corrosion layer with a corrosion rate
rcorr < 10 μm·year
−1 correspond to
PAIα > 1. If the
PAIα ratio < 1, calculation of the
PAIβ is necessary to determine another factor of the layer’s protective ability (
PAIβ < 0.5—a corrosion product layer without protective ability; or
PAIβ > 0.5—partially protective corrosion layer). Interpreting the detected values of PA Indexes is still rather complicated. As an example, it can be compared the values of the corrosion product layer average thickness
tcorr measured on the surface of the structure, the initial
rcorr corrosion rates and the
PAIα indexes of the corrosion layer on surfaces P1, P3, P5, and P6; see
Table 6. The highest
PAIα value of corrosion layer protective ability was identified on surface P5, but that surface also shows the highest initial corrosion rate
rcorr and a high value of average corrosion thickness
tcorr. The results indicate that there may be no positive correlation between corrosion loss and the patina protective ability index.
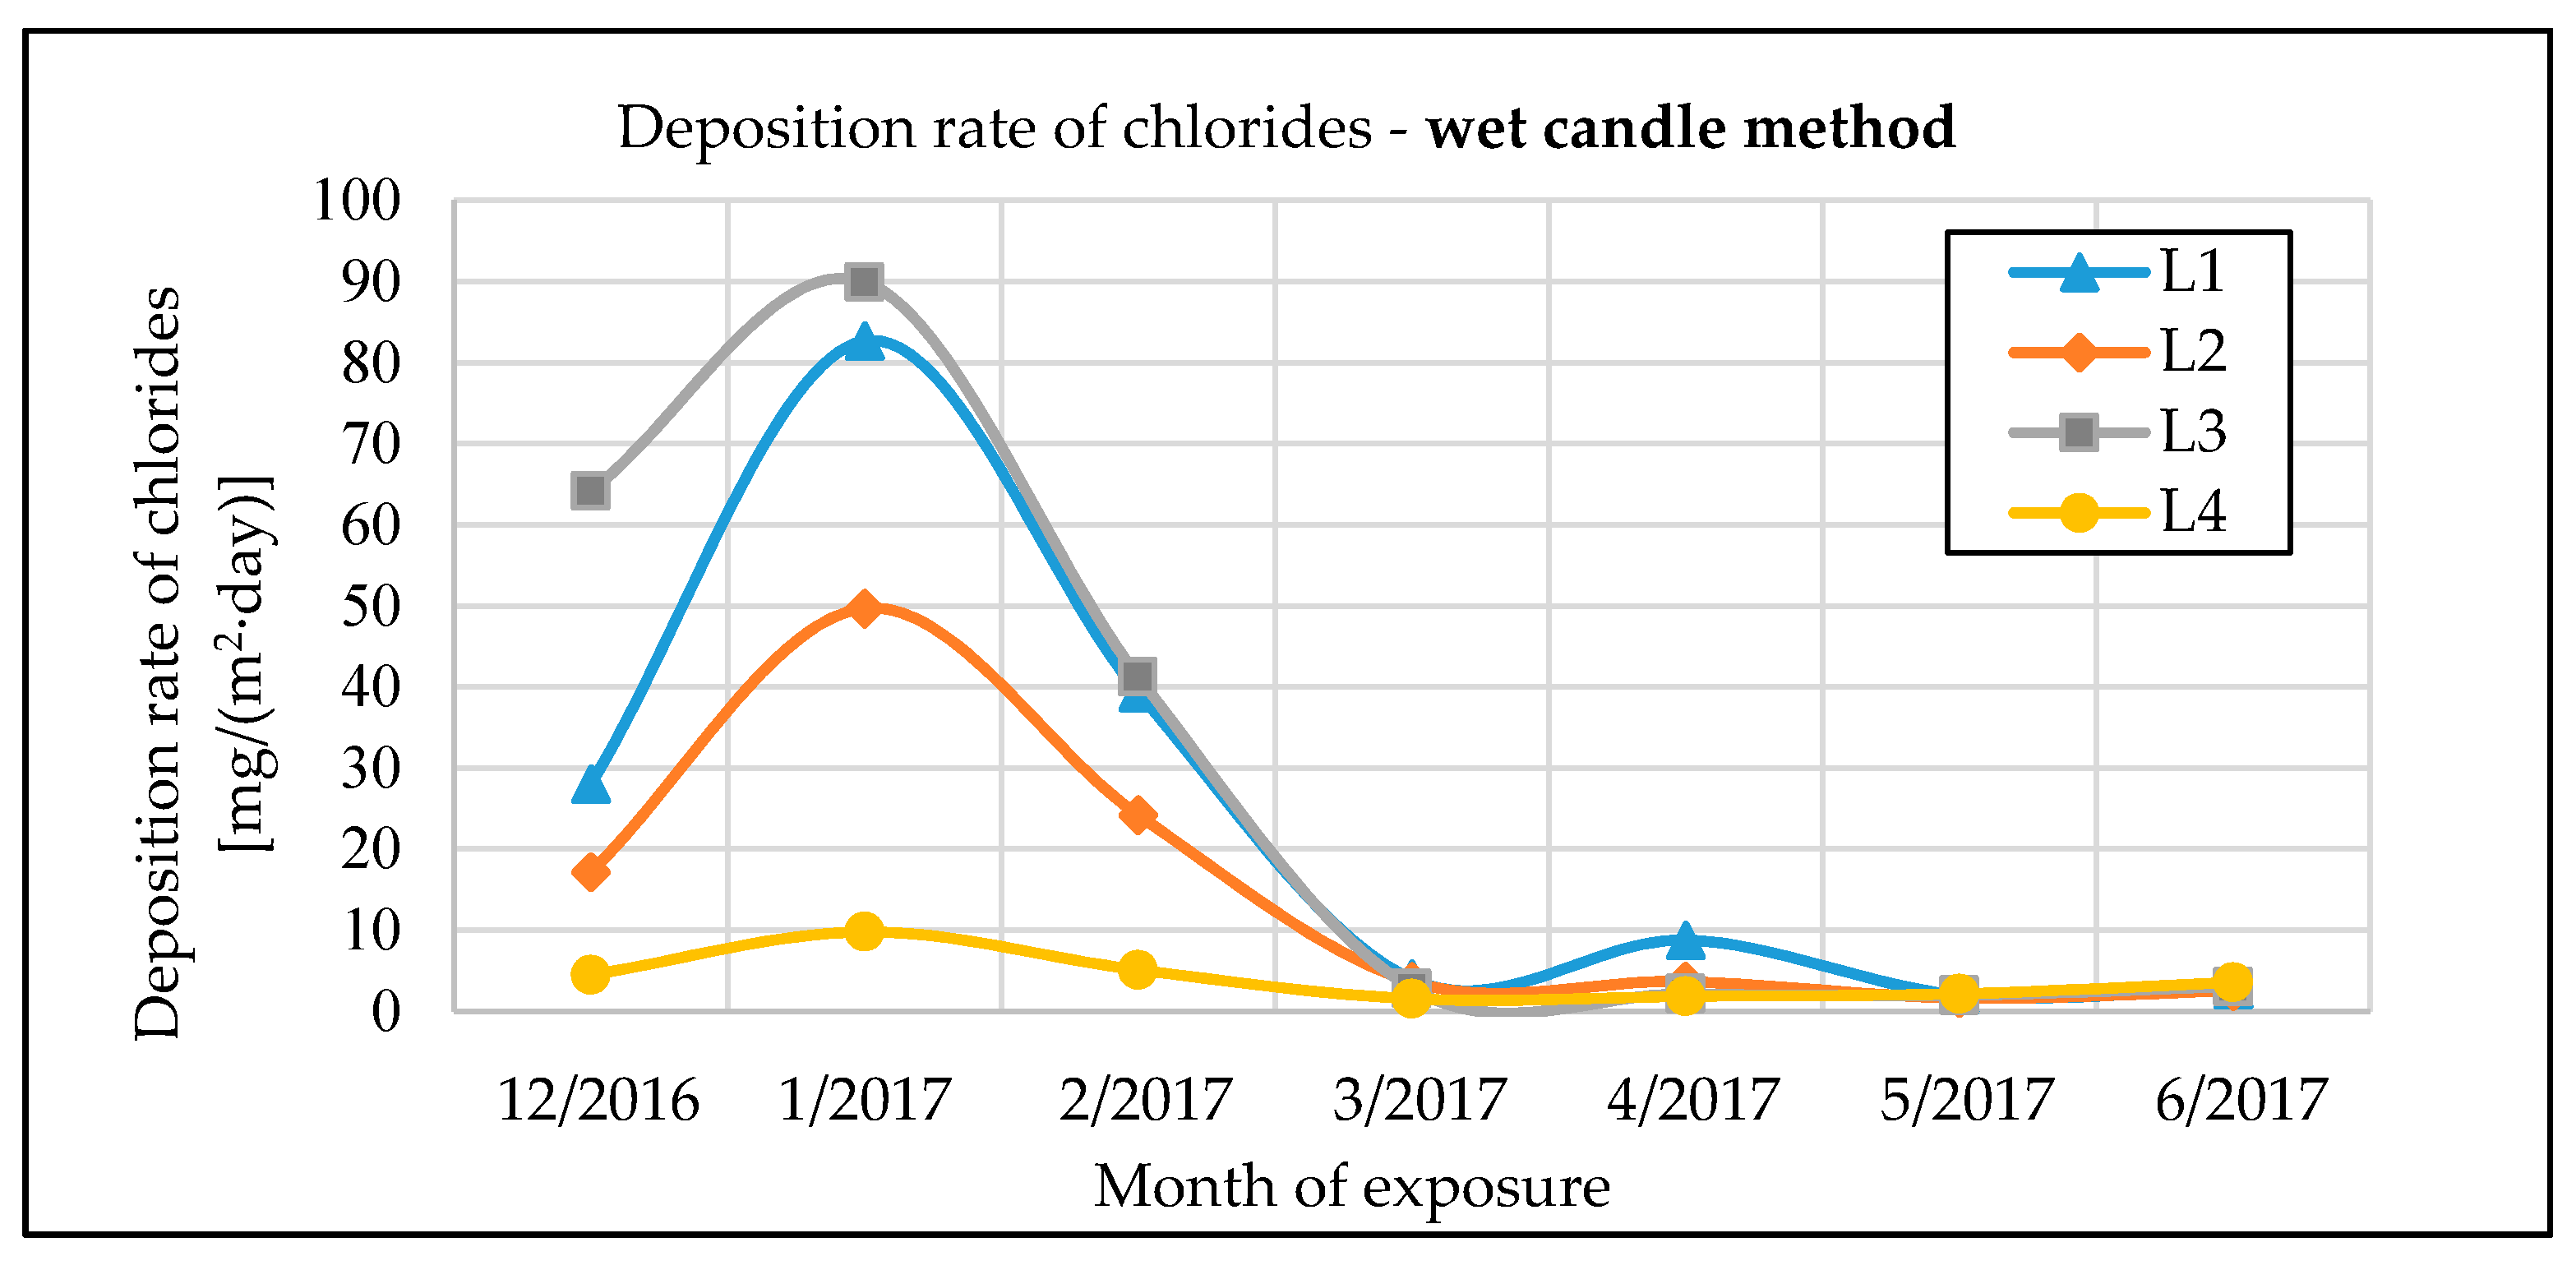
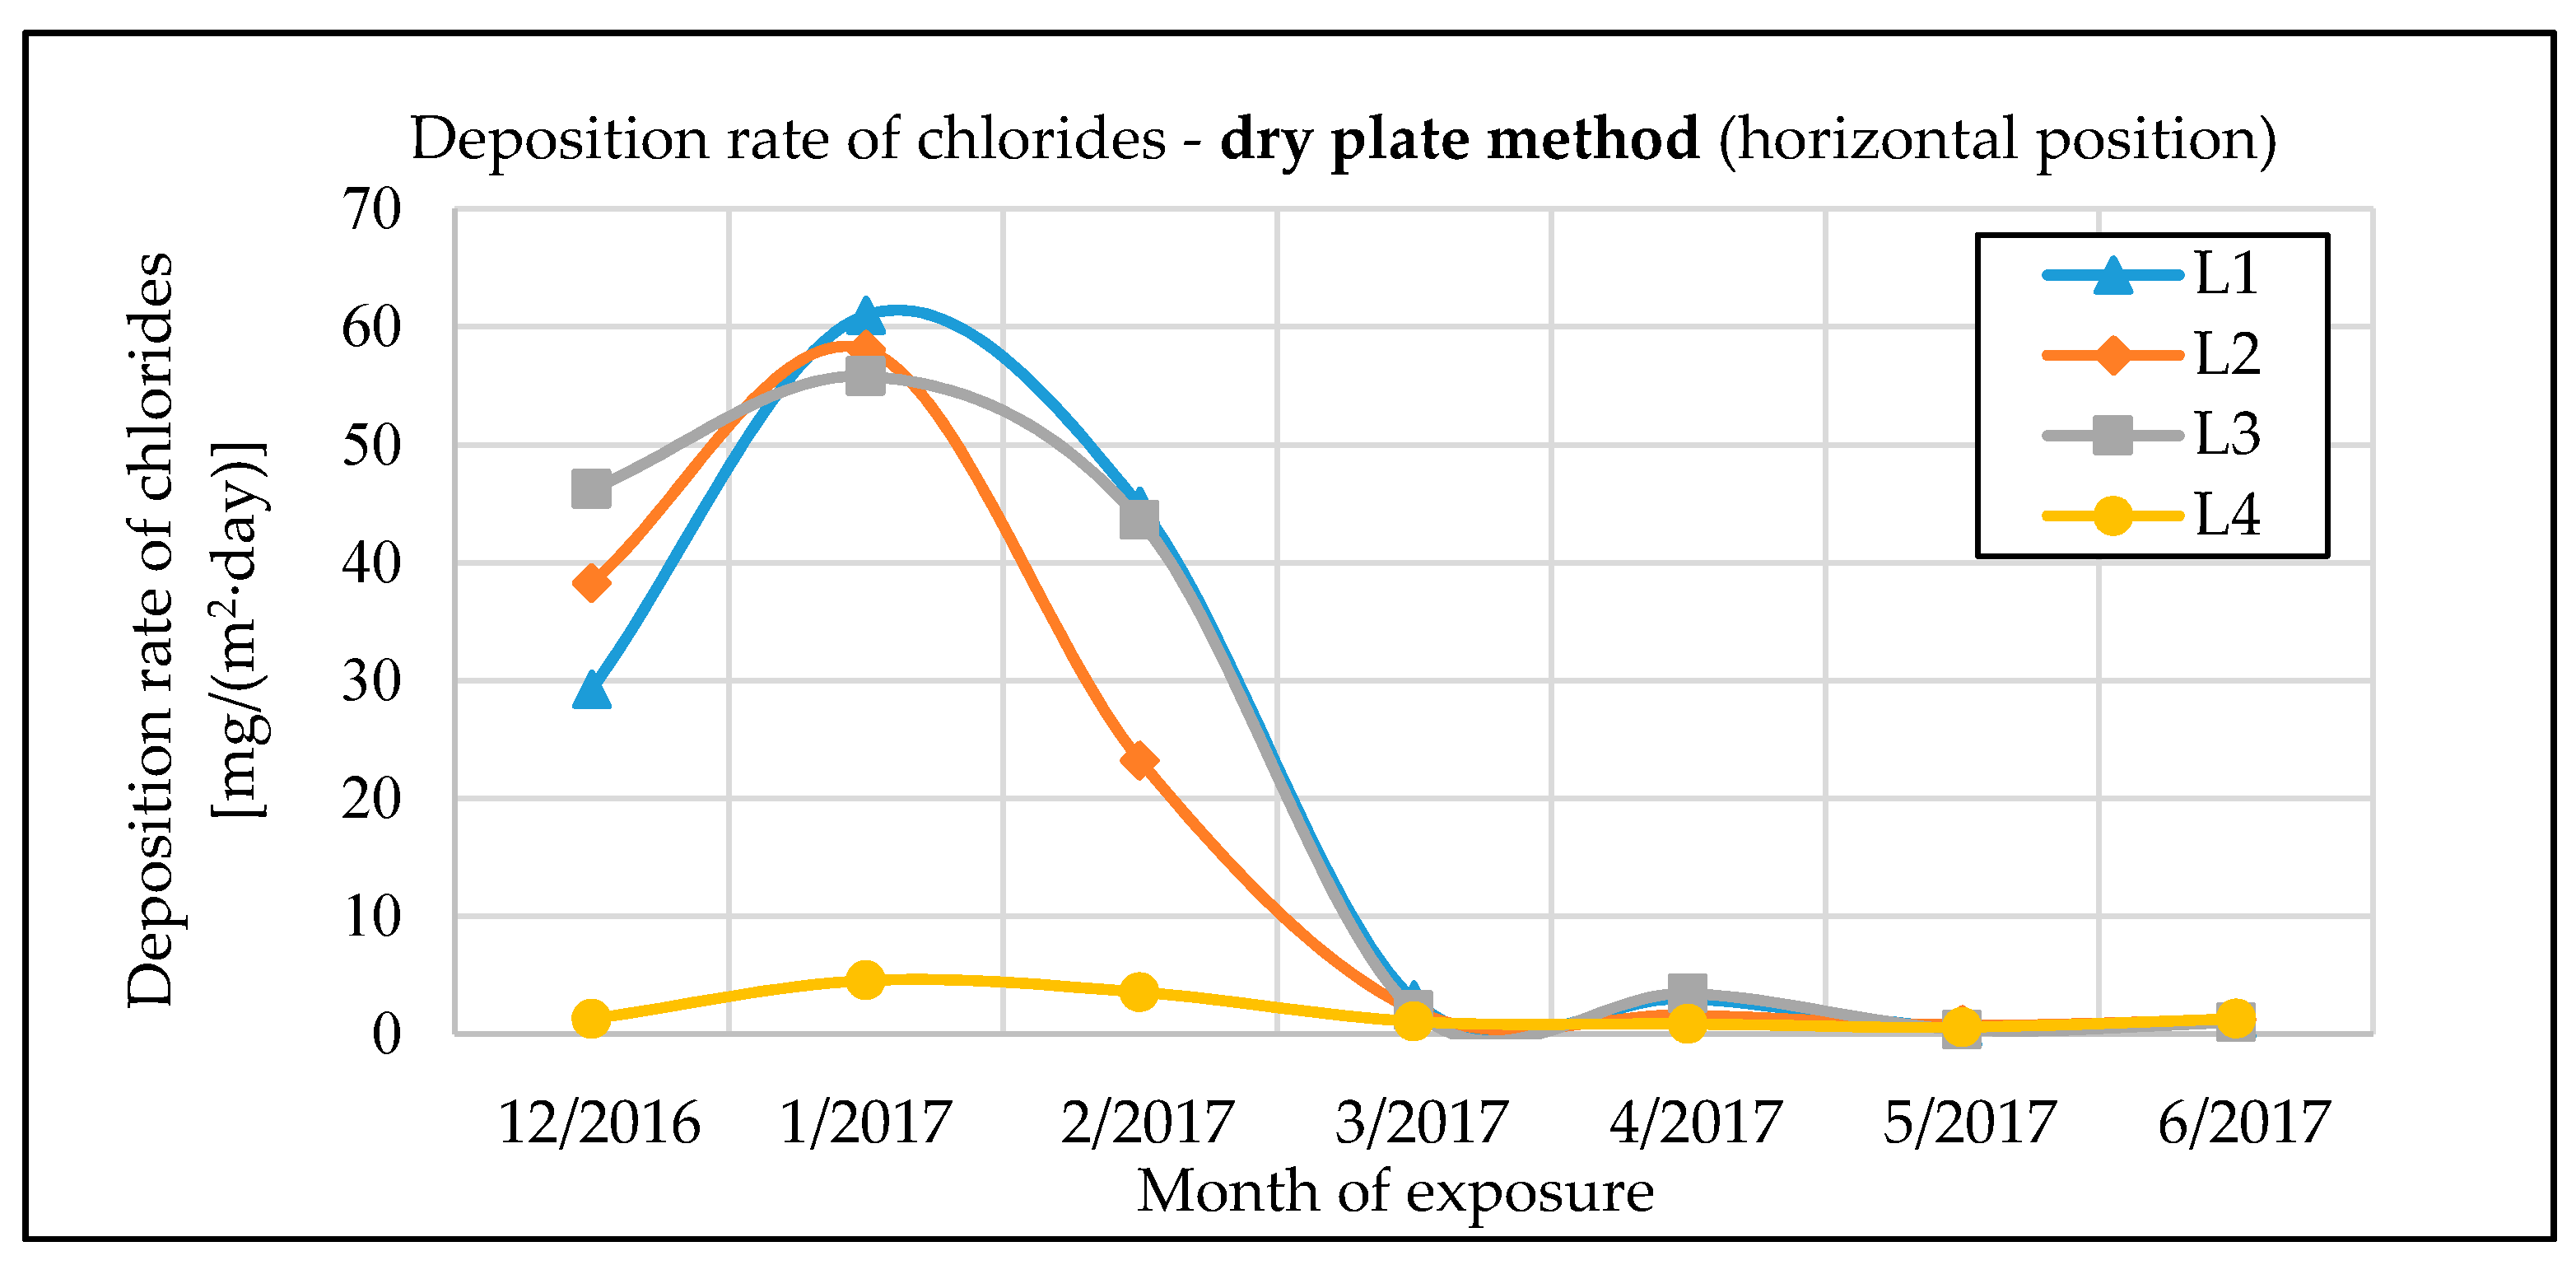
The monitoring of chloride deposition rate explicitly showed the potential negative effects of microclimatic conditions under the bridge structure. Winter road maintenance using de-icing salts combined with intense road traffic under the bridge structure are a significant source of chloride and dust deposition on the bridge’s load-bearing elements. The maximum measured value of chloride deposition rate on bridge No. 1 was almost 90 mg·m−2·day−1. The effect can be largely intensified by an inappropriate design of the bridge, creating tunnel-like conditions. Measurements of chloride deposition rates also showed that with a proper bridge design, there are very low amounts of chloride deposits from road traffic on the bridge, compared to the potential effects of traffic going on under the same bridge. The maximum measured value of chloride deposition rate on bridge No. 2, which is not affected by road traffic underneath, was only 10 mg·m−2·day−1.
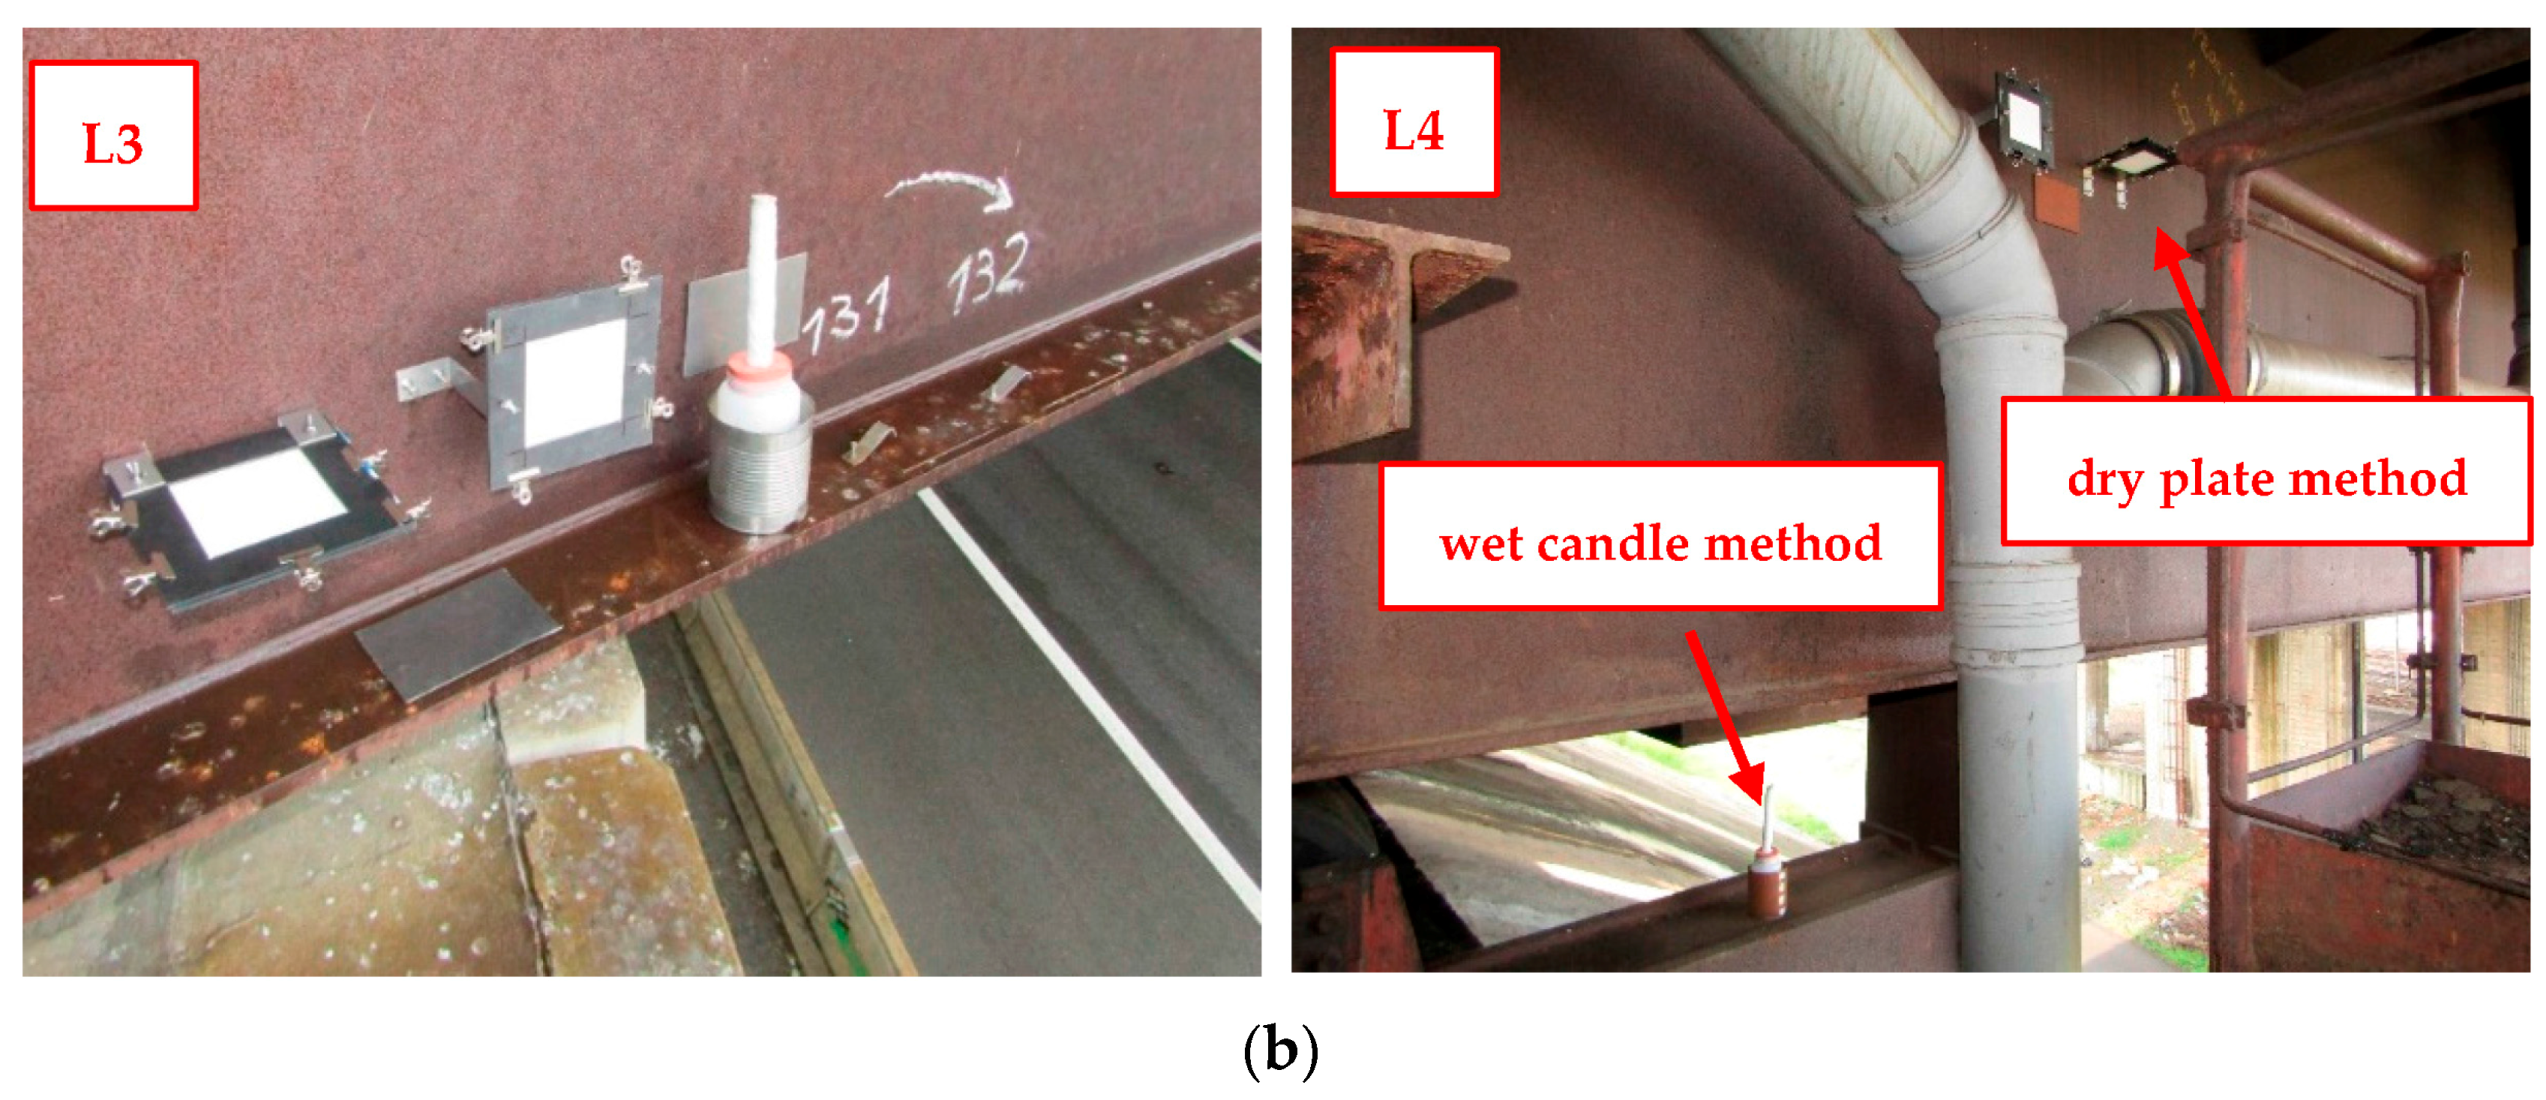
The chloride deposition rates are measured using the wet candle and the dry plate methods in compliance with the EN ISO 9225 standard [
19]. The standard sets the relationship between chloride deposition rates measured by wet candle
Sd,c and on the dry plate
Sd,p (the dry plate is assumed to be in a vertical position):
The results of the measurements differ slightly from the assumption in the standard. The average value of the conversion factor for all measurements is m = 3.99; it is thus higher than the 2.4 value assumed by the standard. In addition, there was substantial variation among individual measurements: Coefficient of variation v = 0.29, minimum value min = 1.40, maximum value max = 6.06.


