Figure 1.
Weld configuration and sampling locations for mini-tensile specimens (C—cross, WM—weld metal).
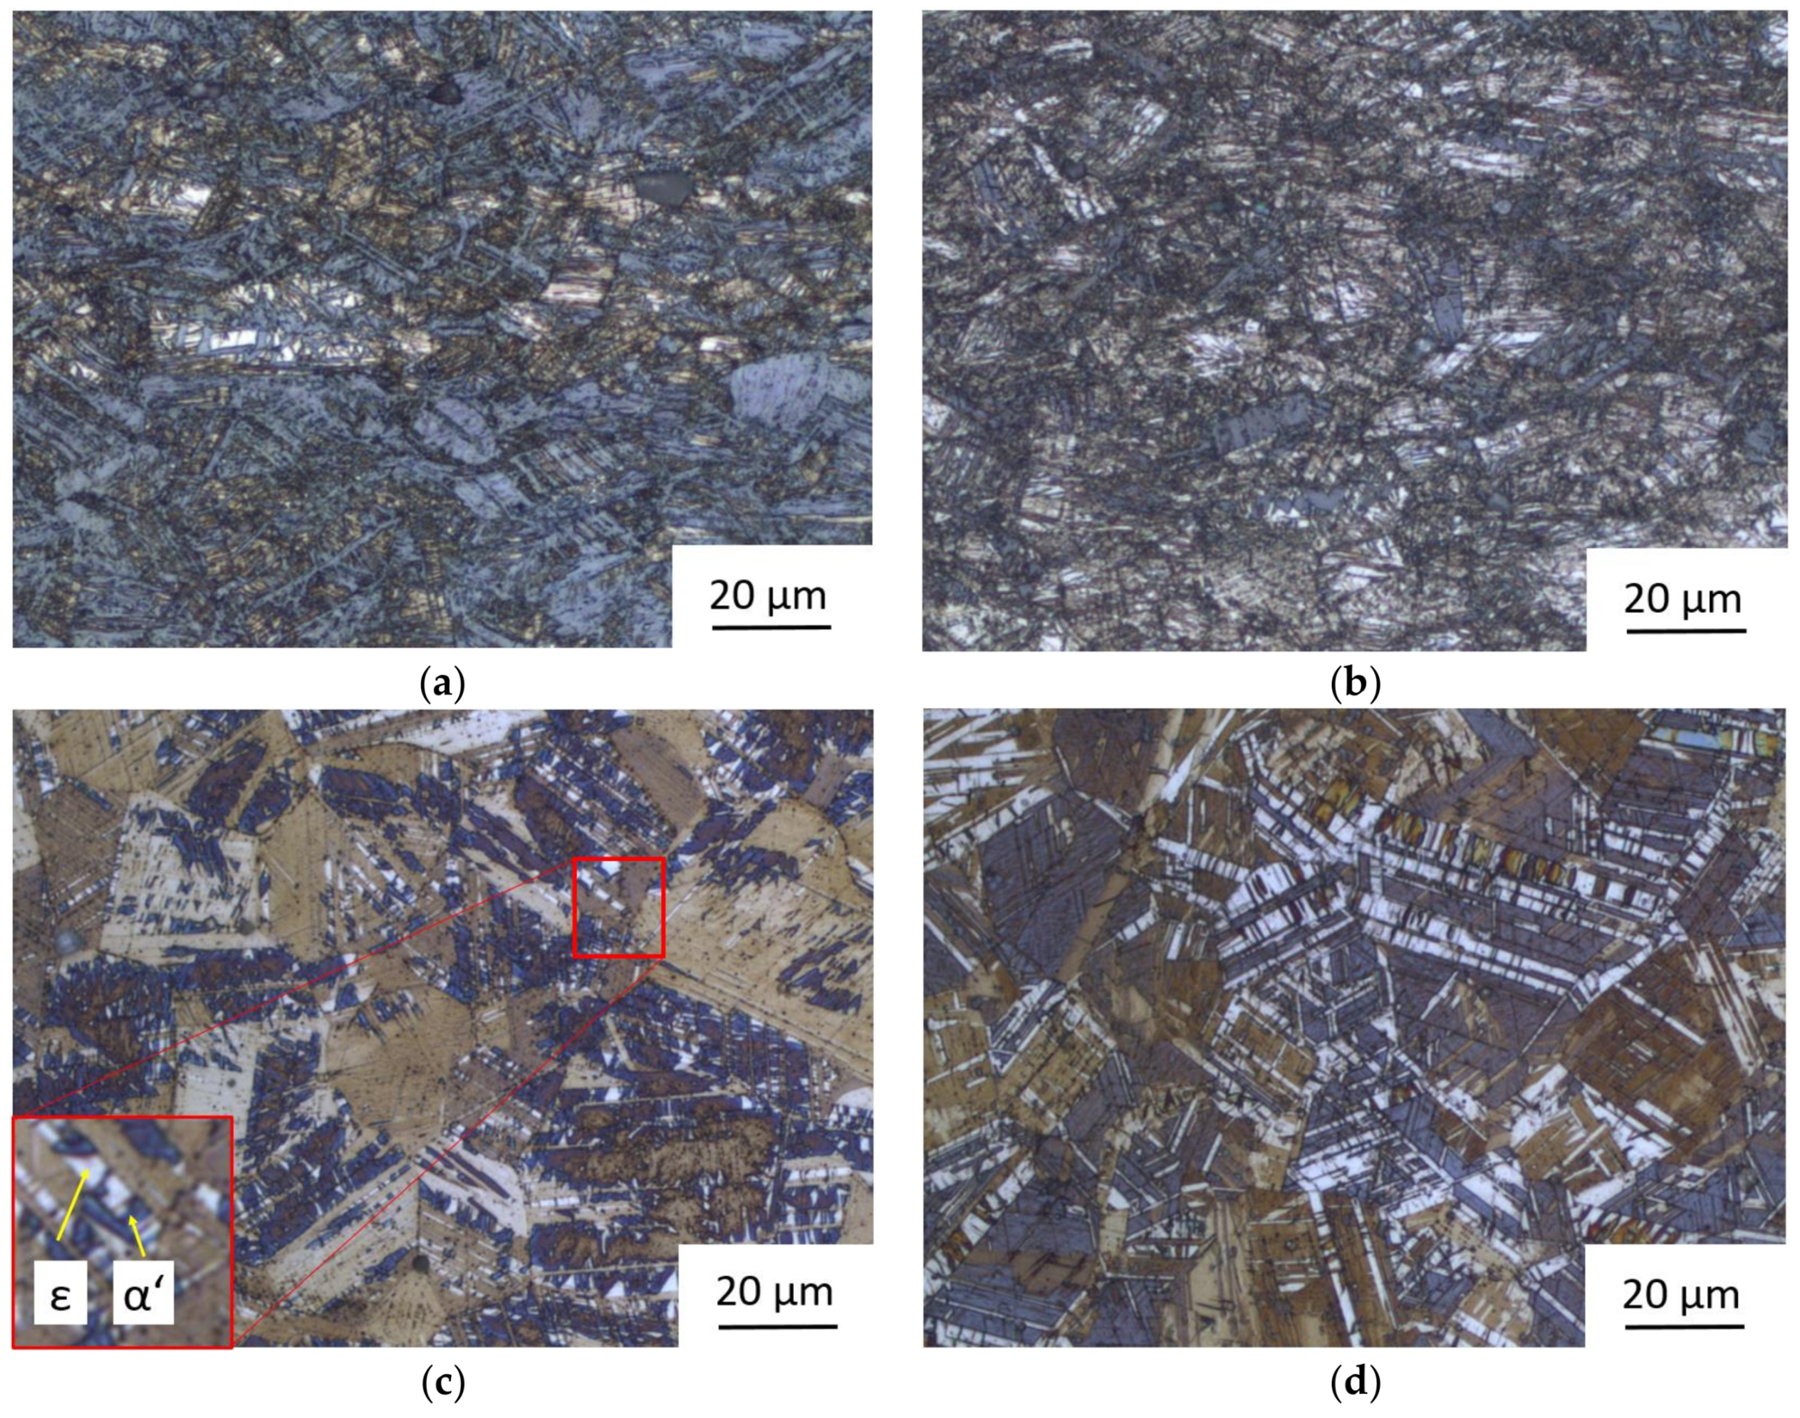
Figure 2.
Microstructures of cold rolled and annealed state of both TWIP (Twinning induced plasticity) sheets: (a) Cold rolled sheet T15-81; (b) Cold rolled sheet T15-82; (c) Sheet T15-81 with the lower volume fraction of ε-martensite; and, (d) Sheet T15-82 with the higher volume fraction of ε-martensite.
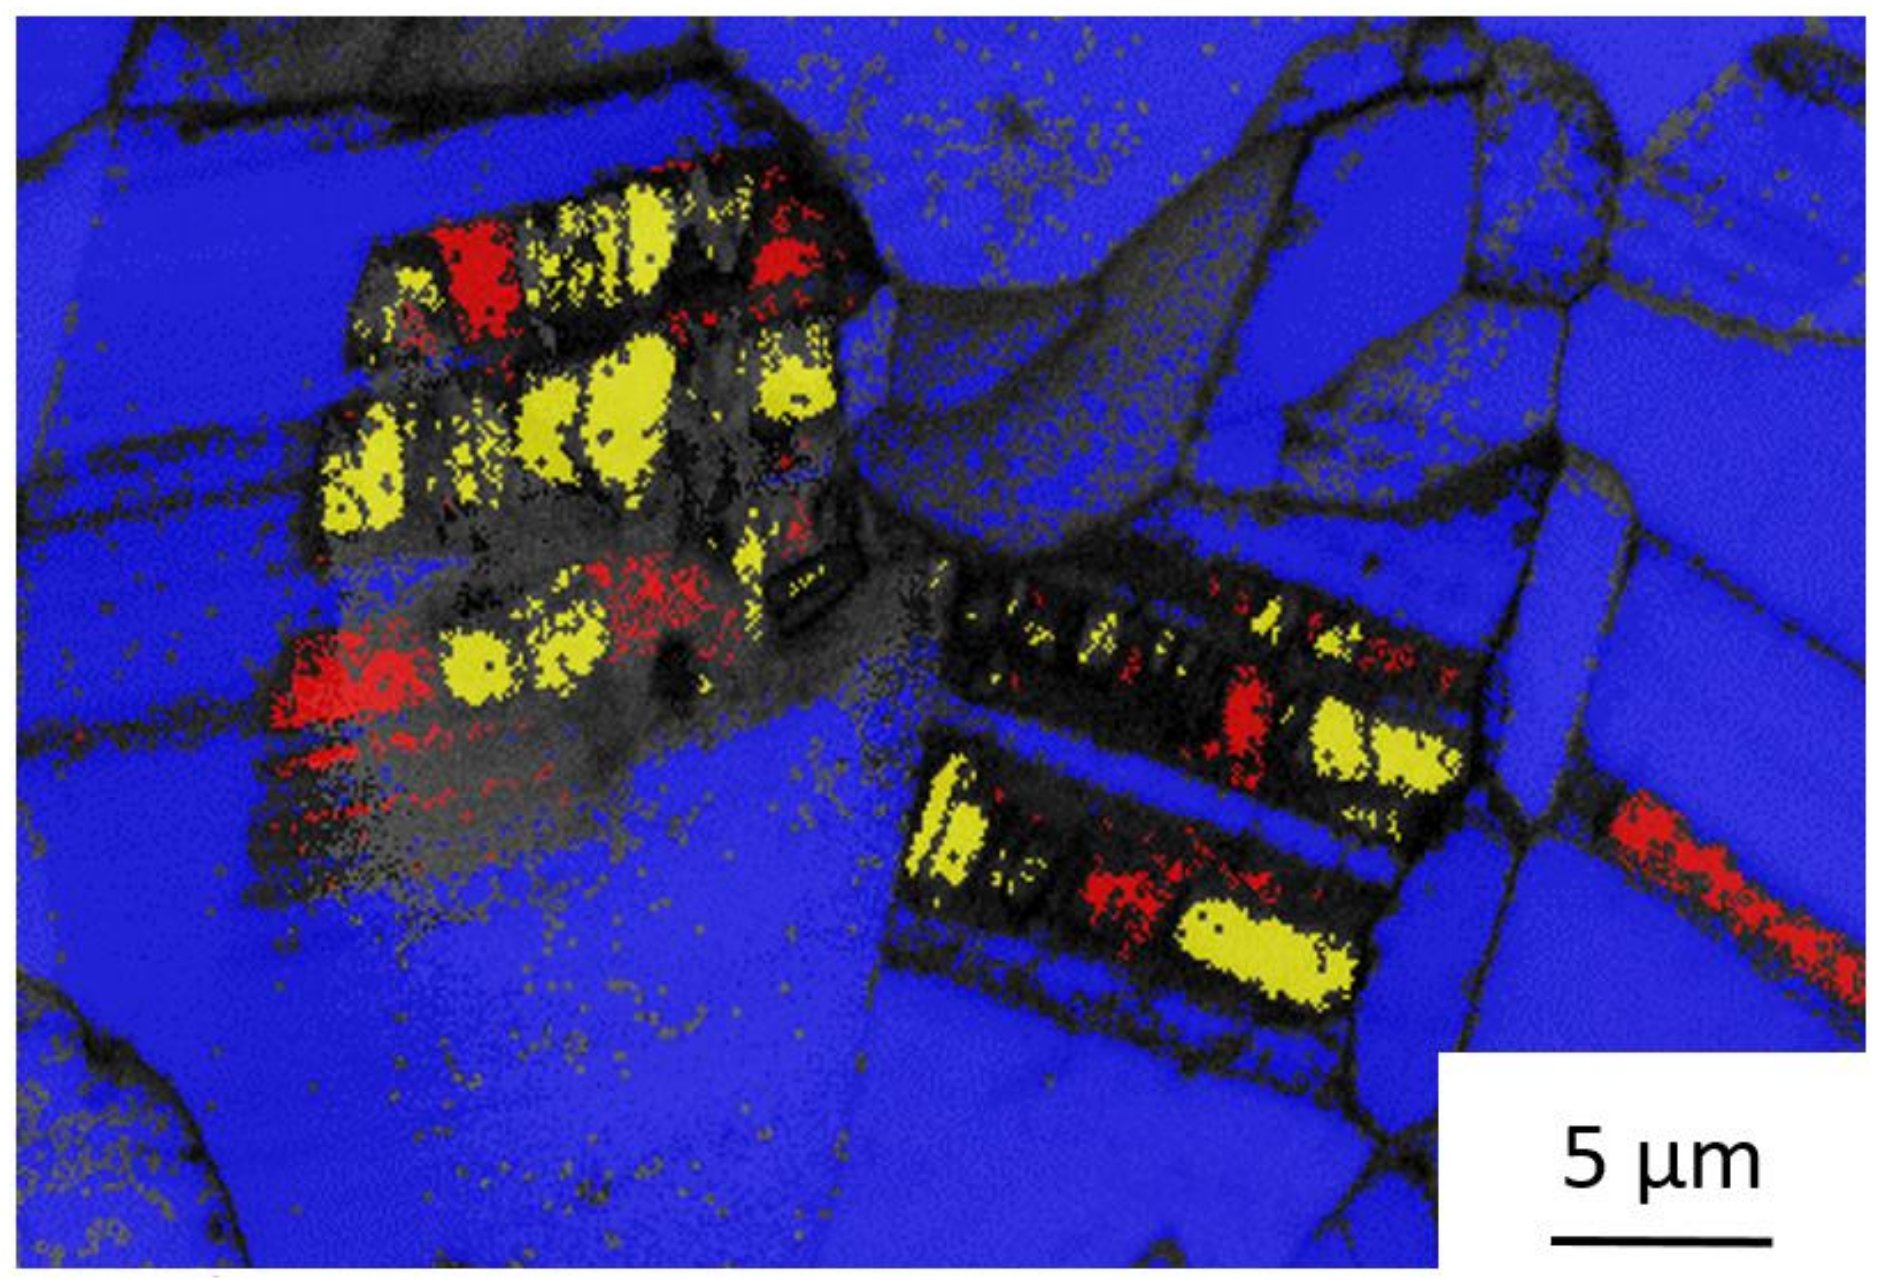
Figure 3.
Electron backscatter diffraction (EBSD) analysis—identification of phases in annealed sheet T15-81: (α′-martensite—yellow, ε-martensite—red; γ-austenite—blue).
Figure 4.
Engineering stress-strain curves of sheets in as cold rolled and annealed states: (a) T15-81; and, (b) T15-82.
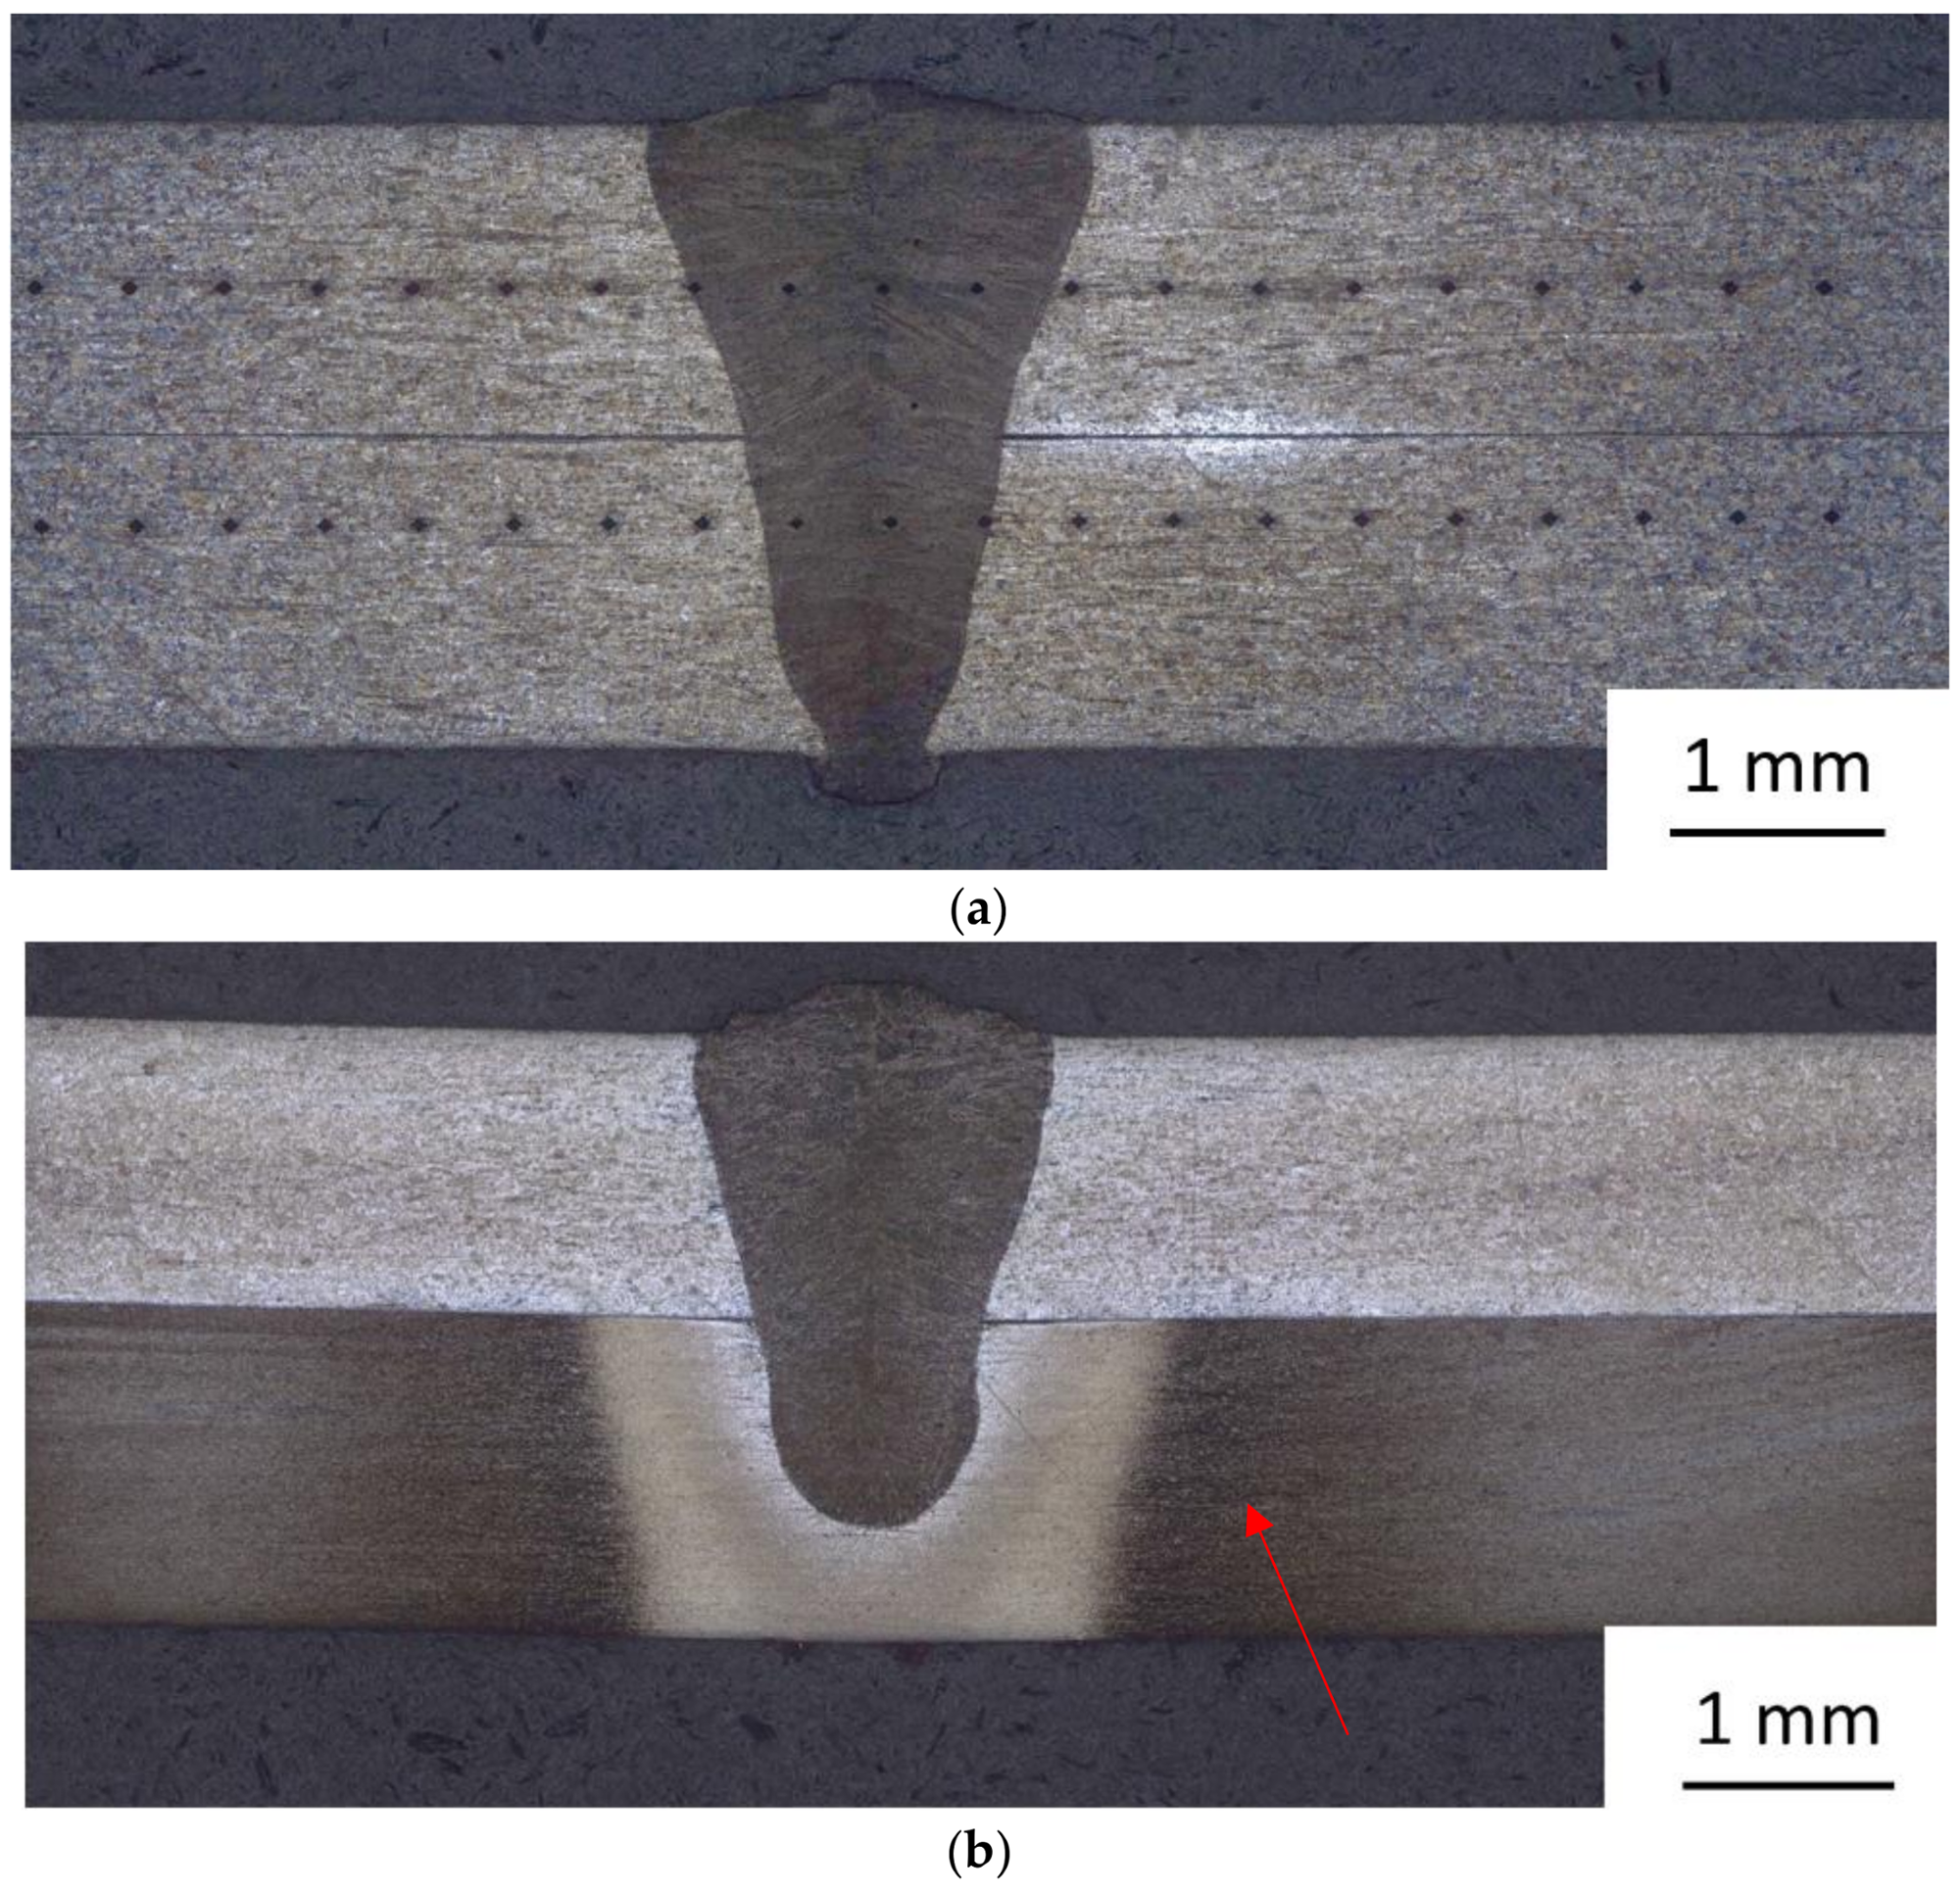
Figure 5.
Macrostructure of welds with different combinations of sheets and laser power: (a) T15-82a + T15-82a welded with 1920 W; and, (b) T15-82a + T15-82c welded with 1650 W with heat affected zone marked with arrow.
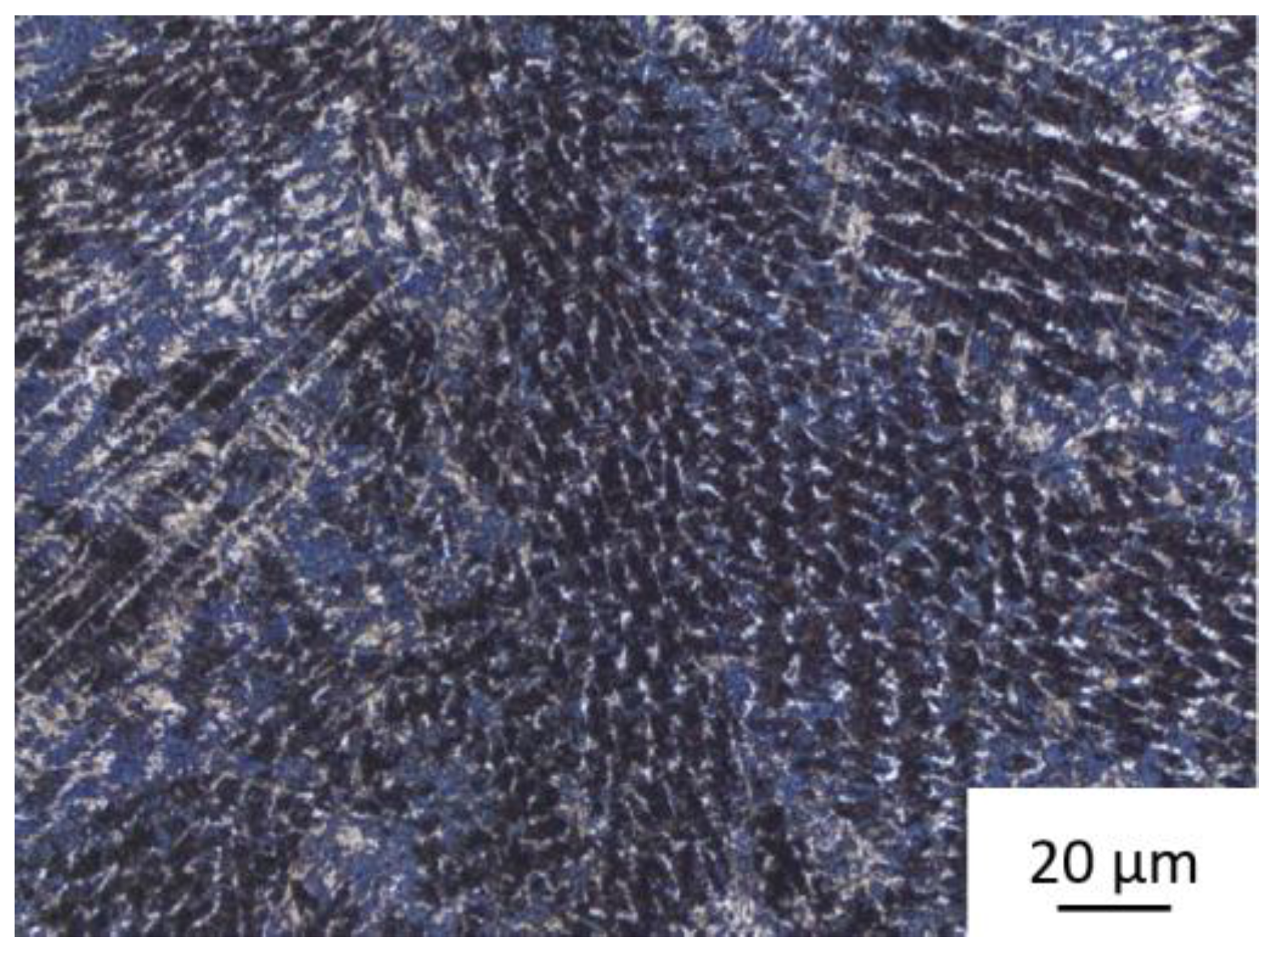
Figure 6.
Typical microstructure of the weld metal.
Figure 7.
The EBSD analyses (with same magnification for all figures) of weld metals welded with different powers: (a) analysed locality in the weld 2 (1950 W); (b) Phase map of the analysed locality in weld 2—α′-martensite—yellow, ε-martensite—red; γ-austenite—blue; (c) analysed locality in the weld 5 (1350 W); (d) Phase map of the analysed locality in weld 5—α′-martensite—yellow, ε-martensite—red; and, γ-austenite—blue.
Figure 8.
The fusion border between the weld metal and the heat-affected zone in the welded sheets: (a) T15-81c (cold-rolled condition); (b) T15-81a (annealed condition); (c) T15-82c (cold-rolled condition); and, (d) T15-82a (annealed condition).
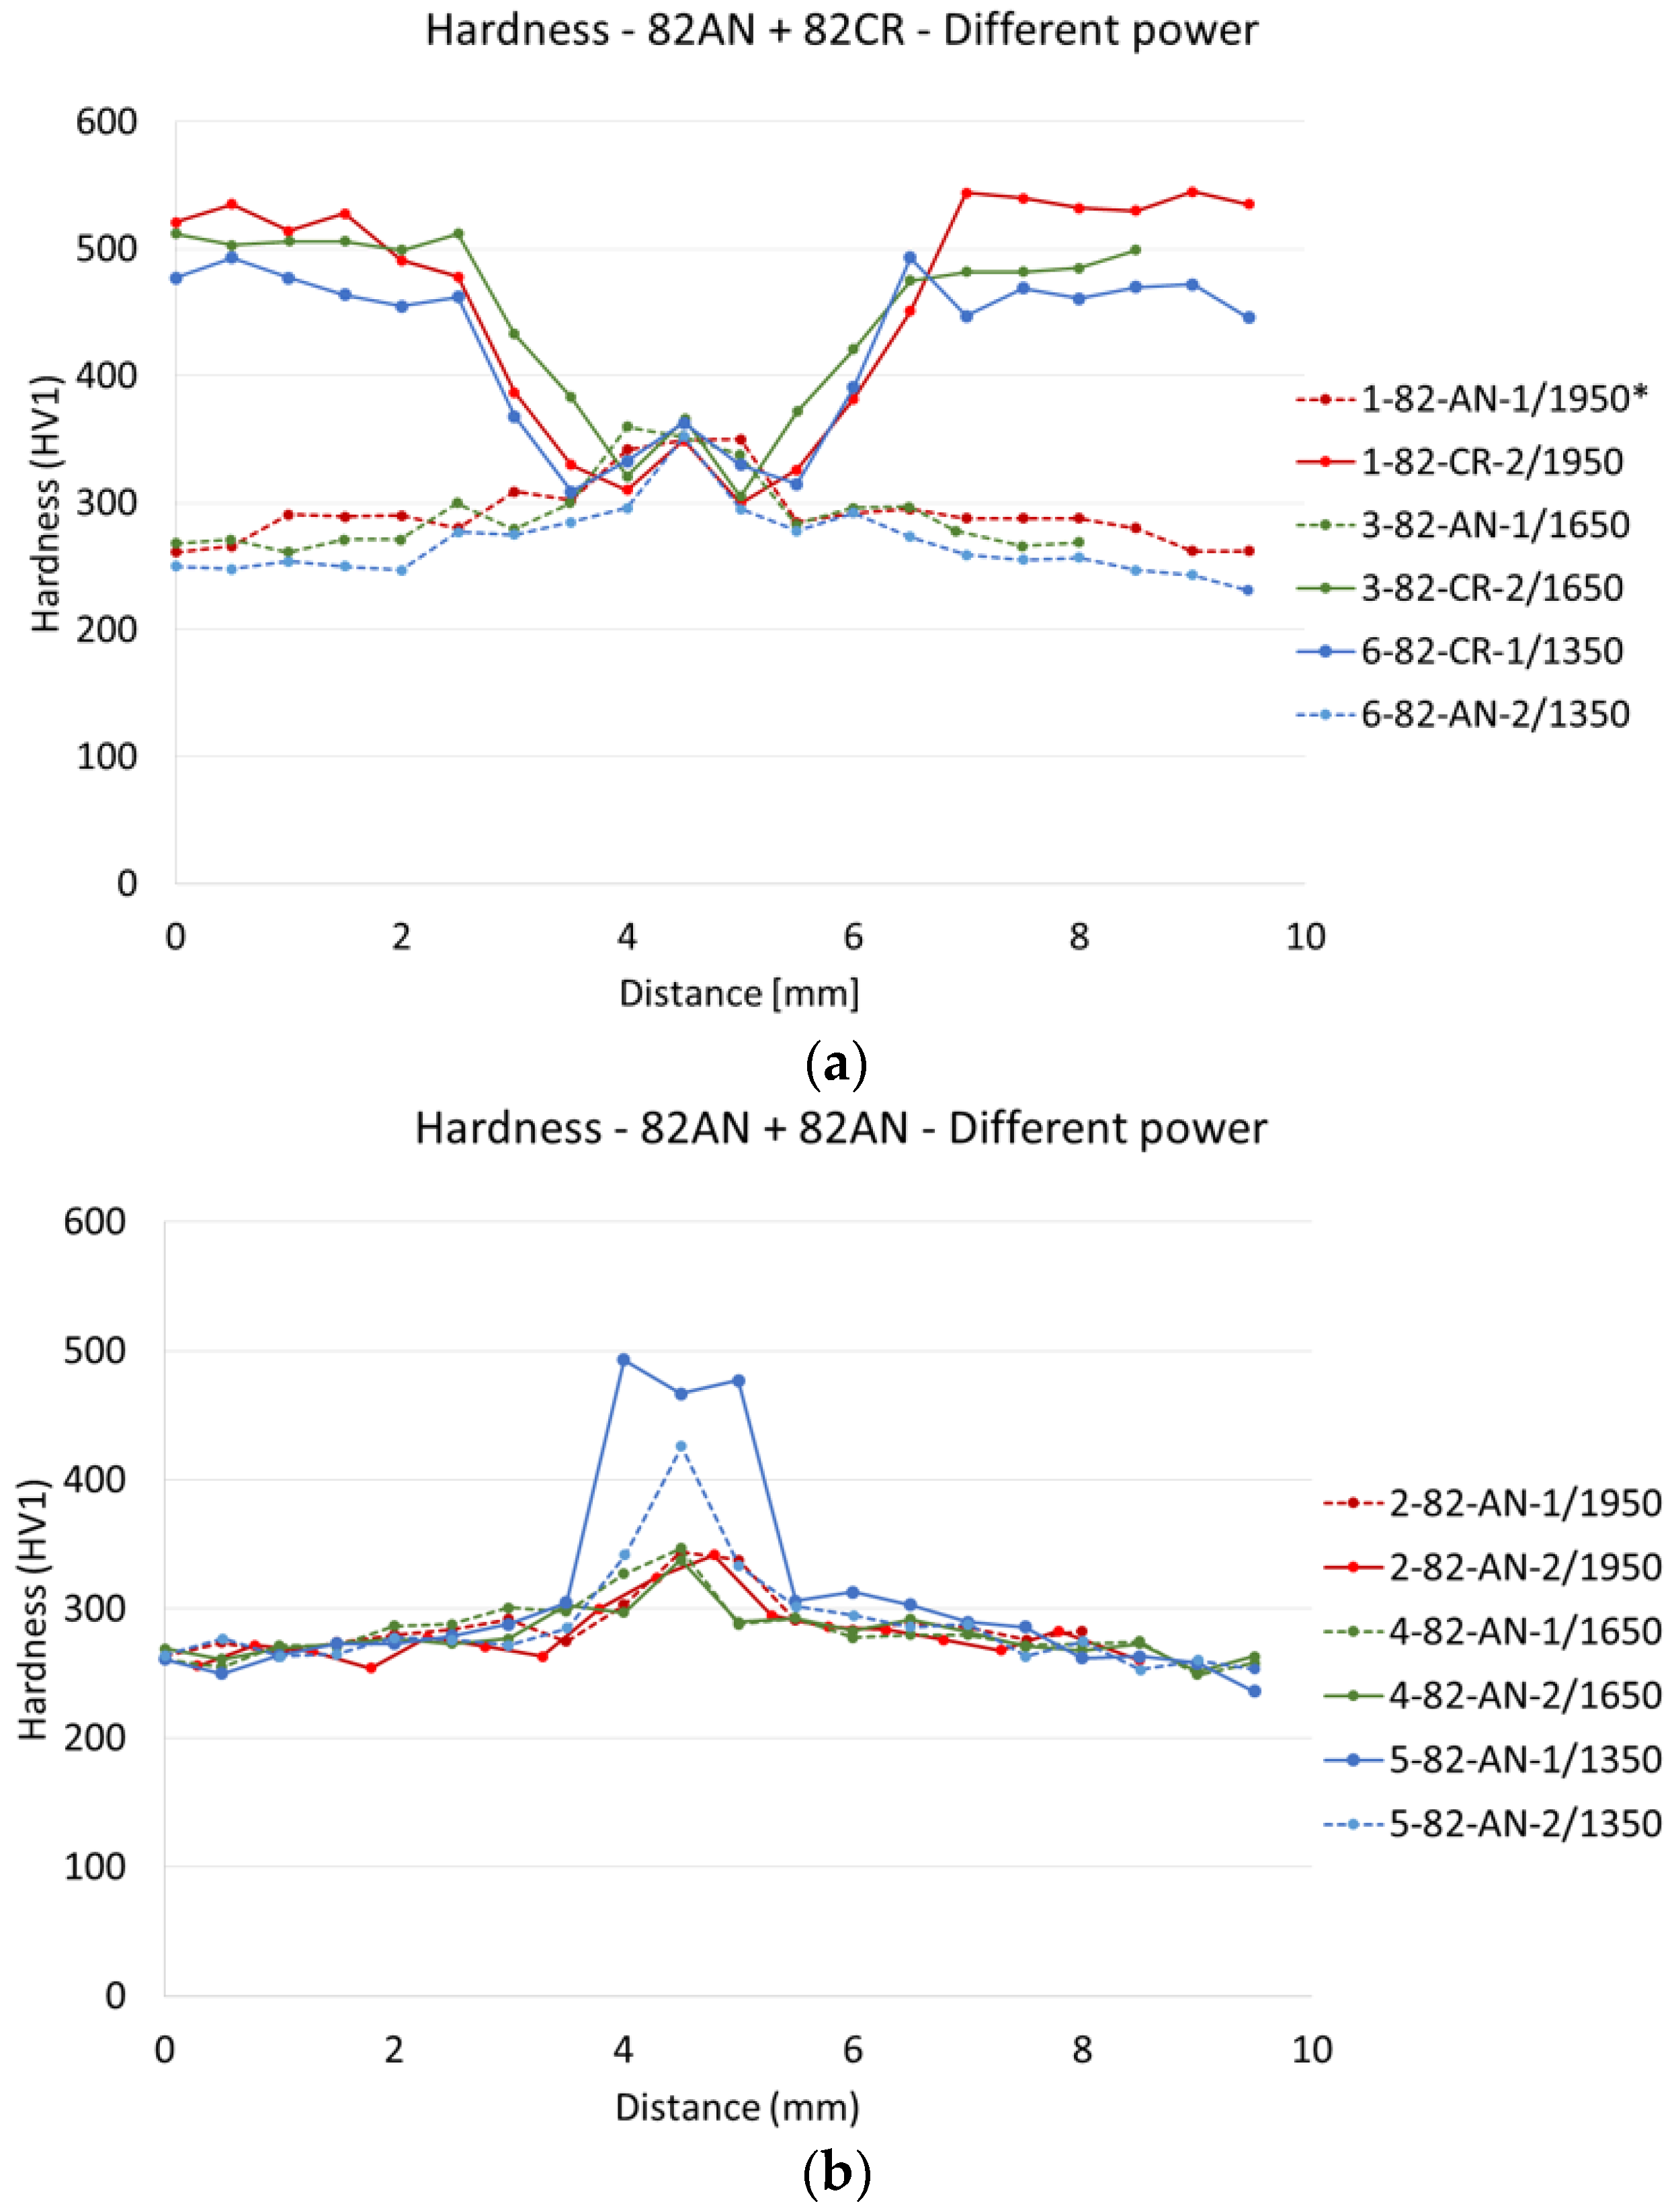
Figure 9.
Hardness of weld joints made with various laser power levels: (a) T15-82a + T15-82c; (b) T15-82a + T15-82a (*1-82-AN-1/1950 means: Sample ID 1, sheet T15-82, annealed, 1—upper sheet, power 1950 W).
Figure 10.
Hardness of weld joints vs. the use of shielding gas: (a) Joints made by gas-shielded welding; and, (b) Weld joints made without shielding gas.
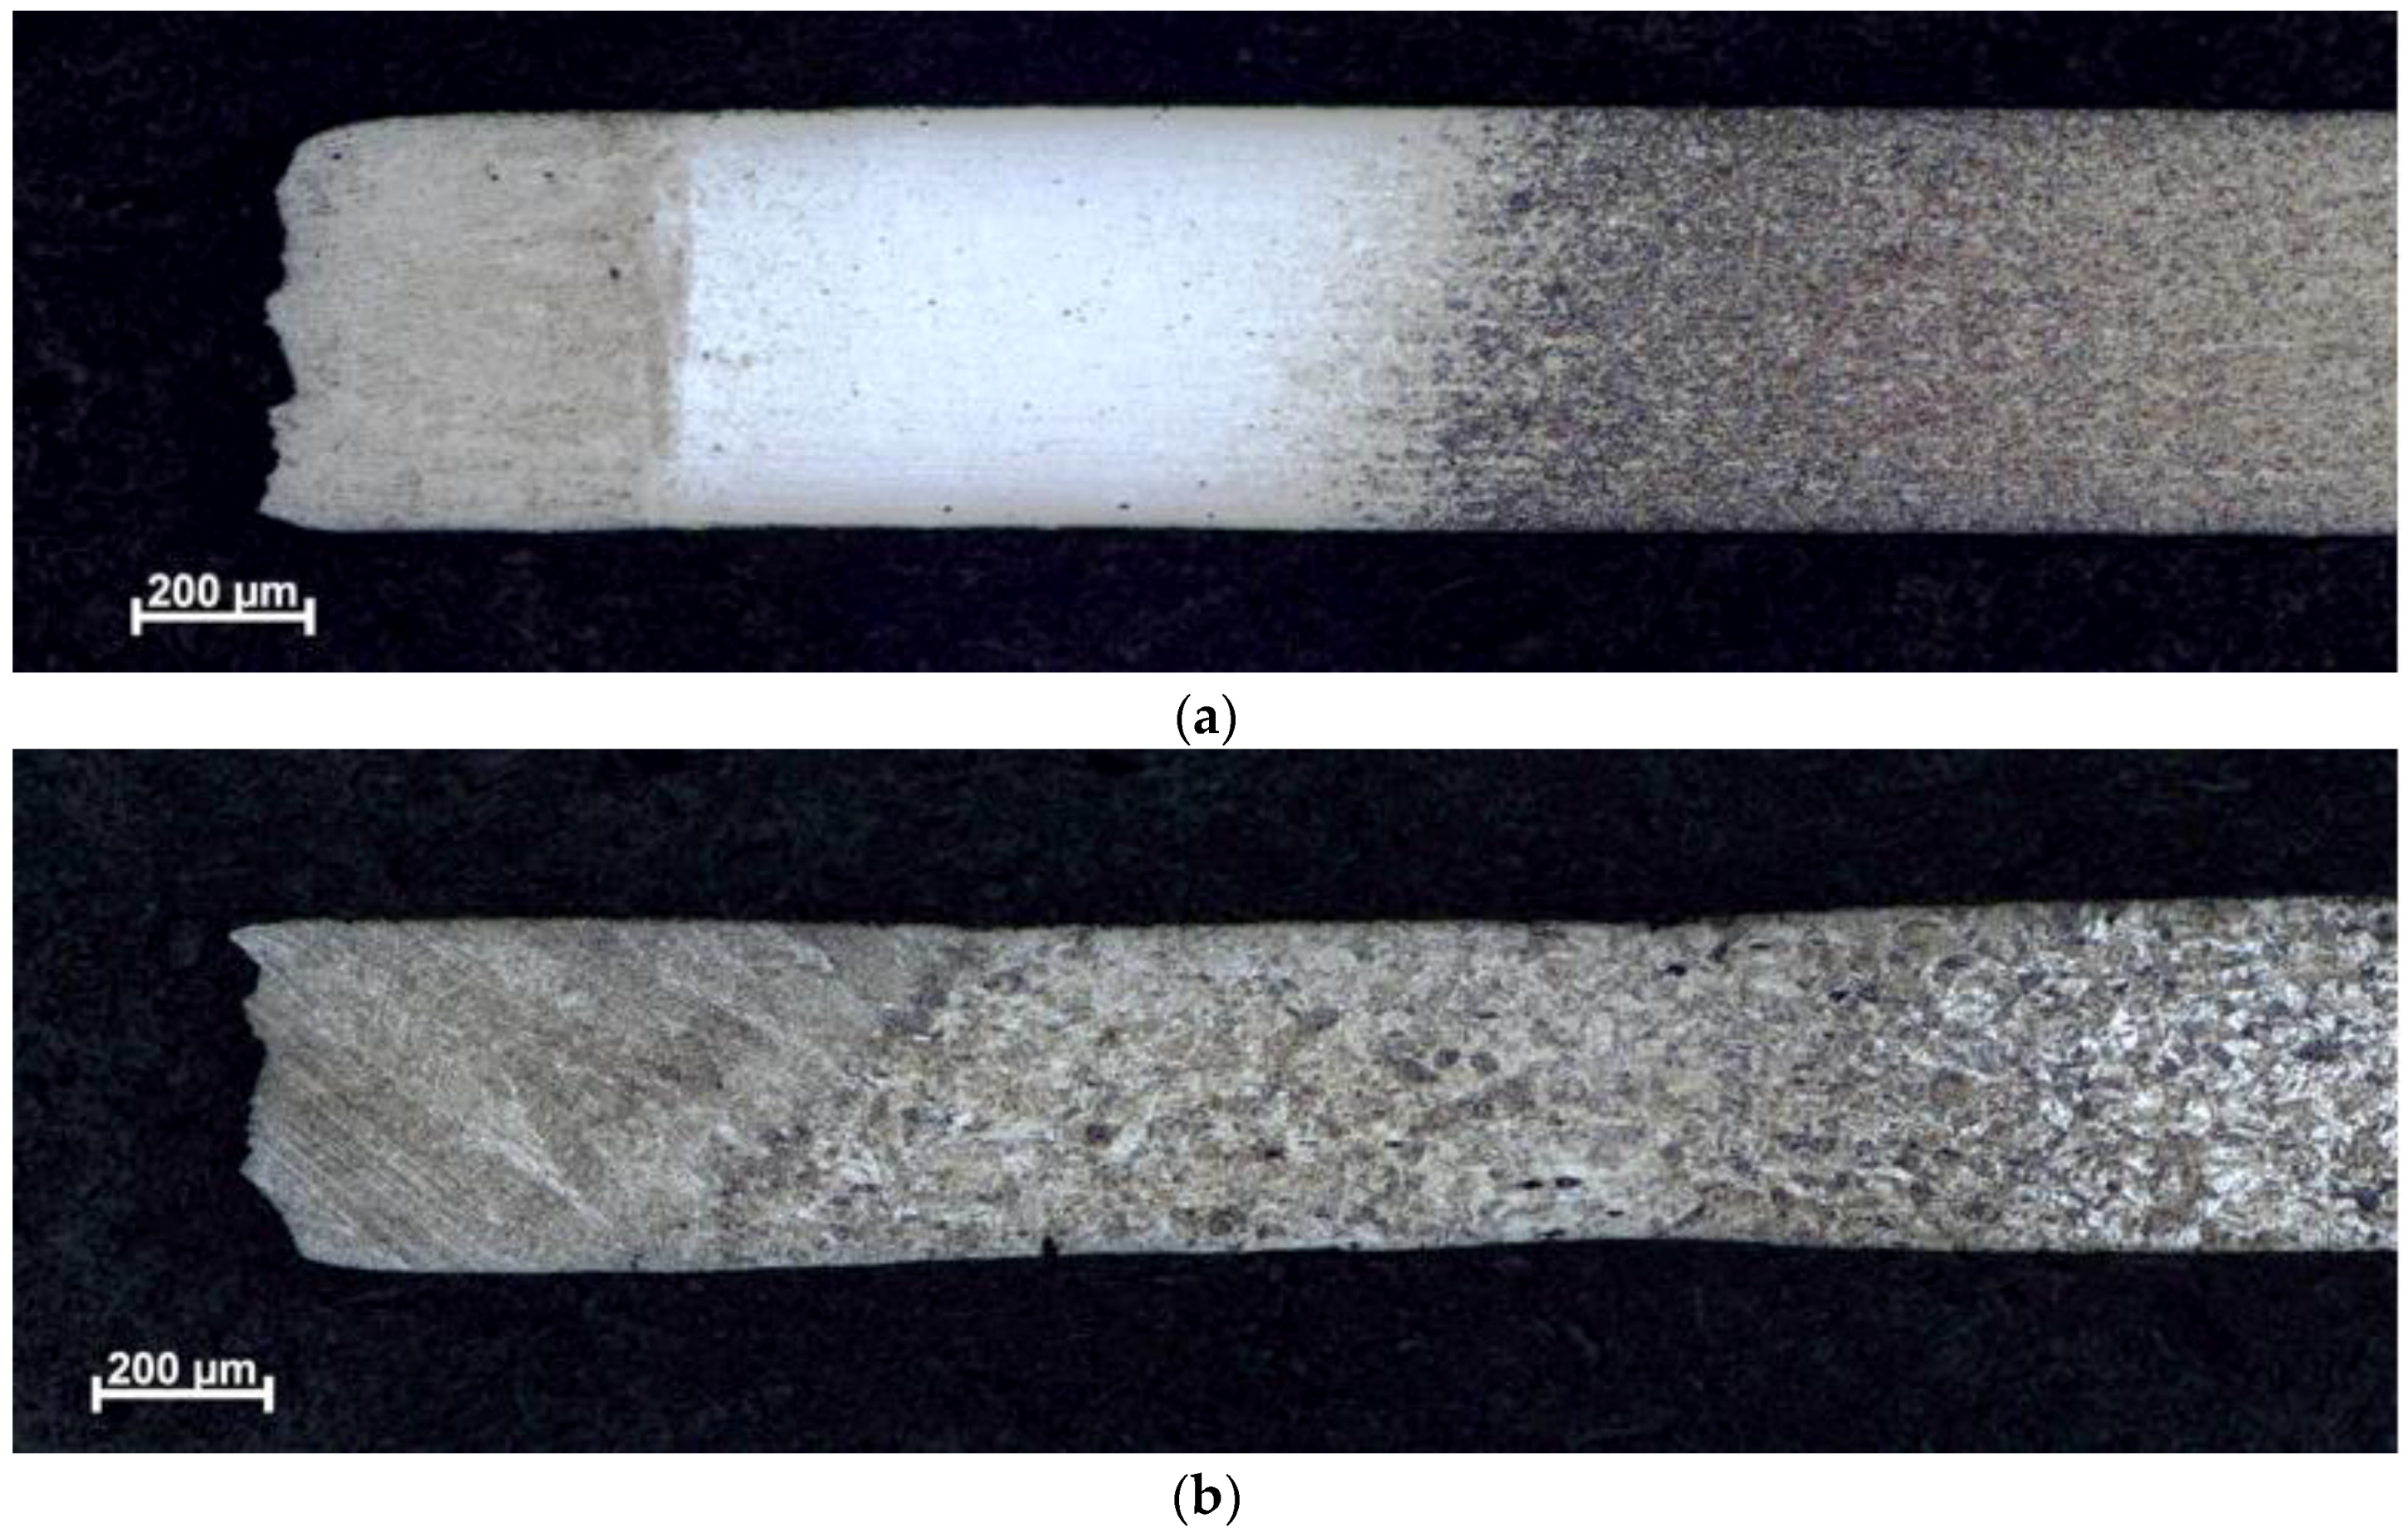
Figure 11.
Microstructure on longitudinal sections through miniature tensile test specimens from weld 18 (the fracture is on the left): (a) Specimen of the top sheet T15-81c; and, (b) Specimen of the bottom sheet T15-82a.
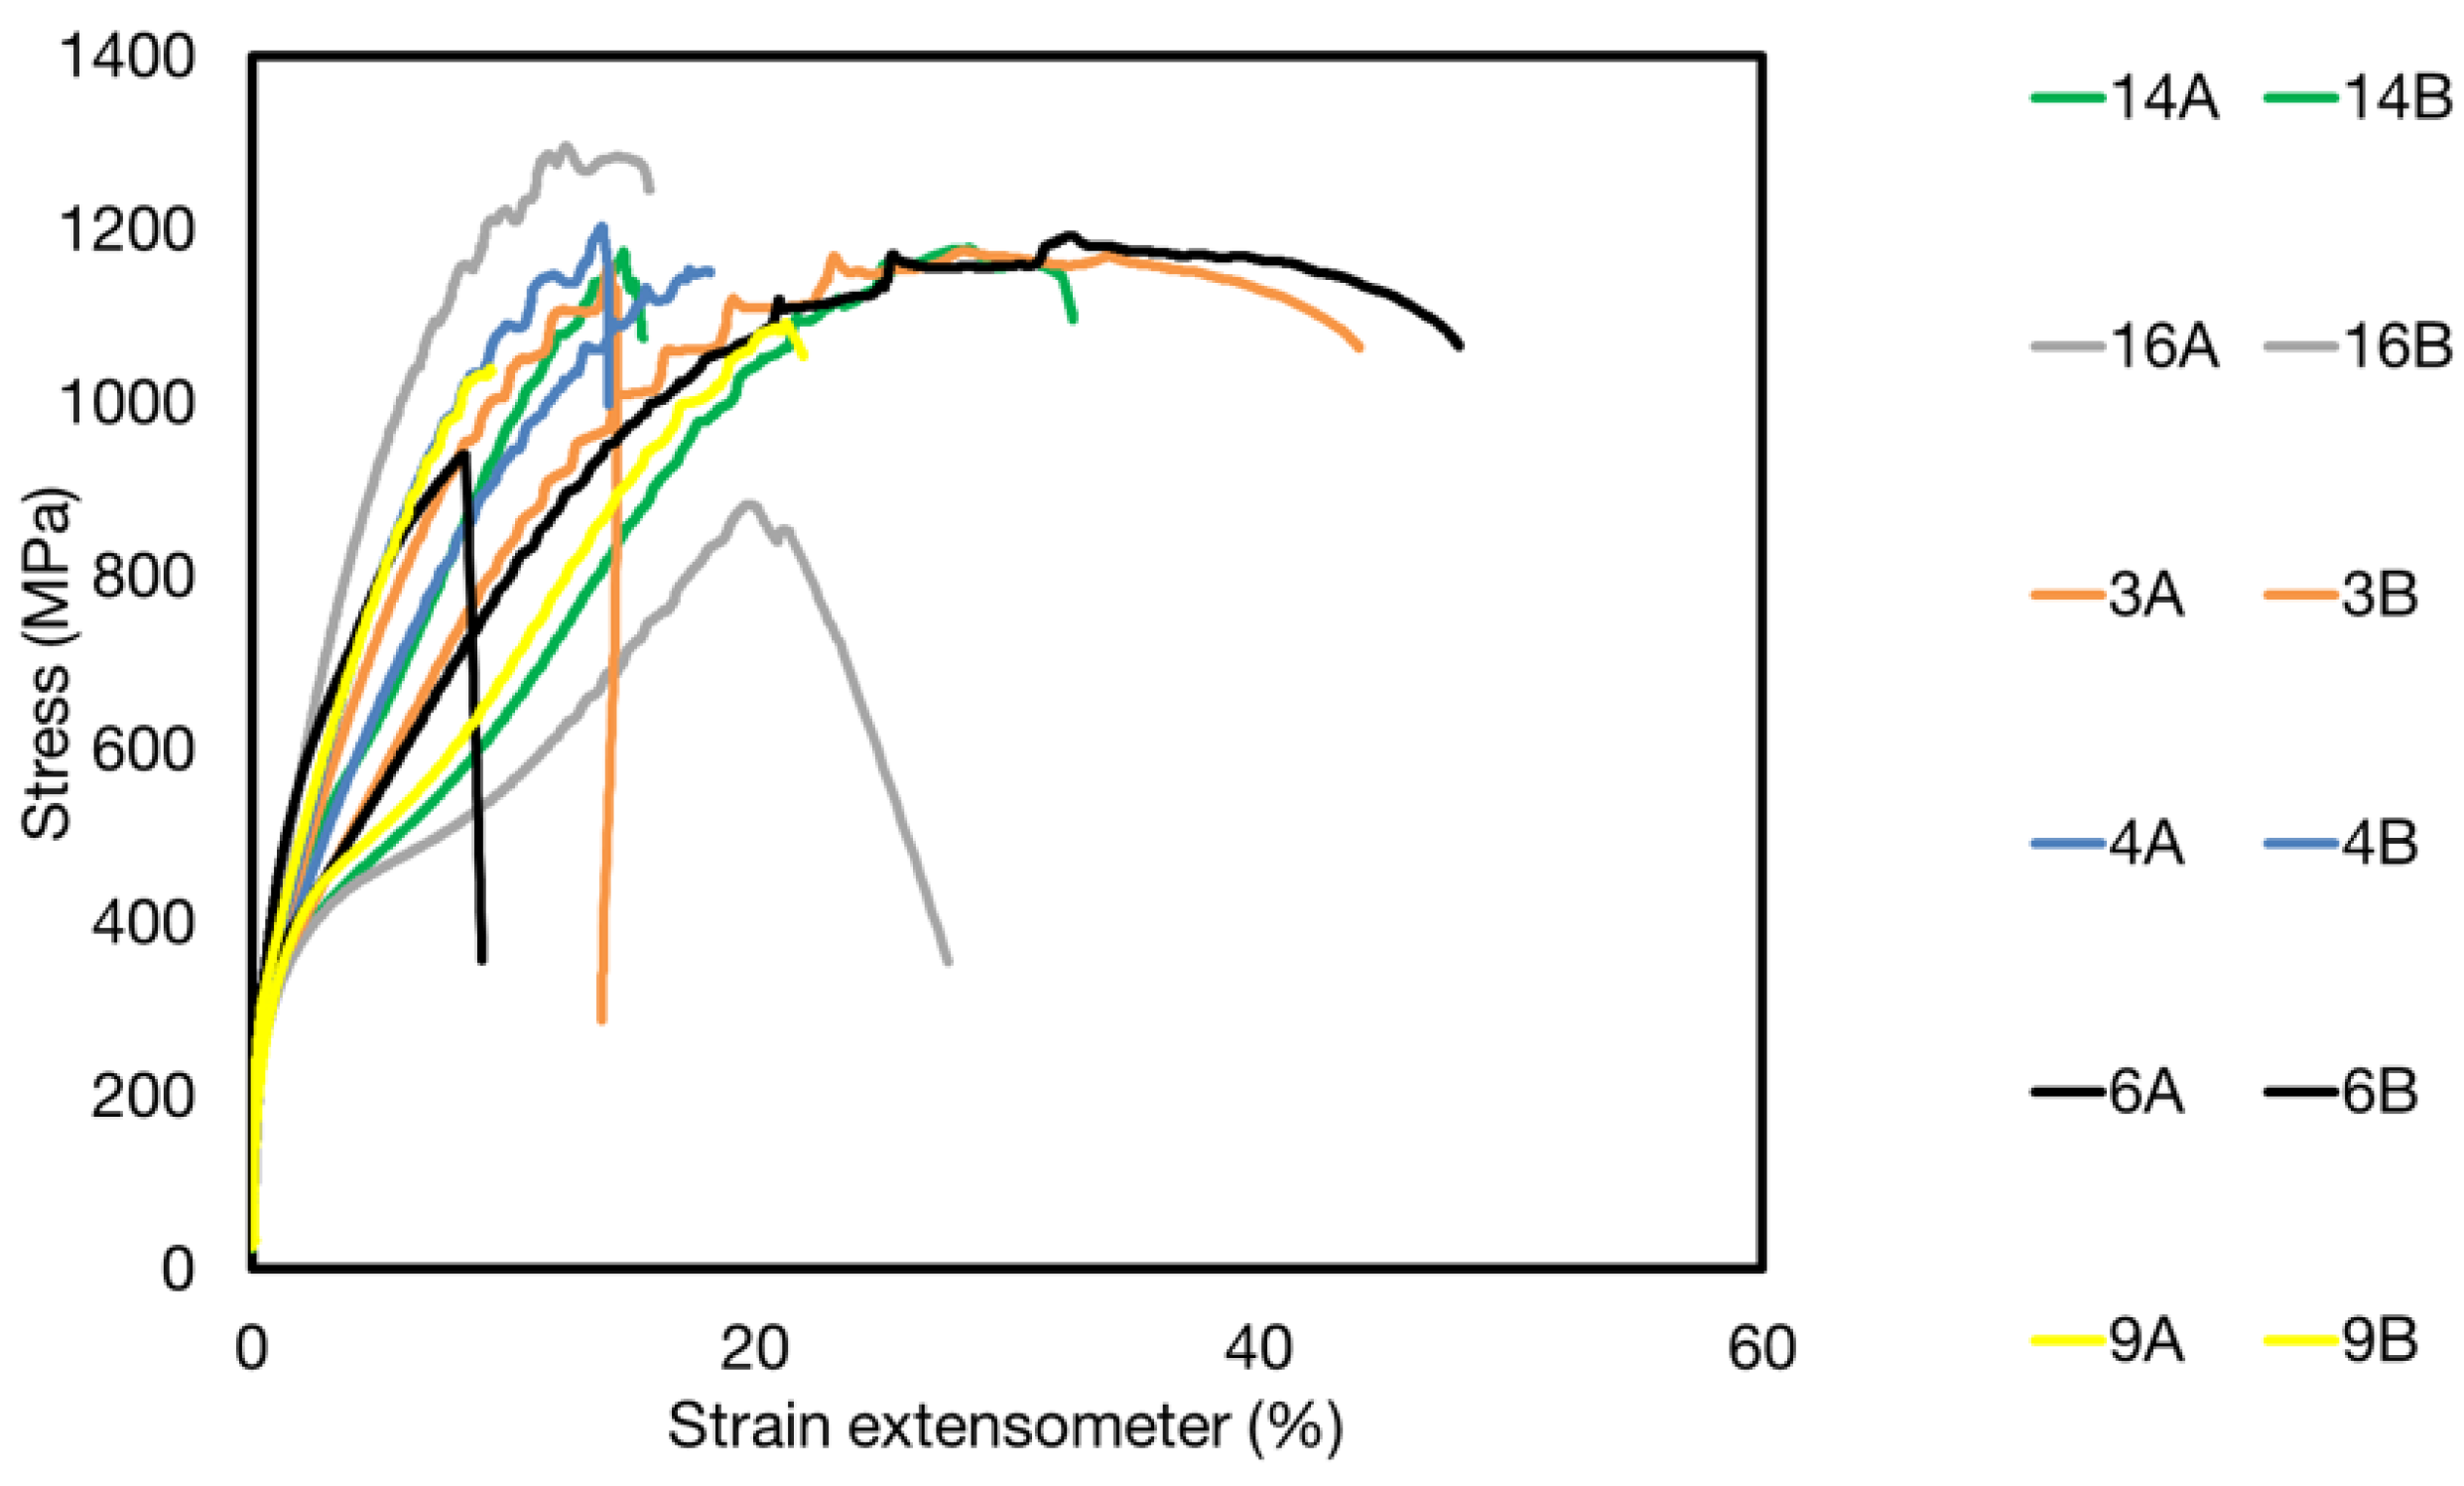
Figure 12.
Engineering stress-strain diagrams of selected specimens: Ar shielded welds: weld 3—T15-82a + T15-82c (1650 W), weld 4—T15-82a + T15-82a (1650 W), weld 6—T15-82a + T15-82c (1650 W), weld 9—T15-81a + T15-82a; Not shielded welds: weld 14—T15-81a + T15-81a (1650 W), weld 16—T15-81a + T15-82a (1650 W), weld 19—T15-82a + T15-82c (1650 W).
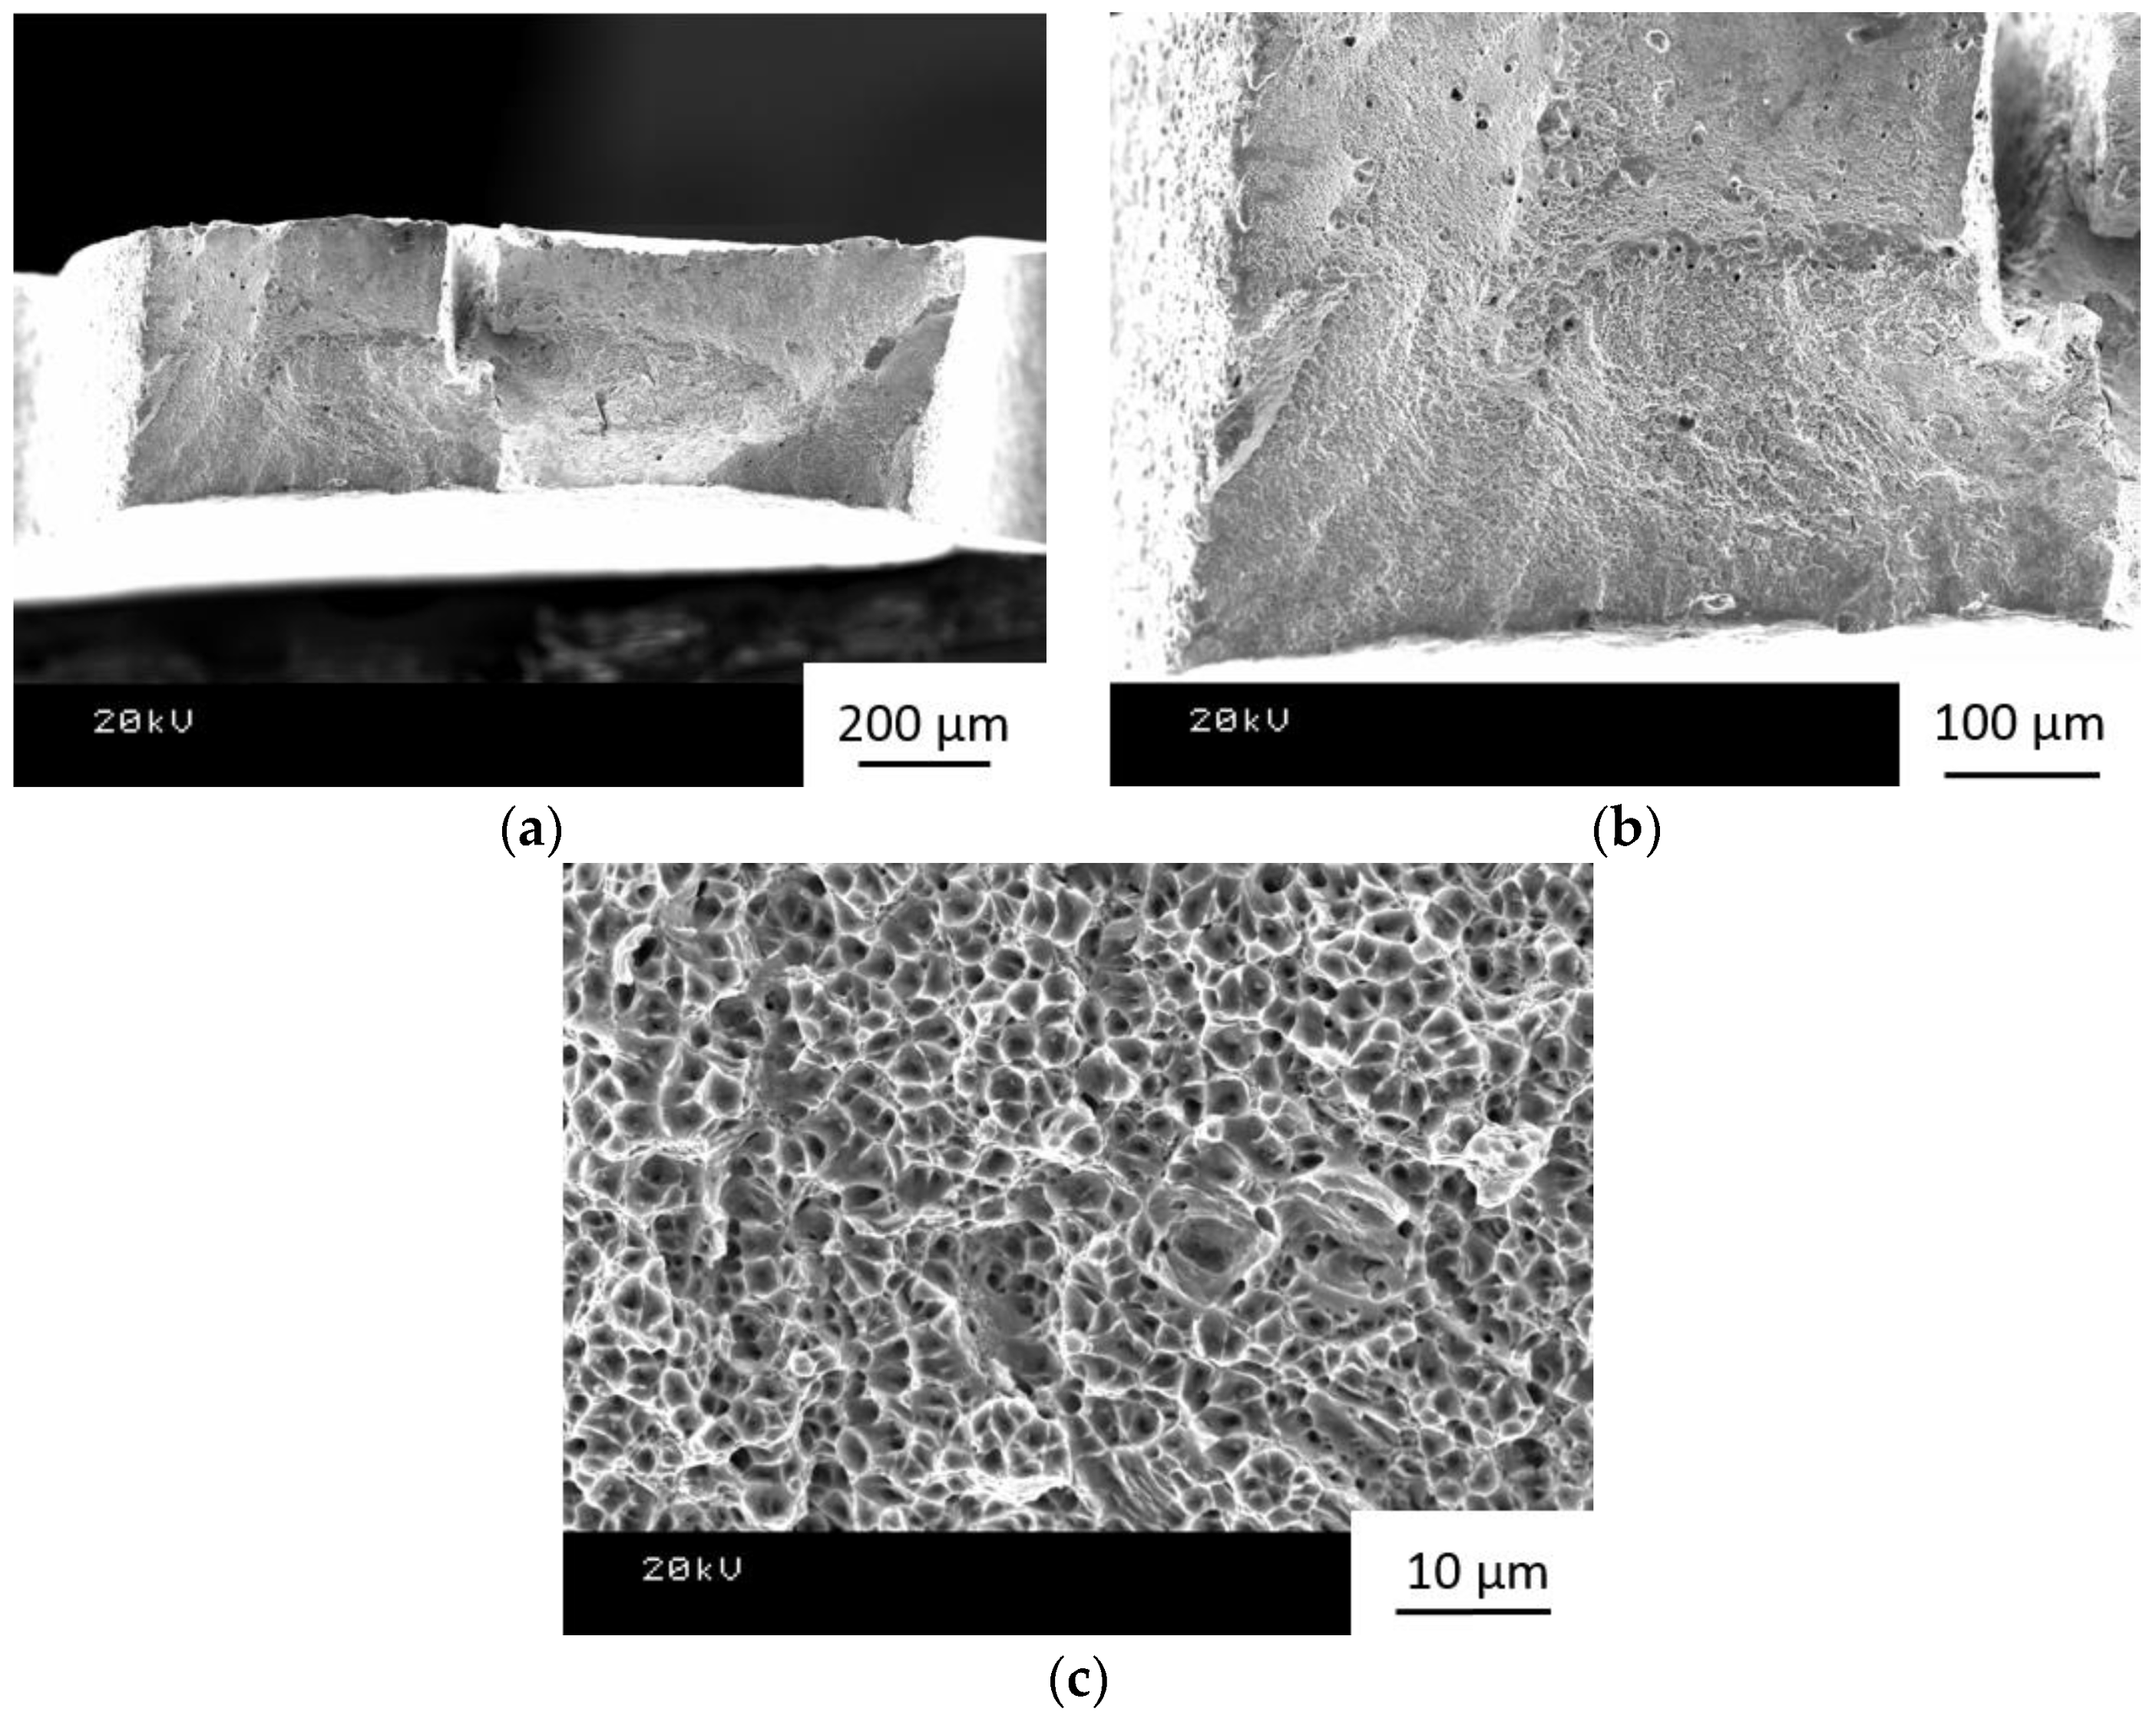
Figure 13.
Fracture surface of 19_1 specimen: (a) View of the entire fracture surface; (b) Detail of the defect—pore in the corner of the fracture surface; (c) Predominantly intergranular fracture; and, (d) Detail of a ductile fracture region.
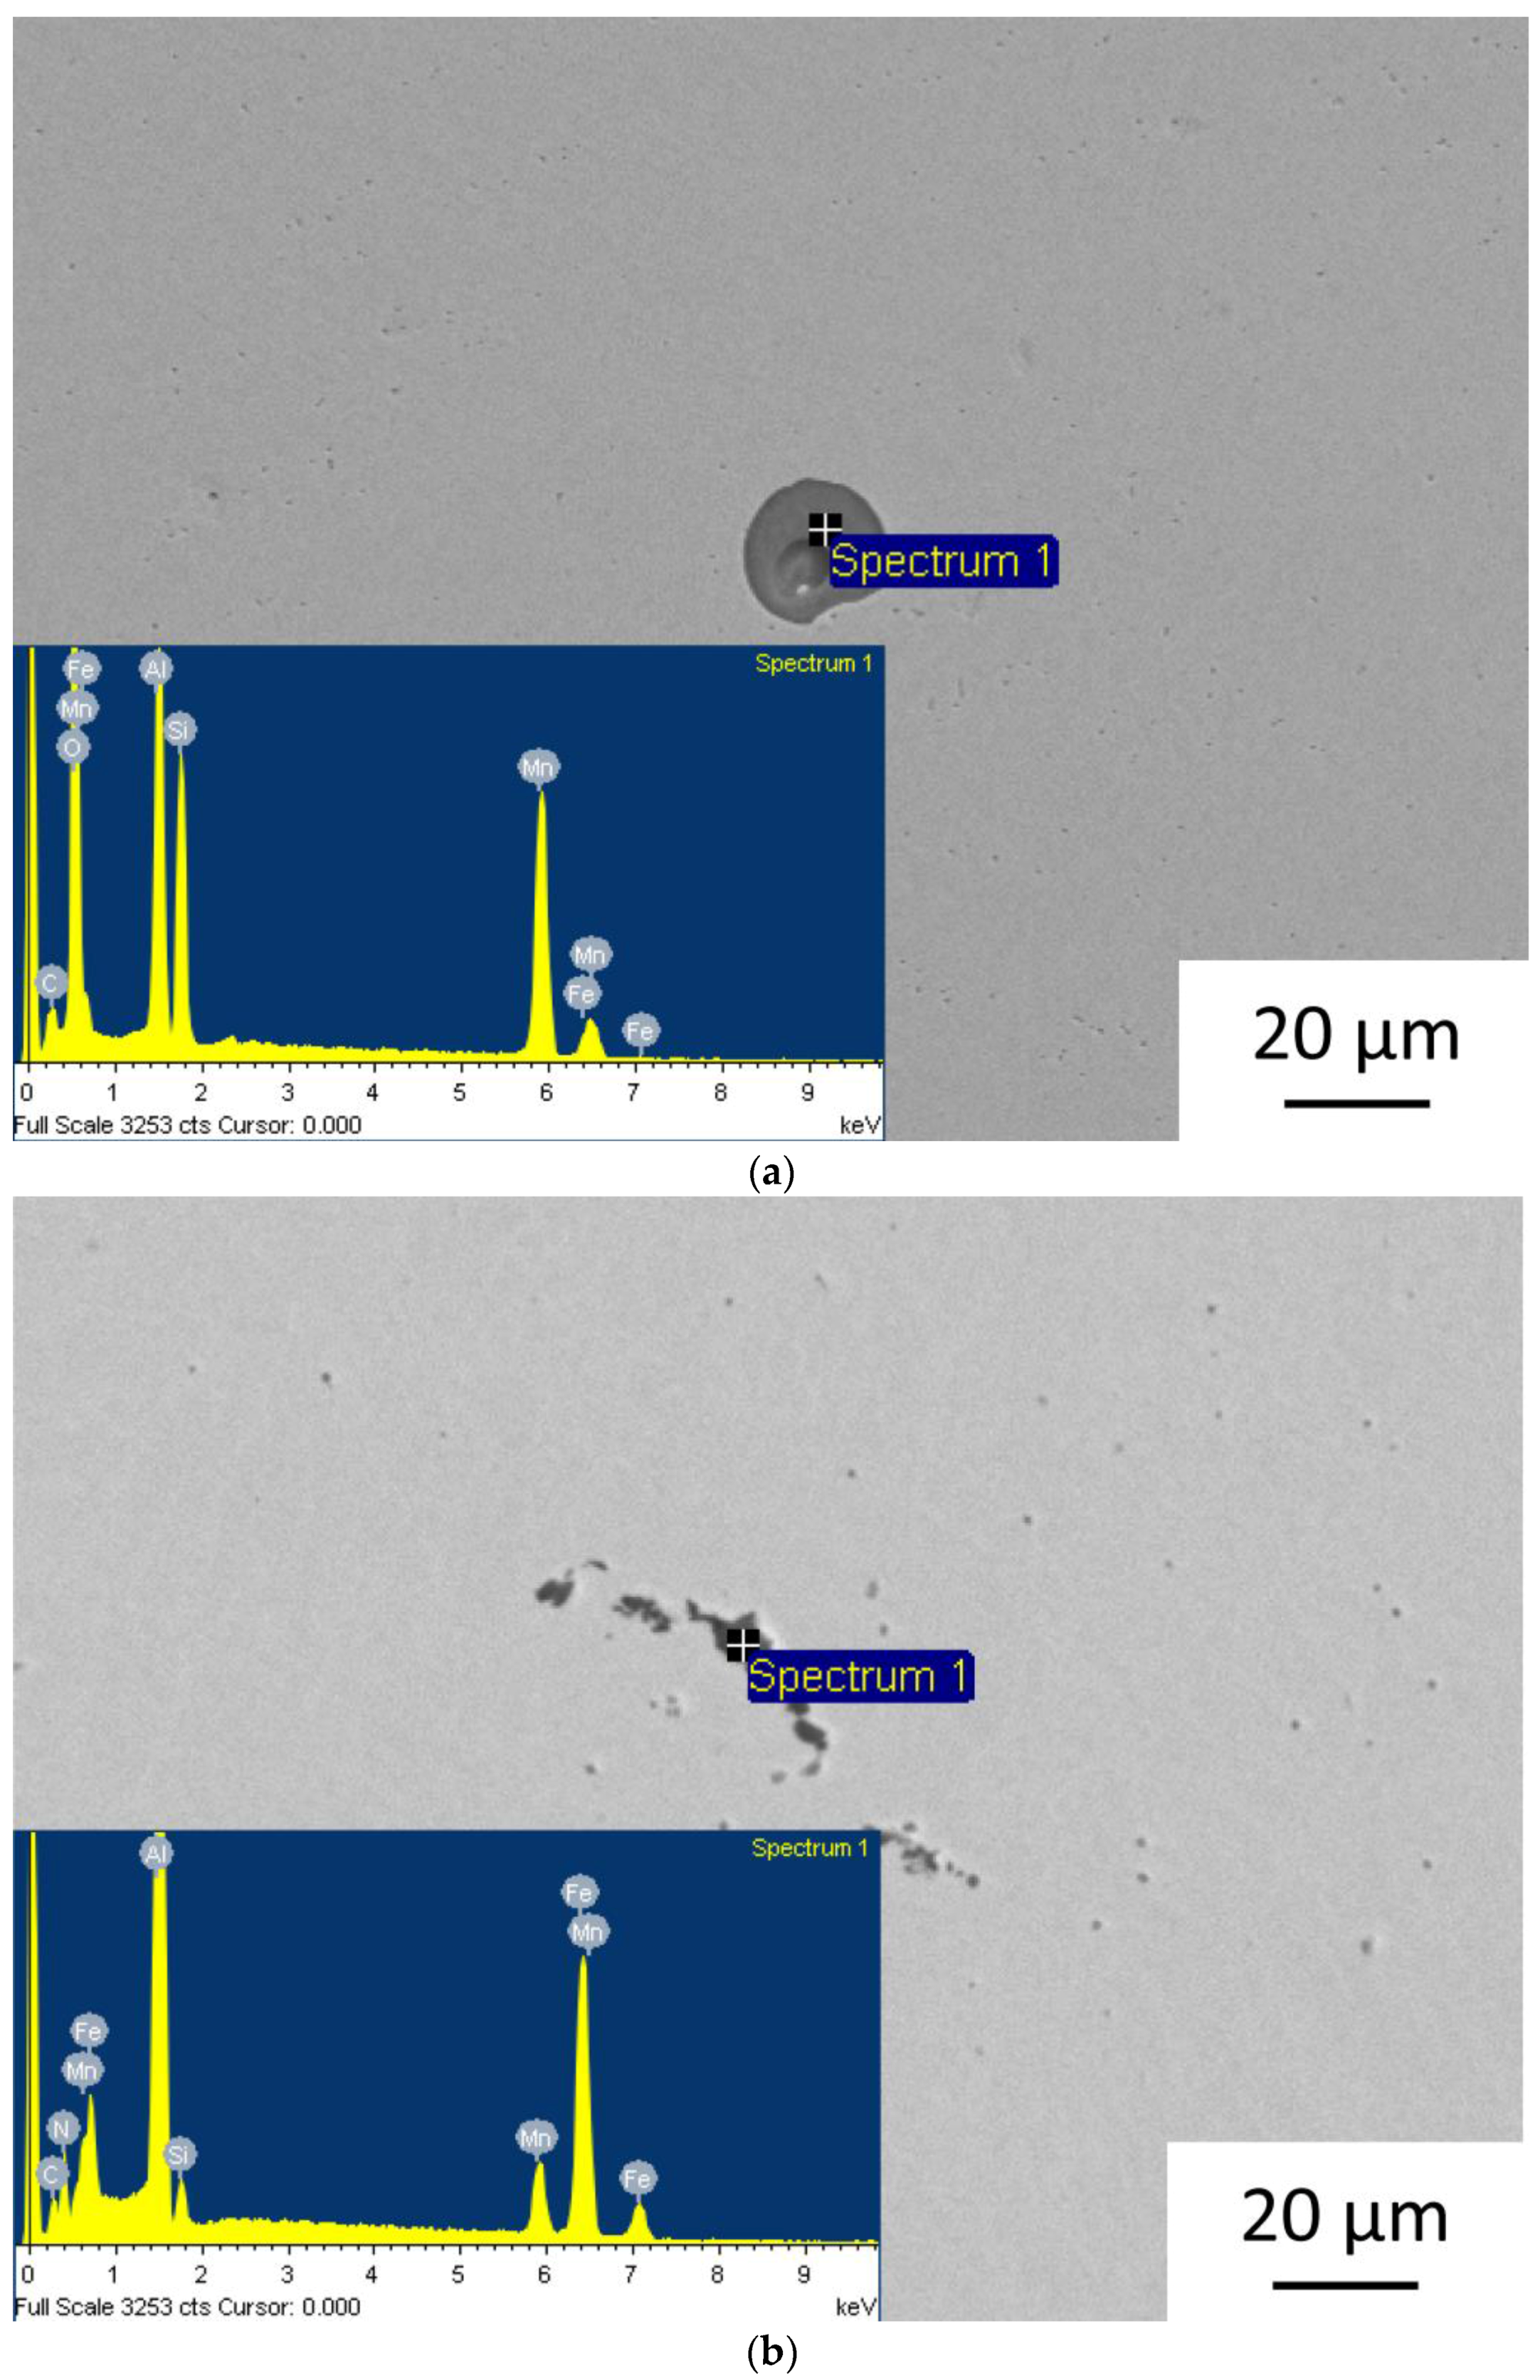
Figure 14.
Inclusions in the microstructure of the weld of specimen 19: (a) Al/Mn/Si oxide; and, (b) AlMnSi nitride.
Figure 15.
Fracture surface of 13_1 specimen: (a) View of the entire fracture surface; (b) Predominantly ductile fracture; and, (c) Ductile dimpled fracture region.
Table 1.
The chemical composition of the experimental steel.
| Heat No. | Element (wt %) |
|---|
| Mn | Si | Al | C | Fe |
|---|
| T15/81 | 15.1 | 1.58 | 0.40 | 0.12 | bal. |
| T15/82 | 15.0 | 1.54 | 1.40 | 0.10 | bal. |
Table 2.
Laser welding parameters and configurations of welds of T15-81 and T15-82 sheet metals.
| Sample ID | Power (W) | Shielding Gas | Sheets Combination |
|---|
| 1 | 1950 | Ar | T15-82a 1 + T15-82c 2 |
| 2 | 1950 | Ar | T15-82a + T15-82a |
| 3 | 1650 | Ar | T15-82a + T15-82c |
| 4 | 1650 | Ar | T15-82a + T15-82a |
| 5 | 1350 | Ar | T15-82a + T15-82a |
| 6 | 1350 | Ar | T15-82c + T15-82a |
| 7 | 1650 | Ar | T15-81a + T15-81a |
| 8 | 1650 | Ar | T15-82a + T15-82a |
| 9 | 1650 | Ar | T15-81a + T15-82a |
| 10 | 1650 | Ar | T15-81a + T15-82c |
| 11 | 1650 | Ar | T15-82a + T15-81c |
| 12 | 1650 | Ar | T15-82a + T15-82c |
| 13 | 1650 | Ar | T15-81a + T15-81c |
| 14 | 1650 | - | T15-81a + T15-81a |
| 15 | 1650 | - | T15-82a + T15-82a |
| 16 | 1650 | - | T15-81a + T15-82a |
| 17 | 1650 | - | T15-81a + T15-82c |
| 18 | 1650 | - | T15-81c + T15-82a |
| 19 | 1650 | - | T15-82a + T15-82c |
| 20 | 1650 | - | T15-81a + T15-81c |
Table 3.
Volume fractions of phases determined by X-ray diffraction.
| Sheet | γ (FCC) | α’ (BCC) | ε (HCP) |
|---|
| T15-81-cold rolled | 10.0 | 72.0 | 18.0 |
| T15-82-cold rolled | 11.0 | 62.0 | 27.0 |
| T15-81-annealed | 37.9 | 32.5 | 29.6 |
| T15-81-annealed | 43.1 | 8.5 | 48.4 |
Table 4.
Mechanical properties of sheets T15-81 and T15-82 in cold rolled and annealed state.
| Specimen | YS (MPa) | TS (MPa) | A5 (%) |
|---|
| T15-81-cold rolled | 1472 | 1742 | 7 |
| T15-82-cold rolled | 1264 | 1718 | 7 |
| T15-81-annealed | 257 | 1200 | 38 |
| T15-82-annealed | 300 | 1184 | 34 |
Table 5.
Mechanical properties of samples C (see
Figure 1).
| Weld Specimen | YS (MPa) | TS (MPa) | A5 (%) | Weld Specimen | YS (MPa) | TS (MPa) | A5 (%) |
|---|
| 1_A | 305.6 | 1272.1 | 33.0 | 11_A | 511.9 | 1184.7 | 17.0 |
| 1_B | 262.6 | 1270.5 | 15.5 | 11_B | 284.2 | 1224.8 | 32.0 |
| 2_A | 281.8 | 1235.5 | 34.2 | 12_A | 440.1 | 1029.4 | 20.0 |
| 2_B | 289.5 | 1195.5 | 16.0 | 12_B | 401.4 | 1256.1 | 19.0 |
| 3_A | 294.2 | 1174.4 | 44.0 | 13_A | 305.8 | 1170.1 | 22.0 |
| 3_B | 277.3 | 1158.2 | 14.0 | 13_B | 542.5 | 946.7 | 6.7 |
| 4_A | 280.9 | 1203.7 | 14.0 | 14_A | 261.7 | 1143.4 | 15.5 |
| 4_B | 263.0 | 1154.1 | 18,2 | 14_B | 256.0 | 1177.5 | 32.5 |
| 5_A | 312.1 | 1149.9 | 38,8 | 15_A | 301.4 | 1271.3 | 20.0 |
| 5_B | 326.7 | 992.4 | 8.1 | 15_B | 306.3 | 936.9 | 9.5 |
| 6_A | 306.5 | 940.0 | 9.1 | 16_A | 250.7 | 870.8 | 27.5 |
| 6_B | 313.8 | 1192.6 | 47.6 | 16_B | 358.4 | 1295.4 | 16.0 |
| 7_A | 276.7 | 1207.0 | 21.2 | 17_A | 253.4 | 1257.0 | 18.5 |
| 7_B | 208.8 | 1176.9 | 33.3 | 17_B | 397.2 | 904.2 | 6.4 |
| 8_A | 285.0 | 1021.1 | 8.9 | 18_A | 281.5 | 1202.8 | 16.3 |
| 8_B | 310.0 | 1215.8 | 9.5 | 18_B | 358.5 | 595.5 | 3.0 |
| 9_A | 224.5 | 1081.8 | 2.0 | 19_A | 235.2 | 1054.6 | 10.0 |
| 9_B | 307.3 | 1038.9 | 6.5 | 19_B | 146.9 | 290.7 | 2.3 |
| 10_A | 306.6 | 913.0 | 10.0 | 20_A | 271.0 | 1120.0 | 21.0 |
| 10_B | 275.0 | 1207.9 | 17.5 | 20_B | 280.0 | 1148.0 | 20.4 |
Table 6.
Mechanical properties of samples from weld metal—WM (see
Figure 1).
| Weld Specimen | YS (MPa) | TS (MPa) | A5 (%) | Weld Specimen | YS (MPa) | TS (MPa) | A5 (%) |
|---|
| 1_1 | - | 791.4 | 0.1 | 11_1 | 397.0 | 1010.9 | 3.2 |
| 1_2 | - | 837.3 | 0.1 | 11_2 | 388.9 | 887.6 | 2.5 |
| 2_1 | - | 842.0 | 0.2 | 12_1 | 342.8 | 690.6 | 1.2 |
| 2_2 | - | 781.0 | 0.2 | 12_2 | 364.7 | 1000.0 | 2.4 |
| 3_1 | - | 858.6 | 0.2 | 13_1 | 374.5 | 1291.2 | 12.2 |
| 3_2 | - | 622.6 | 0.3 | 13_2 | 309.7 | 1236.9 | 9.7 |
| 4_1 | 1046.4 | 1094.6 | 0.4 | 14_1 | 278.7 | 1010.7 | 6.8 |
| 4_2 | - | 834.6 | 0.2 | 14_2 | 262.2 | 1119.4 | 5.7 |
| 5_1 | 401.0 | 982.0 | 2.8 | 15_1 | 658.8 | 784.4 | 1.2 |
| 5_2 | 379.1 | 948.3 | 2.3 | 15_2 | 618.5 | 649.5 | 1.7 |
| 6_1 | 370.1 | 909.8 | 5.5 | 16_1 | 428.1 | 943.9 | 4.2 |
| 6_2 | 414.7 | 1004.4 | 5.9 | 16_2 | 432.8 | 634.9 | 1.1 |
| 7_1 | 279.4 | 1044.6 | 7.5 | 17_1 | 366.8 | 648.6 | 2.4 |
| 7_2 | 284.1 | 1334.7 | 14.4 | 17_2 | 395.2 | 1085.3 | 4.4 |
| 8_1 | 374.3 | 655.9 | 0.8 | 18_1 | 401.3 | 774.5 | 2.0 |
| 8_2 | 349.0 | 839.1 | 3.6 | 18_2 | 372.8 | 754.1 | 1.8 |
| 9_1 | 376.3 | 1019.8 | 2.9 | 19_1 | 420.2 | 944.8 | 2.3 |
| 9_2 | 369.5 | 970.1 | 3.9 | 19_2 | 404.5 | 595.2 | 2.6 |
| 10_1 | 315.4 | 1146.9 | 4.9 | 20_1 | 293.6 | 953.4 | 4.6 |
| 10_2 | 307.7 | 1175.2 | 5.1 | 20_2 | 282.8 | 1258.0 | 6.5 |

 ,
, 


