3.1. Force–Equilibrium Relationship in the Load Transfer
The connection between the vertical column and the CFST arch rib in the deck arch bridge is taken as a typical joint.
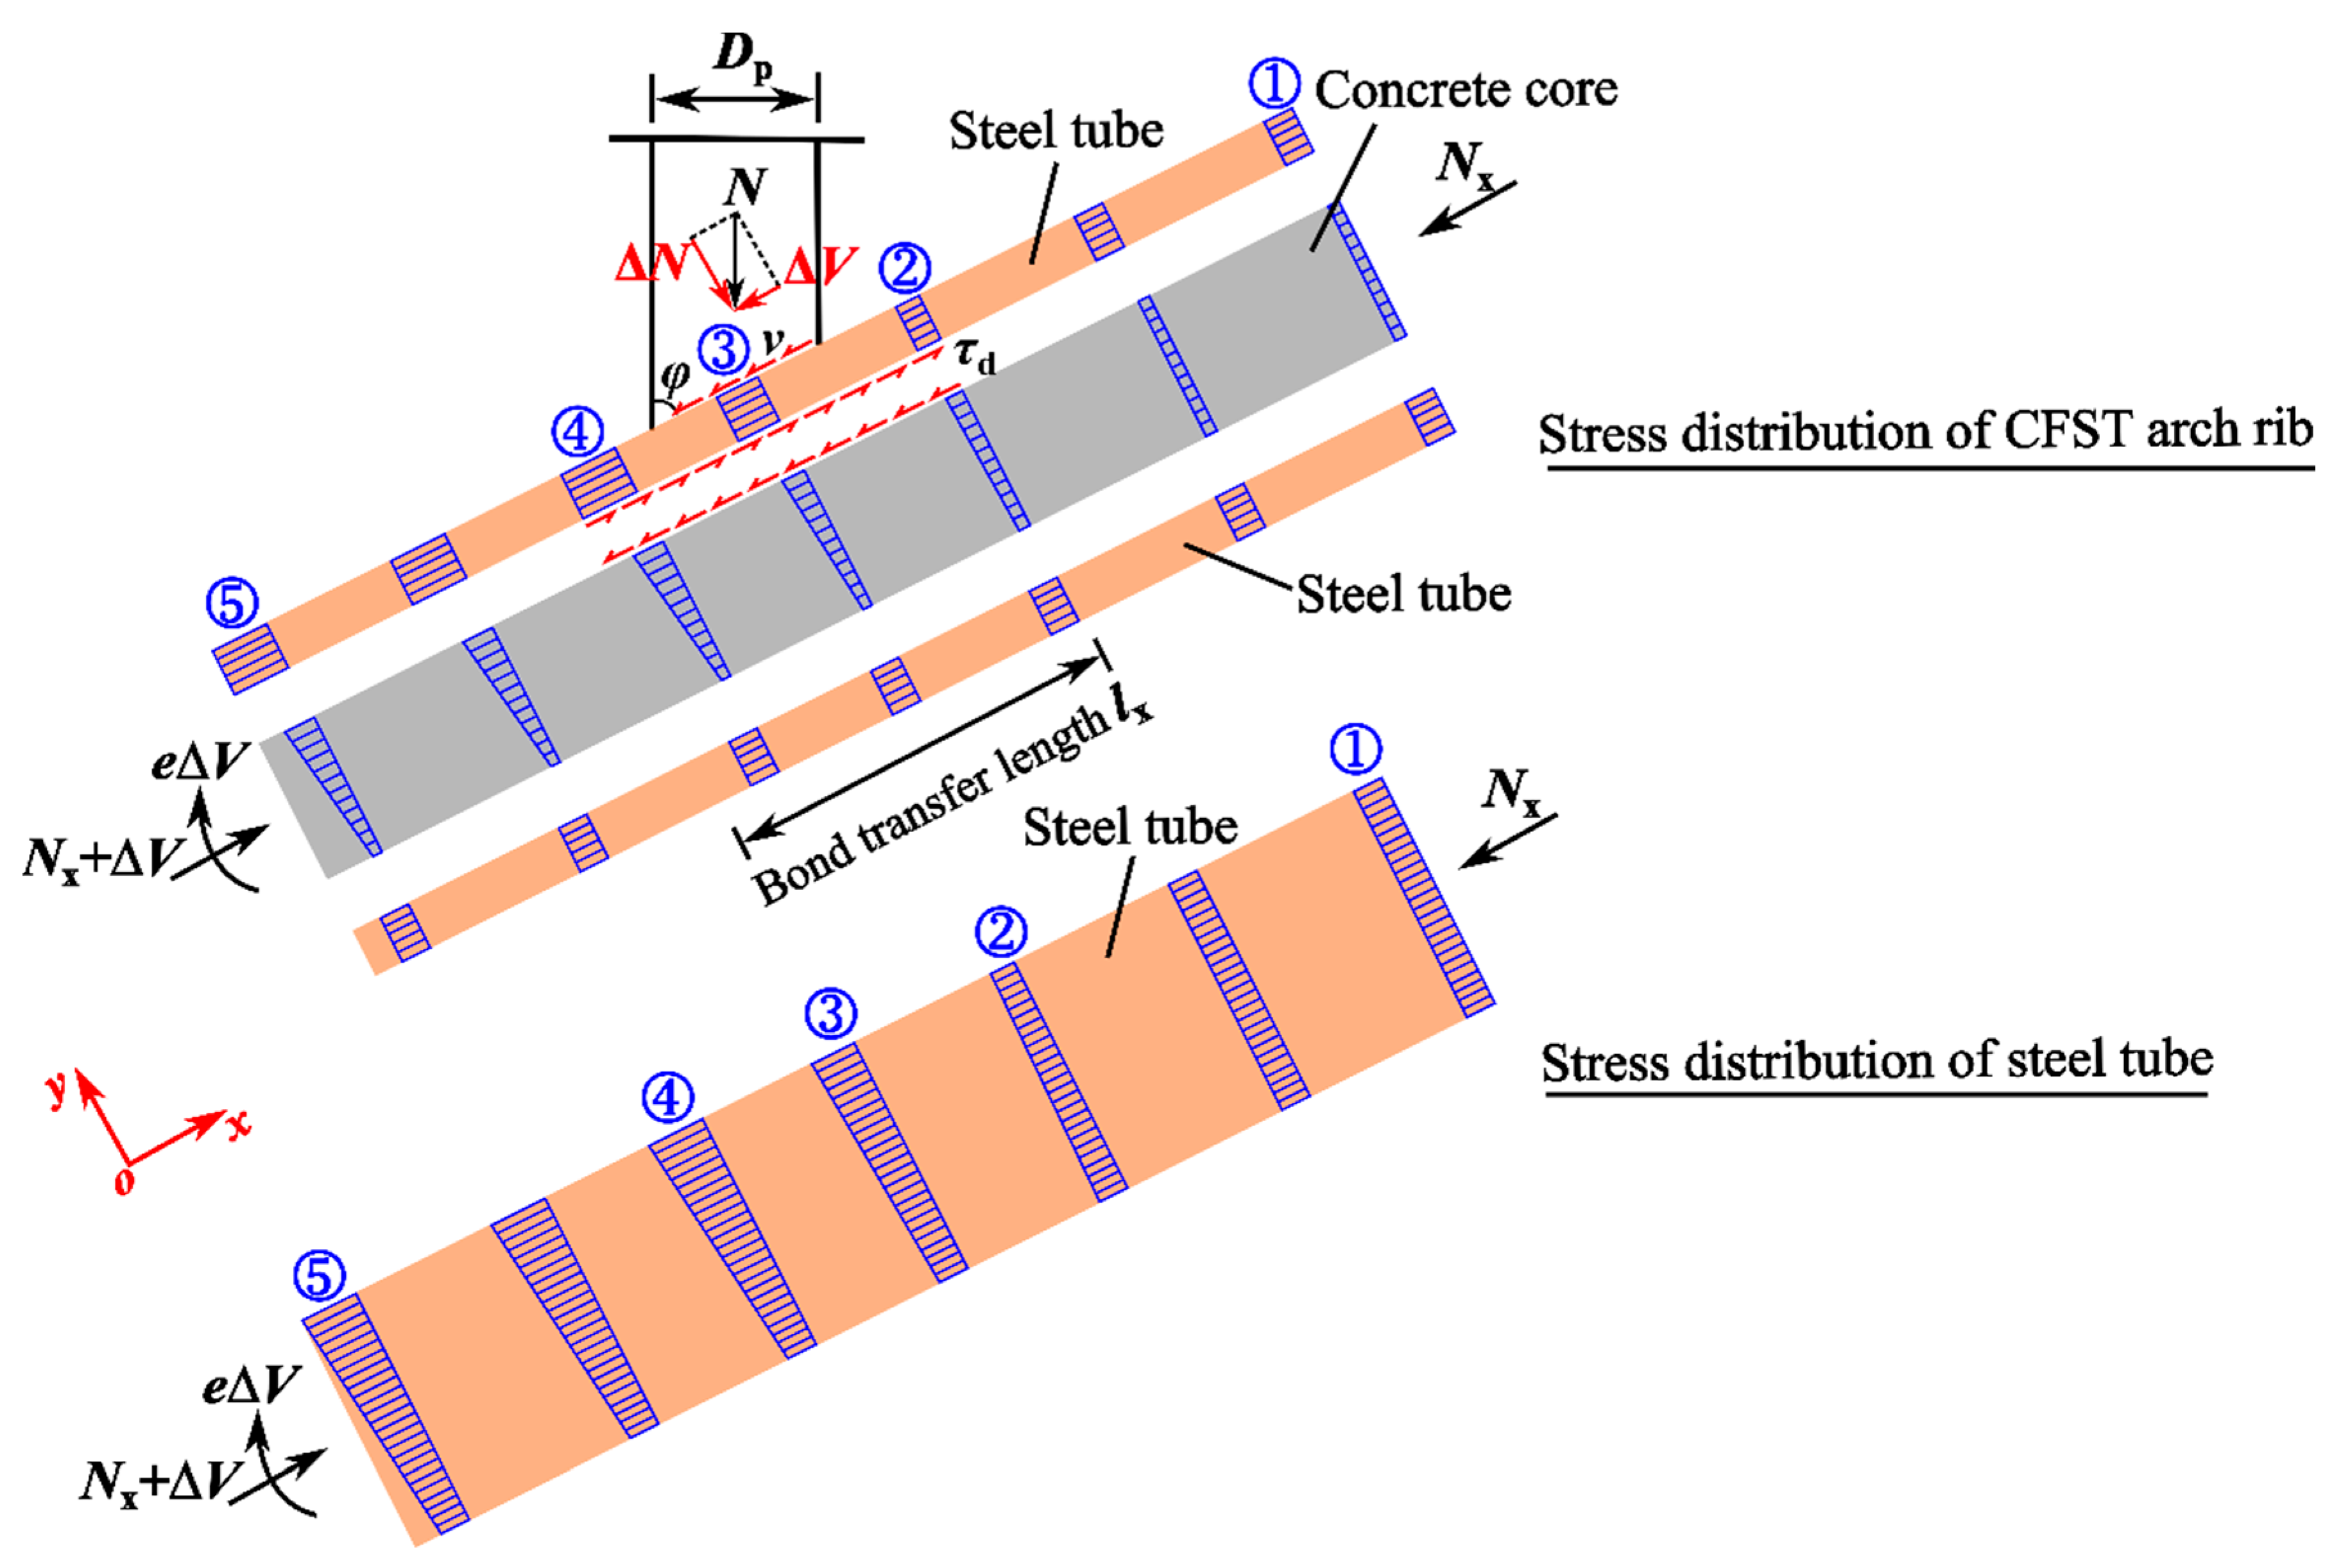
Figure 2 illustrates the force–equilibrium relationship for the load transfer in this typical joint. The curved-arch axis in the region of the introduction length can be assumed as a straight line. Furthermore, the
x,
y, and
z directions are assumed to run along the arch axis, perpendicular to the arch axis, and perpendicular to the plane, respectively.
As shown in
Figure 2, the CFST arch rib in the cross-section ① bears the axial force,
Nx, which is transferred from the vertical column above this cross-section. Meanwhile, the steel tube and concrete core work together to resist the axial force based on the deformation-compatibility principle. Uniformly distributed compressive stresses can be found on the steel tube (
σs1) and concrete core (
σc1), respectively, in compliance with the axial-stiffness ratio, as follows:
where
Es and
Ec are the elastic moduli of the steel and concrete, respectively, and
As and
Ac are the cross-sectional areas of the steel tube and concrete core, respectively.
The vertical load
N transferred from the deck system is directly applied to the outer surface of the steel tube, which can be divided into vertical and horizontal force components (Δ
N and Δ
V), as presented in
Figure 2. It is assumed that the horizontal force component Δ
V is uniformly distributed on the top face of the steel tube within the length of the intersection line between the vertical column and the CFST arch rib. Thus, the shear stress
v can be determined as follows:
where
Ap =
Dplw/sin
φ is the top face area of the steel tube along the length of the intersection line between the vertical column and the CFST arch rib, which is an arc-sectional area;
Dp is the height of the cross-section of the vertical column, as shown in
Figure 2;
lw is the arc width of the cross-section of the vertical column;
φ is the angle between the vertical column and the CFST arch rib.
The shear stress
v applied to the steel tube is transferred to the concrete core through the steel–concrete interface with an arc area
AT, leading to different strains on the steel tube and concrete core in the
x-direction. The shear stress at the steel–concrete interface can be taken as the design value of the bond strength
τd, and the area of the contact surface
AT can be expressed as follows:
At the location below the load-transfer region, the steel tube and concrete core can work together again with the same strain. At this point, the horizontal force applied to the concrete Δ
Vc can be calculated as follows:
The Δ
Vc is equal to the sum of the shear stresses on the contact surface, as follows:
According to Eurocode 4 and ANSI-AISC 360-05 (see
Table 2), only the steel–concrete interface on the top face of the steel tube can transfer the shear stress, and the bond-transfer length
lx is greater than the intersection-line length of
Dp/sin
φ. Therefore, the same compressive stress
σs1 can be found for cross-sections ①–⑤ on the bottom face of the steel tube. It is assumed that the positive axial force places the member in a tensile state and vice versa. The compressive stress for cross-section ② on the top face of the steel tube (
σs2) decreases because the shear stress is transferred through a distance of Δ
lx:
where
T is the thickness of the steel tube.
For the cross-section ② of the concrete core, the shear stress
τd is only transferred to the top face, which is equivalent to an eccentric force applied to the concrete core. The compressive stresses on the top and bottom faces (
σc2t and
σc2b) can be determined by taking a segment Δ
lx (see
Figure 3) of the concrete core as follows:
where
Hc is the height of the concrete core.
The cross-section ③ is located within the region of the intersection-line length
Dp/sin
φ, while the shear stress
τd is only applied to the top face of the steel tube, resulting in an eccentric force. In this case, the compressive stress on the top face of the steel tube can be calculated as follows:
where Δ
d is the distance to the right end of the intersection line in the
x-direction.
The stresses on the top and bottom faces of the concrete core in the cross-section ③ can also be expressed by Equations (8) and (9), respectively. For the cross-section ④, the same stress in the concrete core can be found as that in the cross-section ③, while the stress on the top face of the steel tube is expressed by Equation (10). According to
Figure 2, the maximum compressive stress on the steel tube is observed on the top face at a certain point, which is located in the region of the cross-sections ② and ④. The maximum compressive stress in the concrete core is also found at a certain point on the top face, where the shear-stress transfer is completed.
For the cross-section ⑤, the shear-stress transfer is completed, while the compressive stress on the top face of the steel tube is determined as follows:
The compressive stresses on the top and bottom faces (
σc5t and
σc5b) of the concrete core for the cross-section ⑤ can be expressed by Equations (12) and (13), respectively.
Equations (1)–(13) can completely illustrate the stress distributions in the steel tube and concrete core in the region of the load transfer. To solve them, three unknown values, including the design value of the bond strength τd, the bond-transfer length lx, and the bond-transfer circumference lz, should be obtained. To address this, in the following section, the finite element model (FEM) is developed to determine the values of the three unknown values.
3.2. The FEM for the Joint between the Vertical Column and the CFST Arch Rib
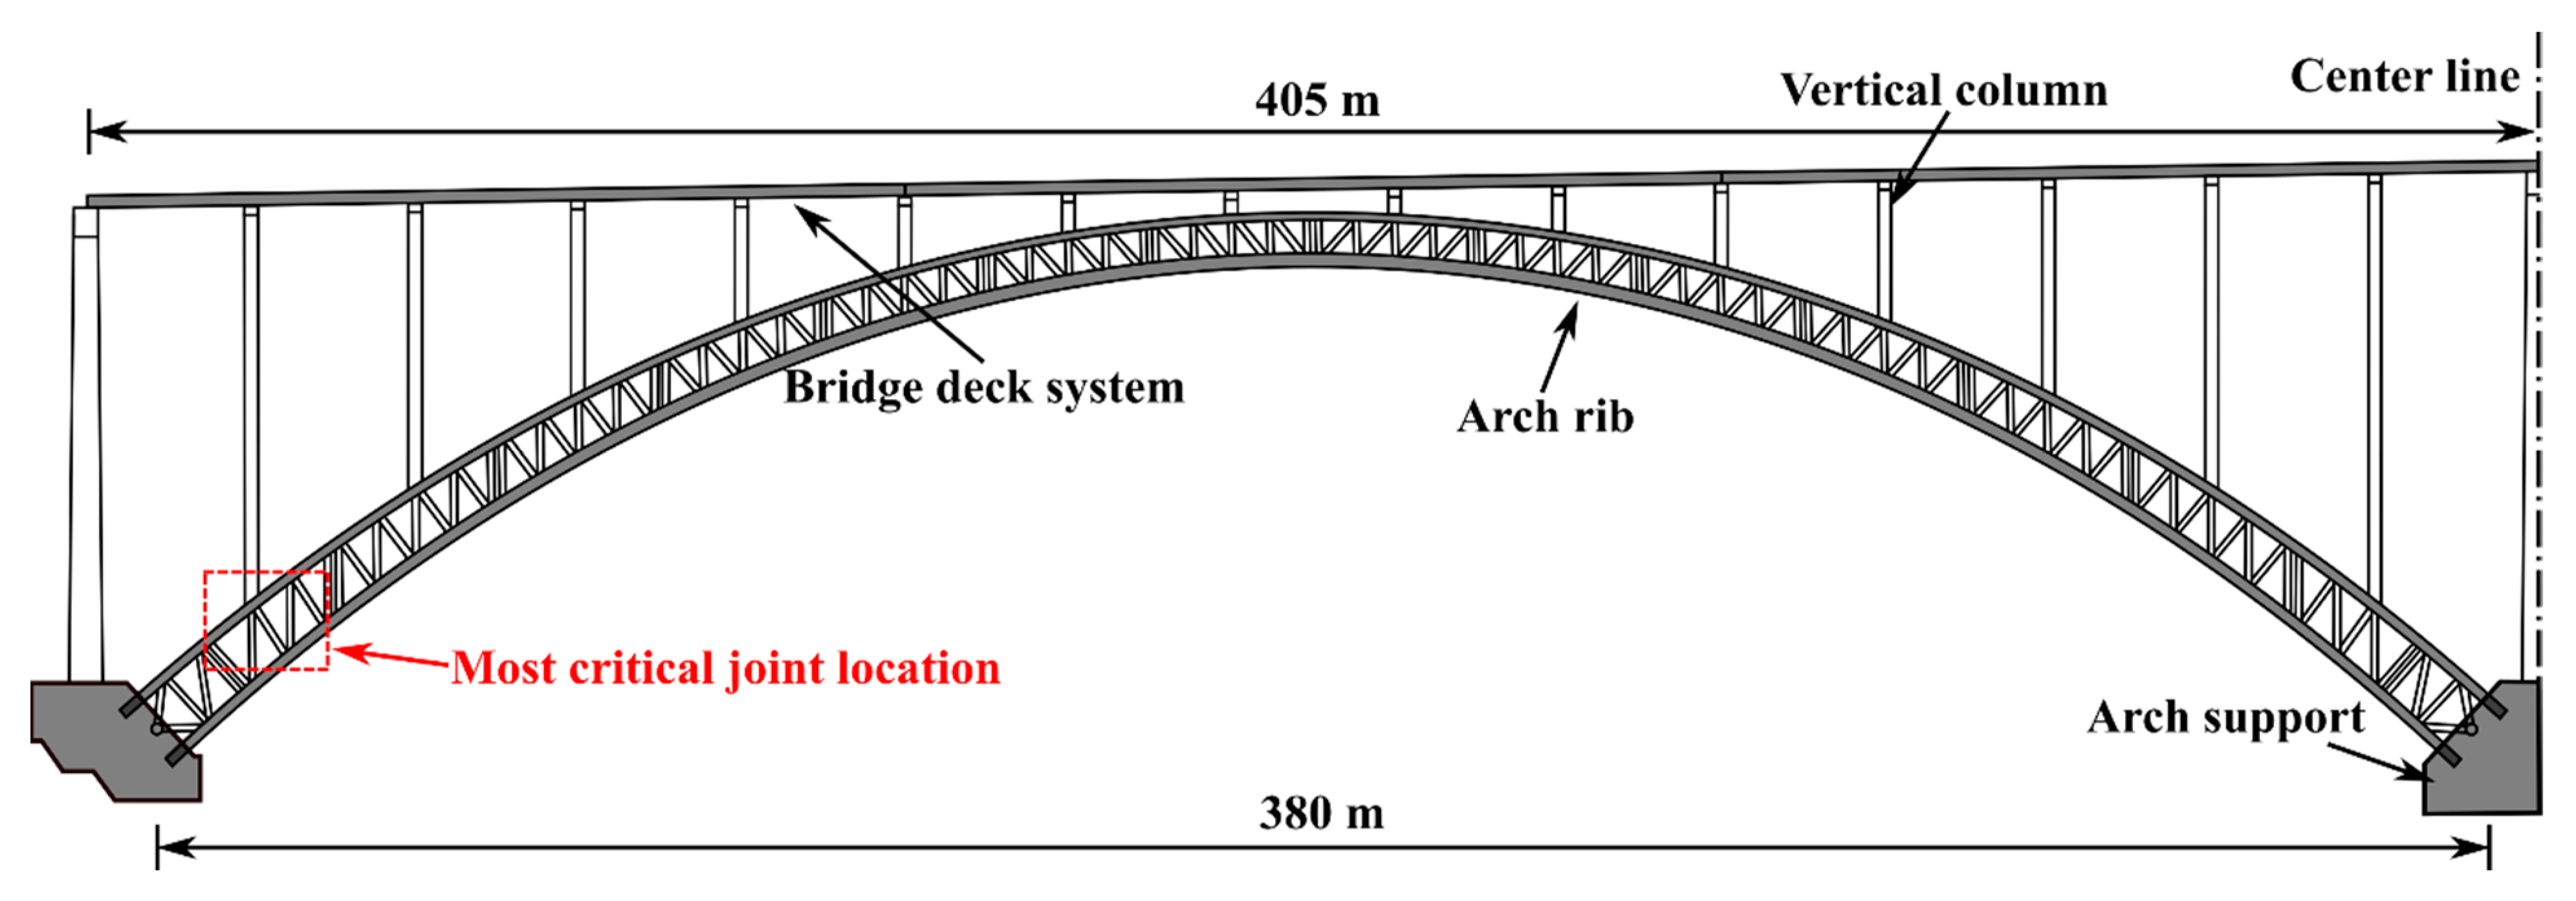
A typical application of a deck CFST arch bridge in China, namely Shuangbao Bridge, was selected as the research object, and an overview of this bridge is introduced in
Section 5. The FEM for the most critical joint between the vertical column and the CFST arch rib was developed using the commercial software ABAQUS, as presented in
Figure 4. For the CFST arch rib, the circular hollow section had a diameter of 1400 mm and a thickness of 35 mm. For the vertical column, the steel-box section had dimensions of 2200 mm × 1000 mm, while the thicknesses were 16 mm and 22 mm in the
x and
z directions, respectively. To eliminate the stress concentration due to the Saint-Venant principle, the length of the arch rib was assumed to be 15 times the arch rib’s diameter. Additionally, since the deformation of the vertical column was too small to be considered, it was employed as a rigid body with a height of 100 mm. As the load transfer was evaluated for the serviceability limit state, linear elastic material properties were assigned for both the steel and the concrete. The steel for the arch rib and vertical column had an elastic modulus
Es of 2.06 × 10
5 MPa and a Poisson’s ratio of 0.31. The grade-C70 concrete specified in GB50010-2010 [
44] was filled in the arch rib. The elastic modulus
Ec and Poisson’s ratio
vc were 3.7 × 10
4 MPa and 0.2, respectively. The vertical column, steel tube, and concrete core were simulated using C3D8 solid elements measuring 50 mm.
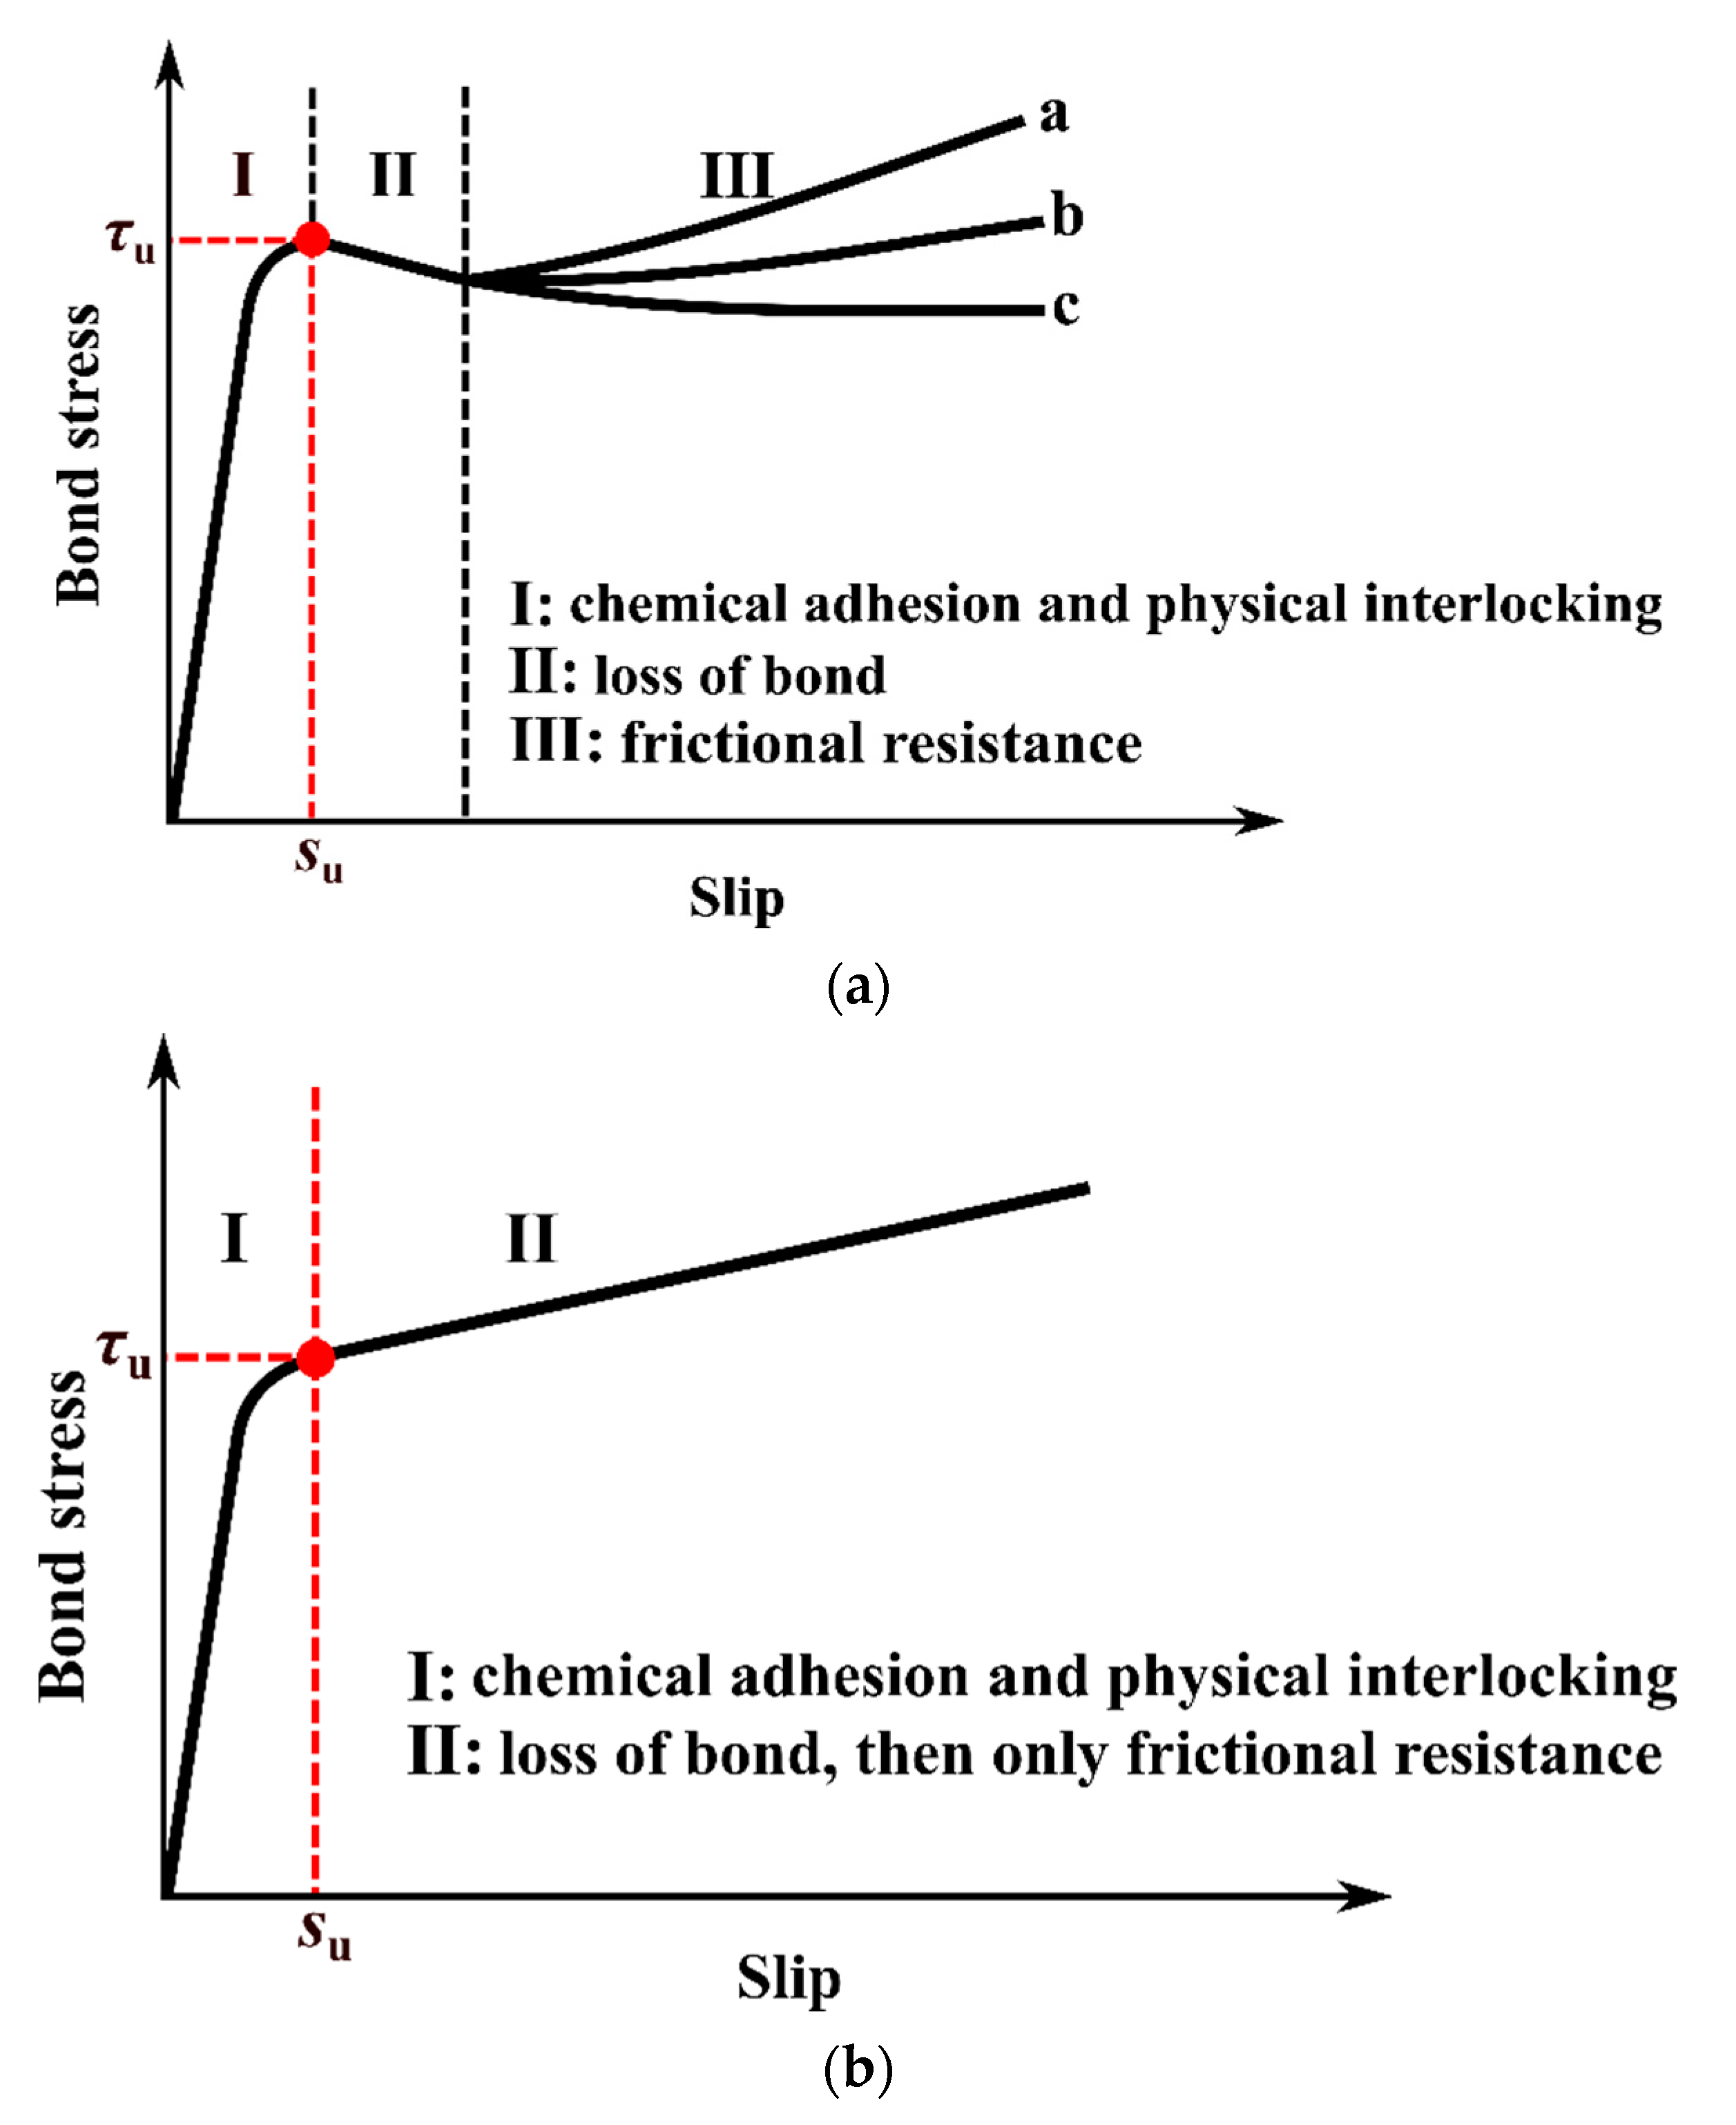
The bond at the steel–concrete interface is the key point in the accurate evaluation of the load-transfer mechanism. As shown in
Figure 1, a relatively large difference was found between the bond stress–slip curves. To ensure the safety of the design, the most conservative curve of c (see
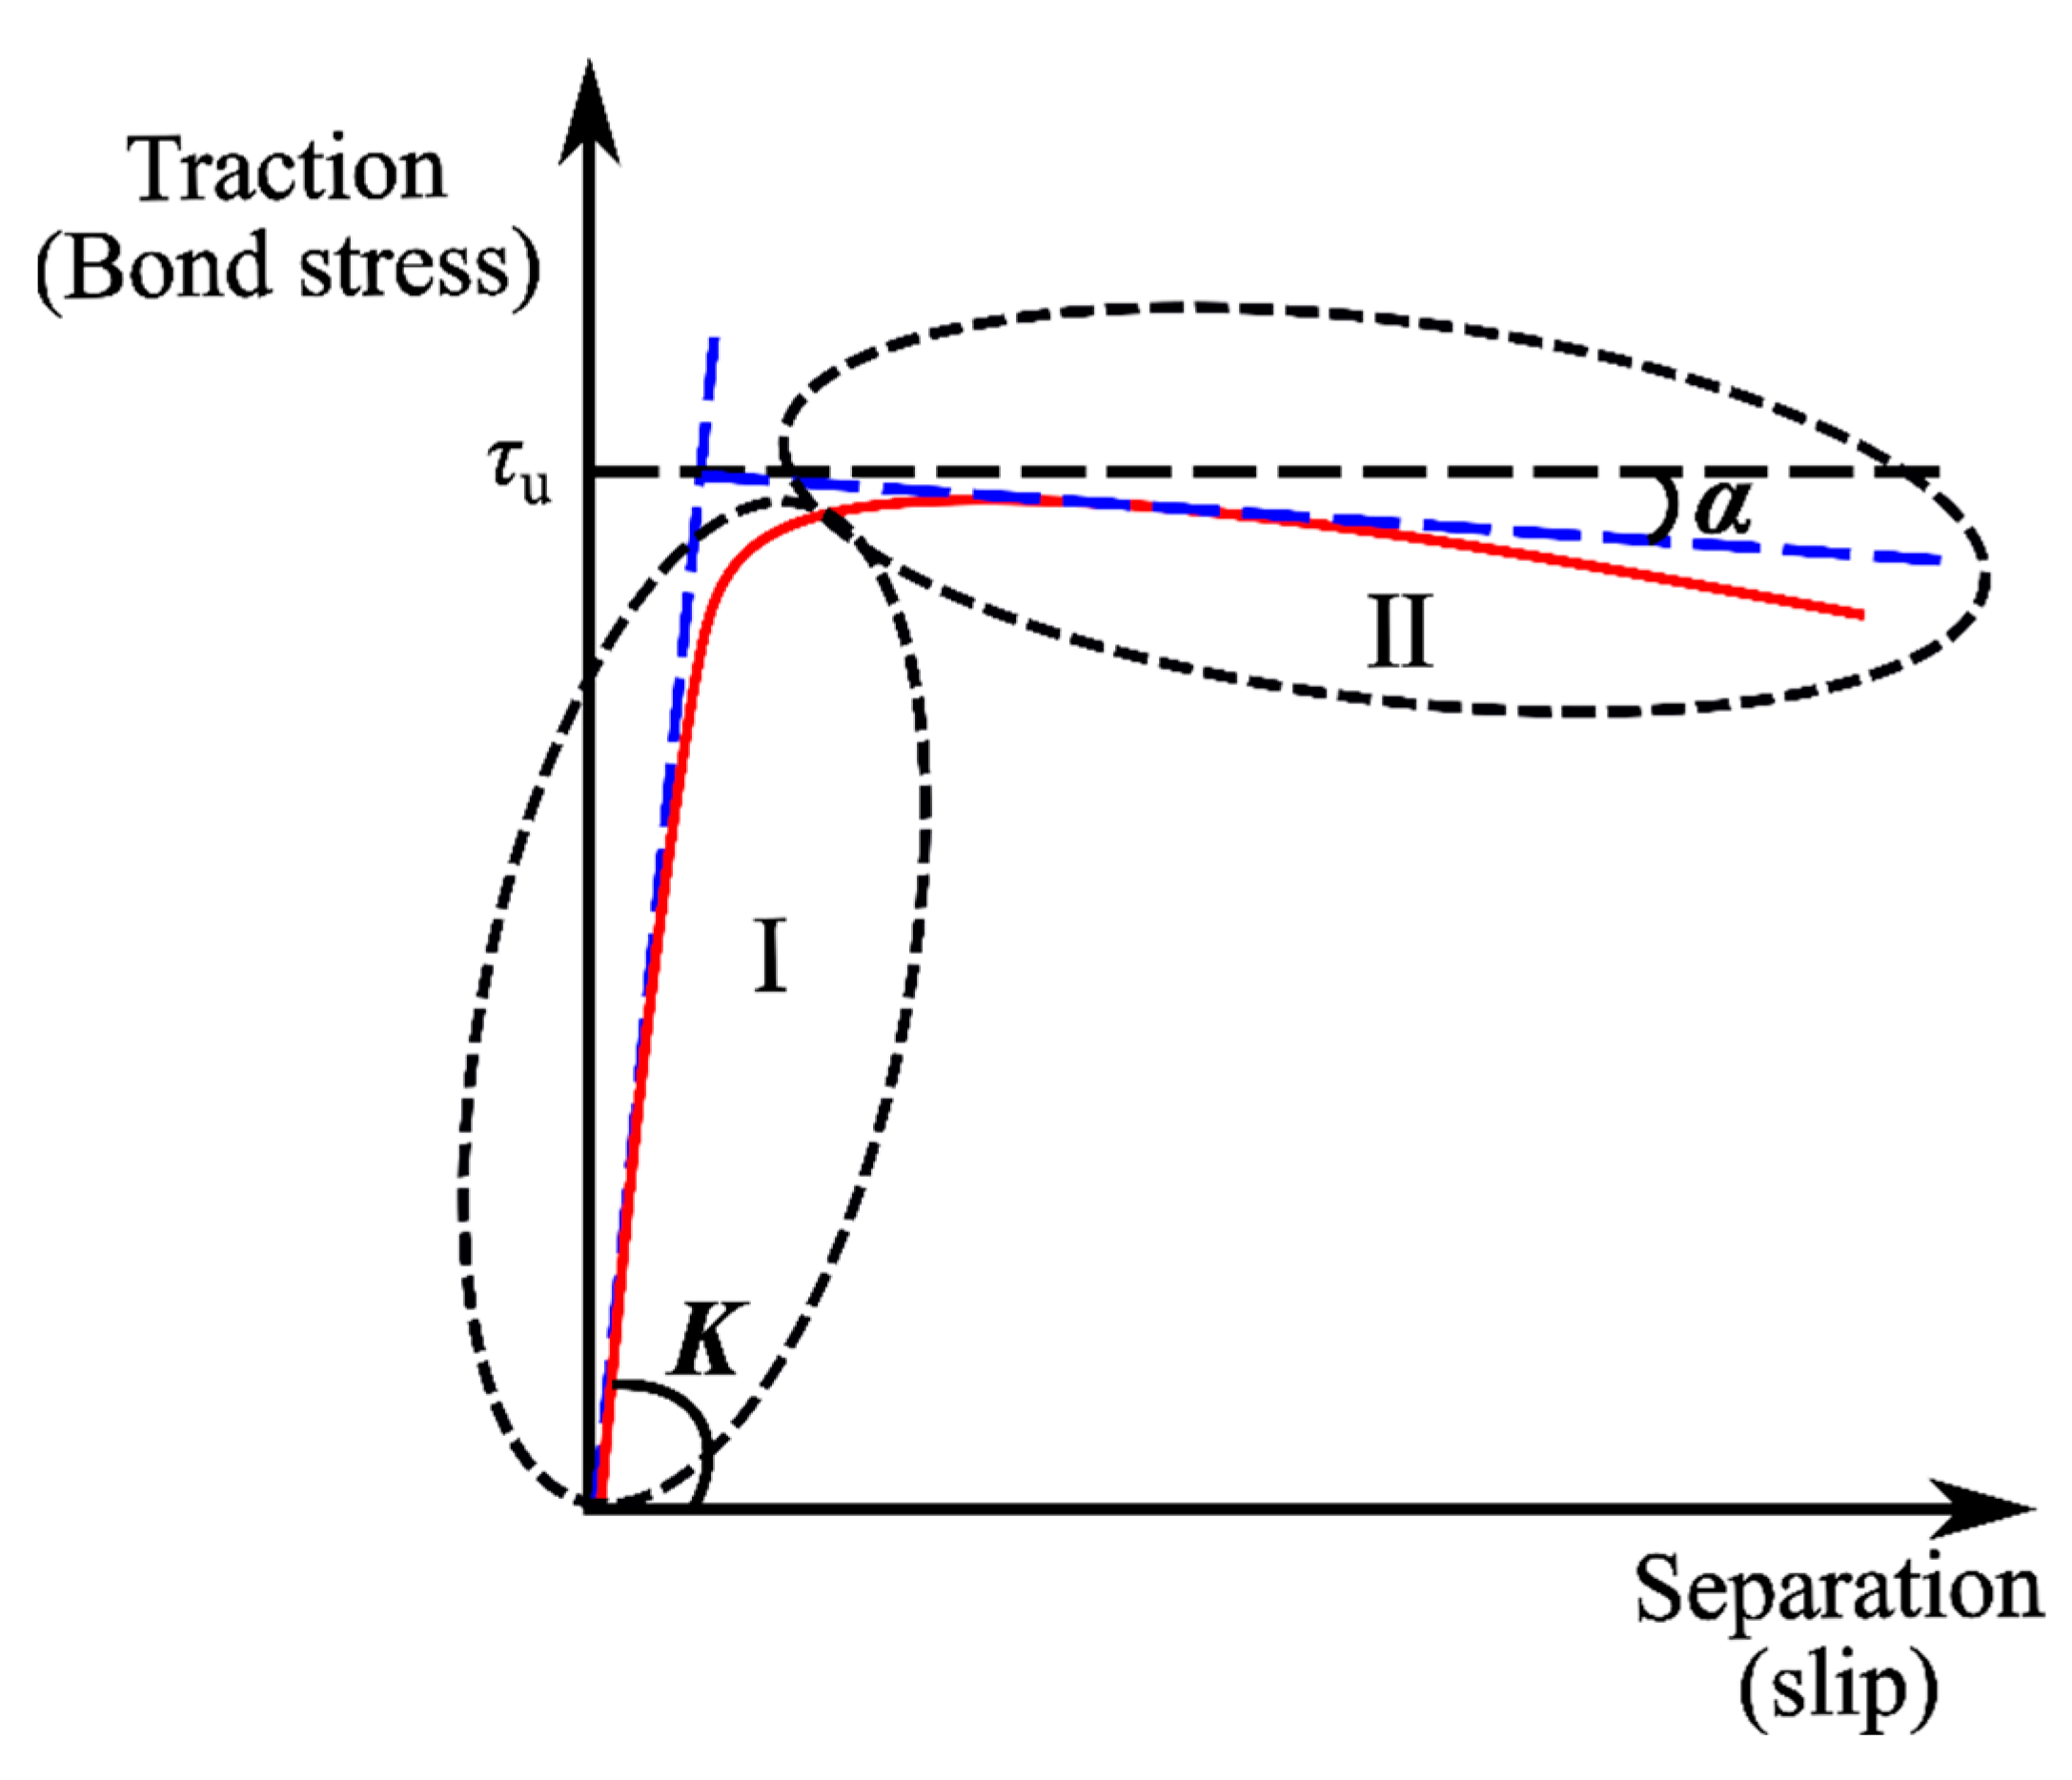
Figure 1a) was assigned in the FEM. The surface-based cohesive contact with the traction-separation model available in the ABAQUS library was assigned, as illustrated in
Figure 5. This model assumed a linear bond behavior with a constant shear modulus
K prior to the bond strength
τu, which was defined as stage I. Once the maximum bond stress was reached, this was regarded as the loss of the bond, while the damage criterion was met based on a user-defined damage-evolution law [
13]. After the peak point, the curve decreased with a slope of
α.
For stage I, an elastic constitutive matrix, expressed in Equation (14), was adopted to illustrate the relationship between the normal (
τn) and tangential (
τs,
τt) stresses (tractions) and the normal (
δn) and tangential (
δs,
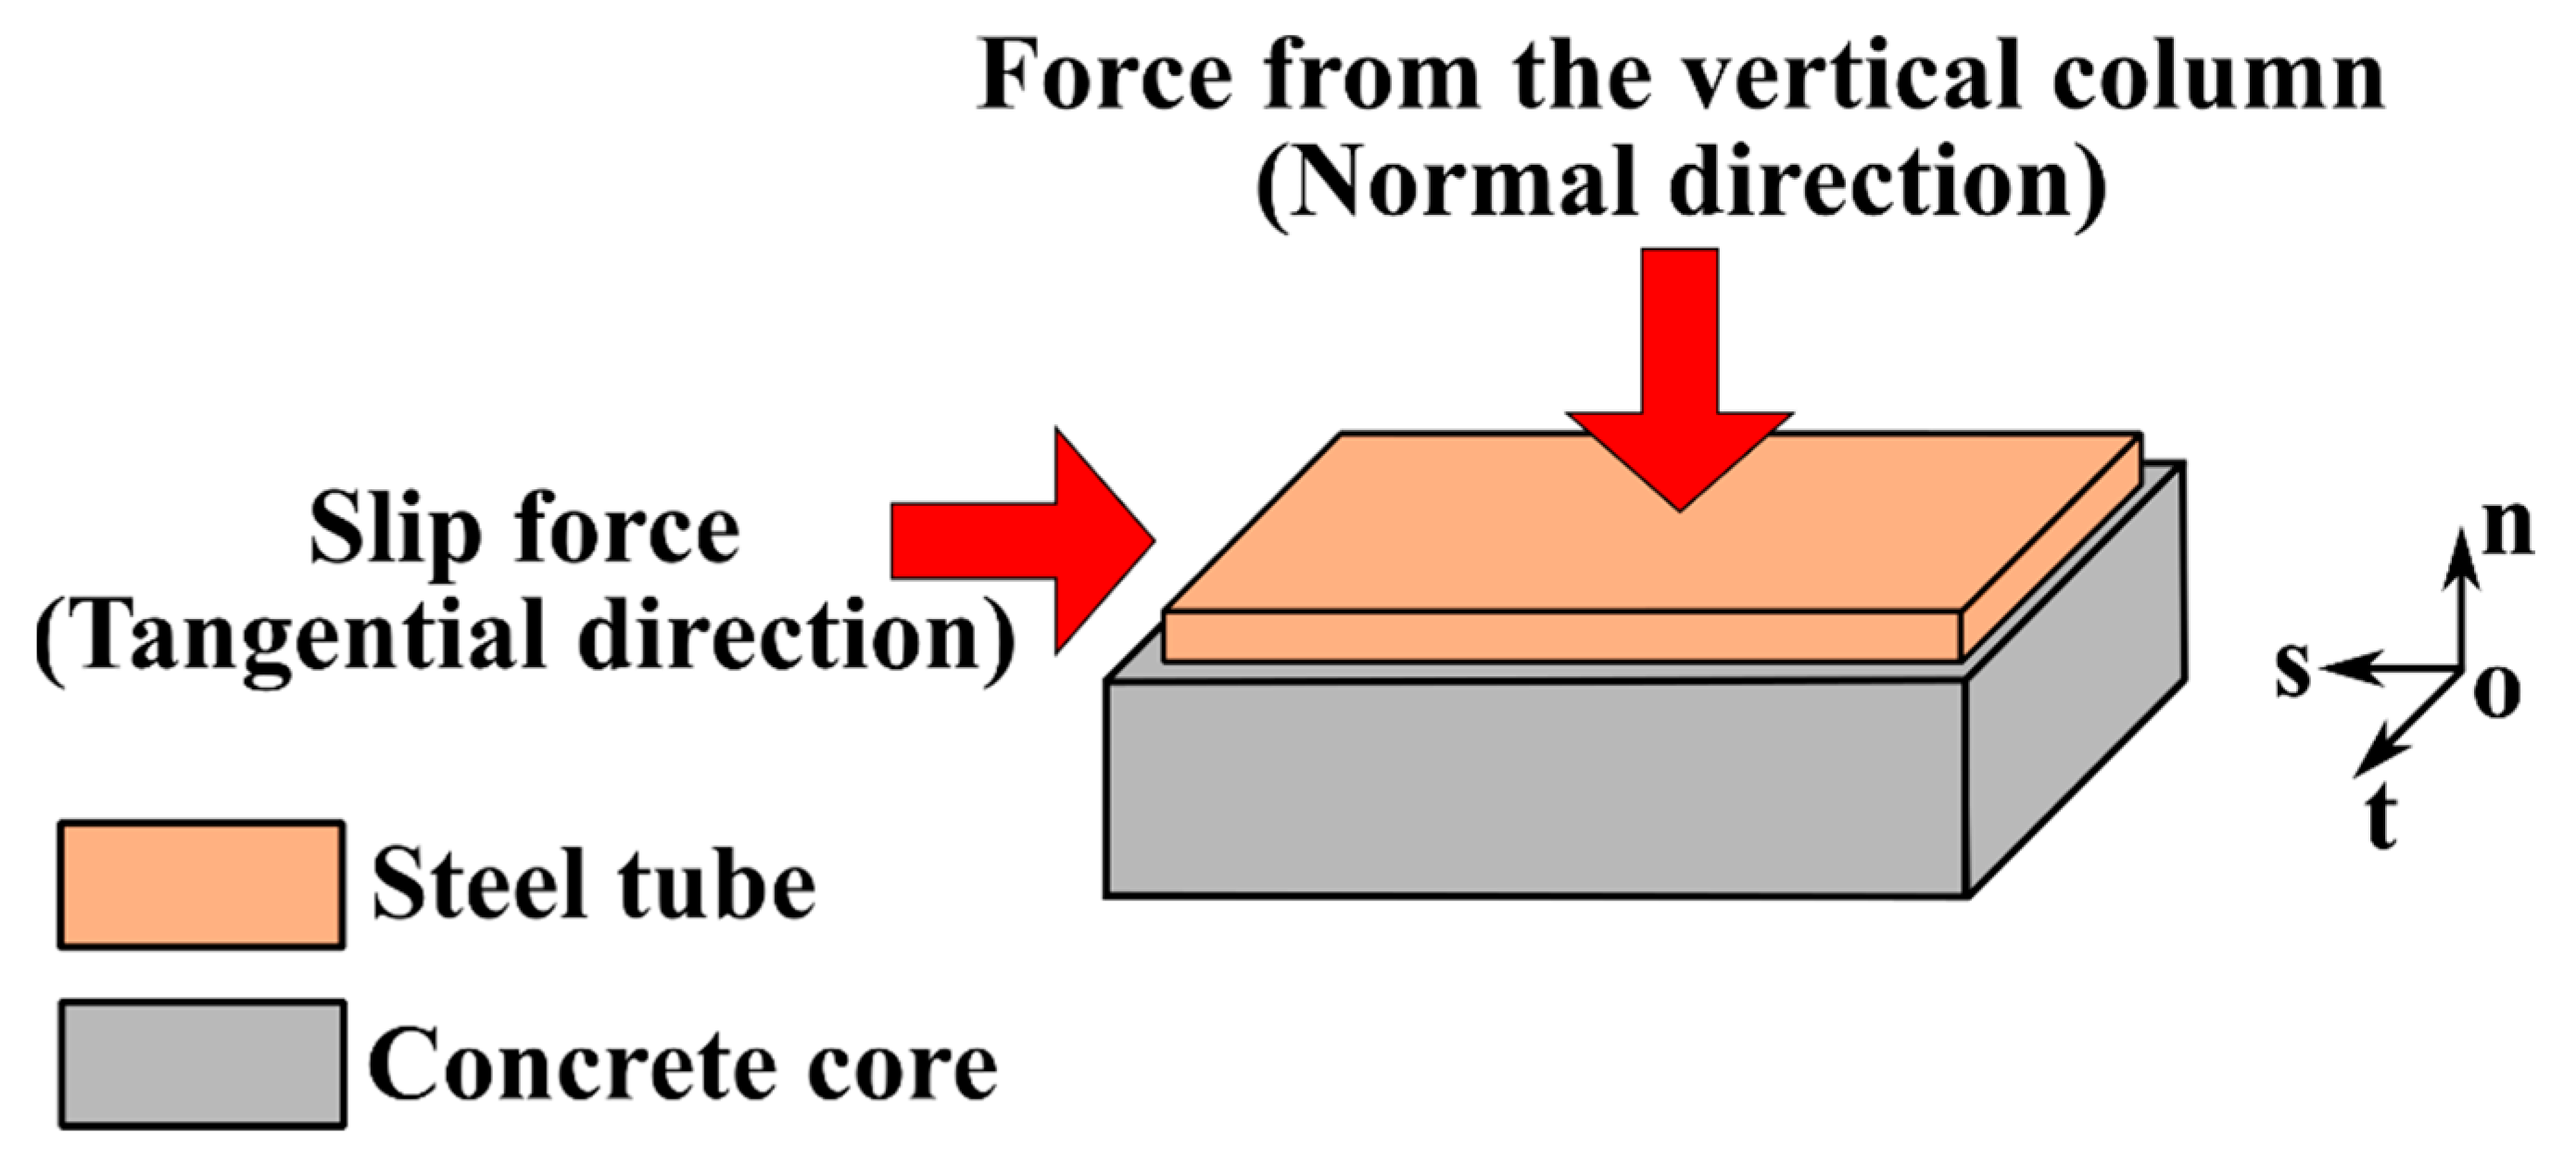
δt) slips at the steel–concrete interface. It was assumed that the bond stresses in three principal directions (see
Figure 6) at the steel–concrete interface were uncoupled.
where
knn,
kss, and
ktt are the initial stiffnesses in the
n,
s, and
t directions, respectively, taken as
knn =
kss =
ktt = 500 N/mm
3, in accordance with [
7].
The loss of the bond was considered when the following maximum-stress criterion was reached:
where
is the bond strength in the normal direction, taken as 0.6 MPa, in accordance with [
13];
and
are the bond strengths in the two tangential directions, which can be conservatively taken as the minimum design value of the bond strength of 0.23 MPa specified in DBJ/T13-51-2010, as listed in
Table 2.
The hard-contact behavior in ABAQUS was employed to the steel–concrete interface in the normal direction, which means that only separation from each other was allowed. For stage II, the value of
α was taken as -0.014, as recommended by [
13]. For the boundary conditions, fixed support (U
x = U
y = U
z = UR
x = UR
y = UR
z = 0) and pin support (U
y = U
z = 0) were employed to ends A and B, respectively. According to the numerical analysis of the whole bridge based on the software Midas Civil, the shear force at the joint (Δ
V) of 2249 kN and the axial force on the CFST arch rib (
Nx) of 24,888 kN under the most unfavorable loading conditions were derived and applied to the FEM in
Figure 4. The FEM in this section was developed and validated according to [
13].
3.3. Discussion on the FEM Results
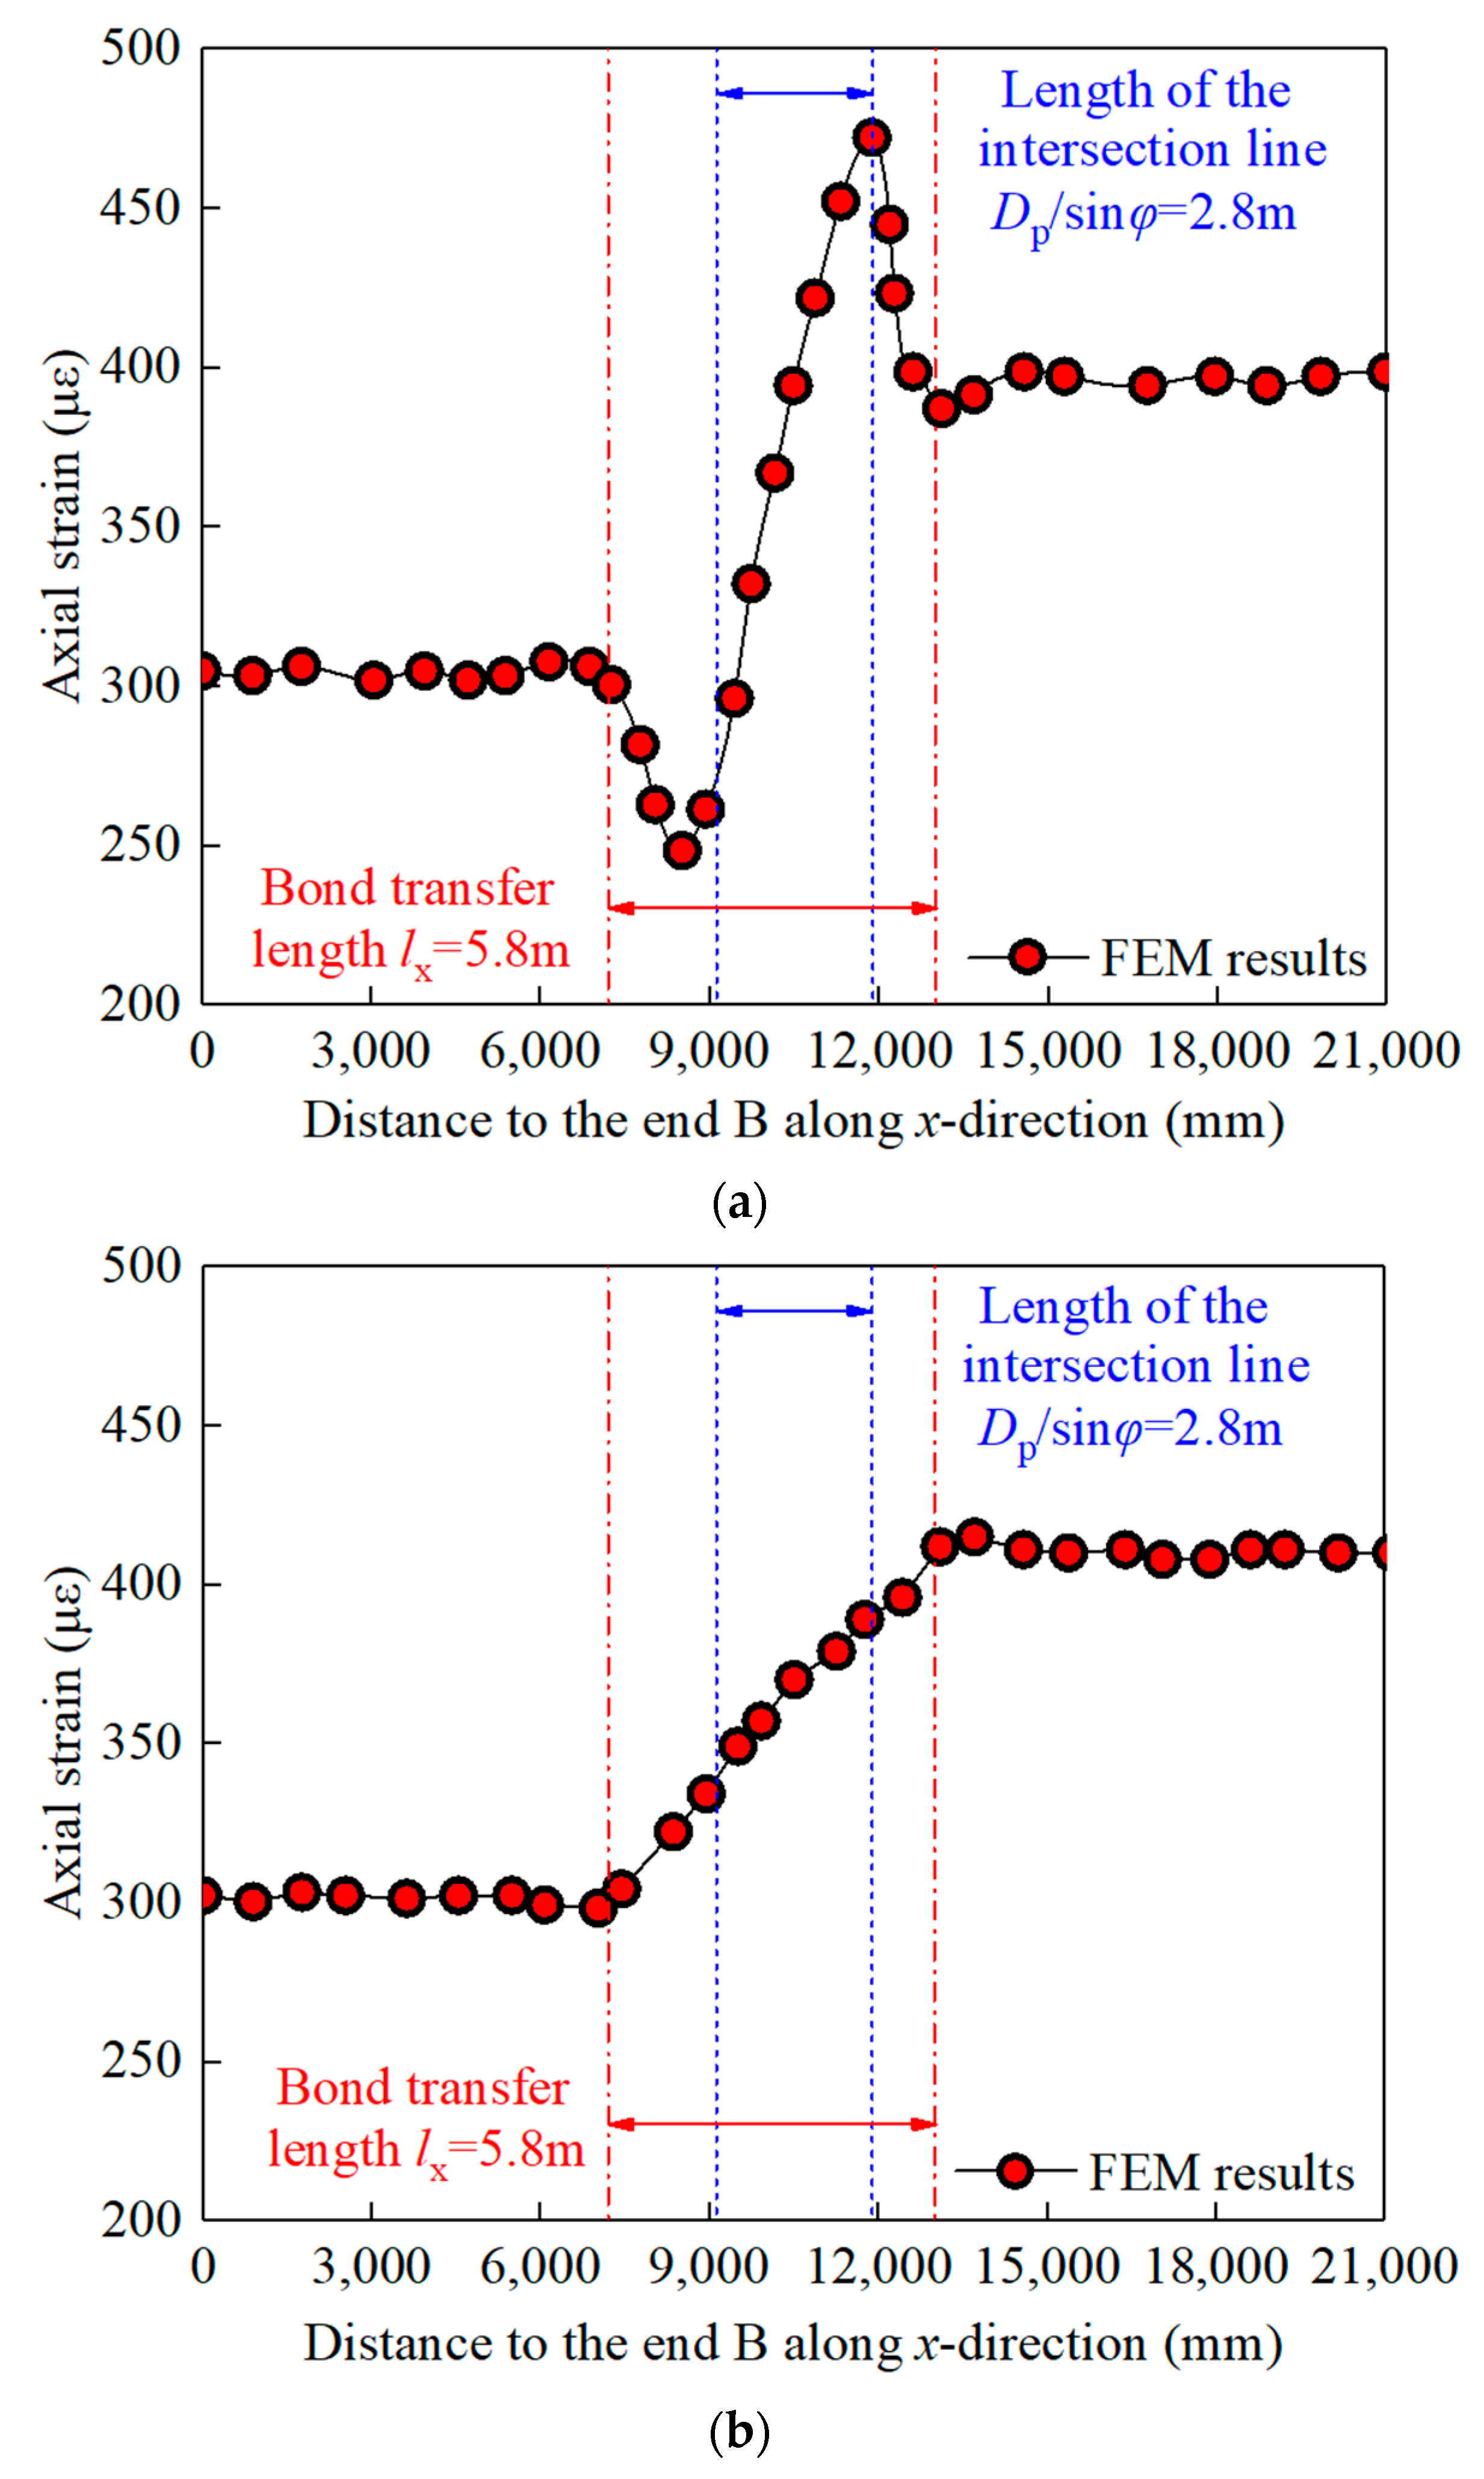
Figure 7 shows the FEM results for the axial strain in the
x-direction. It can be observed that the FEM results generally coincided with the analytical results, as shown in
Figure 2. For the right side of the vertical column, the same calculated compressive strains of 300 με were found for both the steel tube and the concrete core, which indicated that they worked together to resist the axial force,
Nx. Furthermore, it was found that the bond-transfer length of 5.8 m was greater than the length of the intersection line, of 2.8 m, which demonstrated that the load transfer initiated at the location above the joint. Taking account of the bond stress, the compressive strain of the steel tube initially decreased and then increased, because the superposed compressive force was directly applied to the outer surface of the steel tube. For the location away from the joint, the compressive strain of the steel tube decreased and then tended to be a specific value. For the concrete core, the compressive strain increased due to the bond stress and then tended to be a specific value. It also should be noted that the region of the load introduction had symmetric distances above and below the joint. This conclusion can also be found in
Figure 8.
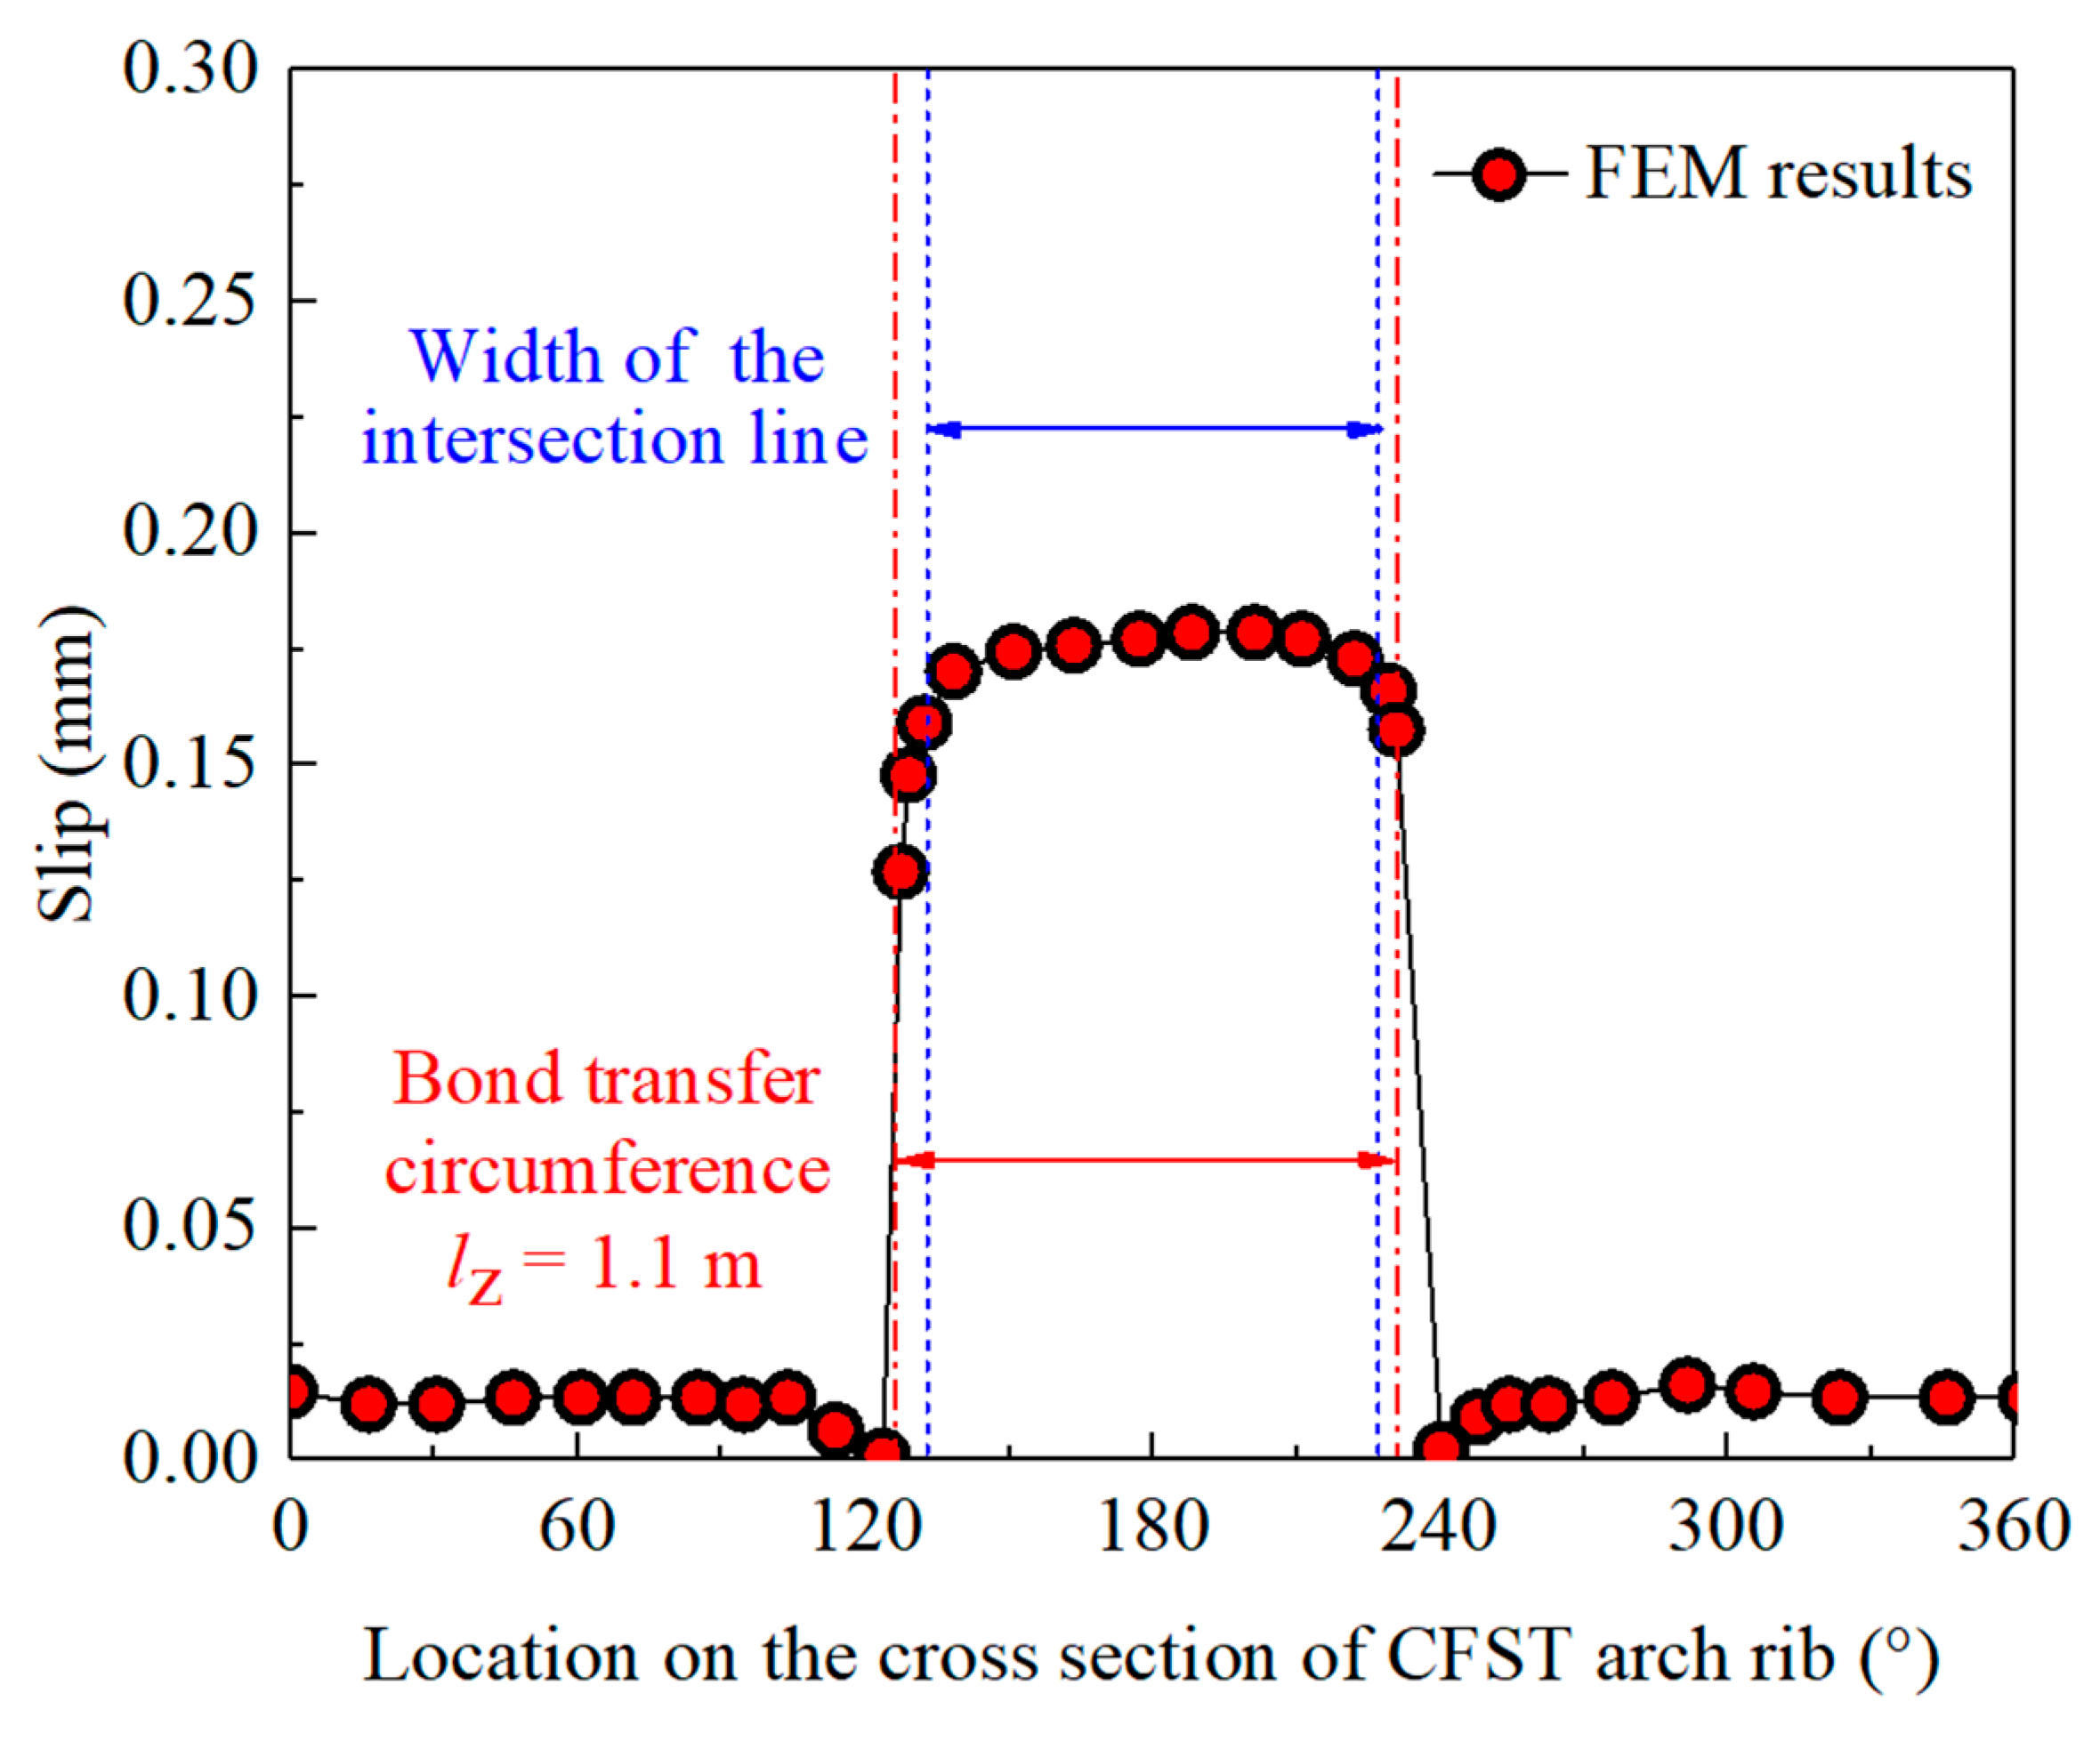
Figure 9 shows the FEM results for the steel–concrete interface slip along the middle section of the CFST arch rib, where the abscissa indicates the location on the cross-section of the CFST arch rib, as shown in
Figure 4. It can be observed that the calculated bond-transfer circumference was 1.1 m, which was approximately equal to the width of the intersection area. Therefore, the bond-transfer circumference
lz was assumed as the width of the intersection area.
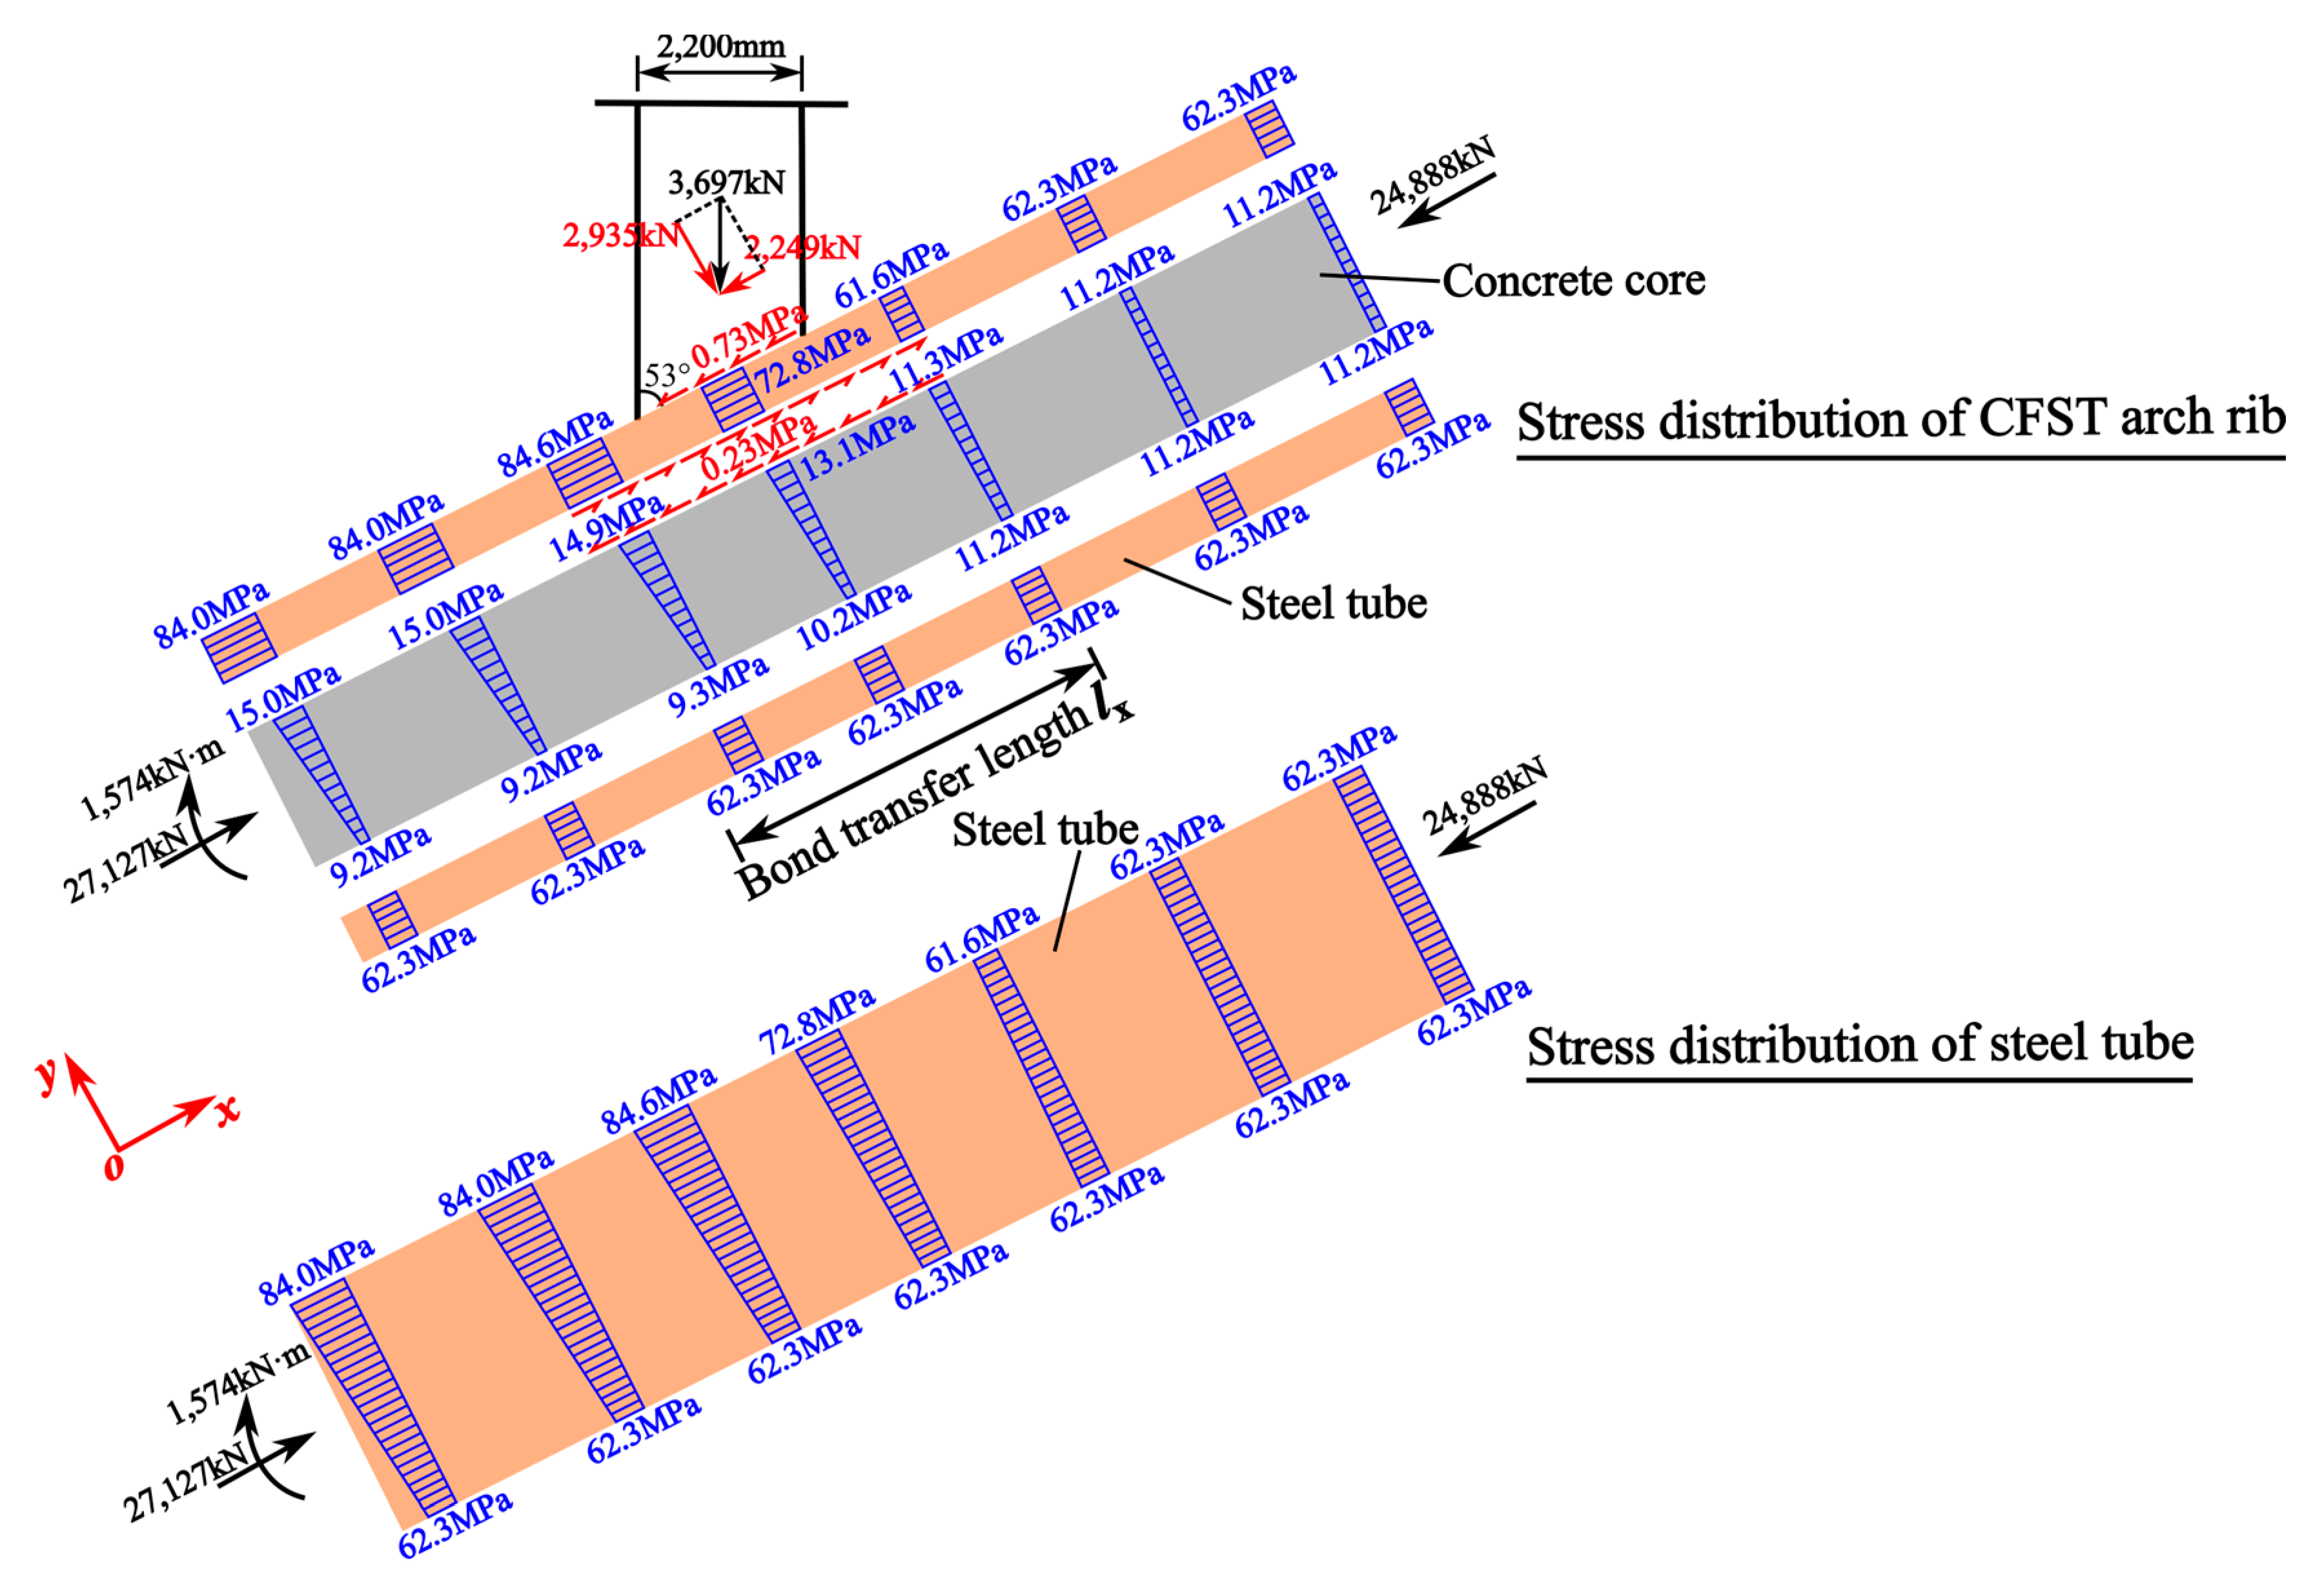
Through Equations (1)–(13), the force–equilibrium relationship for the load transfer in the typical joint in Shuangbao Bridge was obtained, as depicted in
Figure 10. Based on the known parameters
τd = 0.23 MPa and
lz = 1.1 m, the bond-transfer length can be calculated according to Equations (4)–(6).
According to Equation (16), the theoretical bond-transfer length was 5.6 m, which essentially coincided with the FEM result of 5.8 m. This indicated that the load-transfer model in
Figure 2 can effectively predict the practical situations.


 ,
, 


