1. Introduction
A large number of expressways in China were constructed 20 years ago, and some need to be reconstructed and extended in order to service currently increasing traffic volumes. In order to ensure the normal operation of the social economy, uninterrupted existing traffic has become the most basic requirement for expressway reconstruction and extension [
1]. Many expressway lines, such as the Mao-zhan Expressway in Guangdong Province, are facing similar problems. Due to the rich river system in Guangdong Province, a large number of short-span and medium-span bridges exist on the operating lines. Splicing of new, widening bridges and existing old bridges needs to be carried out without interrupting traffic. The main girder structure of the existing old bridge would appear to have random flexural deformation under the influence of vehicle–bridge coupling vibration, while the main girder of the new bridge would remain relatively static [
2]. This would cause obvious vibration deformation differences at the splicing position [
3,
4]. The initial damage to the concrete materials would be caused due to differential vibration in pouring the concrete at the splicing position; thereby, the service performance of the splicing structure would be affected. Therefore, anti-differential disturbance concrete (ADC) materials suitable for short-span and medium-span widening bridges are necessary to be developed, and experimental research on the material properties of ADC should be carried out as well.
Several researchers have investigated the mechanical behavior of concrete after vibration disturbance. Hong et al. conducted laboratory experiments to study the influence of vibration on early-age concrete, and the test results showed that vehicle-induced vibration will not affect concrete compressive strength if the vibration duration is less than 6 h and the vibration amplitude is less than 30 mm/s [
5]. Zhang et al. proposed new systematic test equipment to simulate the vehicle–bridge coupling effect on early-age concrete, and that test indicated that anti-cracking fiber and self-healing admixture have improved the vibration resistance ability of concrete and that the sand percentage and maximum aggregate size will greatly affect the test result [
6]. It can be learnt from these test results that vibration has a negative effect on certain aspects of material properties. Due to these reasons, several types of high-performance concrete have been developed to resist disturbance [
7,
8,
9]. The influence of vibrations on the mechanical properties of high-performance mortars for bridge repair was analyzed by Fossetti M. [
10], and the test results also showed that their compression behavior deteriorated after the simulation vibration. However, tensile strength would not be affected by vibration due to the good tensile properties of the fiber in the concrete. Thus, high-performance concrete with the ability to resist disturbance should be developed, and its material properties should be studied as well.
Based on the practical bridge engineering of the Mao-zhan Expressway Reconstruction and Extension Project, anti-differential disturbance materials for splicing widening bridges without interrupting traffic were developed. A representative widening bridge case was selected to be monitored. The differential vibration characteristics of the new and old bridges on both sides of the splicing position were continuously measured. The measured vibration amplitude and vibration frequency data provided technical indicators for development of anti-differential disturbance concrete. According to the performance requirements of ADC, normal-type anti-differential disturbance concrete (NADC) and high-performance anti-differential disturbance concrete (HPADC) were developed. In order to study the material properties of ADC under vehicle–bridge coupling vibration, an experimental device for simulating differential vibration was designed according to the structural characteristics of the splicing positions. Experiments were carried out on specimens made with standard molds and integral plate molds. The mechanical properties of ADCs with different disturbance degrees were tested. The compressive strengths, flexural tensile strengths, shrinkage characteristics, ultrasonic velocity and other mechanical properties were compared.
In the traditional material development process, bridge vibration characteristics are obtained with theoretical calculation. The ADC material proposed in this paper was fully developed on the basis of measured bridge vibration characteristic data, which is more suitable for practical use in short-span and medium-span bridges of expressway reconstruction and extension projects. In addition, the experimental device in this paper was designed according to the actual splicing structure of the widening bridge. The simulation of differential disturbance of concrete materials was realized with an experimental device with a fixed pedestal and a vertical shaking table. Additionally, the material properties of specimens with different disturbance degrees can also be tested using the experimental device proposed in this paper. Compared with the shortcoming that traditional tests can only use a fixed vibration frequency or vibration amplitude for repetitive tests, the test method recommended in this paper is more innovative. Finally, the anti-differential disturbance concrete developed in this paper can meet the application requirements of splicing structures of reconstructed and expanded bridges, which is more practical.
2. Measurement of Widening Bridge Vibration Characteristics
In order to study the material properties of anti-differential disturbance concrete, it is necessary to obtain the bridge vibration parameters that need to be endured during its use process [
11]. A typical case of a bridge reconstruction and expansion project was selected for testing. The vibration amplitude and frequency at the splicing position of a widening bridge can be obtained from this test [
12,
13].
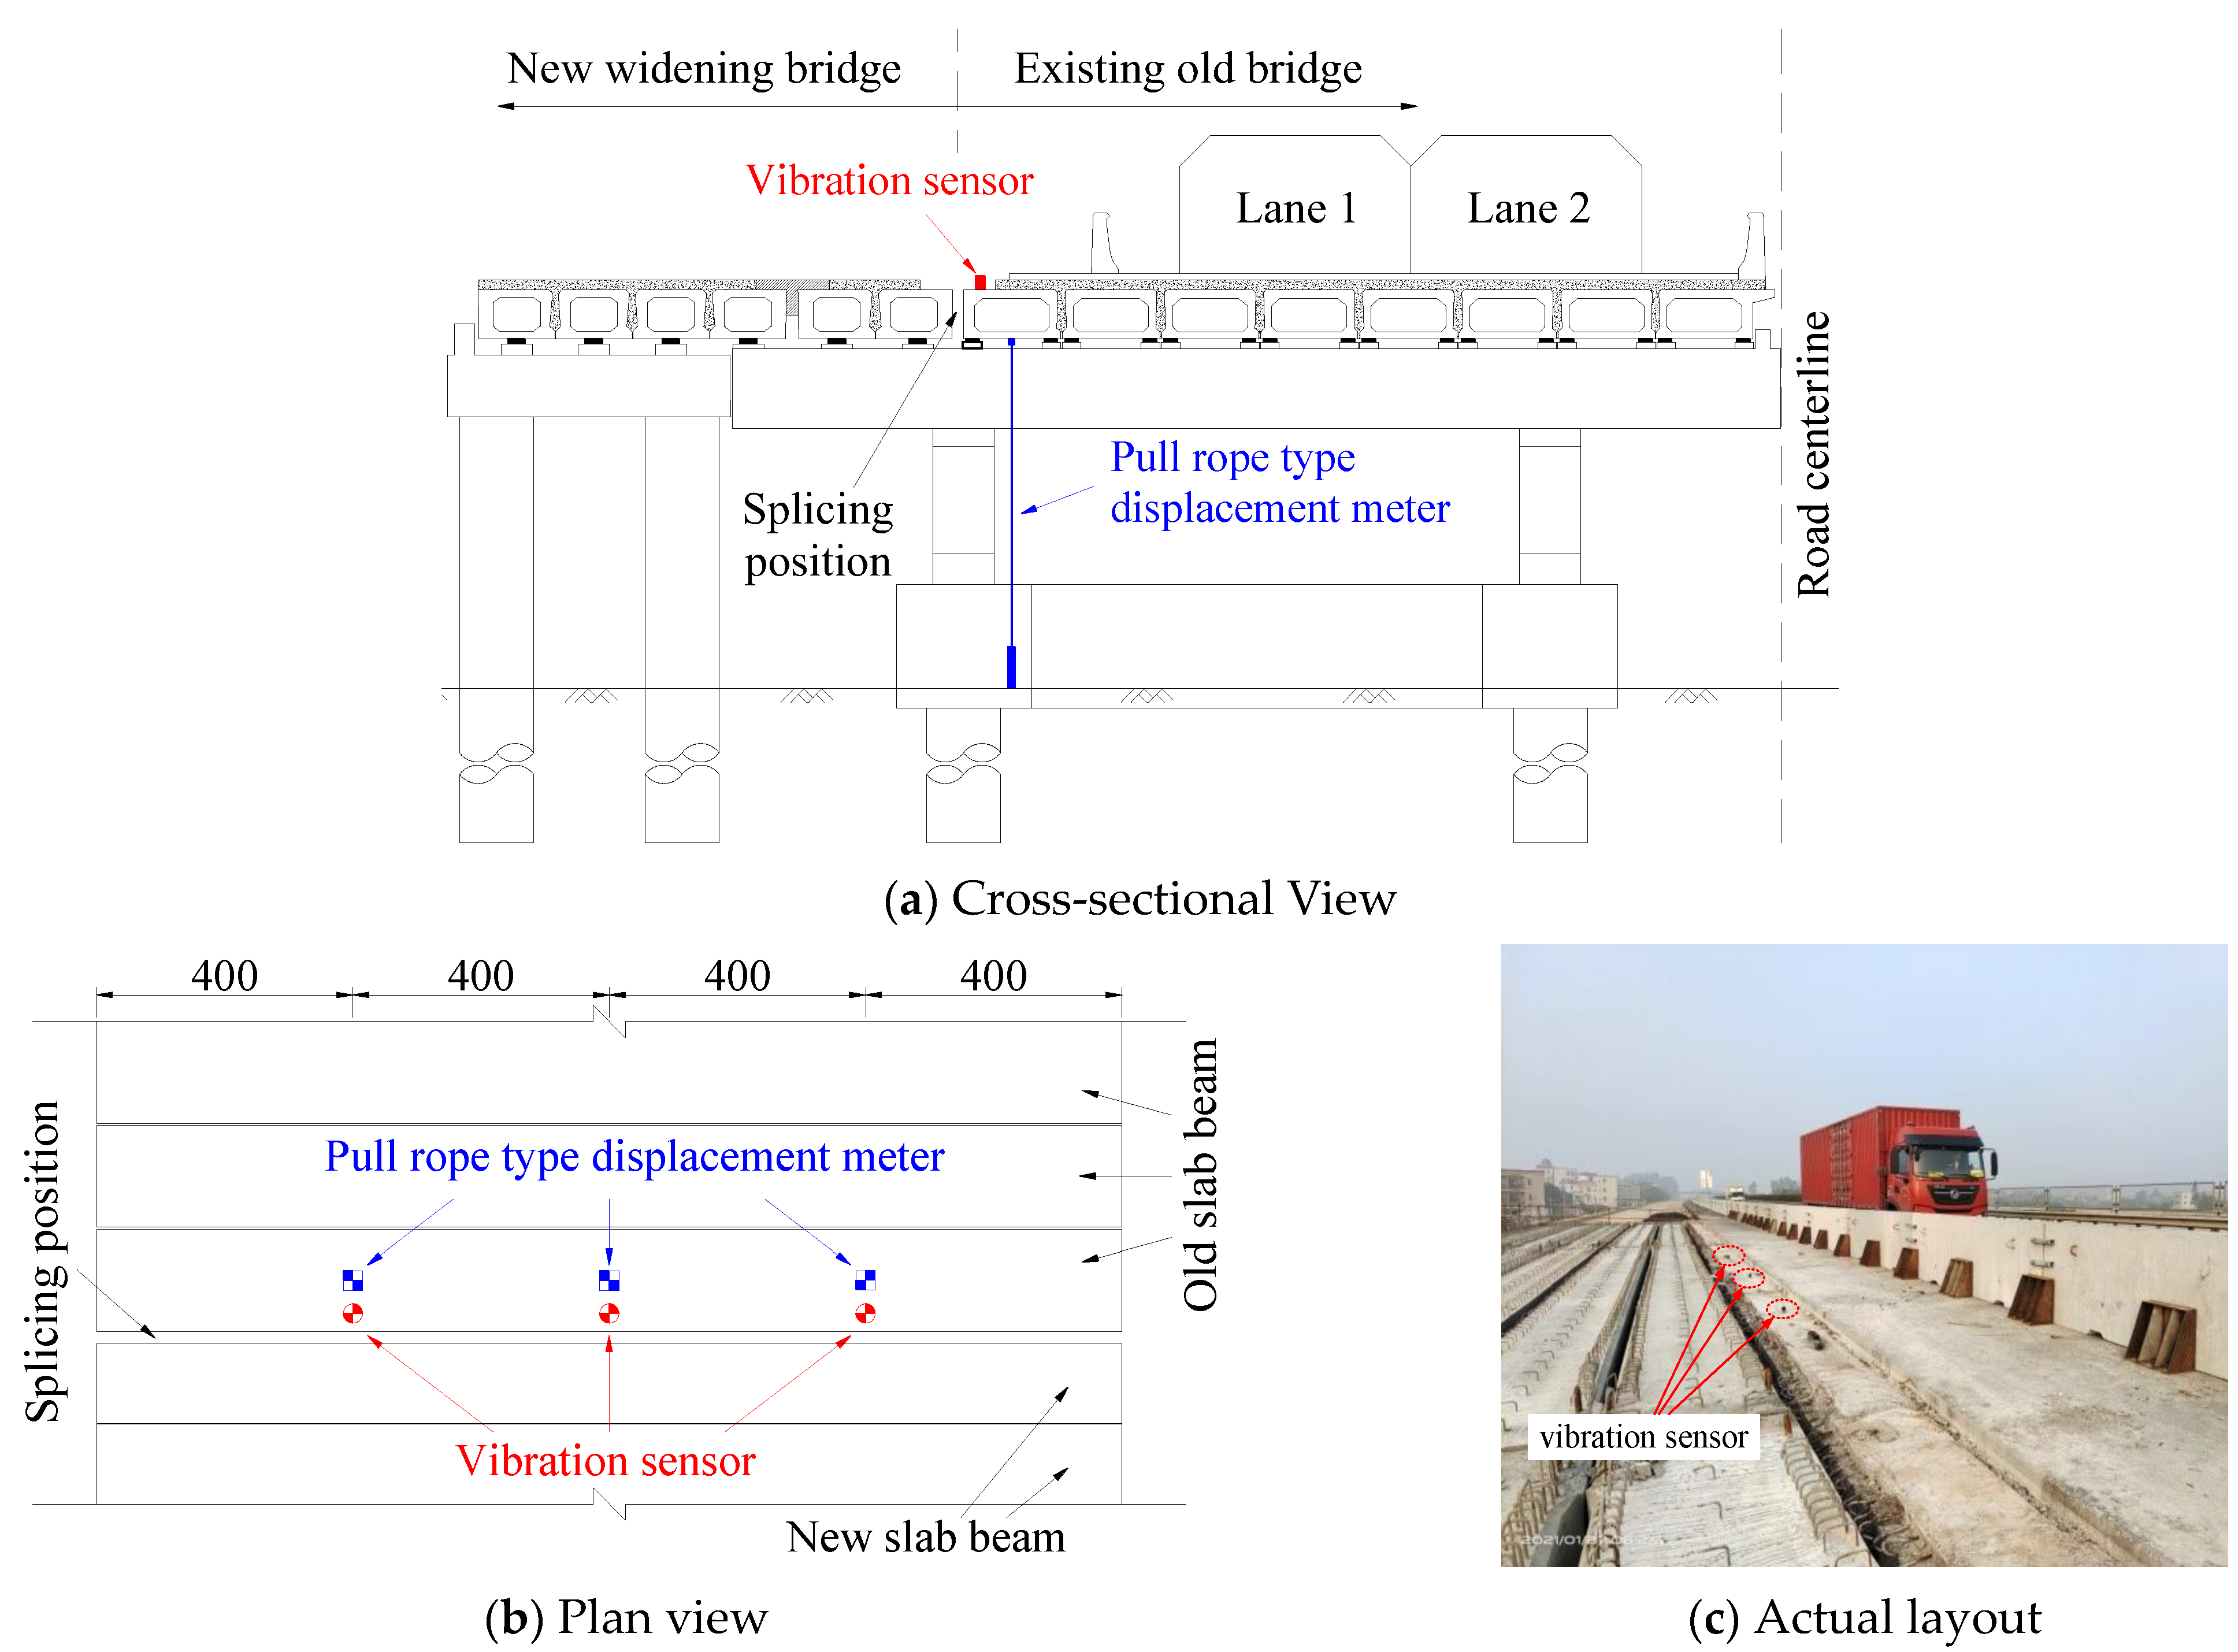
2.1. Arrangement of Measuring Points
The K3387 + 424.551 middle bridge on Shen-Hai Expressway was selected for testing. The total length of the bridge is 68.04 m. The superstructure of the tested bridge is a four-span, 16 m, simply supported hollow slab beam, and its substructures are double-column piers and pier–column abutments. The monitoring test lasted for 48 h in total. The main parameters of this test included the natural frequency of the bridge structure and the dynamic deflection and acceleration at the location of the measuring point.
The measuring point was arranged on the boundary beam of the K3387 + 424.551 middle-span bridge, as shown in
Figure 1. A total of three sets of test equipment were adopted and were located at the
l/4,
l/2 and 3
l/4 positions of the boundary beam.
A pull-rope-type displacement sensor was applied for dynamic deflection measurement. The vertical vibration was measured with an 891-2 vibration sensor, and the sampling frequency was 50 Hz.
2.2. Analysis of Bridge Dynamic Characteristics
The fast Fourier transform was adopted to perform time-frequency transform domain analysis on the field measurement data, and the transformation result is shown in
Figure 2. It is known from the related calculation and analysis that the measured first-order vertical natural frequency of the K3387 + 424.551 middle bridge on Shen-hai Expressway was 8.496 Hz.
Based on continuous monitoring data, the maximum peak deflection value per half hour was selected. The selected values were regarded as the representative values of the dynamic deflection in the corresponding time period for comparison, as shown in
Figure 3. It can be seen from the monitoring results that the peak dynamic deflection at each measuring point has obvious random distribution characteristics. The peak value of dynamic deflection on 27 January was 0.923 mm, and that on 28 January was 1.085 mm. The average value of the mid-span deflection peak in each time period was 0.564 mm. The peak deflections at l/4 and 3l/4 of the tested bridge were slightly smaller than those at the mid-span of the bridge.
Similarly, the vibration acceleration peak value at every half hour was selected, as shown in
Figure 4. It was adopted as the representative value of acceleration in this period for comparison. The tested peak vibration acceleration was 1.302 m/s
2 on 27 January and 0.763 m/s
2 on 28 January. The average peak acceleration of each time period in the mid-span of the bridge was 0.487 m/s
2.
3. Experimental Design
3.1. Experimental Device and Simulation of Differential Vibration
Due to the existence of vehicle–bridge coupling vibration, obvious nonlinear vibration deformation exists in the superstructure when a vehicle travels on the bridge. When bridge splicing is carried out without interrupting the traffic on the old bridge, the traffic on the old bridge will operate normally, while there will be no vehicles on the new bridge. This results in differential vertical vibration deformation existing in the splicing connection position of the widening bridge. This further affects the performance of newly poured concrete in the splicing position. Thus, two types of anti-differential disturbance concrete material were developed.
In order to study the material properties of ADC, a differential-disturbance-simulation experimental device was designed, as shown in
Figure 5a. The test device consisted of a fixed pedestal, a vertical shaking table and a concrete integral plate mold. This experimental device can be applied to simulate differential deformation of widening bridges under vehicle–bridge coupling vibration. The concrete mold is used to simulate the splicing position of a widening bridge. The fixed pedestal and the vertical shaking table were, respectively, adopted to simulate a new widening bridge and an old existing bridge in the bridge-widening project.
The fixed pedestal and the vertical shaking table were both fixed on the laboratory floor. The distance between the two devices was 0.45 m. The vertical shaking table had the same height as the top surface of the fixed pedestal when the vertical shaking table was not operating.
The two ends of the concrete integral plate mold were, respectively, located above the vertical shaking table and the fixed pedestal. The concrete mold was bolted to the experimental device. When the vertical shaking table started shaking, vertical displacement occurred in the concrete mold section above the shaking table (vibration segment in
Figure 5b). The concrete mold section above the fixed pedestal (static segment in
Figure 5b) remained static. Differential vibration deformation of a concrete test mold between the shaking table and the fixed table existed in the concrete mold section between the shaking table and the fixed pedestal (disturbance segment in
Figure 5b).
3.2. Concrete Mix Proportion
Based on the differential vibration characteristics at the splicing position of the widening bridge, the normal-type anti-differential disturbance concrete (NADC) and the high-performance anti-differential disturbance concrete (HPADC) were developed.
The mix proportions of the NADC are shown in
Table 1.
Portland cement of P·II 52.5 grade was used as the cement material, and the grade classification met the requirements of Chinese standard GB 175-2007 [
14]. The physical properties of the cement were tested according to Chinese standard JTG 3420-2020 [
15], and the ignition loss of the cement was tested according to Chinese standard GB/T 176-2017 [
16]. The main performance parameters of the adopted cement are shown in
Table 2.
In addition, the chemical composition of the cement was tested as well. The test results for the chemical composition are shown in
Table 3.
Natural river sand was adopted in the NADC. The technical requirements of the sand were Type 2, which was classified according to Chinese standard GB/T 14684-2011 [
17]. The specification of the sand was medium, and the fineness module was 2.4. The type of stone was crushed rock, and the grain diameter was 5~20 mm. The water adopted was natural drinking water. The superplasticizer was high-performance polycarboxylate superplasticizer, and the solid content was 20%.
- 2.
The HPADC consisted of powder, steel fiber and water.
The mix proportions of the HPADC are shown in
Table 4. The powder adopted was a special mixture with patent protection. The steel fiber was end-hooked, with a diameter of 0.5 mm and a length of 25~35 mm.
The main performance parameters of the HPADC, such as slump flow and setting time, were tested according to Chinese standard JTG 3420-2020 [
15]. The test results of the main performance parameters are shown in
Table 4.
3.3. Classification of Specimen
In order to study the material performance of anti-differential disturbance concrete, the NADC and the HPADC were adopted as pouring specimens. One contrast specimen and several vibrationally disturbed specimens were set up in each experiment. The classification of the specimens is shown in
Table 5.
The NADC-0-0 specimen group, the HPADC-0-0 specimen group, the NADC-3-6 specimen group and the HPADC-3-6 specimen group were made with a standard mold. Each group contained three compressive-strength specimens, three splitting tensile-strength specimens, three flexural tensile-strength specimens and three specimens for testing the shrinkage of the ADC. The sizes of the concrete compressive-strength specimen and the splitting tensile-strength specimen were 100 mm ×100 mm × 100 mm, the size of the flexural tensile-strength specimen was 100 mm × 100 mm × 400 mm, and the size of the specimen for testing the shrinkage of the ADC was 100 mm × 100 mm × 515 mm.
The NADC1-3-6~NADC3-3-6 series specimens and the HPADC1-3-6~HPADC3-3-6 series specimens were integral plate specimens. The inner size of the integral plate mold was 140 cm in length, 70 cm in width and 10 cm in thickness. For the purpose of studying the influences of different disturbance degrees on the mechanical properties of anti-differential disturbance concrete, the cutting area was selected from the static segment (specimens NADC1-3-6 and HPADC1-3-6), the disturbance segment (specimens NADC2-3-6 and HPADC2-3-6) and the vibration segment (specimens NADC3-3-6 and HPADC3-3-6) of the integral plate specimen, as shown in
Figure 6.
The NADC integral plate specimen, after cutting, contained three groups of specimens. Each group of NADC cutting specimens contained three compressive-strength specimens, three splitting tensile-strength specimens and three flexural tensile-strength specimens. Similarly, the HPADC integral plate specimens also included three groups of specimens, while each group of HPADC cut specimens only contained three compressive-strength specimens and three flexural tensile-strength specimens.
The integral plate specimens were cut according to the specimen size requirements of different concrete performance tests. The sizes of the different cut specimens were the same as those of the contrast specimen group and the disturbed specimen group.
3.4. Instrument Parameters and Test Conditions
A full-function, microcomputer-controlled vertical shaking table (Yihua
® ZD/YH-F, Shanghai Yihua Climate Simulation Equipment Co., Ltd., Shanghai, China) was adopted in the designed differential-disturbance-simulation experimental device, as shown in
Figure 7. The mesa size of the shaking table was 60 cm × 60 cm. The maximum load of the instrument was 400 kg. The amplitude range of the instrument was 0~10 mm, and the vibration frequency range was 0~999 Hz.
In order to simulate the actual vibration status of a widening bridge under the circumstance of vehicle–bridge coupling vibration, the vibration frequency and amplitude for this experiment were selected according to the analysis results of bridge dynamic characteristics. It can be learnt from the actual vibration test results for the K3387 + 424.551 middle bridge and other similar engineering cases [
18,
19,
20] that the vibration amplitude of this type of bridge is generally in the range of 0 mm~4.0 mm, the vibration frequency is generally less than 12 Hz and high-frequency vibrations are less likely to occur. Thus, considering the randomness of vehicles passing on the bridge, the vertical vibration amplitude adopted in this experiment was 3 mm and the vibration frequency adopted was 6 Hz.
The vibration mode of pausing for 45 s after vibration for 15 s was adopted to simulate bridge vibration regulation in this experiment. The forming time of the concrete was regarded as the starting time of the vibration simulation during this test. The duration of a single vibration simulation was 18 h.
Specimen groups NADC-0-0, HPADC-0-0, NADC-3-6 and HPADC-3-6 were directly fixed on the vertical shaking table to withstand the vehicle–bridge coupling simulation disturbance, as shown in
Figure 7. The simulating differential disturbances of specimens NADC1-3-6~NADC3-3-6 and HPADC1-3-6~HPADC3-3-6 were applied by the proposed experimental device in
Figure 5. After the differential disturbance simulation was completed, each specimen was maintained for 28 days. The integral plate specimens were cut according to the requirements of different testing purposes after maintenance.
Mechanical performance tests were conducted on the cut specimens according to relevant test methods specified in Chinese standard GB/T 50081-2019 [
21]. The compressive-strength test and the splitting tensile-strength test were carried out with a hydraulic testing machine (Bairoe
® YAW-5000, Shanghai Bairoe Test Instrument Co., Ltd., Shanghai, China). The flexural tensile-strength test was conducted with an electronic universal testing machine (MTS
® CTM5305, MTS Systems (China) Co., Ltd., Shanghai, China).
4. Experimental Results and Analysis
4.1. Influence on Material Strength
Different strength-test values of specimens in each group were tested according to Chinese standard GB/T 50081-2019 [
21]. The representative values of compressive strength, flexural tensile strength and splitting tensile strength after size conversion are compared in
Table 6.
It can be seen from the test results in
Table 6 that the differences between the representative strength values of specimens made with the standard mold and those of the specimens from the integral plate are small. The compressive strength of the NADC increased by 10~20% after the vehicle–bridge coupling simulation vibration. It can be recognized that the density of NADC can be improved with vehicle–bridge coupling vibration. This is conducive to the improvement of the compressive strength of NADC. Except for the flexural tensile strength of specimen NADC2-3-6, the flexural tensile strength and splitting tensile strength of each series of specimens decreased to some extent after the disturbance simulation. This is mainly due to the fact that flexural tensile strength and splitting tensile strength are sensitive to the interfacial transition zone between coarse aggregate and cement mortar. The existing research [
5] shows that a vibration disturbance from the initial setting time to the final setting time will lead to the performance deterioration of the interfacial transition zone between coarse aggregate and cement mortar, which is macroscopically reflected in decreases in flexural tensile strength and splitting tensile strength. This is consistent with the results of this experiment.
The mechanical performances of the HPADC-series specimens were studied by similar method to that used for the NADC-series specimens. The test results for compressive strength and flexural tensile strength after size conversion are compared in
Table 7.
It can also be learnt from
Table 7 that mechanical properties of specimens made with different methods show good consistency under a vibration amplitude of 3 mm and a vibration frequency of 6 Hz.
The compressive strength of the HPADC changed little after the vehicle–bridge coupling simulation vibration. It can be recognized that the compressive strength of HPADC is almost not vulnerable to differential disturbance. The main reason is that disturbance can improve the density of HPADC. Therefore, the compressive-strength test results for the HPADC specimens were almost unaffected under these test conditions.
However, the flexural tensile strength was obviously affected by the vehicle–bridge coupling simulation vibration. Among them, the flexural tensile strength was greatly reduced for the specimens with direct vibration disturbance (specimens HPADC-3-6 and HPADC3-3-6), while the flexural tensile strength of the specimens in the static segment (specimens HPADC1-3-6) was less affected.
4.2. Influence on Ultrasonic Velocity
The ultrasonic velocities of the specimens were tested according to Chinese technical specification T/CECS 02-2020 [
22], and the test results are shown in
Figure 8.
It can be seen from the test results that the ultrasonic velocity of the concrete specimen made with the standard mold is slightly higher than that of the series of specimens cut from the integral plate. The ultrasonic velocity of the upper part of the specimen is higher than that of the lower part of the specimen. It can be considered that the lower part of the concrete was denser when the specimen was disturbed. The tested ultrasonic velocities of the series specimens cut from different positions of the integral plate specimen (NADC1-3-6, NADC2-3-6 and NADC3-3-6) were roughly the same, while those of the specimens cut from the pure disturbance segment (specimen NADC2-3-6) were slightly lower. In other words, different disturbance levels may have effects on the compactness of NADC to some extent, and the differential disturbance may be unfavorable to the internal structure of the specimens from the disturbance segment.
Ultrasonic technology was also applied for the compactness test of the HPADC-series specimens, and the test results are shown in
Figure 9.
It can be concluded from
Figure 9 that the vehicle–bridge coupling simulation vibration had little effect on the ultrasonic velocities of the HPADC specimens, which were different from those of the NADC specimens. This is mainly due to the fact that HPADC is a special kind of ultra-high-performance concrete with low porosity and high compactness, and differential disturbance cannot change the compactness of HPADC significantly.
4.3. Influence on Shrinkage Properties
The shrinkage properties of the NADC-0-0 and NADC-3-6 series specimens were tested according to Chinese standard GB/T 50082-2009 [
23]. The test results are compared in
Figure 10. In comparing the shrinkage test results of the NADC specimens in the normal static state and under disturbance conditions, it can be seen that the vehicle–bridge coupling vibration had little effect on the shrinkage of the NADC under the vibration condition of 3 mm–6 Hz.
Shrinkage tests were conducted on the HPADC-0-0 and HPADC-3-6 series specimens. The test results are shown in
Figure 11.
In comparing these to the shrinkage test results of the NADC specimens, it can be seen that the vehicle–bridge coupling vibration also had little effect on the shrinkage of the HPADC specimens, while for the whole shrinkage process of the HPADC, the shrinkage value of the disturbed HPADC specimen was less than that of the contrast specimen under static conditions before 45 days and the shrinkage value of the disturbed specimen began to exceed that of the contrast specimen under static conditions at 60 days. Compared with the NADC, the shrinkage of the HPADC was slightly higher than that of the NADC with the increase in curing time.
4.4. Influence on Fiber Distribution of HPADC
Vibration may lead to a certain change in the distribution and orientation of steel fiber. It may also lead to a decrease in the cohesive force between the steel fiber and the matrix material of HPADC. Since flexural strength is sensitive to distribution and orientation of steel fibers and the bonding degree between steel fibers and HPADC matrix materials, the disturbed HPADC specimens showed a decrease in flexural strength, macroscopically.
The distribution and orientation of the steel fiber in specimens HPADC-0-0 and HPADC-3-6 were directly observed, as shown in
Figure 12. It can be seen from
Figure 12 that vibration has a great influence on the steel fiber distribution of HPADC. Vibration will change the orientation of steel fiber, and the proportion of steel fiber distributed in the vertical direction will increase.
The internal fiber distribution was tested with X-CT scanning technology. The internal fiber distribution of HPADC-3-6 can be clearly seen in
Figure 13. It can be seen from the scanning results that the orientation of the steel fibers in specimen HPADC-3-6 is more serious. Even under static conditions, the steel fibers were oriented. At the same time, there was a serious stratification phenomenon, the steel fiber sank, and the number of steel fibers in the upper layer decreased. In the material strength test, it was found that the flexural tensile strength of the HPADC decreased, and the loss was greater under vibration conditions. Degradation of mechanical properties can be well-explained by fiber orientation and sinking.
In comparison with the NADC test results, it can be concluded that the anti-differential disturbance property of HPADC still has obvious advantages after vehicle–bridge coupling vibration. Although the compressive strength of the HPADC was not significantly improved compared to the NADC, even the tensile-strength retention rate of the HPADC was obviously lower than that of the NADC. Thus, it can be considered that the compressive strength and flexural tensile strength of the HPADC were still significantly better than those of NADC after the vehicle–bridge coupling vibration.


