Article

Behavior of Cellulosic Fiber Board Wood-Frame Shear Walls with and without Openings under Cyclical Loading

1
Department of Civil and Environmental Engineering, Villanova University, Villanova, PA 19085, USA
2
Mulhern + Kulp Structural Engineering, Ambler, PA 19002, USA
*
Author to whom correspondence should be addressed.
Buildings 2024, 14(10), 3097; https://doi.org/10.3390/buildings14103097
Submission received: 22 August 2024 / Revised: 13 September 2024 / Accepted: 25 September 2024 / Published: 27 September 2024

Abstract

:
Cellulosic fiber board (CFB) is a lightweight form of sheathing that contains 94% post-consumer recycled materials. The viability of CFB sheathed shear walls as an alternative to Oriented Strand Board (OSB) walls is the focus of this study. A total of 23 walls and 10 connection samples were tested under cyclical loading to determine their overall behavior and capacity. The walls consisted of 2.44 m high by 3.66 m long CFB and OSB sheathed walls with and without openings. The design capacity of each wall was calculated and compared to the experimental results. For the walls with openings, the effects of blocking and strapping on their behavior were also evaluated. It was found that CFB is a viable alternative to OSB; however, some adjustments to the current design values and processes are required as the current procedure results in safety factors that are significantly lower than those for OSB walls.

1. Introduction

Structural sheathing’s main purpose when used in wood-framed shear walls is to provide strength and stiffness under in-plane loading, most commonly wind and seismic loads. Oriented strand board (OSB) has been the most common and effective sheathing for this application, but there are drawbacks to OSB, such as moisture absorption and, most notably, its fluctuating prices. Cellulosic fiber board (CFB) serves as a potential alternative to OSB. CFB walls are moisture and mold resistant. They are also made largely from post-consumer material, which creates a more stable supply chain, making its prices more stable and its availability more consistent. This makes CFB an attractive and sustainable alternative to more traditional sheathing materials such as OSB.
The objective of this study was to examine the behavior of CFB sheathed wood-framed walls with and without openings under cyclical loading, and to compare its behavior to similar OSB sheathed walls and to the wall’s design capacity. Based on previous research on solid wall behavior, we hypothesized that CFB and OSB should exhibit similar behavior, though the presence of strapping may affect this relationship. To better understand the behavior of the different systems, connections tests were conducted to determine the capacity of a single connector in OSB and CFB. Full-scale wall tests were conducted on both solid walls and walls with the same window opening configuration. Walls with openings are included here as previous research has been conducted on solid CFB shear walls but little to no information is available on CFB sheathed shear walls with openings. Openings are often necessary in shear walls in residential structures as it is more economical to use the exterior walls as shear walls and architects and homeowners prioritize natural light in their designs, resulting in few solid exterior walls. Nine CFB sheathed walls were tested with this opening configuration and various strapping arrangements. The effect of openings was analyzed by comparing the behavior of these walls to the behavior of CFB walls without an opening. Four OSB walls with the same geometry were also tested to compare the behavior of CFB and OSB. The design strengths of each wall were calculated and the ratios of the design to actual strength for the different sheathing types were compared.
Section 1 of this paper provides an overview of the research and a summary of the relevant literature. Section 2 describes the materials and methods used to conduct both the connection and wall tests. Section 3 details the process used to determine the design capacity of the walls. Section 4 presents the results of the connection and wall tests, including representative hysteresis plots and the peak load at each step within the loading process. Section 5 includes a discussion of the results and relates the measured capacity of the walls to the calculated design capacity. Section 6 presents the conclusions of the research and recommends future research that is required to better understand the behavior of CFB walls.

Literature Review

Much work has been performed on wood shear walls without openings. For the most common form of sheathing, OSB, one study found that the shear load at serviceability limits was 1.7 times the allowable load in the 1997 Uniform Building Code [1]. Another study concluded that the strength of OSB walls were enhanced by increasing the length of the wall and fastener spacing [2]. Several sheathing types have been used as an alternative to OSB. Ply-bamboo uses both conventional timber-based materials and bamboo-based materials. Ply-bamboo provides a comparable capacity to wood panel sheathed baseline walls [3,4,5,6]. Polyvinyl chloride (PVC) and wood–plastic composite veneer panels is another sustainable alternative to OSB and has been found to provide favorable shear strength and deformation capacity; however, additional work is required to improve energy dissipation [7]. Lastly, structurally insulated panels (SIP) have been used as an alternative sheathing; this sheathing is made up of wood structured panels combined with foam plastic insulation. Rammer and Williamson found that SIP baseline walls with several different aspect ratios proved to be adequate for overstrength, drift, and ductility capacities [8]. Phillips showed that SIP baseline walls provided comparable shear design values to traditional light-frame shear walls; however, fasteners with longer lengths and larger diameters than traditional fasteners were used [9].
The focus of the present research, CFB sheathing, was discussed in two separate documents by The Engineered Wood Association (APA). For solid walls, it was found that published design values for CFB sheathing were higher than that of 15/32 inch thick wood structural panel sheathing. The APA report concluded that the lateral load resistance of the CFB sheathing under study “could be under-designed by 23 to 39 percent” [10]. Specifically for seismic analysis, it was noted that CFB did not meet the over-strength, ductility, and drift equivalency of OSB sheathed shear walls, as stated in ICC-ES AC436 [10,11]. In the second report, the APA described additional tests, and similar results were emphasized. It was concluded that lateral load resistances are overstated “by as much as 42% when compared to their published design values” [12]. It is worth noting that the specific type of CFB sheathing used in these studies is different than that used in the present study.
The manufacturer recommended fastener for connecting the CFB to framing is staples. Currently, staples are not provided as approved fasteners in the American Wood Council’s Special Design Provisions for Wind and Seismic (SPDWS), but they are permitted and tabulated strengths are provided in the International Building Code (IBC) [13,14]. Aranda et al. compared the performance of OSB shear walls using nails and staples and found very similar performance in both capacity and stiffness [15]. Talbot et al. also analyzed the use of staples, instead of nails, to fasten OSB sheathing to wood framing. They concluded that staples could be used as a viable alternative to nails for ultimate load capacity but not for serviceability limit states [16]. Talbot et al. believe that the failure of the stapled walls to meet the drift limit capacity was a function of the loading protocol used and not necessarily representative of the fundamental behavior of the staples.
Several studies have been conducted on walls with openings, most of which have involved OSB-sheathed walls. It was found that OSB walls perform sufficiently, that the strength and stiffness of the walls declined as the opening size increased, and that the highest load factors were associated with walls with the narrowest piers [17,18,19,20]. It was also found that in research involving OSB sheathed walls with openings and with strapping, that the Force Transfer Around Openings design philosophy can be sufficient for predicting forces measured during testing [17,21]. Force Transfer Around Openings is a design philosophy that allows for a rational method for evaluation. While several rational methods are documented through testing and papers, none are specifically referenced within the code.
Other work has been done on SIP sheathed walls with openings. Kermani and Hairstans concluded from their research that SIP sheathing can be an effective composite material in sustaining required loads [22]. Further, the perforated shear wall method provided a satisfactory prediction for both the strength and stiffness of SIP-sheathed walls with no horizontal strapping at the openings [6,23,24]. Considering this prior work, the objective of this study to examine the behavior of CFB sheathed shear walls with openings fulfills a gap in the current literature and would provide useful information for light framed wood structure design practices and the construction industry.

2. Materials and Methods

This research program consisted of two primary tests. First, the capacity under cyclical loading of a single connector between the sheathing and wood framing was evaluated for both the CFB and OSB. Secondly, full-scale walls were tested to determine the behavior of the different materials under cyclical loading.
The cellulosic fiber board (CFB) examined in this study has a 3.5 mm (0.135 in.) thickness. It is a lightweight sheathing with one-third of the weight of traditional OSB that is made from 94% post-consumer recycled materials. Specifically, the material has a high strength cellulosic fiber core to provide durability. A protective polymer layer is placed on the exterior surface. To provide water resistance, a protective coating is present on both the front and back surfaces of the sheathing [25]. The OSB used throughout the research program is standard 11 mm (7/16 in.) sheathing.

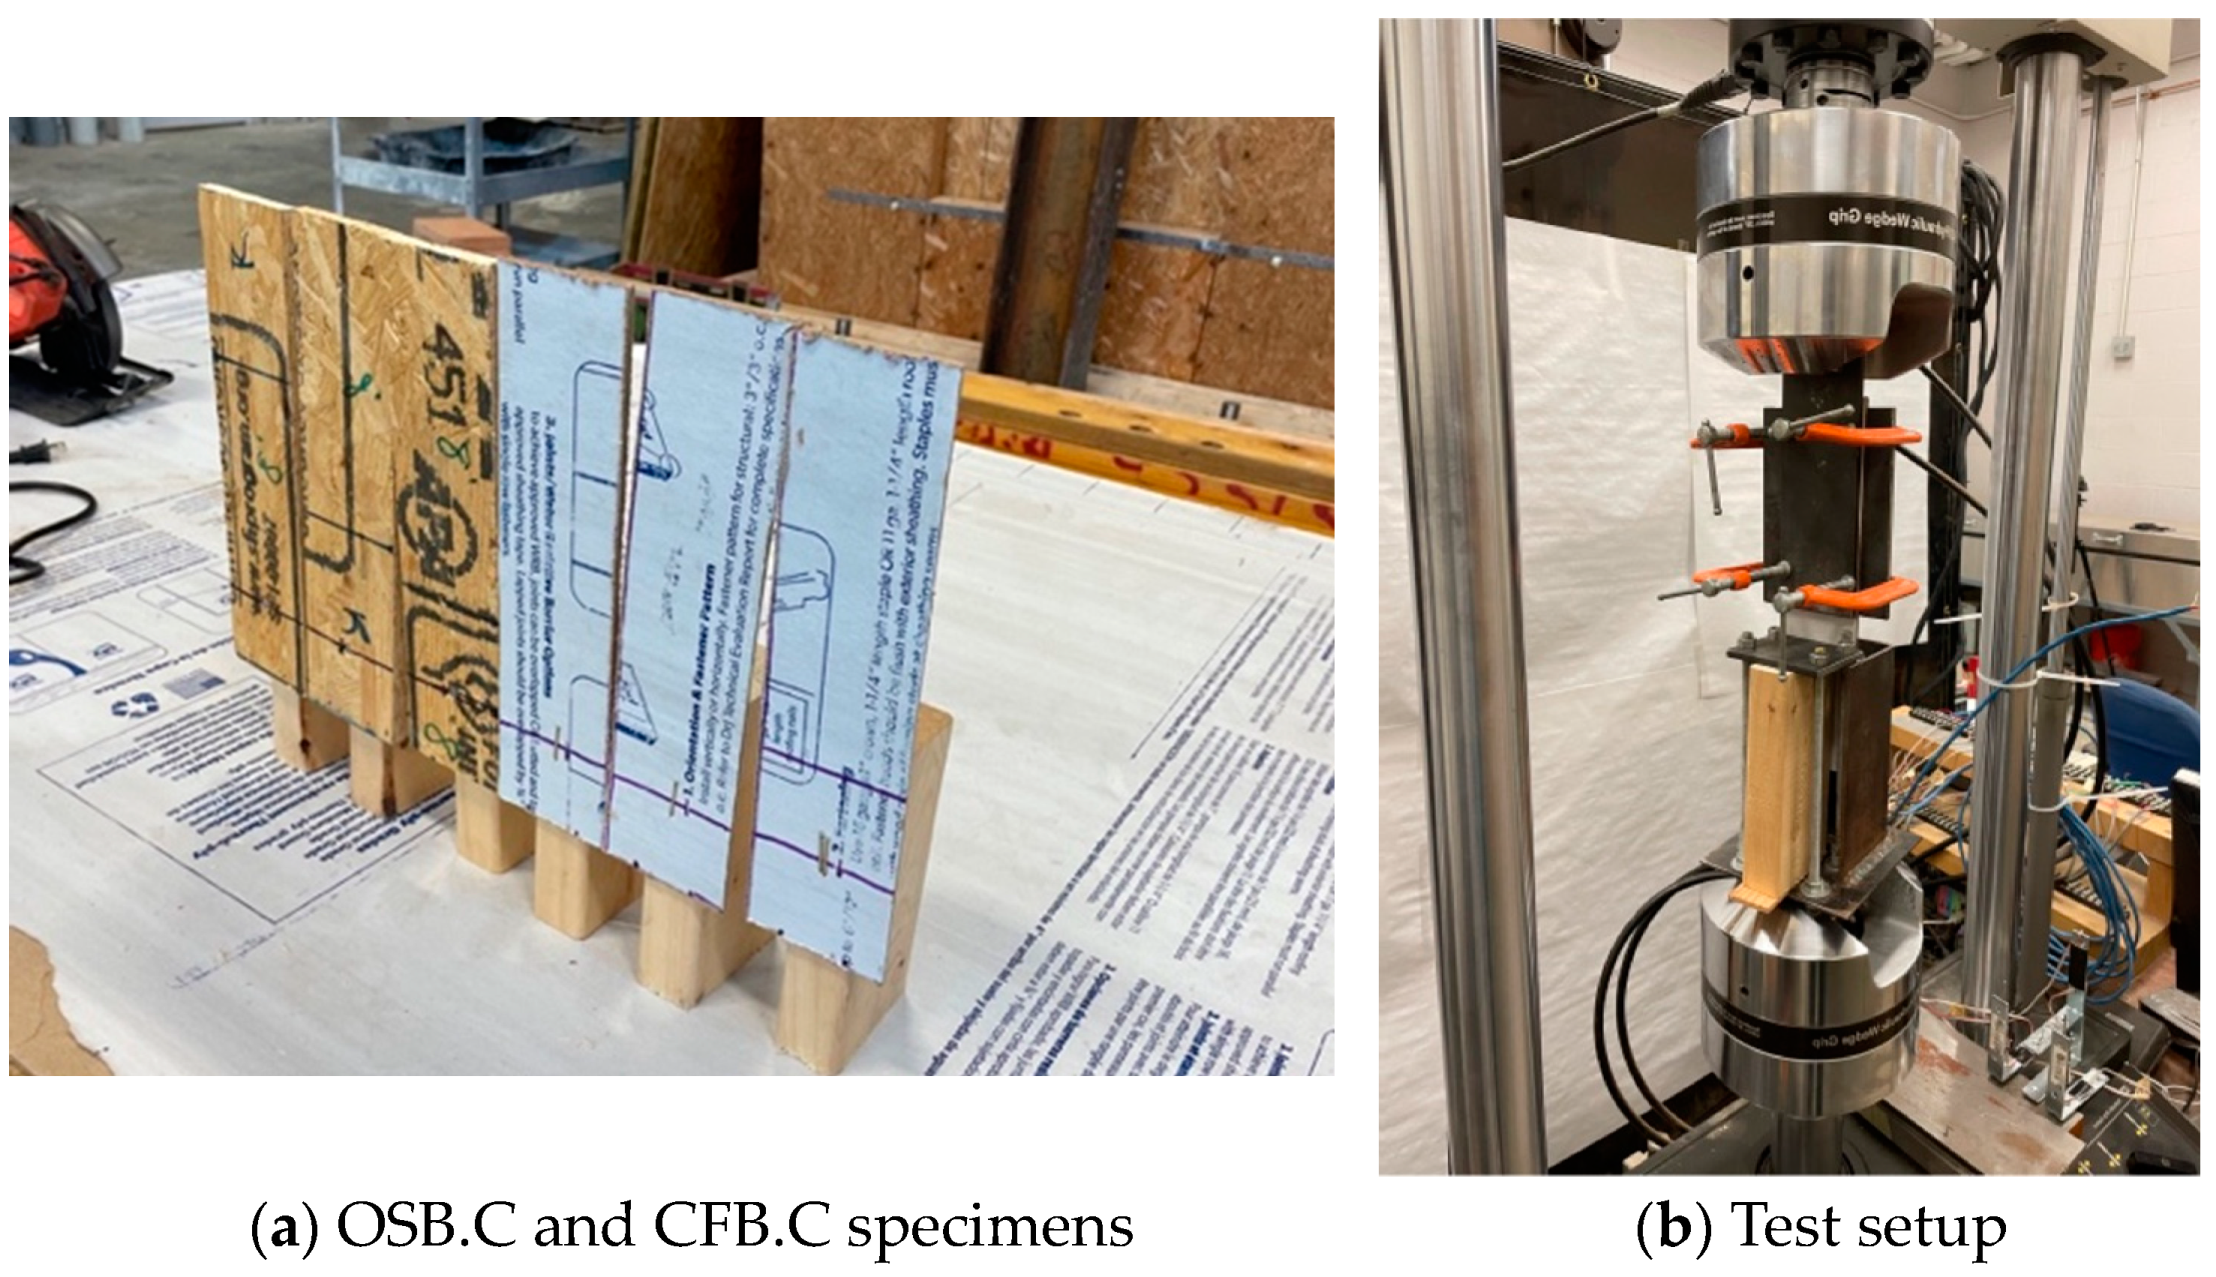
2.1. Connection Tests

2.1.1. Specimen Configuration

Connection tests were conducted on five individual cellulosic fiber board sheathed specimens (CFB.C) and five oriented strand board sheathed specimens (OSB.C). The specimen configuration was a 76 mm wide by 305 mm high (3 in × 12 in.) section of sheathing connected to a 38 mm × 89 mm (1.5 in × 3.5 in.) No. 2 SPF stud that was 178 mm (7 in.) long. The sheathing overlapped the stud by 102 mm (4 in.) and the connector was placed at the center of this overlapped region. The CFB was connected to the stud using a 16-gage staple with a 24 mm (15/16 in.) crown as specified by the CFB manufacturer [25]. The OSB was connected using a single 60 mm × 2.9 mm (2 3/8 in × 0.113 in.) nail. The same sheathing and connectors were used for the connection and wall tests. A picture of both connection specimens is shown in Figure 1a.

2.1.2. Test Setup

As shown in Figure 1b, the test apparatus consisted of two components. The stud was restrained in a metal fixture attached to the bottom grip of the computer-controlled hydraulic loading frame. The stud was restrained from vertical movement by a plate placed on top of the stud and held down with four metal rods. The stud was held in the center of the fixture with six roller supports (two on each of the three sides within the fixture) to secure the specimen while minimizing friction. The sheathing was secured to a metal plate connected to the top of the testing frame with four clamps, as shown in Figure 1b. This setup resulted in a consistent failure of the sample at the connection with little to no damage elsewhere on the sample. The test setup was the same for both the CFB.C and OSB.C specimens.
The loading for each test followed the procedure described in ASTM E2126-11 (Test Method C: the CUREE Basic Loading Protocol) [26], which is a 52-cycle pattern of displacements ranging from 0.0 mm to 19.05 mm. The applied displacement and resisting forces were recorded at 20 times per second.

2.2. Wall Tests

Walls with various configurations, sheathing materials, and strapping arrangements were evaluated in this study. Figure 2 associates each wall type with a corresponding abbreviation and lists the quantity of each configuration evaluated. This includes both solid baseline (B) walls and walls with window openings (W). For walls with strapping, “straps over” means strapping is placed over the sheathing (O) and “straps under” means strapping is placed directly on the wood frame and under the sheathing (U). Walls with openings but no strapping (N) were also evaluated.

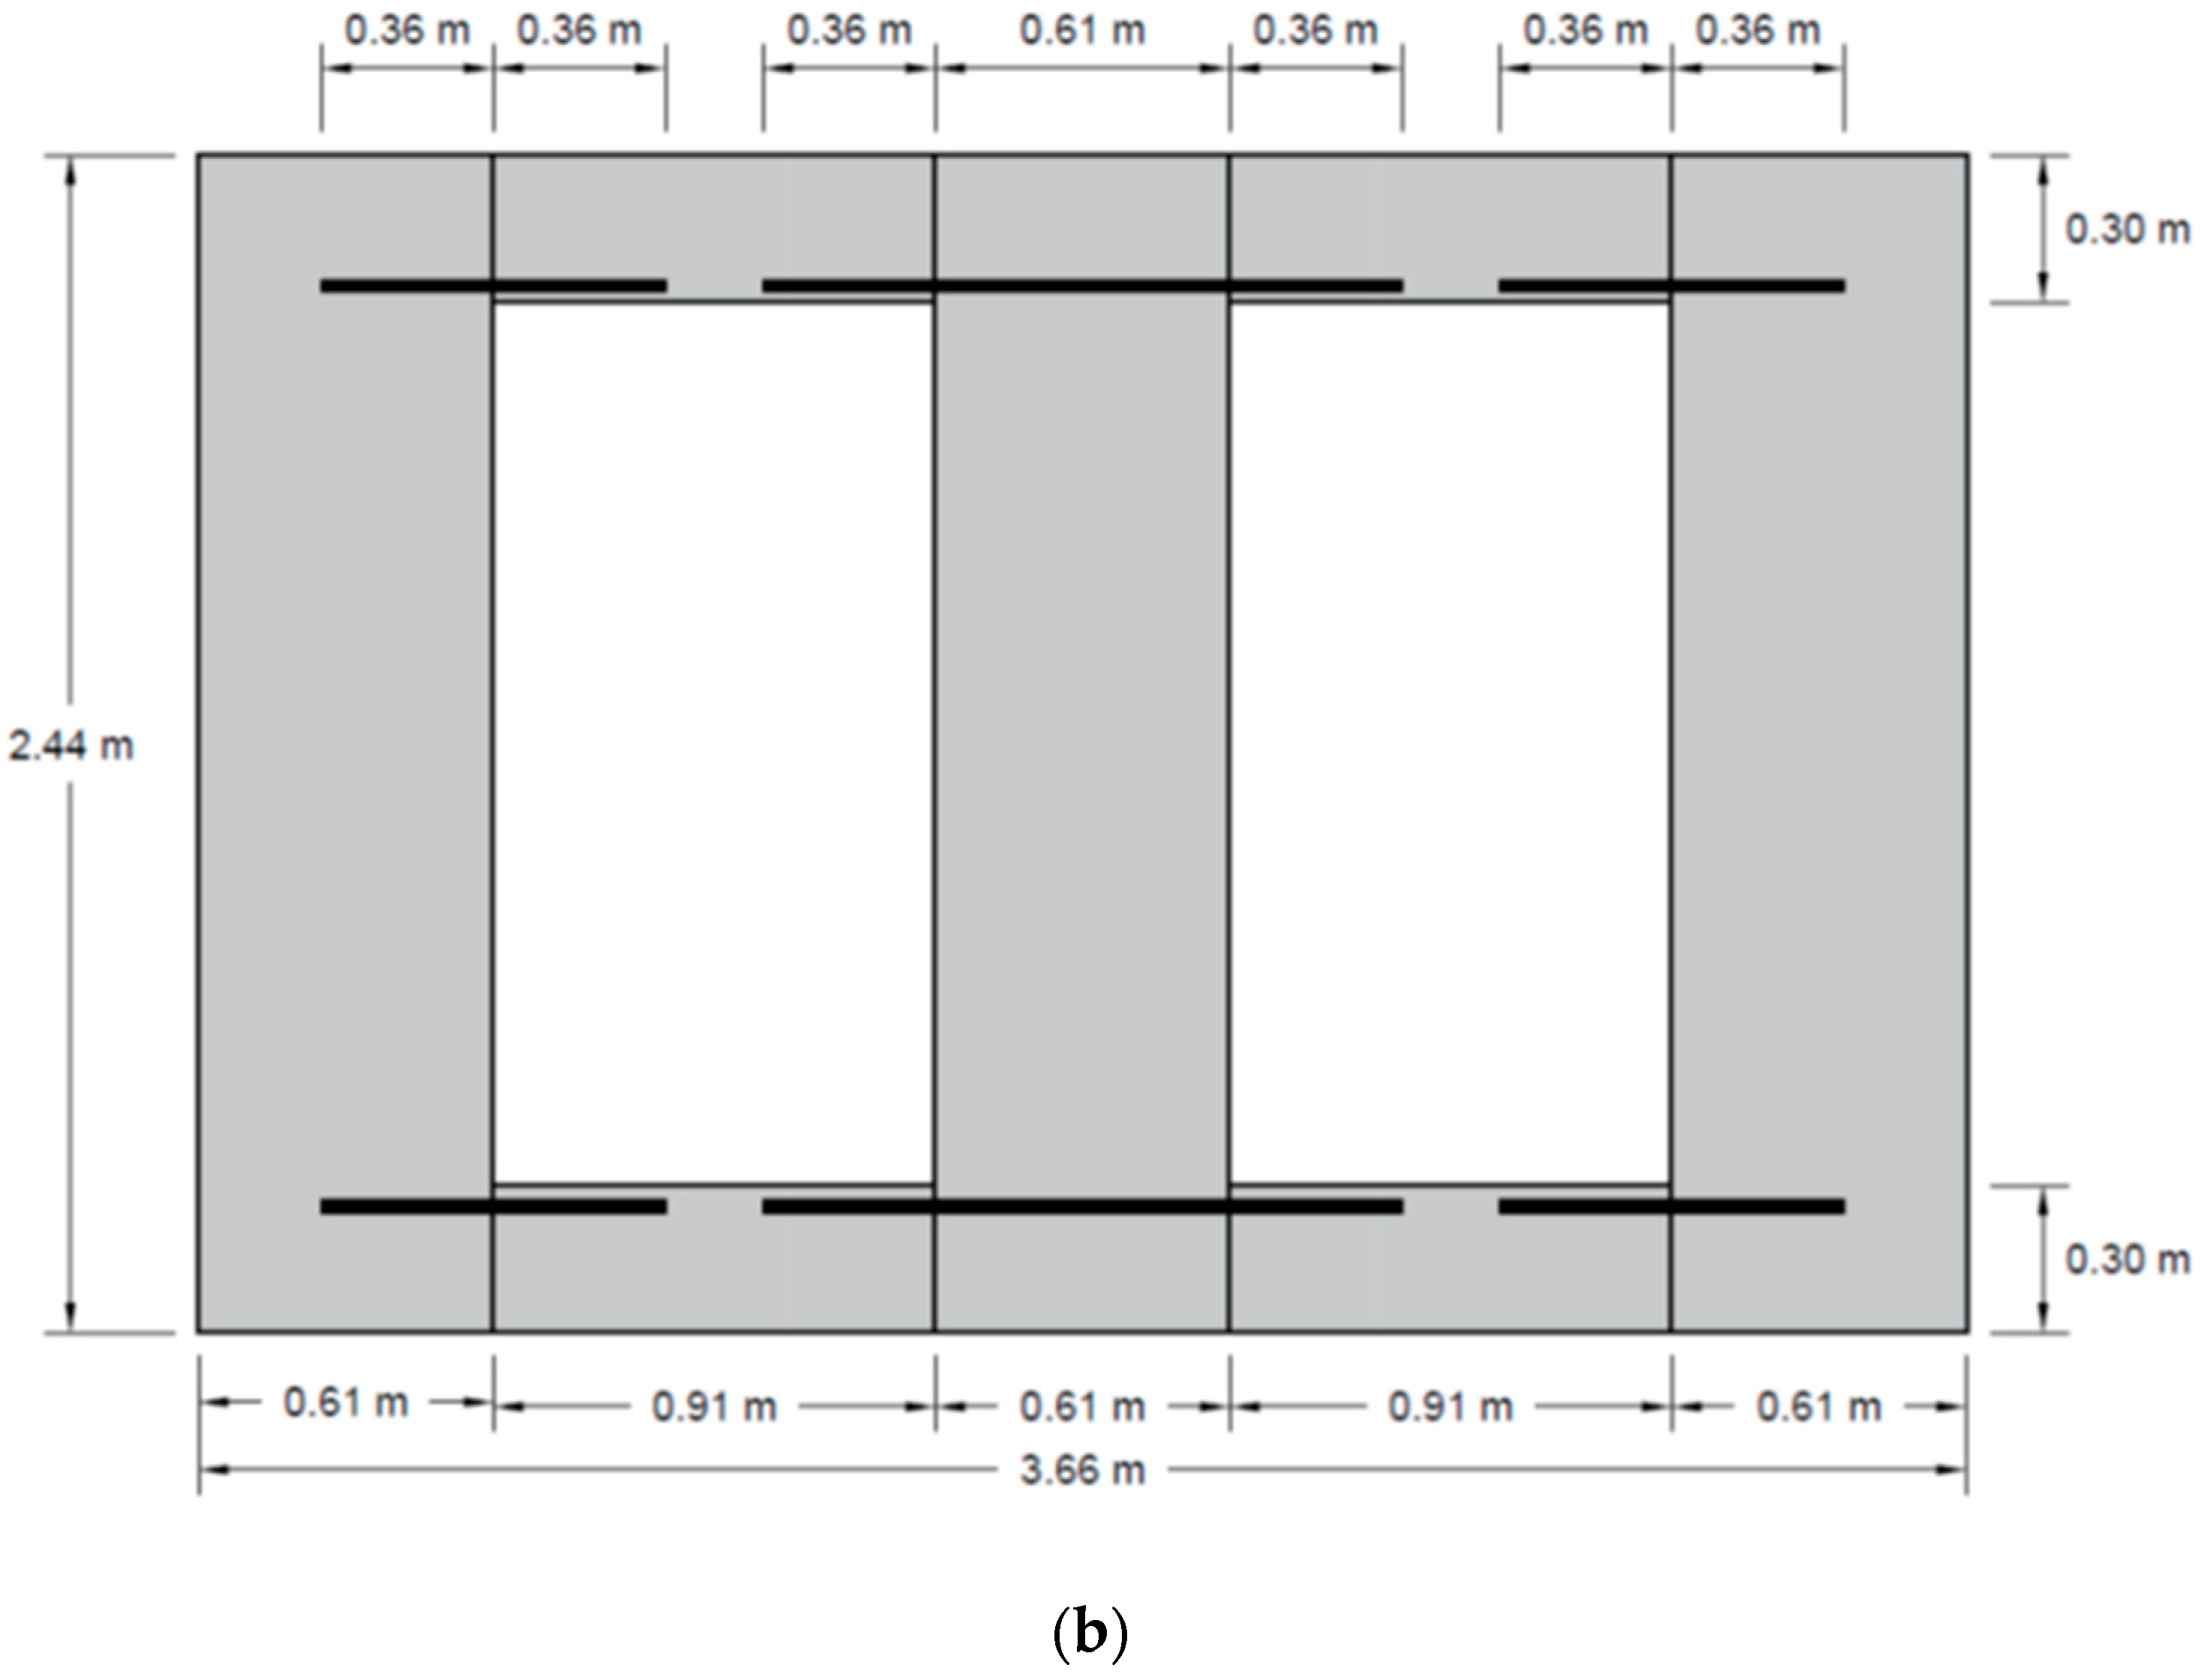
2.2.1. Configuration and Construction

Baseline Walls

Four CFB and four OSB baseline walls (CFB.B and OSB.B) were tested as part of this study. The overall wall dimensions were 2.44 m × 3.66 m (8 ft × 12 ft). All studs and plates consisted of 38 mm × 89 mm (1.5 in. × 3.5 in.) SPF No. 2 lumber. Double top plates and double end studs were fastened with 76 mm × 3.3 mm (3 in. × 0.131 in.) nails at 610 mm (24 in.) on the center. Vertical studs were spaced 406 mm (16 in.) on the center and were fastened to top and bottom plates with two 76 mm × 3.3 mm (3 in. × 0.131 in.) nails. The sheathing consisted of three aligned 1.2 m × 2.4 m (4 ft × 8 ft) vertical sheathing panels.
It is important to note that different fasteners and fastener spacings were used to connect the CFB and OSB panels to the framing. The CFB sheathing is 3.5 mm (0.135 in.) thick and fastened with 16-gauge staples with a 24 mm (15/16 in.) crown every 76 mm (3 in.) on the center on both the perimeter and interior of the wood framing as specified by the CFB manufacturer. The OSB sheathing used in this study is 11 mm (7/16 inch) thick and fastened with 60 mm × 2.9 mm (2–3/8 in. × 0.113 in.) nails every 152 mm (6 in.) on the center on the perimeter of the sheathing and every 305 mm (12 in.) on the center on the interior of the sheathing. This corresponds to the maximum spacing requirements for fasteners used to connect 11 mm thick structural sheathing to shear walls in the NDS SDPWS (2021) [13].
Hold-down anchors were used at each end of the shear wall to enhance the wall’s capacity and to meet the requirements in the NDS SDPWS (2021) [13] as the uplift due to the overturning moments on the wall exceed the forces generated by the dead load of the wall. Two 10-Gauge Simpson Strong-Tie HD5B were used for each wall. A 16 mm (⅝”) diameter stainless steel anchor bolt was used for the connection between the hold-down and testing frame, while two 19 mm (¾”) diameter bolts were used to attach the hold-down anchor to the vertical double stud members of the shear wall.

Walls with Openings

Figure 3a shows the detailed framing layout for the walls with openings. The overall wall size was 2.44 m × 3.66 m (8 ft × 12 ft) (same as the baseline walls), and there were two 0.91 m × 1.83 m (3 ft × 6 ft) openings. The opening sizes were selected in consultation with an engineering design firm to represent a shear wall they have designed with larger than average openings so that the tests had a realistic but severe configuration that met all code required aspect ratios as per Section 4.3.3 of the 2021 SDPWS [13]. The wood framing consisted of primarily 38 mm × 89 mm (1.5 in. × 3.5 in.) No. 2 lumber. Due to lumber availability at the time of fabrication, the CFB walls used mostly SPF lumber, with Hem Fir lumber used as top and bottom plates, and the OSB walls used Hem Fir (HF) lumber. While the specific gravity of these lumber types vary, HF is 0.43 and SPF is 0.42, the effect of this difference should be about 2.5%. The headers for each opening were constructed using two joined 38 mm × 140 mm (1.5 in. × 5.5 in.) #2 White Fir boards with a sheet of 13 mm (0.5 in.) thick OSB sheathing between the boards. The headers were fastened with two 76 mm × 3.3 mm (3 in. × 0.131 in.) nails to the top plates spaced 610 mm (24 in.) on the center and to each adjacent stud. The nail sizes and the spacing requirements for the framing were the same as the baseline walls.
Three 0.61 m × 2.44 m (2 ft × 8 ft) vertical sheathing panels and four 0.91 m × 0.3 m (3 ft × 1 ft) horizontal sheathing panels were used to sheath the wall, as shown in Figure 3b. The sheathing layout was selected as a “worst case” scenario, with vertical sheathing seams present at all window edges. Continuous sheathing at those locations can create a coupling beam effect similar to the horizontal metal straps installed and can change the resulting behavior. The CFB panels were fastened with 16-gauge staples with a 24 mm (15/16 in.) crown every 76 mm (3 in.) on the center on both the perimeter and interior of the sheathing panels. The 11.1 mm (7/16 in.) thick OSB was connected to the framing using 60 mm × 2.9 mm (2–3/8 in. × 0.113 in.) nails every 152 mm (6 in.) on the center on the perimeter of the sheathing panels and every 305 mm (12 in.) on the center on the interior of the sheathing panels, again matching the connection details used in the baseline walls. The hold-down configuration from the baseline walls was also used for the walls with openings.
The research program evaluated three different strapping and blocking arrangements. First, walls without any strapping and blocking were tested. This included three CFB sheathed walls (CFB.W.N) and two OSB sheathed walls (OSB.W.N). Second, walls with blocking and strapping placed over the sheathing were evaluated. The blocking and strapping locations can be seen in Figure 3. The straps were placed horizontally above and below each opening and extended to at least 0.36 m (14 in.) beyond the edge of the window. The straps consisted of 16 gage Simpson Strong-Tie Coiled Straps installed with 64 mm (2.5 in.) nails in each available hole within the strap. The blocking consisted of 38 mm × 89 mm (1.5 in × 3.5 in.) lumber oriented vertically between the studs. The blocking was intended to carry the compressive forces that result from the force transfer around the openings, while the strapping was intended to carry the tensile forces. Three CFB sheathed walls (CFB.W.O) and two OSB sheathed walls (OSB.W.O) were evaluated with blocking and strapping placed over the sheathing. This is standard practice in the industry and involves attaching the sheathing as normal and then placing the strapping on top of the sheathing. The third configuration evaluated was blocking and strapping placed under the sheathing. This case was only evaluated using the CFB sheathing (CFB.W.U). Placing the strapping under the sheathing is not the typical practice in construction but this configuration was evaluated for CFB because there was inconsistent guidance regarding the placement of the strapping. In this arrangement, the strapping was placed on the framing before the sheathing was applied.

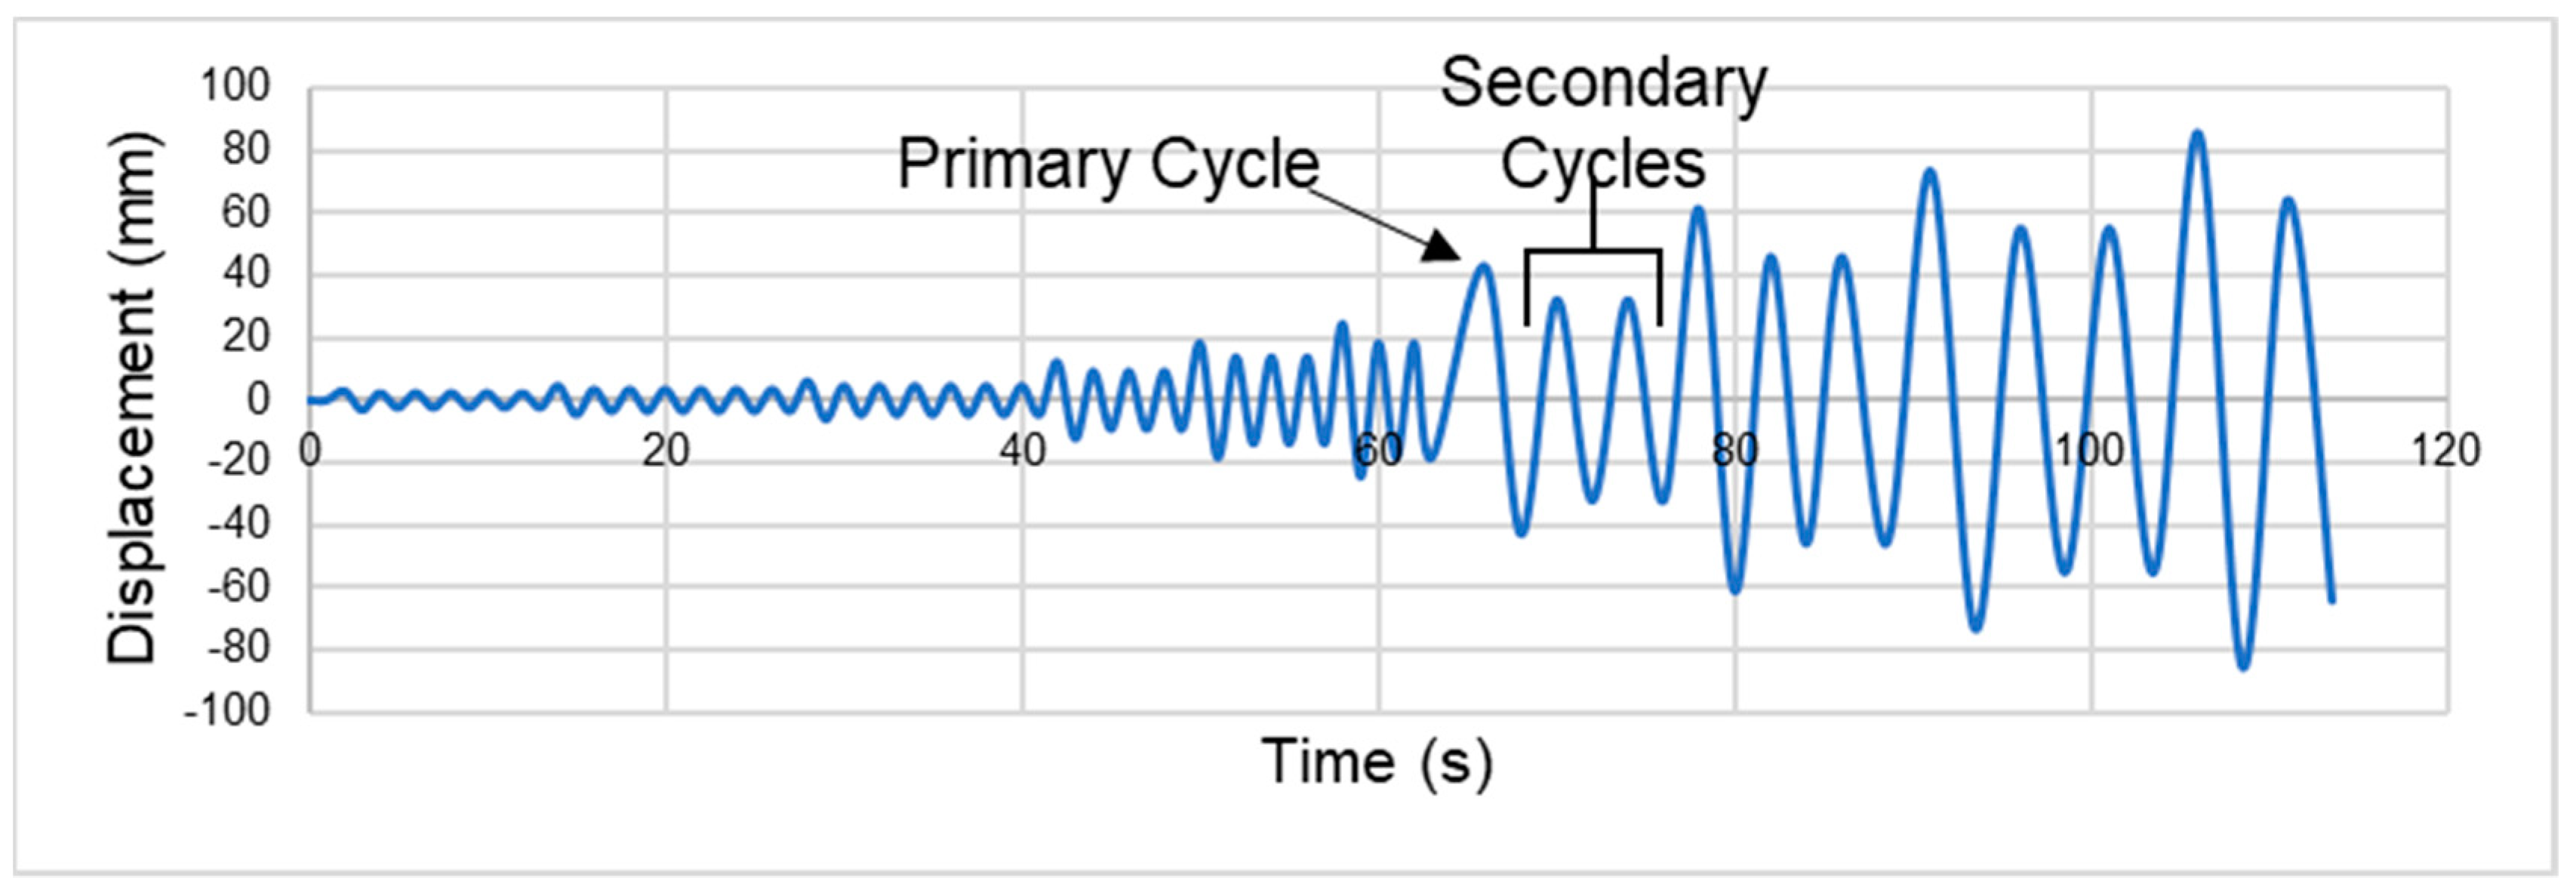
2.2.2. Test Setup and Procedure

The test set up shown in Figure 4 was used for all walls. The frame base consisted of three aligned W8x24 beams anchored to the concrete floor. Two 38 mm × 89 mm × 3.7 m (1.5 in. × 3.5 in. × 12 ft) boards of No. 2 Hem Fir were bolted to the top of the steel beams to provide the connection to the bottom of the wall. Two 25 mm (1 in.) diameter holes were drilled at either end of the bottom plate of the shear wall to allow for 16 mm (5/8 in.) anchor bolts to be placed as hold-down anchors in the bottom corners of the wall. The bottom plate of the shear wall was then nailed to the No. 2 Hem Fir boards using 76 mm × 3.3 mm (3 in. × 0.131 in.) nails at 152 mm (6 in.) on the center. Bolts were not used to rigidly attach the bottom plate of the shear wall to the steel support beams to avoid artificially increasing the stiffness of the wall. Nailing the bases of the wall provides a more realistic support condition for a shear wall located above wood framing, which is important as the stiffness of the bottom and top plate have an impact on the shear wall’s behavior, with more rigid elements resulting in an increased capacity. It should be noted that bolts were used to attach the hold-downs at each end of the wall as would be done in the field.
An MTS Hydraulic Actuator provided the lateral force at the top of the wall. A string potentiometer mounted to a vertical column was attached to the top of the wall on the side opposite the actuator to measure horizontal wall displacement. The actuator was attached directly to the load spreader which transmitted the lateral force from the actuator to the wall. The load spreader consisted of three aligned W10x30 beams connected to the top plate of the shear wall using 0.3 m × 19 diameter threaded rods. The threaded rods were rigidly attached to the double top plates using nuts above and below the plates. The threaded rod extended through a hole in the load spreader and a brass bushing was placed over the threaded rod through a hole in the beam web to allow differential vertical movement while transferring the lateral load and displacement from the actuator. This connection is shown in Figure 4b. The connection minimized the stiffness added to the top plate by the very stiff load spreader, replicating the case of a wall without an additional story on top of it. To prevent the shear wall from moving out of plane, six roller bearings connected to columns anchored to the floor or wall were placed on the flanges of the load spreader and spaced 1.2 m apart on each side.
The loading from the actuator followed ASTM E2126-11 (Test Method C: the CUREE Basic Loading Protocol) [26]. The protocol has a set pattern of displacements corresponding to a cycle number, as shown in Figure 5. Overall, there are 43 cycles in the loading protocol divided into 10 steps. Each step represents an initial increase in the first cycle displacement (primary cycle) from the previous step followed by successive identical displacements (secondary cycles) until the next step. Due to loading rate restrictions of the actuator, the frequency of the cycles decreased at higher amplitudes. The first 31 cycles of testing were conducted at 0.50 Hz; cycles 32 to 37 were conducted at 0.25 Hz; cycles 38 to 43 were conducted at 0.2 Hz; and cycles 44 through 49 were conducted at 0.16 Hz. The data acquisition system acquired 50 points of both load and displacement per second.

3. Theory/Calculations

Design for Allowable Loading

The allowable stress design (ASD) method for seismic loading described in NDS SDPWS (2021) [13] was used to determine the design values for baseline walls, walls with openings and no strapping, and walls with openings and strapping. For the baseline walls (CFB.B and OSB.B), the aspect ratio of the wall requires no adjustment factor, therefore the design capacity (P) was simply found by multiplying the unit shear capacity, v, by the length of the wall. For OSB, v = 10.65 kN/m (Table A.4.3A). This accounts for the fact that footnote two allows for the use of the design values for 11.9 mm (15/32 in.) thick sheathing, since the studs are spaced at 0.41 m (16 in.) on the center. Two adjustment factors need to be applied to the shear capacity for OSB. A reduction factor of 2.8 is applied to convert it into an allowable seismic load, as per footnote one of the SDPWS Table A.4.3A; and a factor of 0.92 is applied since SPF lumber was used, as per footnote three of SDPWS Table A.4.3A. Therefore, for OSB, P = (10.65 kN/m) (0.92) (3.66 m)/(2.8) = 12.81 kN.
For CFB, the seismic allowable unit shear capacity was 4.89 kN/m, based on the manufacturer’s documentation [27]. Since this is already an allowable seismic load and the manufacturer does not require a reduction for the type of lumber there is no reduction factor needed. Therefore, for CFB, P = (4.89 kN/m) (3.66 m) = 17.90 kN.
For walls with no strapping (CFB.W.N and OSB.W.N), the perforated shear wall method was used to determine the capacity. It should be noted that these walls do not meet the uplift requirements for perforated shear walls specified in Section 4.3.6.4.2.1 of the SPDWS [13], which should theoretically reduce the tested capacity of the walls. Additional anchorage was not required for the other walls and it was decided to keep the wall anchorage consistent to facilitate comparison between the walls. The perforated design method was dependent on the wall’s continuity rather than any special detailing. Thus, the full height sheathed segments have varying degrees of capacity to resist the applied shear loads. The perforated shear wall resistance equation is [13]:
P = ν L i C o 2 b s h
Li is the sum of the width of full height of the wall segments, which for these walls was three 0.61 m spans or 1.83 m. Co is the shear capacity adjustment factor, which was 0.62 for this wall, corresponding to a percentage wall area opening of 37.5% and a percent full-height sheathing ratio of 50%. The 2bs/h factor was applied because the aspect ratio of the wall (4:1) exceeded 2:1. The maximum h/bs ratio for wood structural panels allowed by the SPDWS [13] is 3.5:1, but for this study the design equations were still used to calculate the wall capacity. The wall geometry was selected as a component of a larger study focused on examining the FTAO methodology that uses the height of the opening rather than the wall height when calculating this ratio, which results in a h/bs less than 3.5:1. Therefore, the perforated shear wall resistance (P) is equal to (0.567 m) (v), where v is the adjusted unit shear capacity. The unit shears and adjustment factors were the same as the baseline wall calculations, except that a factor of 0.93 was applied to the OSB walls since Hem-Fir lumber was used instead of SPF lumber, which has an adjustment factor of 0.92. This resulted in design capacities (P) of 2.01 kN and 2.77 kN for the OSB and CFB walls without straps, respectively.
For walls with strapping (CFB.W.O, CFB.W.U, and OSB.W.O), the force transfer around openings method (FTAO) was used to calculate the design capacity. This method uses the wall sections above and below the openings as connecting beams for the full-height wall segments. The wall was analyzed by dividing it into individual panels and evaluating the shear in each panel, as shown in Figure 6. The shear in each panel was obtained using a modified version of Diekmann’s method [28] as described by the Engineered Wood Association (APA) [29], which uses basic statics and the assumption that the unit shear above and below the opening is the same and that the horizontal load carried by the full height panels is based on the tributary width for that panel. An adjustment factor of 2b/h was again applied here; however, for the FTAO method, it is based on the aspect ratio of the pier rather than the wall segment. Therefore, 2b/h = 2 (0.61 m)/(1.83 m) = 0.667. The code is unclear on the application of this factor, but design guides produced by the Engineered Wood Association (APA) indicate that this adjustment factor is only applied to the shear in the full height panels [29]. This results in two potentially controlling capacities:
The capacity in the full height panel: P = (v) (0.667)/(0.48 m−1) = (1.39 m) (v)
The capacity in the panel above the openings: P = (v)/(1.09 m−1) = (0.917 m) (v)
Therefore, the resulting capacity of the wall using the FTAO method was P = (0.917 m) (v). The adjusted shear capacity was determined as discussed previously, giving design capacities (P) of 3.25 kN and 4.49 kN for the OSB and CFB walls, respectively. A summary of the design values is given in Table 1, where the Effective Length represents the controlling panel length times any applicable aspect ratio adjustment factors.
The design capacity will be compared to three different points on the hysteresis plots from the experimental testing: ultimate capacity, drift limit capacity, and seismic drift limit capacity. Ultimate capacity is the largest positive and negative load applied to the wall. Drift limit capacity represents the applied lateral load required to reach a drift of h/400. This displacement is consistent with the recommended wind drift limit given in ASCE 7 Appendix CC [30]. This is found by taking the average positive and negative peak load at cycle 14 (6.1 mm of displacement). The seismic drift limit also represents the lateral capacity within serviceability limits, but instead takes the average peak load at cycle 21 (12.2 mm of displacement), corresponding to an allowable drift of h/200, and then converts it to an allowable load by applying a factor of 0.7. This method was based on the procedure found in ICC Report AC130 [31].

4. Results

The following results and discussion sections are divided into three main parts: (1) examining the connection tests; (2) comparing the behavior of baseline walls to walls with openings for OSB and CFB separately; and (3) comparing OSB walls to CFB walls with similar configurations. This includes comparing the behavior of CFB and OSB baseline walls (CFB.B to OSB.B), walls without strapping (CFB.W.N to OSW.W.N), walls with strapping over the sheathing (CFB.W.O to OSB.W.O), and evaluating the effectiveness of the CFB wall with strapping under the sheathing by comparing it to both the CFB and OSB walls with strapping over the sheathing.

4.1. Connection Tests

The average hysteresis plots for the loading cycles up to 7.6 mm of displacement for the OSB and CFB connection tests are shown in Figure 7a. The cycle with 7.6 mm of displacement represents the peak load for the OSB samples, while the peak for the CFB samples occurred on the previous cycle with 5.3 mm of displacement. Additional cycles were conducted but are not provided to improve the readability of this figure. Both materials exhibit typical pinching behavior and demonstrate good ductility. Figure 7b shows the backbone capacity curve, which represents the average positive and negative load for each primary displacement cycle. The error bars represent the upper and lower bounds of the data collected from each of the five samples. These plots show that the nailed OSB connections had higher capacities than the stapled CFB connections, with the OSB having an average capacity of 0.98 kN compared to 0.76 kN for the CFB. This corresponds to the CFB having an individual fastener capacity of approximately 75% of the OSB, which is reasonably consistent up to the peak load. Post peak, the difference between the OSB and CFB load increased for a number of cycles before decreasing and becoming approximately equal for the last primary cycle of the test.

4.2. Comparison of Baseline Walls to Walls with Openings

A summary of the wall test results is presented in this section. Each wall exhibited typical wood shear wall behavior, with racking of the frames and rotations of the sheathing panels. Based on the range of data and the corresponding standard deviation (SD) values, the tests proved to be highly repeatable, especially prior to the peak load. Since there was consistency among individual tests, average values are shown in many of the tables and figures for each wall type rather than individual test results.

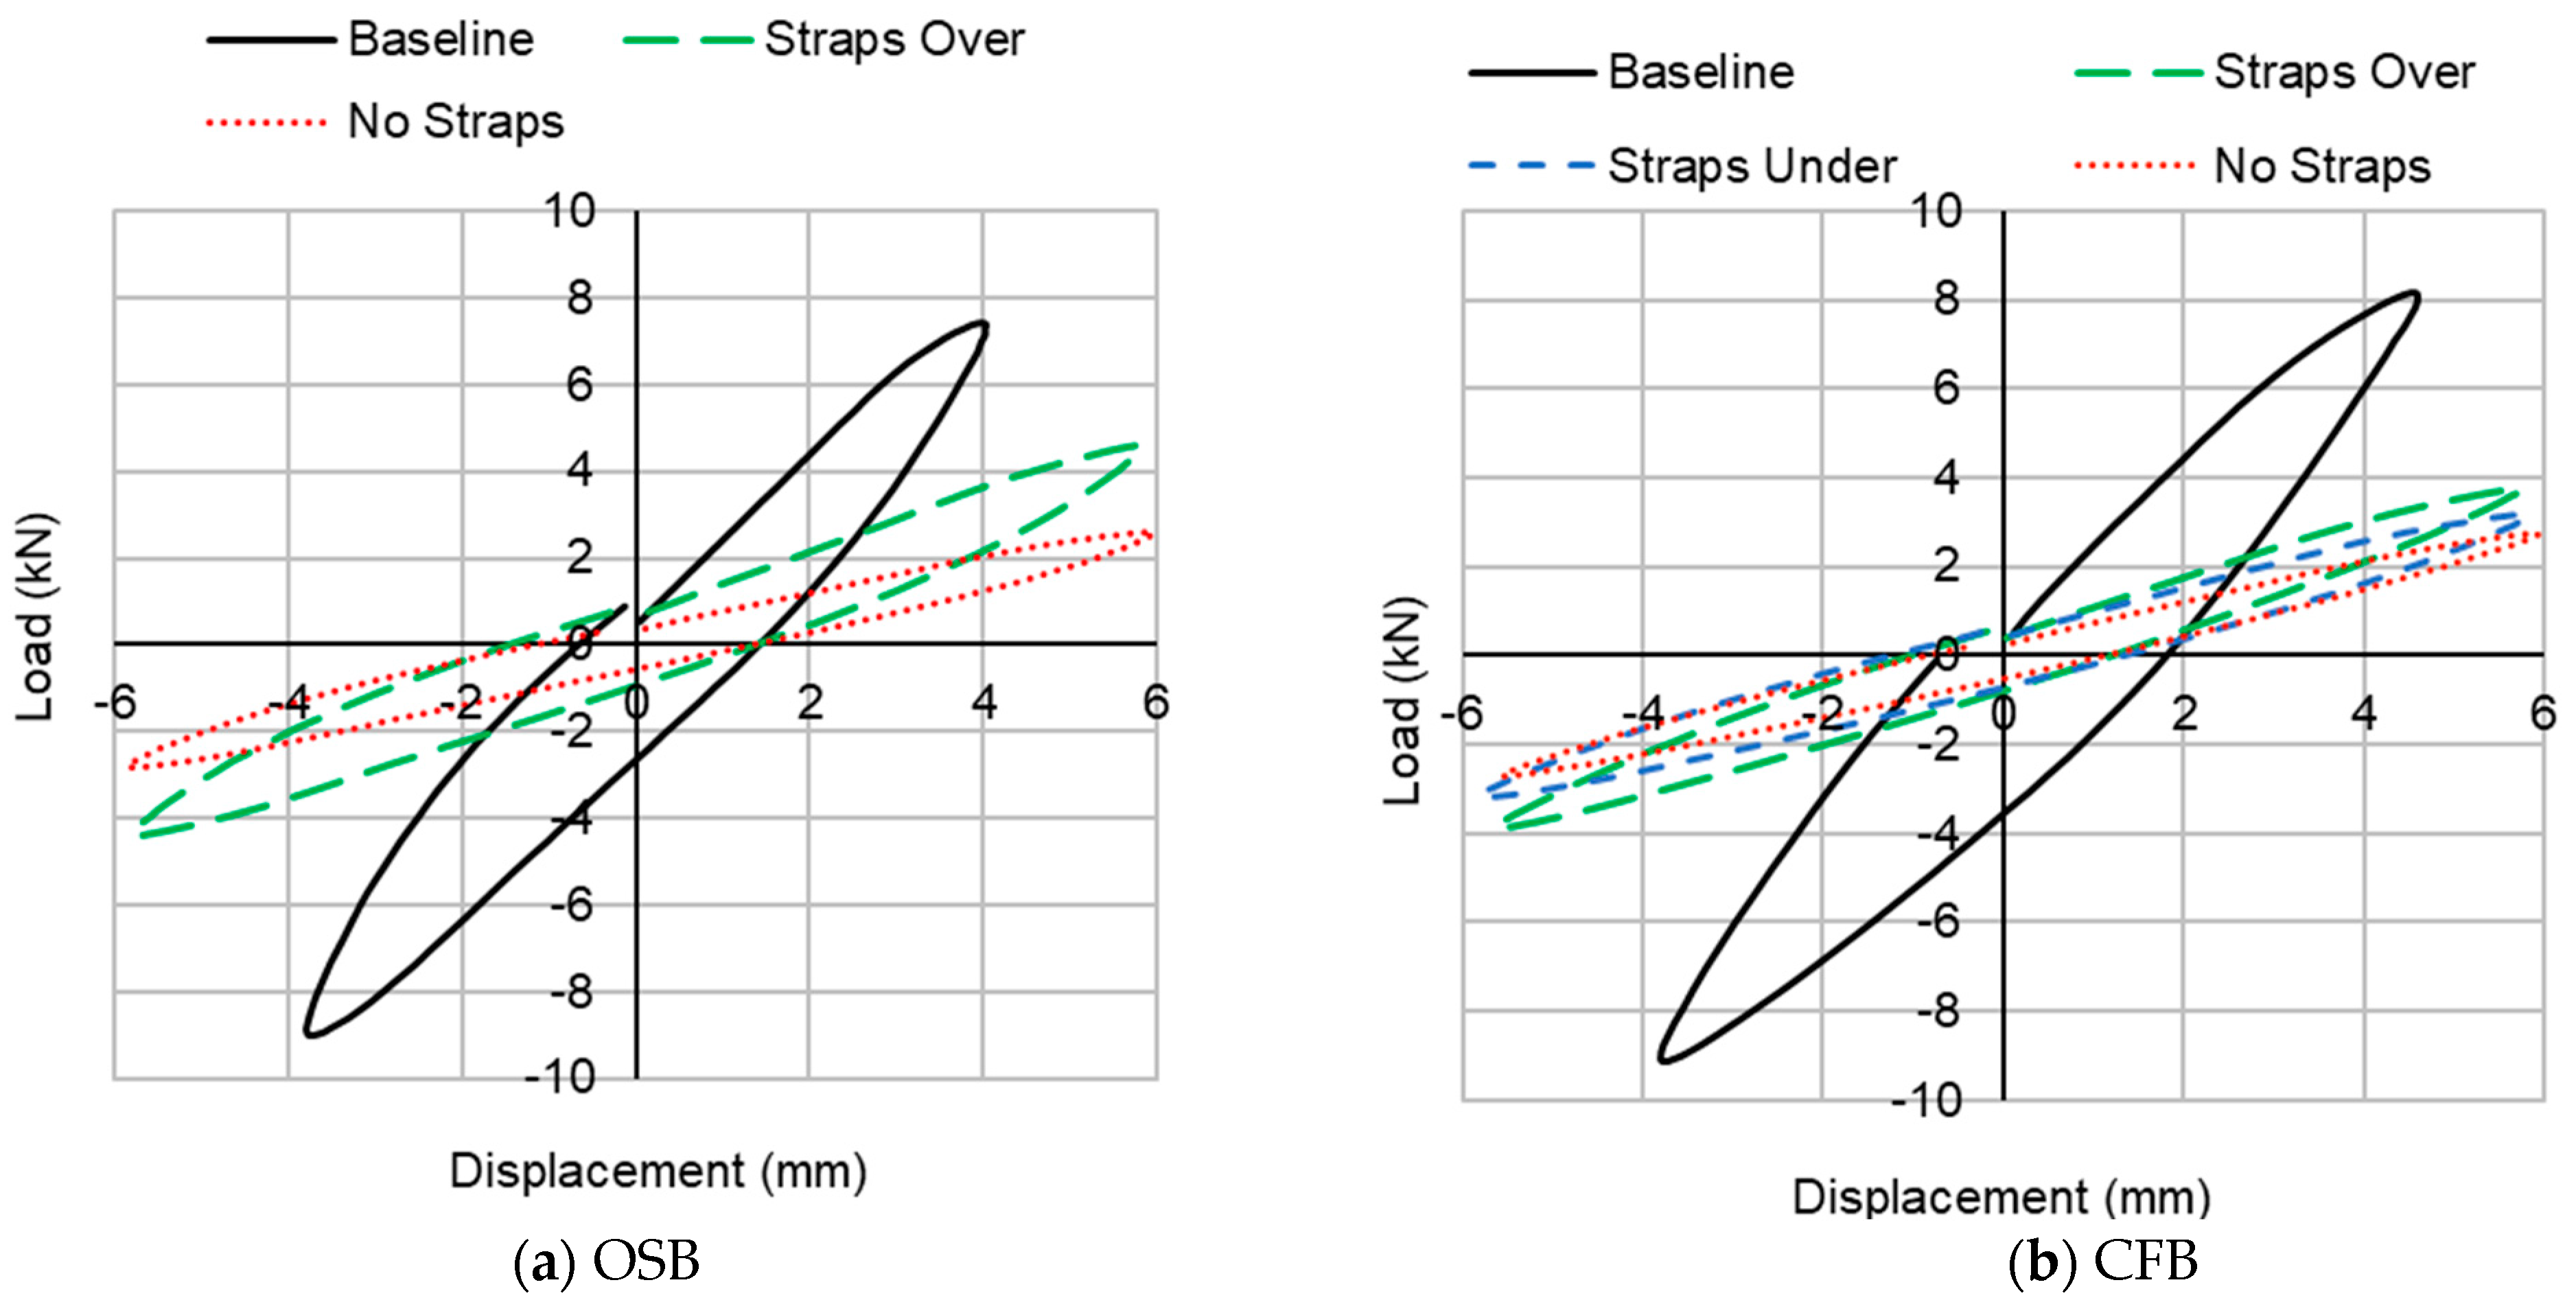
4.2.1. Hysteresis Plots

Typical hysteresis plots for the walls in this study are shown in Figure 8a,b, with the applied load on the vertical axis and the wall displacement measured with the string potentiometer on the horizontal axis. The string potentiometer displacement was used to generate the hysteresis plot rather than the actuator displacement because some slip can occur between the load spreader and the wall, especially at higher loads, and that slip should not be included in the wall displacement. Figure 8a shows the hysteresis loops for an OSB sheathed wall with window openings and straps over the sheathing (wall OSB.W.O.1) and Figure 8b is from an CFB sheathed wall with windows and straps over the sheathing (CFB.W.O.1).
It is difficult to observe the changes in behavior between multiple walls when examining the full hysteresis plots. Therefore, individual hysteresis loops are shown in Figure 9a,b, which show the differences between baseline walls and walls with openings for the cycle in the loading protocol, corresponding to the drift limit displacement which occurs during cycle 14 with a target displacement of 6.1 mm. The hysteresis loops represent the average load and displacement for each of the walls of that configuration at each time step. As expected, the baseline walls clearly show greater stiffness and peak load compared to the walls with openings, but the differences are larger with the CFB walls.

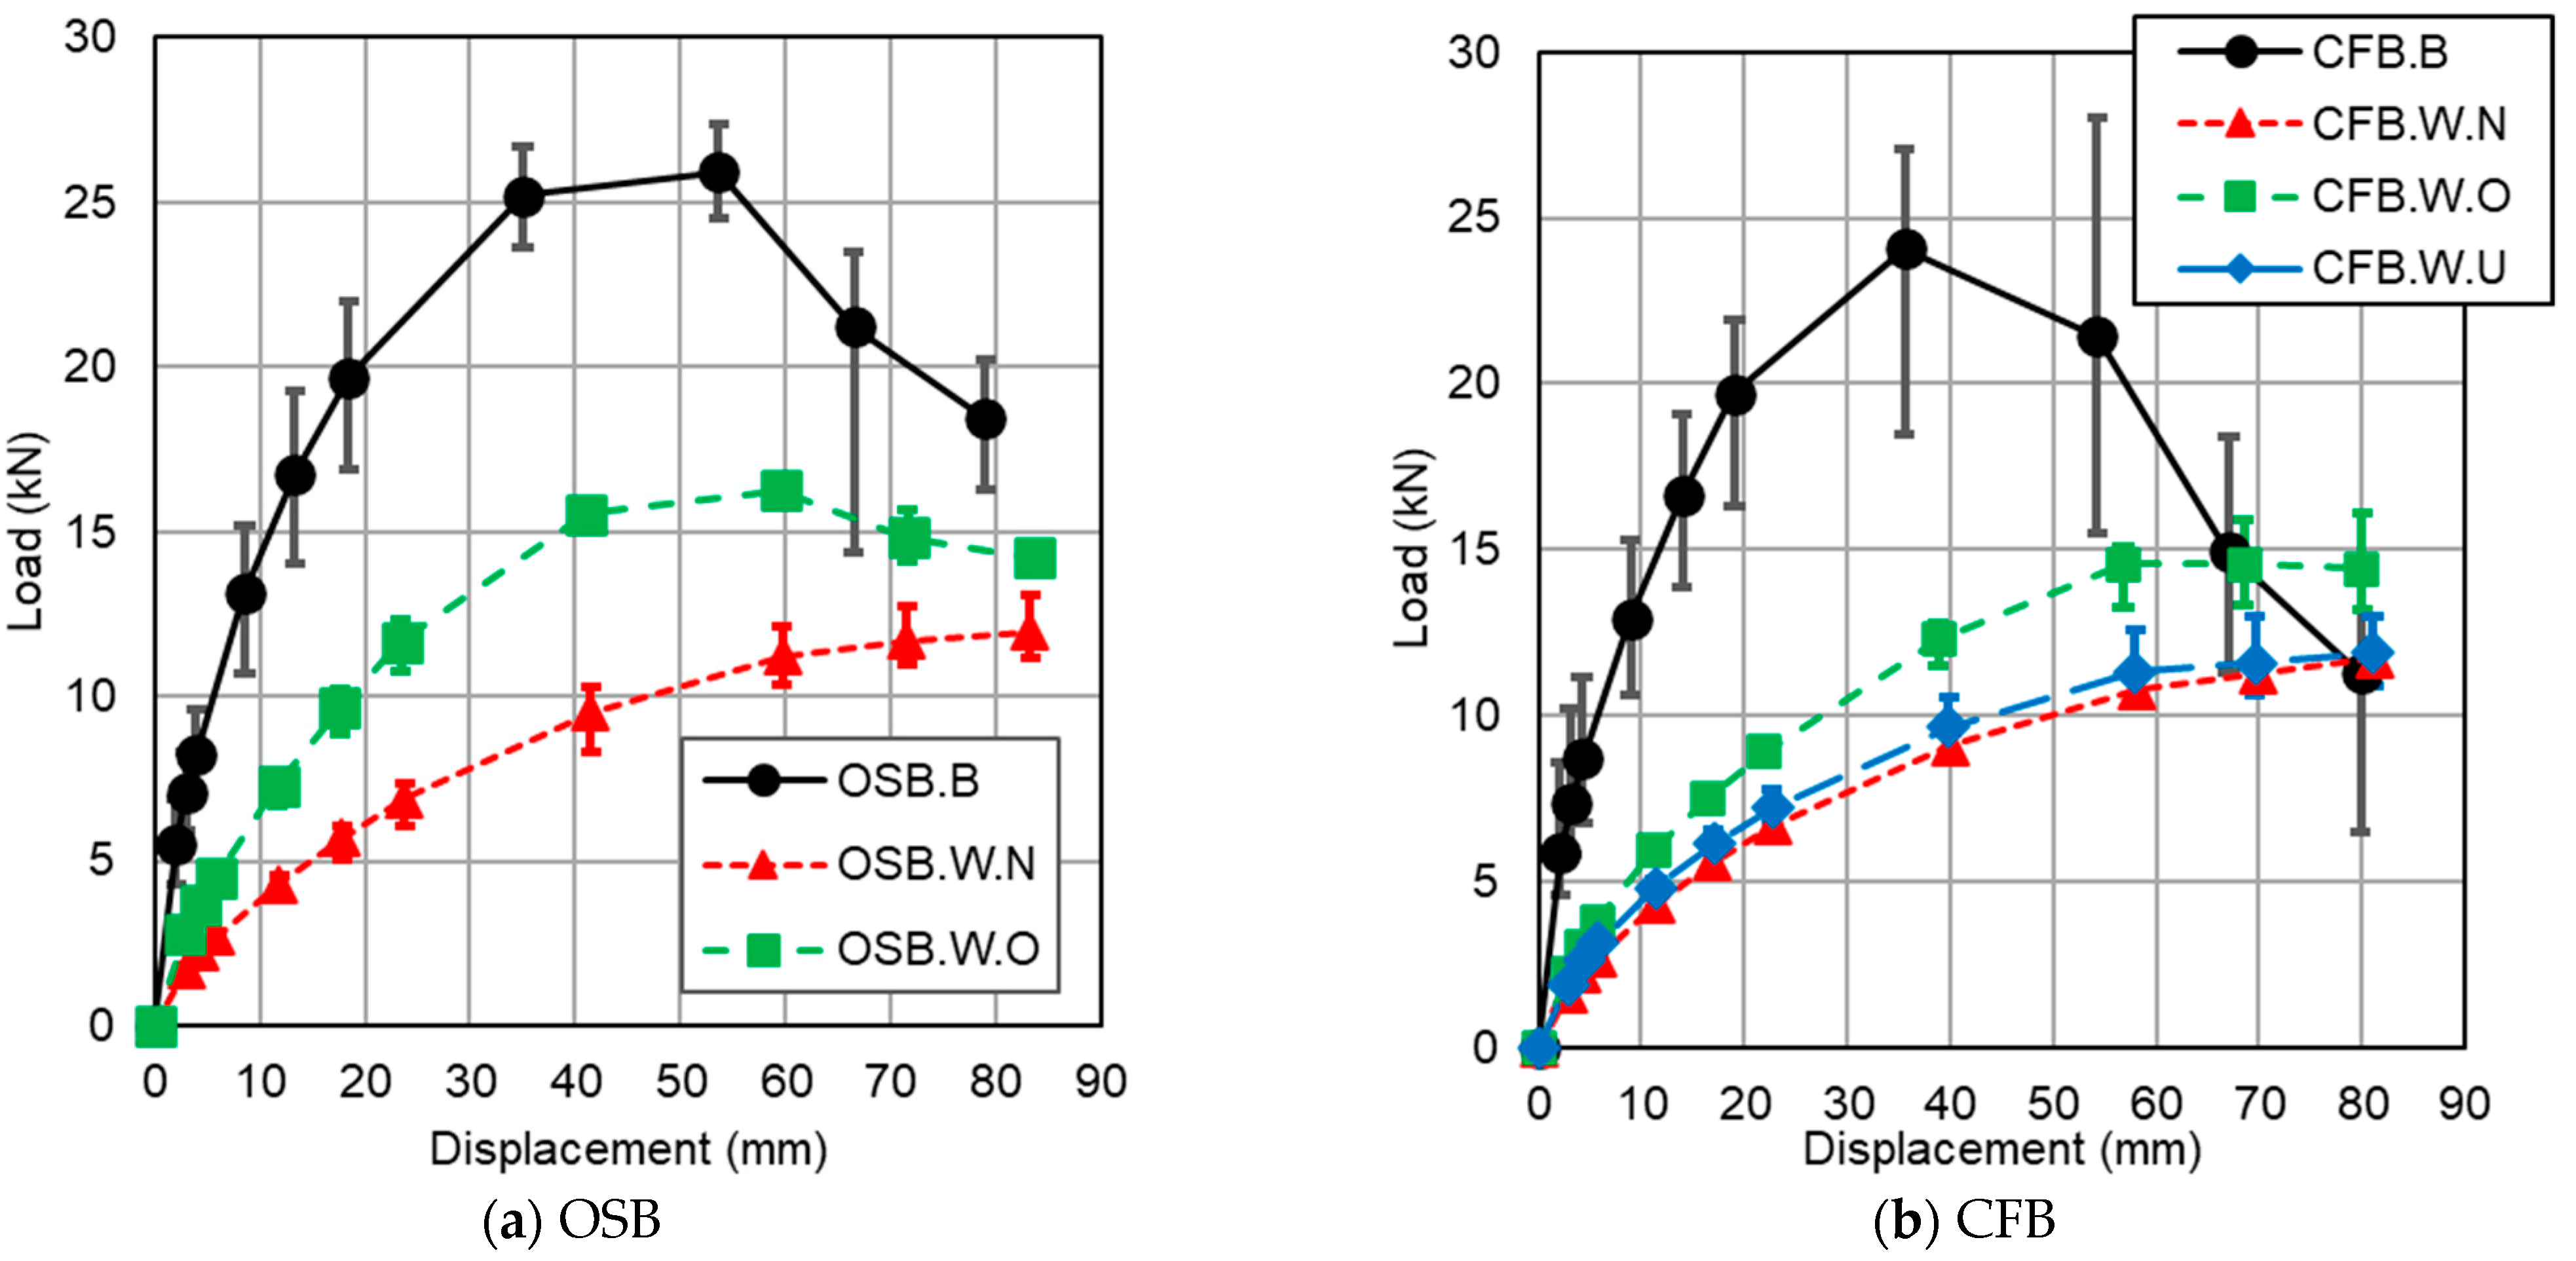
4.2.2. Backbone Capacity Plots

Figure 10a,b show the average backbone capacity curve for each wall type. These plots were created using the peak load and corresponding wall displacement for each primary cycle in the loading protocol. The line on the plot represents the average capacity at each cycle, and the error bars represent the range in capacities. For example, there are four samples of the OSB baseline walls (OSB.B). These four walls actually provide eight backbone curves as each wall provides one curve when the wall is being pushed by the actuator and one curve when it is being pulled by the actuator. Those eight curves would be bounded by the error bars on the OSB.B curve in Figure 10a.
The same trends seen with the hysteresis plots in Figure 9 are repeated here, as the baseline walls clearly have a higher stiffness and capacity than any of the walls with openings. For both the OSB and CFB walls with window openings, the addition of strapping increased the stiffness and capacity, though the increase was not as large for the CFB walls as it was for the OSB walls. Figure 10b also shows that the effectiveness of the strapping was significantly decreased when it was placed under the sheathing rather than on top. In fact, the behavior of walls with strapping under the sheathing was quite similar to the walls without strapping. For both sheathing materials, the baseline walls exhibited the most significant decrease in capacity once the peak loads were reached. The walls with window openings maintained a relatively consistent capacity to drift levels up to 80 mm.
The data obtained for the walls with openings is very consistent, with the range of data as represented by the error bars being very narrow. For the baseline walls, the range of capacities is larger, especially approaching the peak load and in the post-peak behavior. The range appears larger for the CFB.B walls than for the OSB.B walls, though with only four duplicate walls, it is difficult to conclude if the increased variability is representative of the materials or the samples that were tested.

4.2.3. Average Loading

Table 2 shows the average load and standard deviation values for the first two cycles in each step for the different wall types and strapping arrangements. Only the first two cycles are shown for simplification, since the remaining secondary cycles in each step are repetitive and the results for each secondary cycle are very consistent. These values were calculated using both the positive and negative load values for each displacement cycle, such that each wall contributed two load values to the calculations. The first cycle in each step is in bold text, while peak values for each wall are shown in red. The trends seen in these tables are similar to the trends seen prior in the hysteresis and backbone capacity plots. The baseline walls had the highest capacity through the loading regime, while the walls without straps around the opening had the lowest. Looking at the OSB walls, the walls without strapping had a capacity that was 46% of the baseline wall, while the wall with strapping had a capacity that was 63% of the baseline wall. Adding the strapping and blocking around the windows increased the capacity of the wall by 36%. Examining the CFB walls, the walls without strapping had a capacity that was 49% of the baseline wall, while the wall with strapping over the sheathing had a capacity that was 61% of the baseline wall. For the walls with window openings, adding the strapping above the sheathing increased the capacity by 24%, while adding the strapping below the sheathing only increased the capacity by 1%. This indicates that strapping under the sheathing is not effective in increasing the capacity of the wall.
Standard deviation values were generally less than 1 kN for all the walls with window openings, corresponding to standard deviations that were 10% or less of the average load at each time step. The standard deviations were higher for the baseline walls, with the variation in results being greater for the CFB walls than the OSB walls. The standard deviation for the OSB walls was 12% of the PAVG value for each time step on average, while it was 18% of the PAVG value for the CFB walls.

4.3. Comparison of OSB Walls to CFB Walls

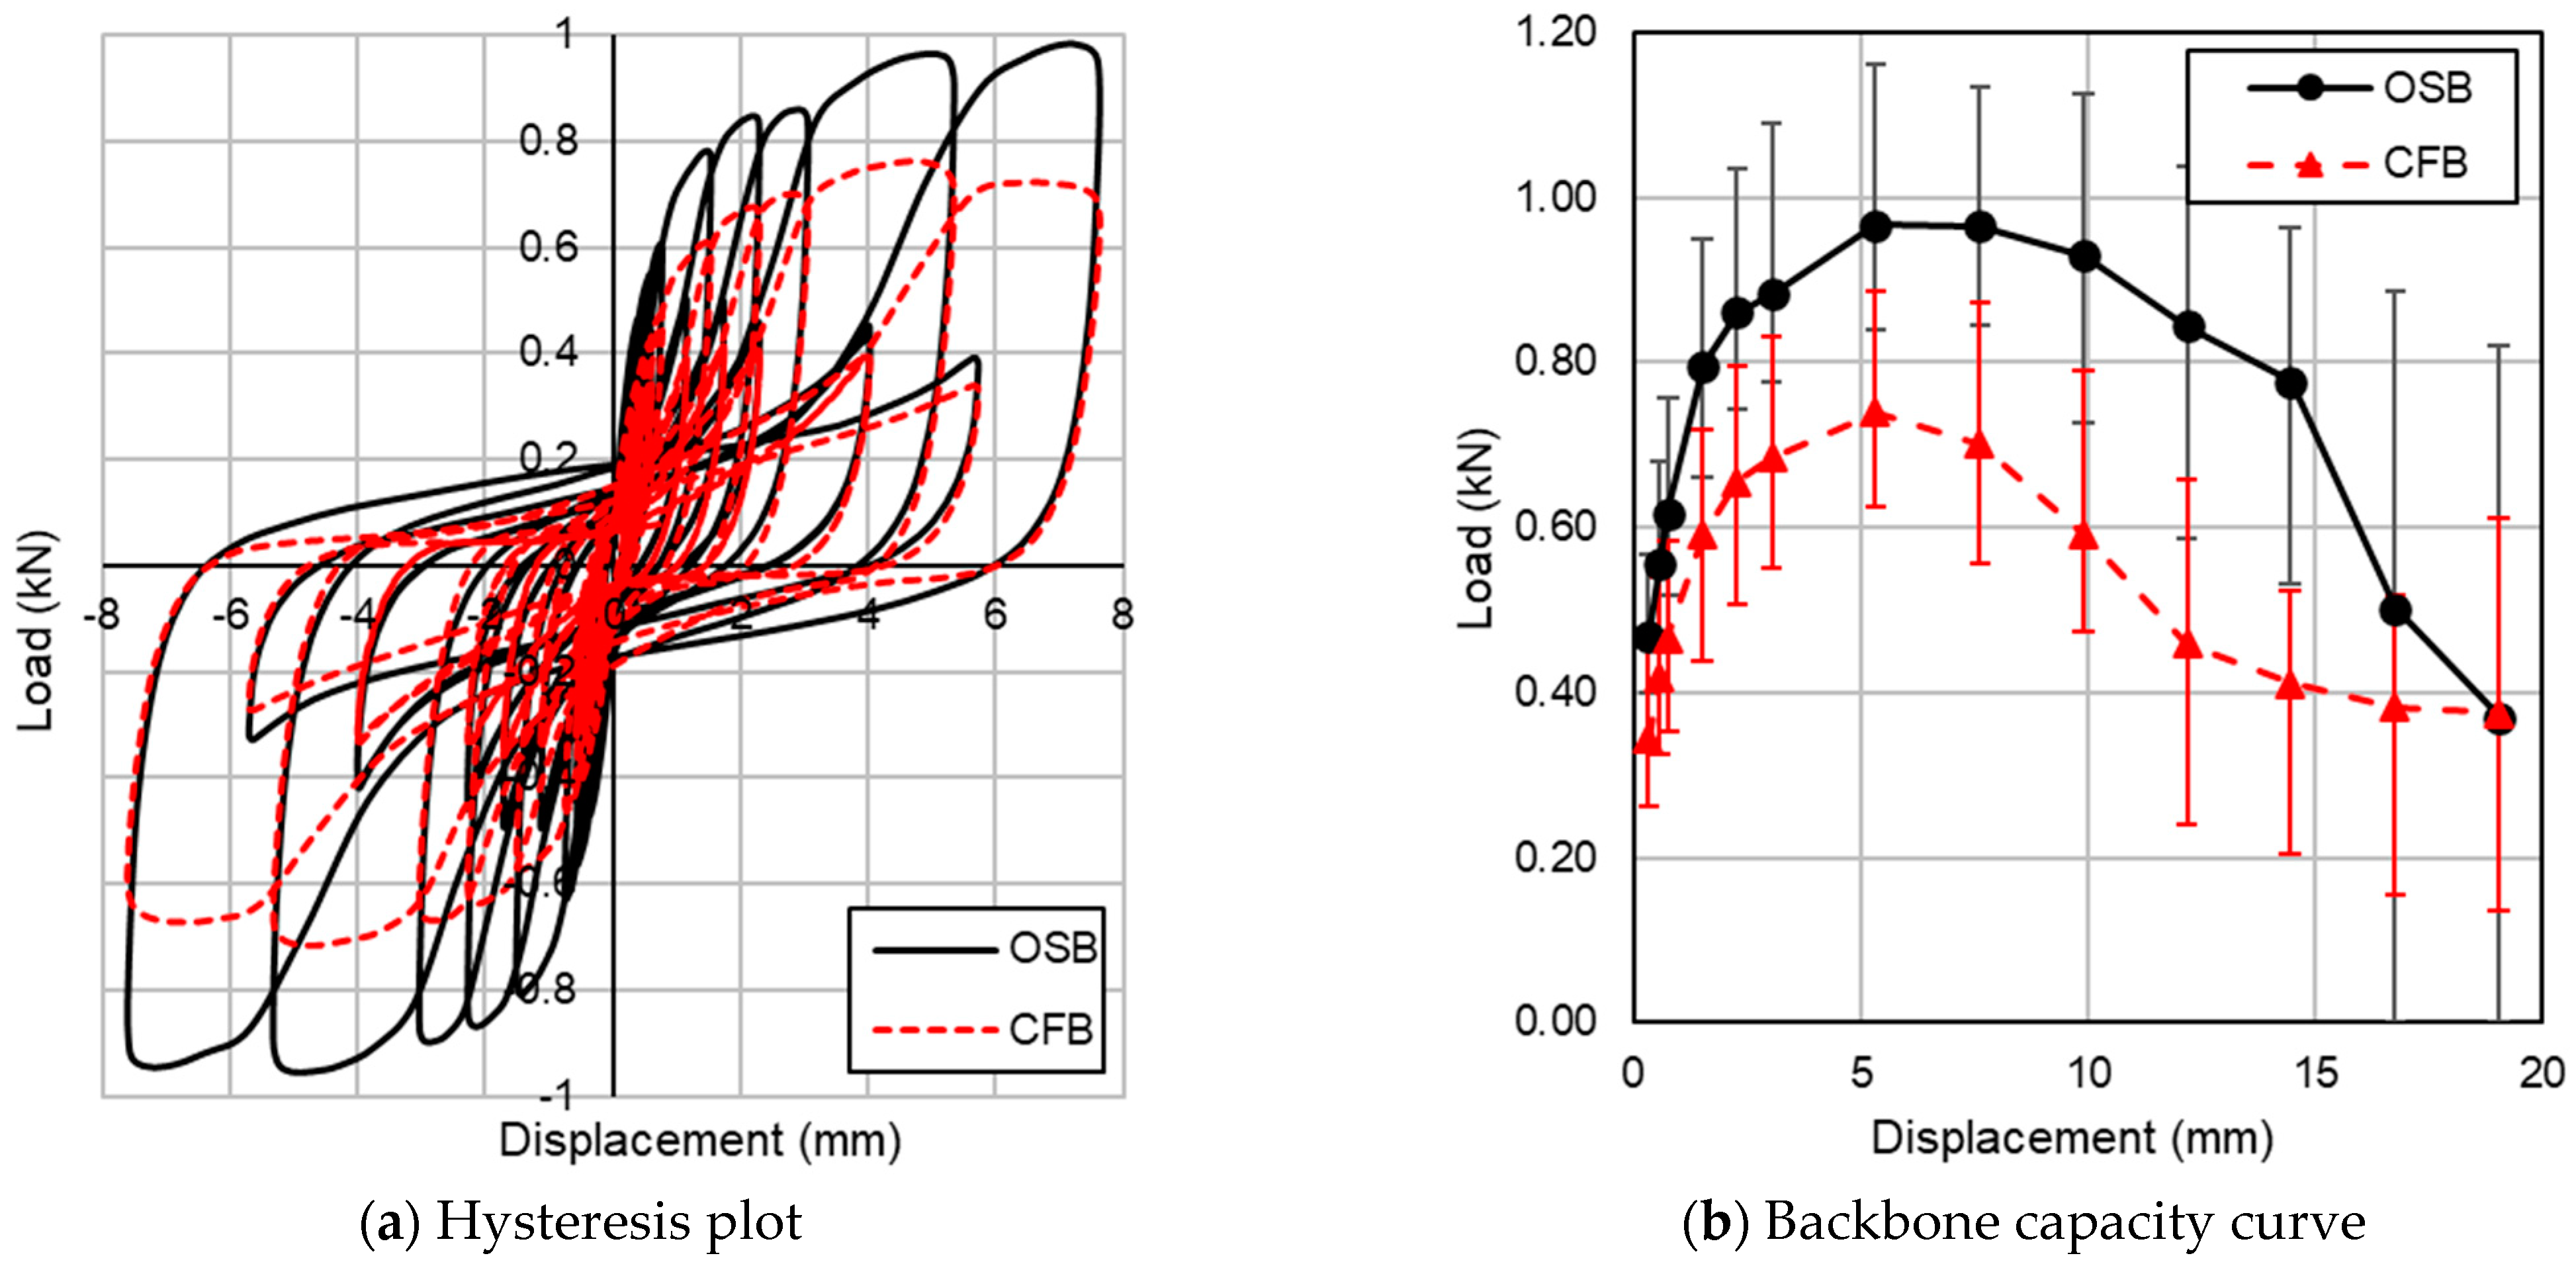
4.3.1. Hysteresis Plots

Figure 11a–c shows plot load versus wall displacement for cycle 14, which has a target displacement of 6.1 mm. This displacement corresponds to the drift limit of h/400. These plots allow for comparisons between the OSB and CFB baseline walls (Figure 11a), and walls with window openings both without (Figure 11b) and with (Figure 11c) strapping. For both the baseline walls and walls without strapping, OSB and CFB are nearly identical in stiffness and average load. When strapping is introduced, the differences in behavior become larger. The OSB sheathed walls seem to better engage the strapping, resulting in 17% greater stiffness and peak load for this cycle than the CFB wall with strapping over the sheathing. As discussed previously, the CFB walls with strapping under the sheathing have lower stiffness and peak load than the walls with strapping placed over the sheathing.

4.3.2. Backbone Capacity Plots

Figure 12a–c shows the backbone capacity plot comparing OSB to CFB walls. The error bars correspond to the range of loads at that level of displacement. For the baseline case, the OSB and CFB walls had similar loads through a displacement of 18 mm. Above this displacement, the OSB walls generated larger loads than the CFB walls.
The OSB and CFB walls without strapping showed nearly identical behavior up to a displacement of 24.5 mm, but beyond that point, the CFB walls had slightly lower average loads. The small difference at these higher displacements is not significant when compared to the range of data recorded. For walls with strapping over the sheathing, the data from the individual cycle shown in Figure 11 is consistent over a range of displacements, with the OSB walls having increased stiffness and load compared to the CFB walls. The CFB walls had a load that was approximately 80% of the load in the OSB walls up to 40 mm of displacement, after which the difference in load decreased until it was approximately equal at 80 mm.

4.3.3. Average Loading

Table 3 shows the average load and percent difference values at the first two cycles in each step for the various wall configurations. The first cycle in each step is in bold text, while peak values for each wall are shown in red. The trends seen in these tables are similar to the trends seen in the prior hysteresis and backbone capacity plots. The maximum load in each cycle for the baseline walls with OSB and CFB were within 11% through Step 7 (42.7 mm of displacement). Beyond that point, the OSB maintained higher loads, with the difference increasing as the displacement increased.
The behavior of the OSB and CFB walls without strapping was very similar, with an average difference of only 3%. However, the comparison in the load for the primary cycles shown in bold and the secondary cycles were slightly different. For the primary cycles, the CFB walls had a slightly lower load than the OSB (98% of the OSB load on average), but for the secondary cycles, CFB had a slightly higher load (108% of the OSB load on average). This indicates that the CFB sheathing was able to retain more residual capacity than the OSB, which is consistent with the higher unloading load values for the CFB seen in Figure 11b.
Examining the behavior of the walls with strapping, it is again apparent that the CFB with strapping over the sheathing had lower peak loads than the OSB, only having 87% of the OSB capacity on average. As in the walls without strapping, the PAVG for the CFB walls expressed as a percentage of the OSB PAVG was lower for the primary cycles than the secondary cycles (85% versus 90% on average). When the strapping was placed under the CFB sheathing, the average loads decreased even further, to an average of 71% of the OSB loads.

4.4. Design

Table 4 shows the capacity of the tested walls using three different criteria for failure. For ultimate capacity, the “actual” load is the highest load recorded in the test; for drift and seismic drift limit capacity, the “actual” load is interpolated from the average load backbone plots in Figure 12 for wall displacements of 6.1 mm and 12.2 mm, respectively. For the seismic drift limit only, a factor of 0.7 is applied to the “actual” load. The calculation of the design loads for the walls is described in Section Design for Allowable Loading. Table 4 also lists the ratio of actual load to design load, to represent the level of conservativeness in the design; a higher ratio means the design is more conservative.
Overall, OSB sheathed walls had higher design ratios than the CFB sheathed walls. For the baseline walls, OSB had a significantly higher factor of safety for all failure criteria, despite having slightly higher actual tested capacities. The factor of safety of the CFB walls was 67–70% of the OSB walls depending on the failure criteria. This is consistent with the results for solid walls obtained by previous research conducted by the APA [10,12]. These results can also be seen in Figure 13, which shows both the current and modified design strength for the ultimate and seismic drift limit states. The modified strength in Figure 13 represents the actual strength to design strength ratio if the CFB walls are assumed to have the same unit shear capacity as the OSB walls, rather than the higher value currently specified in the manufacturer provided data. Since the CFB and OSB walls have similar measured capacities, this results in similar design ratios, with the CFB walls having a factor of safety that is 93–99% of the OSB walls depending on the failure criteria. The range of data for the different samples tested is represented in Figure 13 by the error bars.
The walls with window openings all had design ratios that were significantly higher than the baseline walls, indicating that the design procedures for openings results in more conservative designs. For the case with window openings and no strapping, again the OSB and CFB had similar actual capacities for all three failure criteria, but the CFB had lower design ratios (71–75% of the design ratio for the OSB walls) due to the higher unit strength values provided for the material. If the OSB unit strength is applied to the CFB walls, the design ratios of the CFB are 98–103% of the design ratios for the OSB. For walls with strapping over the sheathing, the OSB has larger measured capacities than the CFB and significantly larger ratios than the CFB. Using the standard CFB design values the design ratio for CFB walls with strapping over the sheathing is 60–66% of the design ratios for the OSB walls. Using the OSB design values increases these percentages to 83–91%, but still does not completely address the lower design ratios, as the strapping does not appear as effective for the CFB sheathed walls. The CFB walls with strapping under the sheathing have capacities for all failure criteria that are within 10% of the walls without strapping, indicating how little the strapping under sheathing does for the capacity.

4.5. Failure Mechanisms

4.5.1. Baseline Walls

The OSB baseline walls did not have any noticeable damage at up to 25.4 mm of displacement. Beyond this point, nail withdrawal and sheathing detachment gradually increased as the wall reached its maximum displacement. Occasional nail fracture or nail breakout from the sheathing was observed, but the primary failure mechanism was nail withdrawal. Similarly, for the CFB baseline walls, the primary failure mechanisms included staple withdrawal, staple breakout from the CFB, and occasional staple fracture, as shown in Figure 14. CFB baseline walls displayed no signs of damage at up to 25.4 mm of displacement. Damage to the wood framing and staple withdrawal/breakage started to appear above 25.4 mm and up to the maximum displacement. After reaching the ultimate load the CFB.B sheathing buckled between the vertical framing studs.

4.5.2. Walls with Openings

Walls with openings did not show as much visual damage as the baseline walls, since ultimate loads were not as high due to the walls’ reduced stiffness. Like the baseline walls, there was no damage at displacements under 25.4 mm, but above this displacement damage began to occur. For OSB walls, some nails pulled through the sheathing, which was likely caused by overdriven nails. For OSB walls with strapping, buckling of the strap was seen. For CFB walls, there was detachment of the staples and sheathing. The top and bottom of the openings, especially on CFB.W.U walls, were the most frequent locations where staples came loose and ripped out of the sheathing (Figure 15a). This was likely caused by the small surface area on the wood framing available for stapling due to the strap blocking much of the framing, forcing the staple closer to the edge of the CFB. Buckling of the straps occurred, similar to the OSB walls, and the nails noticeably pulled out of the straps (Figure 15b). Elsewhere on the walls showed minimal detachment of staples, and no damage was noticed on the wood framing.

5. Discussion

As expected, the baseline walls exhibited the highest peak load and stiffness for both the OSB and CFB walls. Adding two window openings to the walls decreased their capacity by approximately 50% for both the CFB (51%) and the OSB (54%). The addition of the straps around the window increased the peak loads. The strapping was more effective for the OSB, where strapping increased the load capacity of the walls with openings by 36% compared to a 24% increase for the CFB with strapping over the sheathing. Placing the strapping under the CFB was not very effective, as it only increased capacity by 1% when compared to a wall with no strapping. The decrease in effectiveness of the strapping when placed under the sheathing is likely due to several factors. Placing the strapping under the sheathing makes it harder to connect the sheathing in that area to the framing as the staples are unable to penetrate the strap, which is blocking most of the framing. In contrast, when the strapping is placed over the sheathing, the additional fasteners used to connect the strapping pass through the sheathing, increasing the rigidity and capacity of the sheathing–framing connection in this region. Additionally, when the strapping is placed over the sheathing, it provides a more direct connection between adjacent sheathing panels that are trying to move vertically relative to one another during the applied displacements. The strapping helps to restrain this movement, which could increase both the stiffness and load capacity of the wall.
For the walls with openings and no strapping, a very similar performance was observed between the OSB and CFB walls. The peak loads for each cycle were within 3% on average for the different sheathing materials. On the primary loading cycles, the OSB had a 2% higher capacity on average, while on the secondary loading cycles, the CFB averaged 8% higher loads. The difference in behavior between the primary and secondary cycles is because the CFB walls remained more elastic and maintained more stiffness at higher displacement values. This can be observed in the higher unloading values in the hysteresis loops shown in Figure 11.
As mentioned previously, strapping is not as effective for the CFB sheathed walls as it is for the OSB walls. Therefore, since the walls without strapping behaved similarly, the CFB walls with strapping have a lower capacity when compared to the OSB walls. The CFB walls with strapping over the sheathing had a capacity that was 87% of the OSB walls. As observed when comparing the walls without strapping, the CFB walls performed better on the secondary cycles than the primary cycles, but still not surpassing the performance of the OSB walls. A potential justification for why the straps are not as effective for the CFB is due to the decreased fastener spacing for the CFB. As discussed previously, an additional benefit of the strapping is the increased connection between the sheathing and framing around the strapping due to fasteners added for the strapping. Since the CFB already has more fasteners due to the decreased spacing there is less benefit from the additional fasteners. More research would be required to further explore this behavior.
When looking at the ratios of measured capacities to design capacities, the OSB baseline wall provides a good reference point for the industry standard for these ratios as it has well-defined and researched behavior and design values. The CFB baseline wall has ratios below the OSB ratios, indicating that the CFB wall is less conservative. Adjusting the allowable seismic unit shear stated for design of the CFB to a value equal to the OSB used in this study results in factors of safety that are more consistent with industry standard values. For all walls with openings, the factors of safety are much higher than the OSB baseline walls, indicating significantly more conservative designs. In general, for shear walls with openings, the current design methodologies, including the assumptions made in the force transfer around opening procedure, the reduction factors for the aspect ratios of the piers or solid segments, and the reduction based on the percentage of opening area and full height segments, appear to be overly conservative and could be re-examined to improve the design efficiency.

6. Conclusions and Future Research

The following conclusions can be drawn based on the research program described in this paper:
  • CFB sheathing is a viable and sustainable alternative to OSB for shear walls when examining the wall capacity and stiffness for both solid walls and walls with openings. However, adjustments are required to the current CFB design values as the ratio of measured capacity to design capacity for CFB walls are 60–75% of the ratios for the OSB walls. This is consistent with the results for solid walls obtained by previous research conducted by the APA [10,12] and is due to the higher unit shear values specified by the manufacturer of the CFB walls. Recalibration of these CFB unit shear values is necessary before the material can be recommended for widespread use in the industry.
  • The staple connection used to connect the CFB to the framing has a lower capacity (average of 0.75 kN) than a standard nail connection used for the OSB (average of 0.98 kN). This lower capacity can be offset by the fastener spacing currently specified for CFB, which results in more fasteners.
  • For solid walls, the CFB and OSB behave similarly for displacements up to 20 mm. Beyond this point, the OSB wall exhibits slightly greater capacity, reaching 26.09 kN on average compared to 24.3 kN for the CFB sheathed walls.
  • CFB walls with openings and no strapping have a similar capacity to the OSB walls examined in this study, resisting 11.72 kN and 11.96 kN on average, respectively.
  • CFB does not take advantage of strapping to the extent that OSB does. Additional research is recommended to examine why the strapping is not as effective and what reduction factor might be required for various opening configurations.
  • CFB walls with strapping under the sheathing behave similar to CFB walls with no strapping. It is recommended that if strapping is needed for the design that it be placed on top of the sheathing.
  • For both the OSB and CFB walls, the measured capacity to design capacity ratios are significantly higher for walls with openings than for the baseline walls. It is recommended that the industry examine the design procedures for walls with openings to ensure the designs are efficient while maintaining the required level of safety under wind and seismic loading.
Since this is a preliminary investigation of the behavior of CFB walls, additional research is needed in the future to better understand the behavior of this material. Topics that need to be evaluated include:
  • The behavior of CFB walls of different sizes and with different opening configurations.
  • The performance of different types of CFB sheathing, as only one thickness from one manufacturer was evaluated.
  • The effect of different fastener types and spacings on the behavior of CFB walls.
  • The performance of walls with multiple sheathing types; for example, CFB walls with gypsum sheathing on the inside.
  • The durability of CFB walls under real-world environment conditions, and the behavior of walls after exposure to moisture and other environmental effects.
  • The lifecycle cost and broader impacts assessment of CFB relative to OSB.

Author Contributions

All authors contributed to the paper. Specific contributions include: Conceptualization, R.Z.; methodology, E.S.M., D.W.D. and R.Z.; investigation, T.F.; data visualization, T.F. and E.S.M.; writing–original draft preparation, E.S.M.; writing–review and editing, D.W.D., T.F. and R.Z.; supervision and project administration, E.S.M. and D.W.D.; funding acquisition, D.W.D. and R.Z. All authors have read and agreed to the published version of the manuscript.

Funding

This research was funded by Mulhern + Kulp Structural Engineering (Grant No. VU 529602) with additional funding provided by Villanova University.

Data Availability Statement

The raw data supporting the conclusions of this article will be made available by the authors on request.

Acknowledgments

The authors gratefully acknowledge Jeffrey Cook for providing valuable laboratory planning and assistance; and Ryan Schnabel, Bridget LaSala, and Ed Bolte for testing data utilized in this study. This work was supported by Mulhern + Kulp Structural Engineering, Ambler, PA and Ox Engineered Products, Northville, MI.

Conflicts of Interest

The primary source of funding for this research was from Mulhern and Kulp, a residential structural engineering firm. They were involved in the design of the study as well as analysis of the results and the writing of the manuscript. Their objective in sponsoring the research was to better understand the performance of cellulosic fiber board for shear wall applications. Other than the role of the funders, the authors declare no other conflicts of interest.

References

  1. Rose, J.D. Preliminary Testing of Wood Structural Panel Shear Walls under Cyclic (Reversed) Loading; The Engineered Wood Association: Tacoma, WA, USA, 1998; Form No. W260A. [Google Scholar]
  2. Shadravan, S.; Ramseyer, C.C. Investigation of Wood Shear Walls Subjected to Lateral Load. Structures 2018, 16, 82–96. [Google Scholar] [CrossRef]
  3. Xiao, Y.; Li, Z.; Wang, R. Lateral Loading Behaviors of Lightweight Wood-Frame Shear Walls with Ply-Bamboo Sheathing Panels. J. Struct. Eng. 2014, 141, B4014004. [Google Scholar] [CrossRef]
  4. Gonzalez-Beltran, G.E. Plybamboo Wall-Panels for Housing: Structural Design. Ph.D. Thesis, Technische Universiteit Eindhoven, Eindhoven, The Netherlands, 2003. [Google Scholar] [CrossRef]
  5. Correal, J.F.; Varela, S. Experimental Study of Glued Laminated Guadua Bamboo Panel as an Alternative Shear Wall Sheathing Materia. Key Eng. Mater. 2012, 517, 164–170. [Google Scholar] [CrossRef]
  6. Xu, W.; Corbi, O.; Mapesela, S.; Chen, Y.; Gaff, M.; Li, H. Lateral Performance of Wood-frame Shear Walls-A Critical Review. J. Renew. Mater. 2022, 11, 2143–2169. [Google Scholar] [CrossRef]
  7. He, Z.; Fang, H.; Zhang, X.; Shen, C. Lateral behavior of wood frame shear wall using PVC wood-plastic composite (WPC) veneer panels. J. Build. Eng. 2024, 89, 109367. [Google Scholar] [CrossRef]
  8. Rammer, D.R.; Williamson, T. Performance of Structural Insulated Panel Walls under Seismic Loading; United States Department of Agriculture: Washington, DC, USA, 2020; FPL-RP-704. [Google Scholar]
  9. Phillips, R.J. Investigation of Shear Capacity for Light-Frame Wood Walls Constructed with Insulated Oriented Strand Board Panels. Master’s Thesis, Clemson University, Clemson, SC, USA, 2015. [Google Scholar]
  10. The Engineered Wood Association. Laboratory Tests Evaluate Design Values of Thermo-Ply Red; The Engineered Wood Association: Tacoma, WA, USA, 2015; Form No. SP 1189C. [Google Scholar]
  11. International Code Council Evaluation Service, Acceptance Criteria for Establishing Seismic Equivalency to Code-Prescribed Light-Frame Shear Walls Sheathed with Wood Structural Panels Rated for Shear Resistance or Steel Sheets, 2014, ICC-ES AC436. Available online: https://shop.iccsafe.org/ac436-establishing-seismic-equivalency-to-code-prescribed-light-frame-shear-walls-sheathed-with-wood-structural-panels-rated-for-shear-resistance-or-steel-sheets-approved-march-2018-editorially-revised-december-2020-pdf-download.html (accessed on 1 September 2024).
  12. The Engineered Wood Association. Performance of Flexible Structural Sheathing; The Engineered Wood Association: Tacoma, WA, USA, 2020; Form No. SP 1172. [Google Scholar]
  13. American Wood Council. Special Design Provisions for Wind and Seismic with Commentary; American Wood Council: Leesburg, VA, USA, 2021. [Google Scholar]
  14. International Code Council. International Building Code; International Code Council: Falls Church, VA, USA, 2000. [Google Scholar]
  15. Aranda, R.; Salenikovich, A.; Dolan, J.D.; Dechent, P. Characterization of the Lateral Resistance of Stapled Shear Walls. In Proceedings of the 2019 Modular and Offsite Construction (MOC) Summit, Banff, AB, Canada, 21–24 May 2019. [Google Scholar] [CrossRef]
  16. Talbot, K.C.; Reaveley, L.D.; Pantelides, C.P. Structural performance of stapled wood shear walls under dynamic loads. In Proceedings of the 14th World Conference on Earthquake Engineering, Beijing, China, 12–17 October 2008. [Google Scholar]
  17. Yeh, B.; Skaggs, T.; Lam, F.; Li, M.; Rammer, D.; Wacker, J. Evaluation of Force Transfer Around Openings—Experimental and Analytical Studies; The Engineered Wood Association: Tacoma, WA, USA, 2011; Form No. M410. [Google Scholar]
  18. Doudak, G.; Smith, I. Capacities of OSB-Sheathed Light-Frame Shear-Wall Panels with or without Perforations. J. Struct. Eng. 2009, 135, 326–329. [Google Scholar] [CrossRef]
  19. Doudak, G.; Smith, I.; McClure, G.; Mohammad, M.; Lepper, P. Tests and finite element models of wood light-frame shear walls with openings. Proj. Struct. Eng. Mater. 2006, 8, 165–174. [Google Scholar] [CrossRef]
  20. Berry, E.; Shadravan, B.; Tehrani, F.M. A Sustainable Approach to Assess the Resilience of Perforated Wood Shear Walls. In Proceedings of the AEI (ASCE), Oklahoma City, OK, USA, 11–13 April 2017; pp. 506–512. [Google Scholar]
  21. Li, M.; Lam, F.; Yeh, B.; Skaggs, T.; Rammer, D.; Wacker, J. Modeling Force Transfer around Openings in Wood-Frame Shear Walls. J. Struct. Eng. 2012, 138, 1419–1426. [Google Scholar] [CrossRef]
  22. Kermani, A.; Hairstans, R. Racking Performance of Structural Insulated Panels. J. Struct. Eng. 2006, 132, 1806–1812. [Google Scholar] [CrossRef]
  23. Rammer, D.R.; Ross, J.R.; Kochkin, V.G. SIP Shear Walls: Cyclic Performance of High-Aspect-Ratio Segments and Perforated Walls; United States Department of Agriculture: Washington, DC, USA, 2015; FPL-RP-682:1-19. [Google Scholar]
  24. Ryoo, J.; Nah, H.; Choi, S. Performance of structural insulation panels under eccentric axial and racking loads with varying opening ratios. Structures 2024, 67, 106969. [Google Scholar] [CrossRef]
  25. Ox Engineered Products, Thermo-Ply Structural Sheathing vs. OSB. Available online: https://www.oxengineeredproducts.com/wp-content/uploads/2022/06/OX-Thermo-Ply-vs-OSB.pdf (accessed on 1 September 2024).
  26. E2126-11; Standard Test Methods for Cyclic (Reversed) Load Test for Shear Resistance of Vertical Elements of the Lateral Force Resisting Systems for Buildings. ASTM International: West Conshohocken, PA, USA, 2011.
  27. Ox Engineered Products, Thermo-Ply Blue Technical Evaluation Report, No. 1004-02, Table 4. 2013. Available online: https://www.drjcertification.org/ter/1004-02 (accessed on 1 September 2024).
  28. Breyer, D.E.; Fridley, K.J.; Cobeen, K.E.; Pollock, D.G. Design of Wood Structures, 6th ed.; McGraw Hill: New York, NY, USA, 2005. [Google Scholar]
  29. The Engineered Wood Association (APA). Design for Force Transfer Around Openings (FTAO); Technical Note Number T555B; The Engineered Wood Association: Tacoma, WA, USA, 2022. [Google Scholar]
  30. ASCE/SEI 7-16; Minimum Design Loads and Associated Criteria for Buildings and Other Structures. American Society of Civil Engineers (ASCE): Reston, VA, USA, 2016. [CrossRef]
  31. ICC Evaluation Service, Inc. Acceptance Criteria for Prefabricated Wood Shear Panels; ICC Report AC130; ICC Evaluation Service, Inc: Brea, CA, USA, 2020. [Google Scholar]
Figure 1. Connection test specimens and setup.
Buildings 14 03097 g001
Figure 2. Wall configurations, abbreviations, and quantities.
Buildings 14 03097 g002
Figure 3. (a) Walls with openings framing configuration. (b) Walls with openings sheathing and strapping configuration.
Buildings 14 03097 g003aBuildings 14 03097 g003b
Figure 4. Test setup.
Buildings 14 03097 g004
Figure 5. CUREE basic loading protocol.
Buildings 14 03097 g005
Figure 6. Force transfer around openings method.
Buildings 14 03097 g006
Figure 7. Load—deflection behavior of connection tests.
Buildings 14 03097 g007
Figure 8. Wall hysteresis plot for full loading protocol.
Buildings 14 03097 g008
Figure 9. Drift limit design hysteresis cycle comparing baseline to openings.
Buildings 14 03097 g009
Figure 10. Average load backbone capacity plot comparing baseline to openings.
Buildings 14 03097 g010
Figure 11. Drift limit design hysteresis cycle comparing OSB to CFB with openings.
Buildings 14 03097 g011
Figure 12. Average load backbone capacity plot comparing OSB to CFB with openings.
Buildings 14 03097 g012
Figure 13. Experimental vs. design capacity for walls.
Buildings 14 03097 g013
Figure 14. CFB baseline wall failure mechanisms.
Buildings 14 03097 g014
Figure 15. CFB wall with openings failure mechanisms.
Buildings 14 03097 g015
Table 1. Summary of design calculations.
Adjusted Unit Shear Capacity (kN/m)Effective Length (m)Capacity (kN)
OSBBaseline3.503.6612.81
No Straps3.540.5672.01
Straps3.540.9173.25
CFBBaseline4.893.6617.90
No Straps4.890.5672.77
Straps4.890.9174.49
Table 2. Average load and standard deviation comparing baseline to openings.
StepCycleTarget Displ.OSBCFB
BaselineOpeningsBaselineOpenings
No StrapsStrapsNo StrapsStraps OverStraps Under
PAVGS.D.PAVGS.D.PAVGS.D.PAVGS.D.PAVGS.D.PAVGS.D.PAVGS.D.
mmkNkNkNkNkNkNkNkNkNkNkNkNkNkN
113.05.60.91.70.12.80.15.91.31.60.12.20.11.90.1
22.34.60.61.40.12.30.14.91.21.30.11.80.11.60.1
274.67.10.92.20.13.70.27.41.42.20.03.10.22.60.1
83.45.50.61.80.12.90.26.01.41.80.12.50.22.10.1
3146.18.31.12.70.14.50.28.71.32.70.13.80.23.20.1
154.66.30.72.10.13.50.27.01.42.20.13.00.22.60.2
42112.213.11.74.30.37.30.413.01.34.30.25.90.34.80.2
229.19.31.03.10.15.50.49.61.33.40.14.70.23.90.2
52518.316.81.85.70.49.70.616.61.55.60.37.50.36.20.3
2613.711.41.14.00.27.10.611.51.44.30.25.80.24.80.3
62924.419.71.86.90.611.70.619.71.76.70.38.90.37.20.3
3018.312.70.94.70.38.30.612.81.55.10.26.70.35.50.4
73242.725.21.09.50.915.50.124.12.99.10.312.30.59.70.7
3332.014.40.86.10.410.30.214.62.56.60.38.70.46.80.5
83561.025.91.111.20.816.30.521.44.310.80.314.60.711.31.0
3645.712.71.56.80.49.80.511.32.27.60.39.80.87.50.7
93873.221.22.911.70.914.80.715.02.311.30.214.61.011.61.0
3954.910.21.26.70.58.80.48.62.47.70.29.41.07.40.7
104185.318.51.612.01.014.20.311.32.811.70.214.41.211.90.8
4264.07.92.86.80.68.50.26.12.38.00.29.20.97.50.5
Table 3. Average load and percent difference comparing OSB to CFB.
StepCycleTarget Displ.BaselineOpening—No StrapsOpening—Straps
OSBCFBOSBCFBOSBCFB with Straps OverCFB with Straps Under
PAVGPAVG% of OSB LoadPAVGPAVG% of OSB LoadPAVGPAVG% of OSB LoadPAVG% of OSB Load
(mm)kNkNkNkNkNkNkN
113.05.65.9106%1.71.695%2.82.280%1.968%
22.34.64.9107%1.41.394%2.31.879%1.669%
274.67.17.4105%2.22.299%3.73.183%2.671%
83.45.56.0109%1.81.899%2.92.584%2.171%
3146.18.38.7105%2.72.7101%4.53.885%3.270%
154.66.37.0111%2.12.2103%3.53.087%2.673%
42112.213.113.099%4.34.3100%7.35.981%4.866%
229.19.39.6104%3.13.4109%5.54.786%3.970%
52518.316.816.699%5.75.698%9.77.578%6.264%
2613.711.411.5101%4.04.3108%7.15.882%4.867%
62924.419.719.7100%6.96.797%11.78.976%7.262%
3018.312.712.8101%4.75.1107%8.36.781%5.566%
73242.725.224.196%9.59.195%15.512.379%9.762%
3332.014.414.6102%6.16.6109%10.38.784%6.866%
83561.025.921.483%11.210.896%16.314.690%11.370%
3645.712.711.389%6.87.6112%9.89.899%7.576%
93873.221.215.070%11.711.396%14.814.698%11.678%
3954.910.28.685%6.77.7116%8.89.4106%7.483%
104185.318.511.361%12.011.798%14.214.4101%11.984%
4264.07.96.177%6.88.0118%8.59.2108%7.588%
AVERAGE 95% 103% 87% 71%
Table 4. Measured loads versus design load.
Ultimate Capacity (Peak Load)
OSBCFB
Wall Config.Applied Load (kN)RatioWall Config.Applied Load (kN)Ratio
ActualDesignActualDesign
OSB.B26.0912.812.04CFB.B24.3017.901.36
OSB.W.N11.962.015.95CFB.W.N11.722.774.23
OSB.W.O16.263.255.00CFB.W.O14.844.493.31
CFB.W.U11.894.492.65
Drift Limit Capacity (load at displacement of 6.1 mm)
OSBCFB
Wall Config.Applied Load (kN)RatioWall Config.Applied Load (kN)Ratio
ActualDesignActualDesign
OSB.B10.5812.810.83CFB.B10.4517.900.58
OSB.W.N2.762.011.37CFB.W.N2.842.771.02
OSB.W.O4.643.251.43CFB.W.O3.974.490.88
CFB.W.U3.264.490.73
Seismic Drift Limit Capacity (load at displacement of 12.2 mm X 0.7)
OSBCFB
Wall Config.Applied Load (kN)RatioWall Config.Applied Load (kN)Ratio
ActualDesignActualDesign
OSB.B11.1412.810.87CFB.B10.8017.900.60
OSB.W.N3.082.011.53CFB.W.N3.172.771.14
OSB.W.O5.253.251.61CFB.W.O4.374.490.97
CFB.W.U3.514.490.78
Disclaimer/Publisher’s Note: The statements, opinions and data contained in all publications are solely those of the individual author(s) and contributor(s) and not of MDPI and/or the editor(s). MDPI and/or the editor(s) disclaim responsibility for any injury to people or property resulting from any ideas, methods, instructions or products referred to in the content.

