Article

Research on the Visual Design Elements of the Living Street from the Perspective of Human Factors Engineering

School of Architecture and Urbanplanning, Shenyang Jianzhu University, Shenyang 110168, China
*
Author to whom correspondence should be addressed.
Buildings 2024, 14(10), 3098; https://doi.org/10.3390/buildings14103098
Submission received: 21 August 2024 / Revised: 15 September 2024 / Accepted: 25 September 2024 / Published: 27 September 2024

Abstract

:
Living streets are places of high activity frequency in people’s daily lives, so it is particularly important to design the street space based on people’s perceived comfort. There is a paucity of quantitative studies conducted on street interface elements, as evidenced by an examination of existing studies. Accordingly, this study used a human factor experiment to ascertain the quantitative value of interface elements that engender a sense of visual comfort. This study used a simulation experiment of a life street scene, integrating wearable physiological sensors and a subjective evaluation scale, to analyze the impact of varying scene element values on participants’ perception. The findings indicate that distinct values of street interface elements exert markedly disparate effects on people’s perception. The interface transparency that elicits a more favorable response is approximately 40%, the store density is approximately 15, and individuals demonstrate a discernible inclination towards the street scene with warm colors and rich textures.

1. Introduction

A living street can be defined as the most common public space in an urban setting, providing the basic setting for people to carry out their daily activities [1]. China has undergone a period of rapid urban expansion over the past few decades, yet the quality of construction has fallen short of meeting the spatial needs of its citizens [2]. Consequently, the creation of an aesthetically pleasing and comfortable street environment represents a pivotal objective within the domain of contemporary urban space design. The existing literature on the subject of bioactive streets is extensive, encompassing a multitude of studies that have elaborated on the various aspects of their perceived livability. However, there is a paucity of studies that have conducted a quantitative analysis of the specific street interface elements that contribute to this perception. In accordance with the tenets of people-oriented urban design, the emotional comfort experienced by individuals has increasingly been recognized as a key criterion for evaluating the quality of space. As research into human perception has progressed, a method of measuring emotion visually through physiological data has been developed. This paper combines the quantification of spatial elements and the measurement of emotional physiology to explore the appropriate range of street interface elements. This research provides direction for future design and optimization of living street space and offers a reference point for the development of future street design guidelines.

1.1. Urban Street Space Research

Jan Gehl affirms the significant role of human emotions in urban space design, and provides a summary of the spatial characteristics and related elements that a vibrant city should possess. These include an appropriate street scale, a convenient transportation system, visual interest points, and so forth [3]. Additionally, Kevin Lynch outlined five key elements that influence residents’ perception and understanding of urban space. These include the following: paths, edge, district, nodes, and landmarks [4]. With regard to the design and evaluation of urban street space, many researchers have undertaken studies with a variety of methods. The results of field research on urban streets indicate that residents tend to prefer areas that they perceive as vibrant, well-connected, tranquil, and clean [5]. Additionally, the ecological environment, spatial structure, spatial form, and regional scale have been shown to exert varying degrees of influence on the vitality of urban human settlements [6].This research provides guidance for optimizing the design of living street space. The results of field research on urban streets indicate that residents prefer vibrant, convenient, quiet, and clean street spaces [5]. Furthermore, the ecological environment, spatial structure, spatial form, and regional scale exert varying degrees of influence on the vitality of urban human settlements [6]. These findings provide valuable insights for optimizing the design of living street spaces. Some other scholars have used a scoring method involving experts and users to summarize the significant physical characteristics of urban design quality. In their study, Ewing and Handy identified five key spatial elements that shape the urban street environment, as determined by expert scoring: imageability, enclosure, human scale, transparency, and complexity [7]. Other researchers have employed the use of interviews with participants. It has been established that spatial scale, venue function type, and spatial resiliency will influence the evaluation of spatial vitality by participants [8,9]. From the perspective of walking and cycling, other studies have defined the street environment characteristics related to walking and cycling, including high density, high connectivity, and high functional mixing [10]. In light of the findings of studies into the urban street environment, a number of countries have subsequently issued street design guidelines with a view to providing guidance on the creation of a more livable street environment. Examples of such guidelines include Streetscape Guidance: A guide to better London streets and Global Street Design Guide.
The advancement of science and technology has facilitated the integration of diverse data sources, including urban heat maps, points of interest, street view maps, and social media, into the assessment of urban spatial quality on a macro scale. The research findings indicate that physical characteristics, including building density, retail store density, functional mixing, building facade, greening, and compactness, exert a significant influence on street vitality [1,2,11,12,13,14]. Additionally, researchers used novel methodologies, including eye tracking technology, physiological measurement technology, virtual reality, and scene modeling, to investigate the influence of alterations in building roof contours, building height, building surface ornamentation, and the color and texture of street walls on the ambience of the surrounding space [15,16,17,18,19]. Some researchers undertook an analysis and comparison of articles on the subject of “the impact of urban environments on physical activity”. They produced a summary of the research hotspots in articles from developed countries and China. Their findings revealed that, in both developed countries and China, the content of scholars’ research has shifted from macro-level materials to micro-level environmental elements. Furthermore, there has been a gradual shift in focus towards the evaluation of human-centric street space [20].
In general, regardless of whether traditional research methods or emerging technology methods are used, the future development of urban space construction will be oriented towards macro planning, with a shift towards small-scale dynamic space design. At present, numerous articles have addressed the impact of street characteristics on street spatial vitality. However, there is a paucity of quantitative studies examining the influence of street physical characteristics. Accordingly, this paper addresses the issue from the micro-level perspective of the street construction interface, conducting a quantitative investigation of select interface elements.

1.2. Application of Human Factor Engineering in Space Research

Human factor engineering is an interdisciplinary subject that draws upon the expertise of multiple fields, including psychology, physiology, anatomy, and anthropometry, among others [21]. By constructing a “human–machine–environment” model, the interrelationship between the three is investigated, and the mutual optimization of human, machine, and environment is sought to the greatest extent possible under the conditions of human safety and comfort. As the relationship between humans and their environment is subjected to increasing scrutiny, the application of human factors engineering is being incorporated into the field of architectural environmental space design [22]. In the field of environmental space, human factors engineering is concerned with the study of the impact of space on human physiology and psychology. The objective is to achieve mutual optimization between human feelings and the space environment. The fields of architecture and human factors engineering are highly compatible. Both disciplines conduct scientific research based on space, focusing on the interaction between humans and the space interface as the research content and the objective is to ensure the rational design and optimization of environmental space. A substantial corpus of research has been conducted in the field of architecture, encompassing both outdoor and indoor spaces, with a particular focus on human factors engineering. The current research in interior space human factors encompasses investigations into the impact of various design elements, including lighting, temperature, materials, and windows, on employee productivity and comfort [23,24]. Additionally, studies have used ergonomic, anthropometric, and dynamic approaches to enhance residential design [25]. With regard to the investigation of human factors engineering in the context of urban outdoor space design, a number of scholars have conducted experiments to ascertain the impact of urban park landscapes on human emotional states [26]. Similarly, other researchers have used a combination of human factors engineering and virtual reality technology with a view to simulating the influence of diverse street walls on pedestrian psychological pressure [19]. A substantial body of research has demonstrated that the integration of human factors engineering and architectural research has reached a relatively advanced stage of development. The application of human factors engineering in architectural design has addressed the limitations of subjective experience as the dominant factor and the lack of objective evaluation of users as the supporting element. This has provided a novel method for optimizing the space environment. From the perspective of human factors engineering, this study will investigate the range of street interface elements that can be used to create a comfortable environment. This will be achieved by recording participants’ emotional perception responses to different interface elements.

1.3. Measurement Methods of Emotion Perception

In the past, subjective evaluation methods, such as questionnaire surveys, semantic analysis, and expert scoring, were used to assess spatial experience. These methods were predominantly based on subjective experience and were susceptible to influence from cultural background, personal preference, and life experience, resulting in limited accuracy and comprehensiveness. The advent of technology has enabled the objective measurement of spatial perception through the utilization of human factors.
Currently, there are four principal methods for human factor analysis. The first method is sensory activity analysis, which includes eye movement data and pressure sensing data [27,28,29,30]. The second method is neural activity analysis, which includes skin data, EEG data, and ECG data [27,30,31,32,33]. The third method is body activity analysis, which includes facial expression data and body movement data [34,35,36]. The fourth method is the analysis of spatio-temporal activities, which includes spatio-temporal positioning data and social media data [13,37,38,39]. The initial three methods are primarily dependent on physiological sensing technology. Upon receipt of a stimulus, receptors convert the stimulus into a biological signal, which is then transmitted to the brain. Subsequently, the brain will form a cognitive representation of the stimulation that has been received and processed. Therefore, the objective is to record cognitive feelings. These methods facilitate the transformation of perceptions and emotions that cannot be directly measured into physiological signals that can be collected, thereby enabling the expression of people’s perceptual experiences quantitatively. This approach has also contributed to an improvement in the accuracy of spatial perception research. These methods need to record the physiological signals of the actual participants in the space in real time, thereby reflecting the emotional feelings of the participants in the current space environment. Accordingly, this method is more appropriate for the micro-study of urban space. The fourth method is based on big data analysis, which draws on a more extensive data set and a larger sample size, thereby facilitating a more comprehensive understanding of the feedback received. Given the extensive nature of the data, this method is better suited to macro-level research into urban space.
Compared with traditional subjective evaluation methods, the utilization of characteristics such as continuity, objectivity, and sensitivity derived from physiological signals offers certain benefits in terms of the precision, real-time measurement, and accuracy of human-scale spatial perception research. This approach represents a highly promising avenue for spatial perception measurement [40]. The principal objective of this paper is to quantify the constituent elements of urban streets, which is more closely aligned with a microscopic examination of urban space. This approach relies on the real-time evaluation of emotional perceptions by participants in relation to the aforementioned elements. Accordingly, this paper opts to use physiological sensing technology for the purpose of measuring the emotional changes experienced by participants.
This paper presents a quantitative study of the physical elements of the street interface, using physiological measurement techniques and subjective evaluation scales that can reflect participants’ emotional perception. The objective of this study is to propose a quantitative methodology for the design of street elements based on human emotional perception. This methodology combines a human factors experiment with physiological sensing technology in order to determine the range of values for street interface elements that will ensure a comfortable experience for the public.
The research objectives include:
  • Proposing a quantitative method for obtaining changes in emotional perception by measuring physiological signals;
  • Using this method to measure the perceived comfort range of the physical elements of the street interface.
This paper is structured as follows: Section 1 presents the background and objectives of this study, in addition to a review of the extant research on street space elements and the application of physiological sensing technology in space research. In Section 2, a series of interface elements were simulated in order to investigate the impact of varying interface element values on participants’ emotional perception. In Section 3, the data pertaining to physiological signals and subjective responses are subjected to statistical analysis. Section 4 presents the statistical results of the data. Section 5 presents the conclusions, limitations, and future directions of this study.

2. Materials and Methods

2.1. Investigation of Street Elements

The characteristics and styles of living streets constructed in different periods may exhibit notable differences. In order to gain a comprehensive understanding of the similarities and differences between living streets in different periods, this study selected a number of streets constructed in different periods in Tiexi District and Hunnan New District of Shenyang City, Liaoning Province, China, as research objects. The construction and development of the Hunnan New District is relatively recent, and the design of the street interface is more innovative, with a greater variety of functions for the shops on the street. Tiexi District is an ancient city that developed at an earlier stage in Shenyang. It boasts a vibrant atmosphere, yet its life street design is not as sophisticated as that of the new district, and its functions and facilities are not yet fully developed. In order to ascertain the street interface elements that affect people’s visual perception, this paper analyzes a number of streets. The living street interface elements that affect people’s visual perception are identified through observation and recording of the surrounding environment, interface characteristics, and user activity types. Through field research and related literature research, it can be seen that street interface elements affect people’s perception and experience from three principal aspects: spatial atmosphere, artistic feeling, and functional richness. This paper presents a summary of seven street-side interface elements that affect visual perception. These are line rate, continuity, transparency, color, material, signboards and signs, and store density.
The atmosphere of the space is shaped by the spatial form of the street, the degree of enclosure and the level of sight penetration. These three factors can be gauged by measuring the line rate, continuity, and transparency, respectively. The line rate is used to quantify the change in slope of the street interface in the horizontal dimension [41]. This concept was originally proposed by American architect William Atkinson in his theory of the “street wall”, which is regarded as a fundamental element of urban livability [42]. The term “architectural continuity” is defined as the ratio of the length of the street wall formed by the building facade on the street to the overall length of the street. And when the ratio is higher, the street interface is neater [43]. The term “interface transparency” is used to reflect the level of line of sight penetration of the street [7]. Thus, the greater the transparency, the more open the interface; conversely, the lower the transparency, the more closed the interface.
In addition to fulfilling the basic function of the street, the incorporation of artistic elements into the urban environment can facilitate the generation of positive sensory experiences, thereby encouraging people to linger and interact with the space. The primary street elements that elicit an artistic ambience are green visibility, color, material, signage, and street signs. The term “green vision rate” is used to describe the proportion of green plants that are visible to people within their visual field. It has been demonstrated that an elevated green vision rate can enhance residents’ satisfaction with the surrounding environment and promote their physical wellbeing [44,45]. The color and material of the street are the primary factors that stimulate visual perception in the street environment and influence the overall style of the street. The utilization of appropriate color and material can assist in the recuperation of psychological pressure [19]. Signs and signboards are also a significant factor influencing the aesthetic quality of the street, as they can convey the character of the establishments located there. Well-designed signage can enhance the overall perception of the street.
The concept of functional richness can be defined as the perfection of street service functions and facilities. Furthermore, store density is identified as a significant factor influencing the functional richness of streets [46].
In order to investigate the influence of these variables on visual perception, a survey questionnaire was constructed for the purpose of conducting research. A total of 342 street interface photographs, exhibiting a range of characteristics, were captured during the investigation. The panoramic images of typical street interfaces were created using Adobe Photoshop 2020 image processing software. Following the presentation of the panoramic images, participants were invited to indicate the extent to which they perceived the images to influence various interface elements, according to their own subjective experiences. Although there are certain differences between viewing panoramic pictures and walking in a real scene, this method allows for the exclusion of factors that cannot be manually intervened with, such as the flow of people in the street, the flow of vehicles, and the health situation. In order to measure the impact of each element on people’s feelings, this paper first uses a survey questionnaire to study seven visual elements of line rate, continuity, transparency, color, material, signboards and signs, and store density. The Likert scale is a commonly used questionnaire tool, and a large number of scholars have applied this method to measure perception. For example, the Likert scale was used to conduct a cross-cultural analysis of color preference in a bedroom of Le Corbusier’s Swiss student hall [47]. This method was also used to investigate the differences in landscape perception among the three target groups of rural farmers, landscape experts, and rural residents in Belgium [48]. Therefore, this paper also adopts the five-level Likert scale to analyze the degree to which seven factors affect visual perception. The degree of influence is classified into five categories: The participants were asked to indicate the extent to which each visual element influenced them on a five-point Likert scale, with the following categories: “very influential”, “relatively influential”, “general”, “relatively not influential” and “very not influential”. In the process of data analysis, the five levels of influence were assigned a value of 5 points to 1 point, respectively, from “very influential” to “very not influential”.
A total of 134 questionnaires were distributed and 134 were retrieved. Of these, 130 were deemed valid and 4 were invalid. Following analysis using SPSS Statistics 20.0 software, the results of the questionnaire were found to meet the requisite data reliability standards and to pass the structural validity test. The analysis of the questionnaire results revealed that the top five factors influencing visual perception are signboards and logos, color, interface transparency, store density, and interface material. Signboards and logos exert the greatest influence on visual perception; however, they typically require bespoke design according to the specific function and characteristics of the store, which presents a challenge for quantitative research. Accordingly, this paper primarily uses a quantitative approach to investigate four primary influencing factors: interface transparency, store density, interface color, and interface material.

2.2. Research Framework

In order to ascertain the magnitude range of four visual elements that engender a sense of comfort, namely transparency, store density, color, and material, this study adopts the method of building an experimental street scene model to adjust the different quantitative values of a single element while ensuring the consistency of other elements. At the same time, the physiological signals of the subjects during the experiment were recorded by the wearable physiological sensor, and then coupled with the subjective questionnaire results for translation analysis. Following the presentation of visual stimuli comprising interface elements with varying values, individuals will experience corresponding perceptual alterations. The measurement of physiological signals represents an objective indicator of these perceptual changes [49]. Many scholars have conducted relevant studies on the use of physiological signals to reflect people’s perceptual changes. Among them, heart rate variability (HRV) is often used to evaluate participants’ emotional changes and perceptual conditions [50,51,52,53,54], and electrodermal response is also a physiological signal greatly affected by emotional changes [55,56,57]. Therefore, in this study, two kinds of data, photoplethysmography (PPG) and electrodermal activity (EDA), were collected and translated into heart rate variability (HRV) and skin conductance (SC) to analyze the perceived comfort of subjects. With regard to the interface elements that are challenging to quantify, this paper also examines and discusses them through semantic analysis, integrates the measurement outcomes of diverse elements, and outlines the characteristics of the visual elements of living streets that engender a sense of comfort, thereby furnishing a basis for the design and assessment of street space (Figure 1).

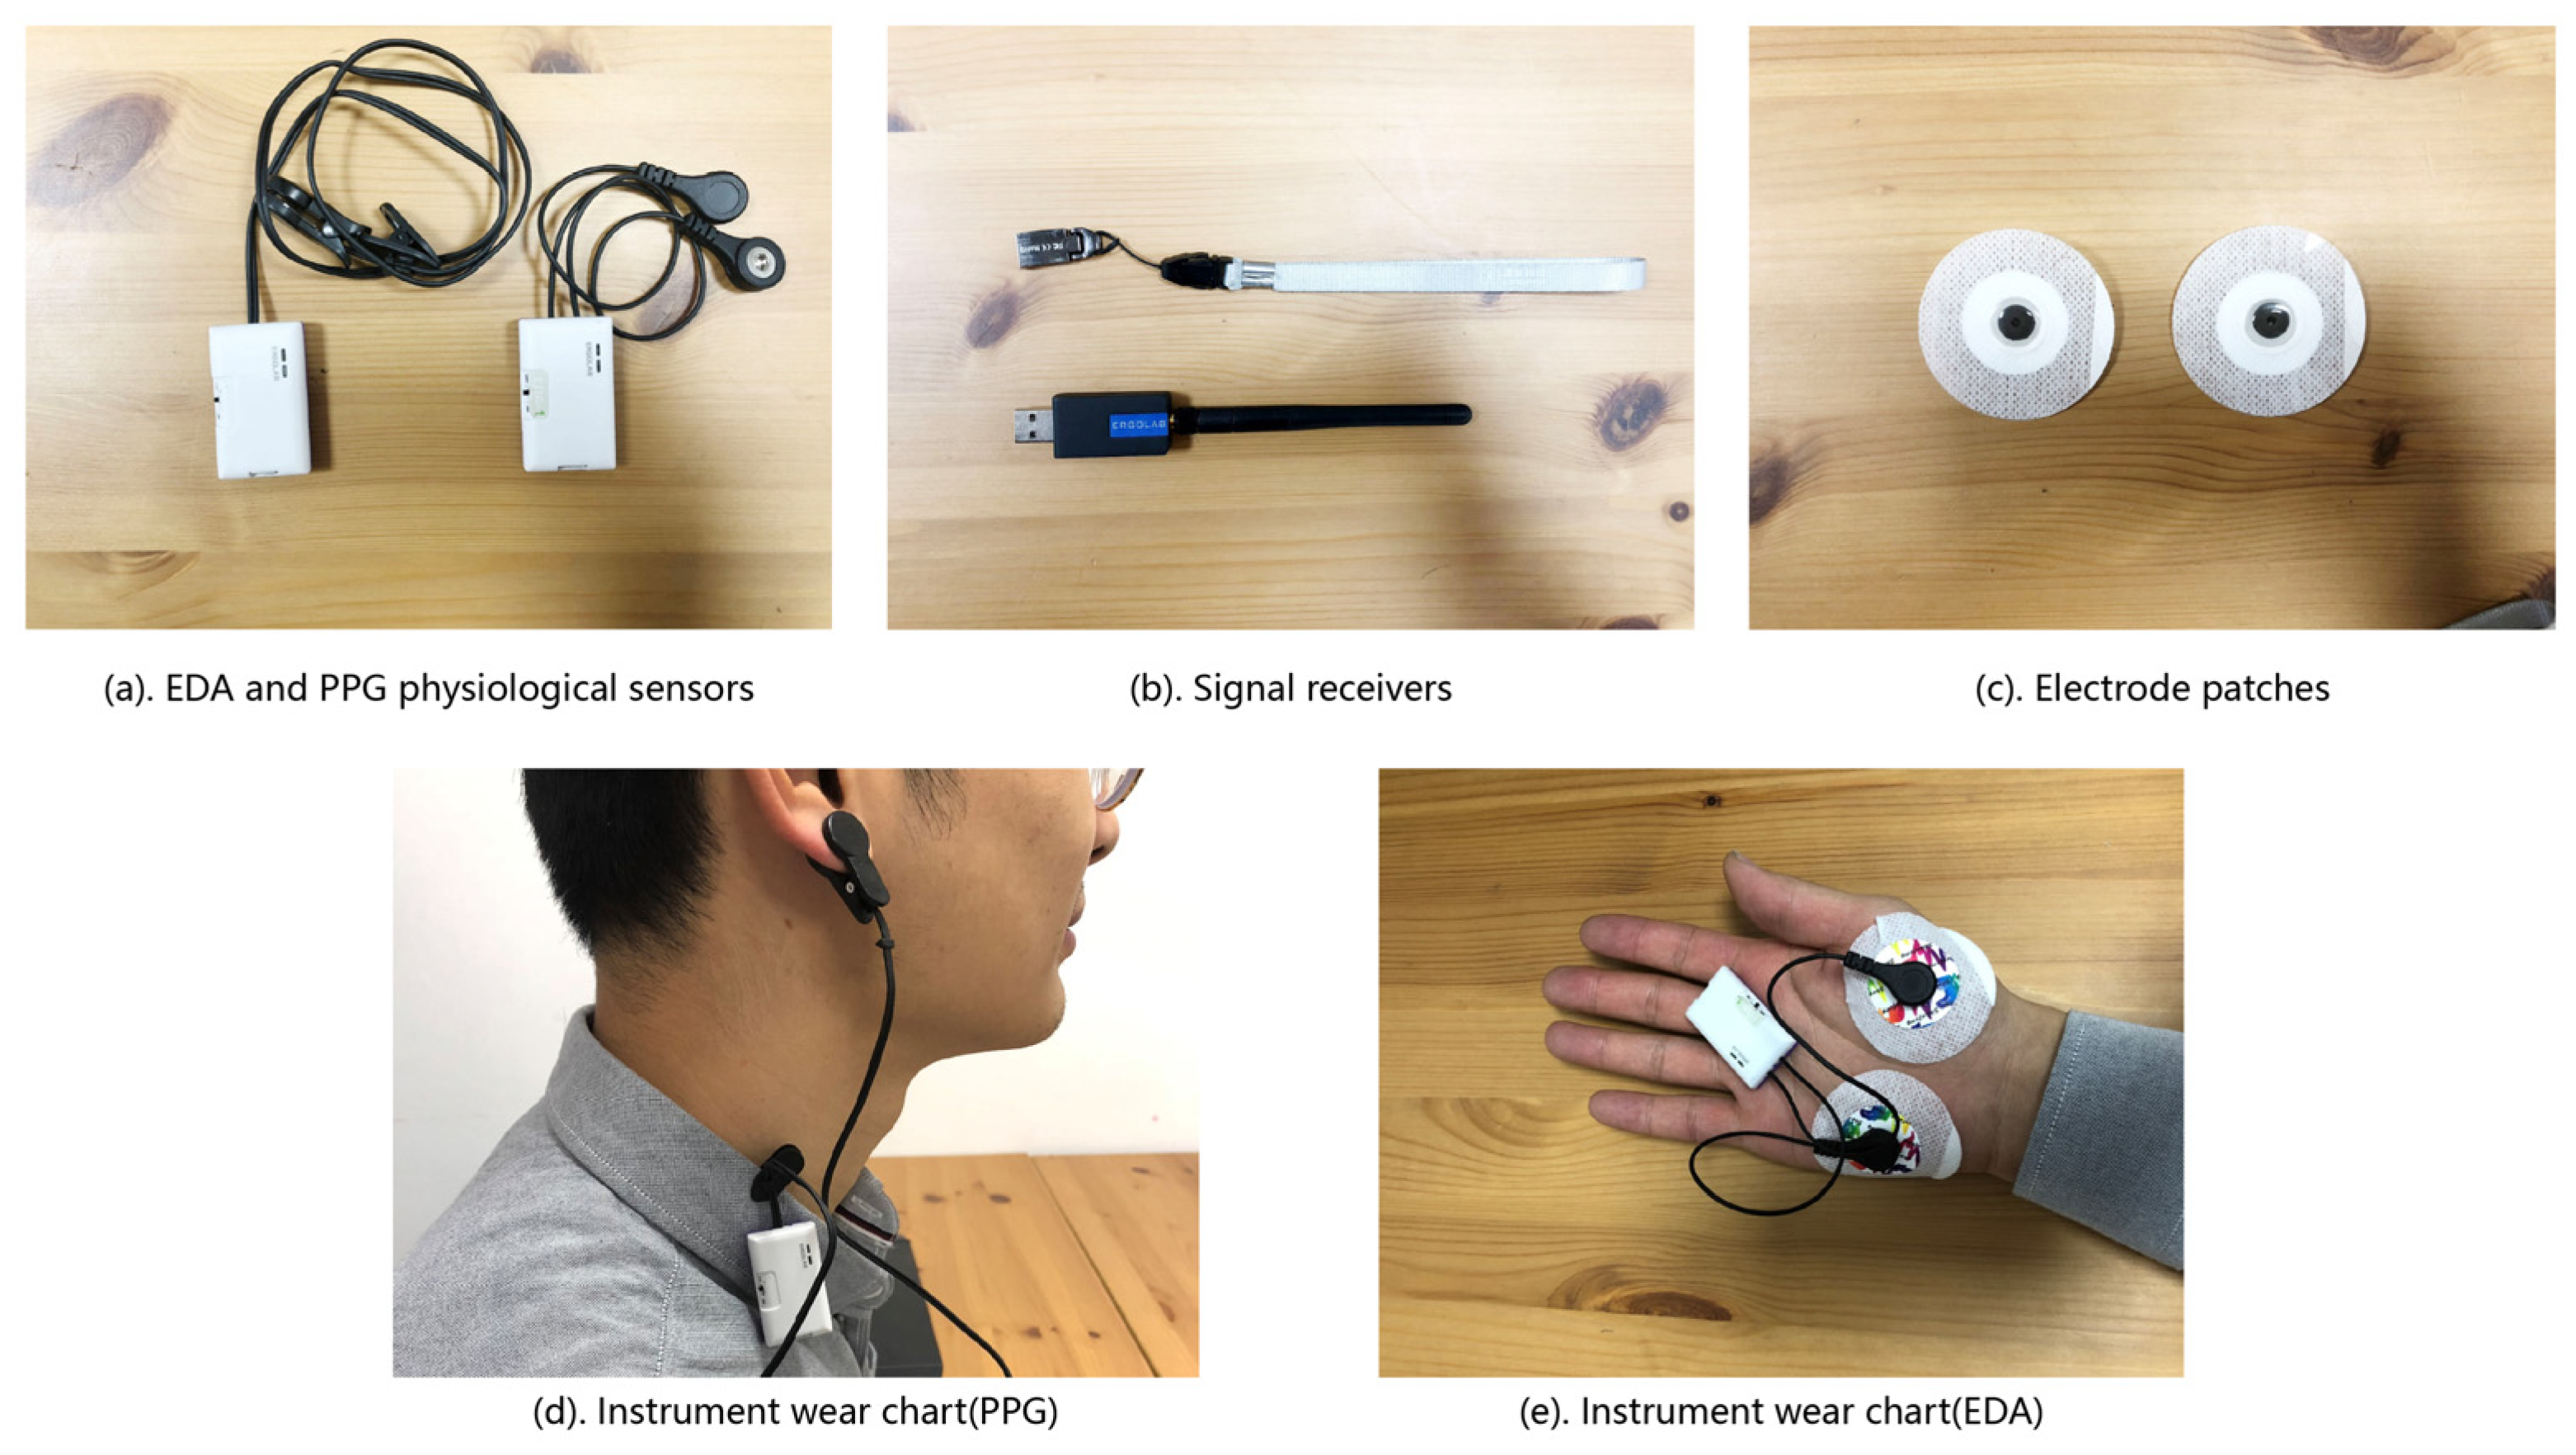
2.3. Experimental Instruments and Participants

The experiment requires two laptops, physiological sensors, signal receivers, electrode patches, alcohol pads, and so forth (Figure 2). One laptop is used to play interface simulation videos, and the other is used to record physiological data. Physiological sensors include a photoplethysmography (PPG) and electrodermal activity (EDA) acquisition module, from which signals are transmitted to the ErgoLab 3.0 software platform for data recording through a signal receiver.
The present study recruited a total of 30 participants (15 males and 15 females) from diverse academic backgrounds at Shenyang Jianzhu University to participate in a quantitative assessment of the factors influencing the perception of street interfaces. The participants were between the ages of 24 and 30 years, in good health, and had normal vision and hearing. The experimental protocol of this study was conducted in accordance with the ethical standards of the National Research Council and the Helsinki Declaration.

2.4. Quantitative Experiment of Interface Transparency

The proportion of the horizontal length of the building interface with line of sight penetration to the total length of the street interface is defined as the interface transparency. In accordance with the varying degrees of line of sight penetration, the street interface can be classified into four distinct transparency categories (Table 1); the four types are assigned different weights in the calculation of street interface transparency [46]. To a certain extent, an interface with high transparency will be more attractive to people, increasing the time spent in the vicinity by pedestrians and improving the flow of people on the street, thus enhancing the overall vitality of the street.
The following formula is used to calculate the transparency of interfaces:
N = L 1 × 1.25 + L 2 × 1 + L 3 × 0.75 + L 4 × 0 L × 100 %
(L = total length of street interface; Ln = length of various interfaces).

2.4.1. Interface Transparency Scenario Simulation

A summary of the characteristics of the streets in the previous field investigation revealed that the interface transparency of existing living streets is distributed across a range of approximately 20% to 70%. Four distinct types of interface were identified in the streets, with type 1 and type 2 representing the most prevalent. In accordance with the findings of the preceding design experience and research, the minimum value of interface transparency in this experiment was set at 20%, and the transparency of the remaining control groups was increased in a stepwise manner on this basis. In order to ensure the uniformity of transparency changes and the visibility of the human eyes when changes are made, the change gradient of the control group was set at 20%. The values were set at N1 = 20%, N2 = 40%, N3 = 60%, and N4 = 80%. To ensure that the sole variable under examination was interface transparency, and to circumvent any potential interference from environmental noise, traffic flow, and architectural forms, this experiment constructed a street interface model to simulate the street interface with different transparency levels. The model was constructed with a common living street, comprising two lanes in the middle and non-motorized lanes and sidewalks on either side, serving as the basic experimental scene (Figure 3). The style of the building interface along the street was characterized by a simple modern aesthetic, with grey granite as the primary material. The color scheme was restrained, and the signage and decorations of the stores were simplified and consistent wherever possible. The store names were also kept to a minimum to avoid distracting the subjects (Figure 4). In this experiment, the total length of the interface was approximately 160 meters, an intersection was established at 80 meters to disconnect, and the remainder of the interface was continuous. Furthermore, the interface of the building along the street was guaranteed to be in the same horizontal plane. The density of storefronts along the street remained consistent across the four transparency scenarios, with a value of 15/100 m (Table 2). A fixed-motion route was established within the model to simulate the initial perspective of pedestrians traversing the street, and a video was subsequently created. The subjects were presented with video footage of street scenes with varying degrees of transparency in the interface and subsequently completed the experiment.

2.4.2. Experimental Process

During the experiment, the potential influence of extraneous environmental factors on the subjects was minimized as much as possible. The white background wall was utilized as the backdrop for the experimental video, and any other objects within the subjects’ line of sight were removed. Furthermore, it was imperative that the subjects maintained their focus throughout the experiment, and that the process ensured minimal disruption to the experimental environment and eliminated any potential psychological impact of sound or other external factors on the subjects.
The experiment was conducted in two phases. In the first phase, the subjects were instructed to view four video clips of the experiment and their electrodermal activity (EDA) and photoplethysmographic pulse data (PPG) were recorded. In the second phase, the data collection was completed and the subjects were provided with a subjective questionnaire to complete (Figure 5). The experimental flow may be summarized as follows:
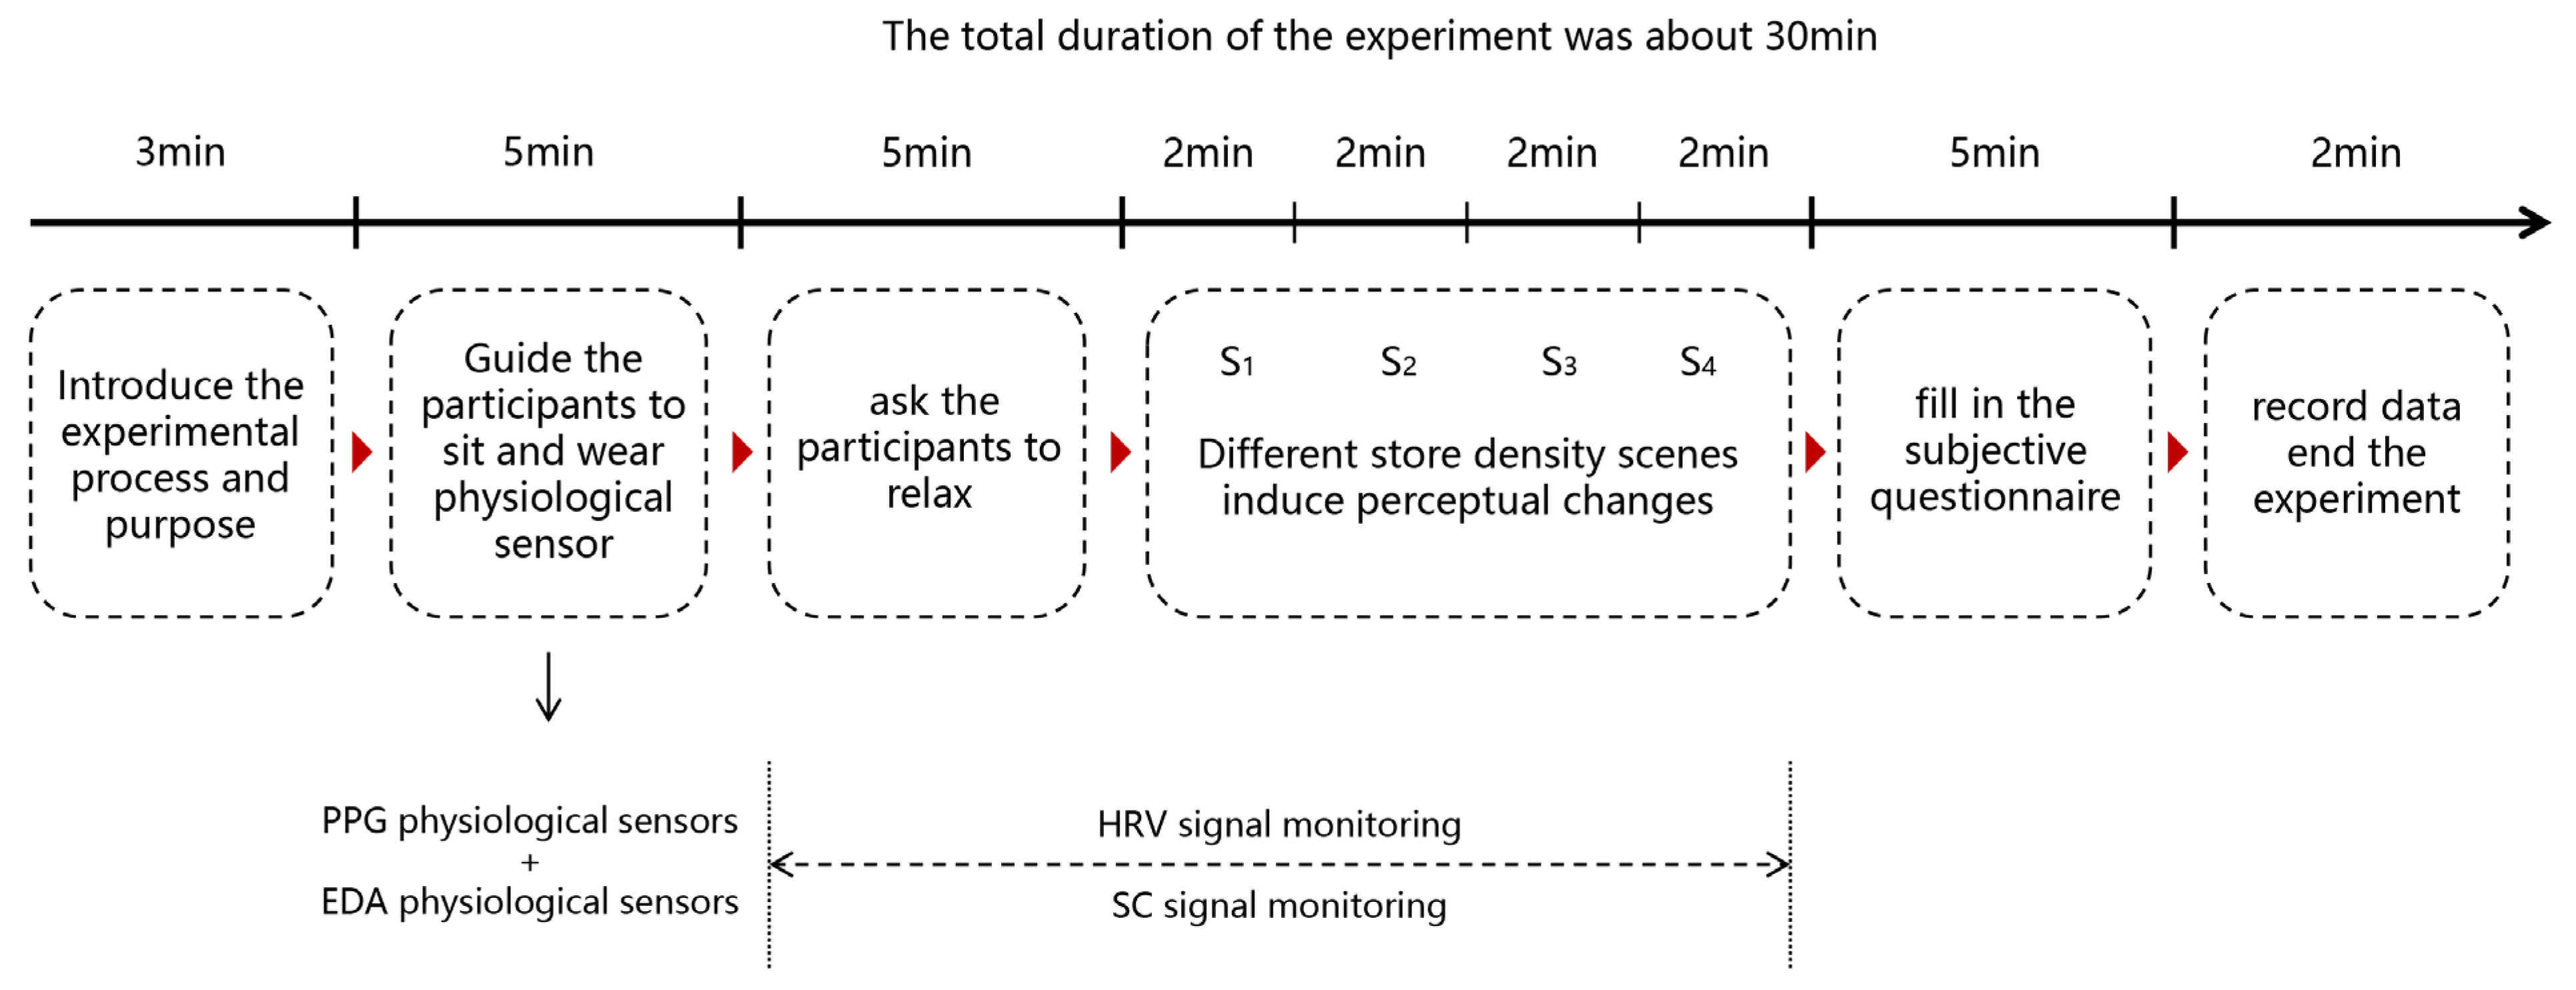
  • Introduce the experimental process and purpose for the participants, so that the participants can enter a relaxed state;
  • Guide the participants to sit in front of the computer in a comfortable sitting position and prepare to watch four videos of experimental materials;
  • Clean the palms and earlobes of the participants with alcohol cotton pads, put the wearable physiological sensors on the palms and earlobes of the participants, ask the participants to maintain a comfortable sitting position and relax for 5 min, and record the baseline data;
  • After baseline collection, ask the participants to watch four experimental videos of N1–N4 with different interface transparency, each of which lasts about two minutes, and continuously record the physiological data signals of the participants;
  • After all four experimental videos have been played, instruct the participants to fill in the subjective questionnaire of perceived comfort under different transparency street interfaces;
  • Complete the data recording and saving, and end the experiment.
Figure 5. Schematic diagram of interface transparency experiment flow.
Buildings 14 03098 g005

2.5. Quantization Experiment of Store Density

Store density can be quantified by the number of store entrances and exits per 100 m in the street [46], which can serve as a proxy for the compact degree of stores on the street. An excessively high density will inevitably result in a chaotic and unclean street interface, while a deficiency in density will lead to a desolate and insecure atmosphere, ultimately impeding the vitality of the street.

2.5.1. Store Density Scenario Simulation

The density of stores is inextricably linked to the continuity of the street interface, the number of stores, and the size of the store space. A preliminary investigation revealed that the density of existing stores on living streets is predominantly distributed between 5 and 20. In accordance with the findings of the survey, the lowest value of store density has been established at 5 in this simulation, with the perceptibility of the interface changes also taken into account. Following an analysis, the value of 5 was selected as the change gradient, with the store density in the experiment set as S1 = 5, S2 = 10, S3 = 15, and S4 = 20, to explore the perceived comfort of people with these four different store densities.
Similarly, the methodology used in the store density experiment is based on the construction of a street interface model, as was the case in the aforementioned interface transparency experiment. The fundamental aspects of the scenario, such as the street width and architectural style, are consistent with those of the interface transparency experiment. Four street interface models with store densities of 5, 10, 15, and 20 were constructed on the basis of an interface transparency of 80% (Table 3). The methodology used in the initial video observation was retained, and participants were requested to complete the subsequent experiment after viewing the video and experiencing the street scenes with varying store densities.

2.5.2. Experimental Process

The fundamental methodology used in the store-density perception measurement experiment was analogous to that utilized in the interface transparency experiment. This entailed the observation of videos depicting varying degrees of store density for a period of approximately two minutes, followed by the documentation of physiological data and the administration of a subjective questionnaire pertaining to perceived comfort (Figure 6).

2.6. Quantitative Research on Interface Color and Material

In the construction of living street space, the color and decorative material of the interface are significant factors influencing people’s visual perception [19]. Following preliminary field research, the colors and materials that were observed to occur with the greatest frequency in the street interface were extracted. The extracted representative colors were then matched with color samples from the Chinese Architectural Color Card. The most prevalent street interface colors and materials are illustrated in Figure 7. The 20 selected representative colors have been divided according to tone. The proportion of warm tones is significant, followed by neutral tones, with cold tones being the least common. The interface materials are diverse and include paint, stone, wood veneer, and metal plate, among others. In the context of street interface design, there is a notable interplay between the selected materials and colors. The style and characteristics of two different materials with the same color are not identical, and the inherent characteristics of the materials in question impose certain limitations on the color tendencies that can be exhibited.

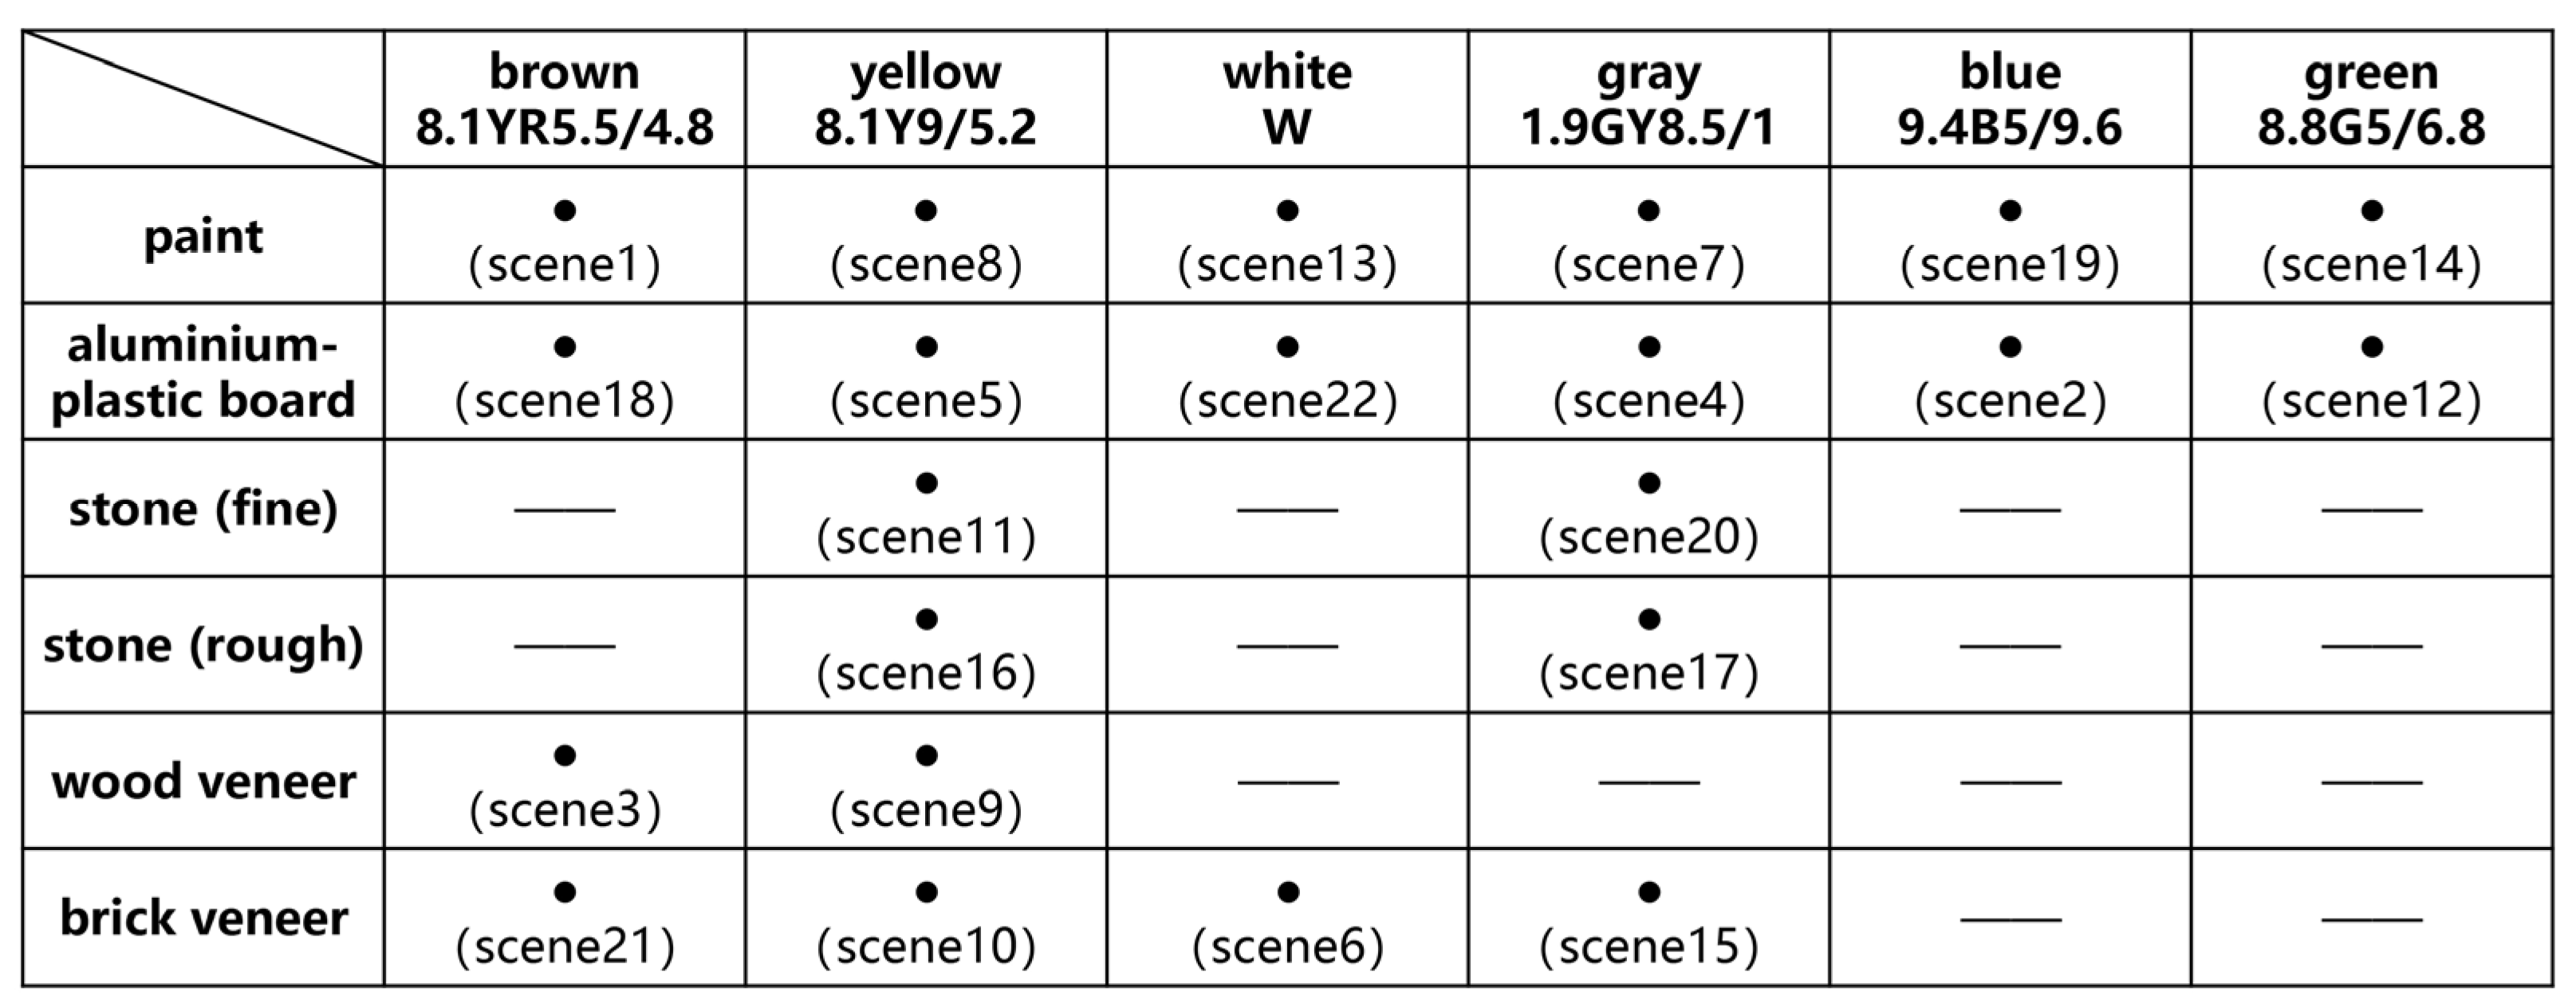
2.6.1. Interface Color and Material Simulation

This experiment on the perception measurement of interface color and material is based on the mutual influence of color and material. It uses a cross-combination of color and material to build a variety of street interface models. In accordance with the findings of the preceding research, this experiment selected two colors per tone from the three shades of warm tones, cool tones and neutral tones, resulting in a total of six typical colors. Additionally, six common interface materials were selected, namely paint, aluminum-plastic board, brick veneer, wood veneer, and two kinds of stone, which were recorded as stone (rough) and stone (fine) according to their respective degrees of smoothness. Following the cross-combination of the six colors and six materials, some unsuitable scenes were eliminated based on the colors presented by the materials. This process yielded 22 street interface colors and material scenes. To prevent the repetition of identical color combinations, the 22 scenes were randomly assigned numerical identifiers following the disruption process. The characteristics and numbers of the experimental scenes are presented in Figure 8.

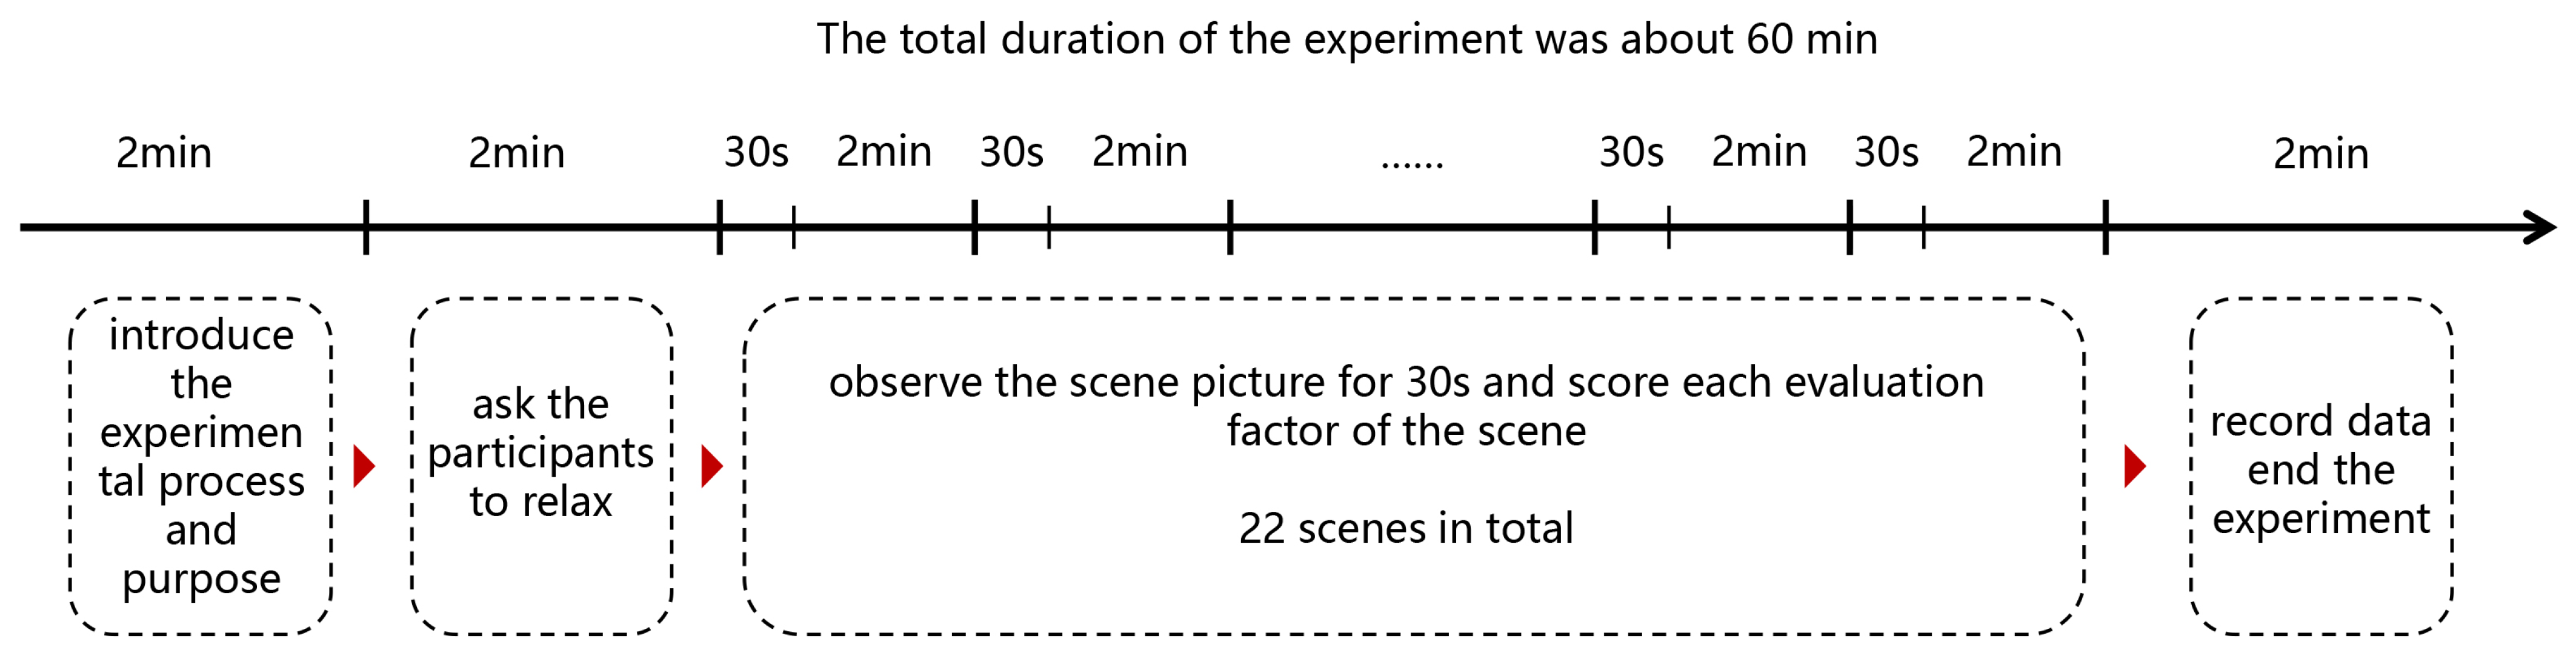
2.6.2. Experimental Process

The concepts of interface transparency and store density are relative to the entire street and require a comprehensive understanding of the street as a whole in order to facilitate image feedback in the brain. Conversely, the brain will integrate the color information from the local scene to form a comprehensive understanding of the entire scene, combined with the constancy of color. Furthermore, the extensive number of color and material simulation scenes will necessitate a considerable time investment to observe the dynamic simulation video of each scene individually. This may potentially lead to subject fatigue during the experiment, which could result in an increased error rate in the collected physiological data. This ultimately contradicts the original objective of reducing the bias associated with subjective evaluation. In light of the aforementioned considerations, the interface color and material experiment used a static virtual scene simulation approach, integrating a semantic analysis methodology to evaluate images of varying scenes and investigate the impact of distinct colors and materials on visual perception comfort.
This questionnaire comprised six groups of evaluation factors around color, material characteristics, and perceived comfort degree. Of these, five pertain to color and material, while the remaining group concerns overall perceived comfort. The former can be further subdivided into the following pairs: approachability–exclusion, cold–warmth, depression–ease, smooth–rough, concise–complex, and uncomfortable–comfortable. The neutral factors corresponding to the six adjective pairs are intimacy, color, pleasure, roughness, pattern, and perceived comfort. The three pairs of evaluation factors of “friendliness–exclusion”, “cold–warmth”, and “depression–ease” correspond to the color evaluation. The two pairs of evaluation factors of “smoothness–roughness” and “simplicity–complexity” correspond to the material evaluation. The pair of evaluation factors of “uncomfortable–comfort” correspond to the overall visual perception of comfort of the interface. The questionnaire used a five-point Likert scale, with the anchors “very poor”, “relatively poor”, “average”, “relatively good”, and “very good”, corresponding to the values of 1, 2, 3, 4, and 5 points, respectively.
Prior to the commencement of the experiment, the experimental procedure and rating criteria were fully elucidated to the participants. During the experiment, the environment was maintained in a quiet and interference-free state. Participants were instructed to observe each scene for 30 s and then score the evaluation factors for 2 min immediately after each observation. This procedure was used to ensure the timeliness and accuracy of the participants’ perceptions (Figure 9).

3. Results

3.1. Interface Transparency Data Analysis

3.1.1. Heart Rate Variability (HRV)

Following the translation of PPG signals, HRV data can be obtained, comprising a high-frequency component (HF), a low-frequency component (LF) and a balance ratio (LF/HF) of HRV (Figure 10). The HF reflects the activity of the parasympathetic nerves, while the LF reflects the activity of the sympathetic nerves. The LF/HF can be used to reflect the antagonism of sympathetic and parasympathetic nerves, which should be in a weak state when an individual is in a comfortable state; it is therefore recommended that attention be paid to the interface value when LF/HF is low when judging perceived comfort [58,59]. It should be noted that due to the individual differences of subjects, the cardinality values and variation values of different subjects were very different; therefore, it was necessary to normalize the data and scale all the data to 0–1.
Based on the LF/HF values of 30 participants, the interface density was 60%, followed by 20%. The antagonistic effect was low when the interface transparency was 40% and 80%. The value was lowest when the transparency was 40%, indicating that the participants felt more comfortable under the condition of 40% interface transparency (Figure 12a).

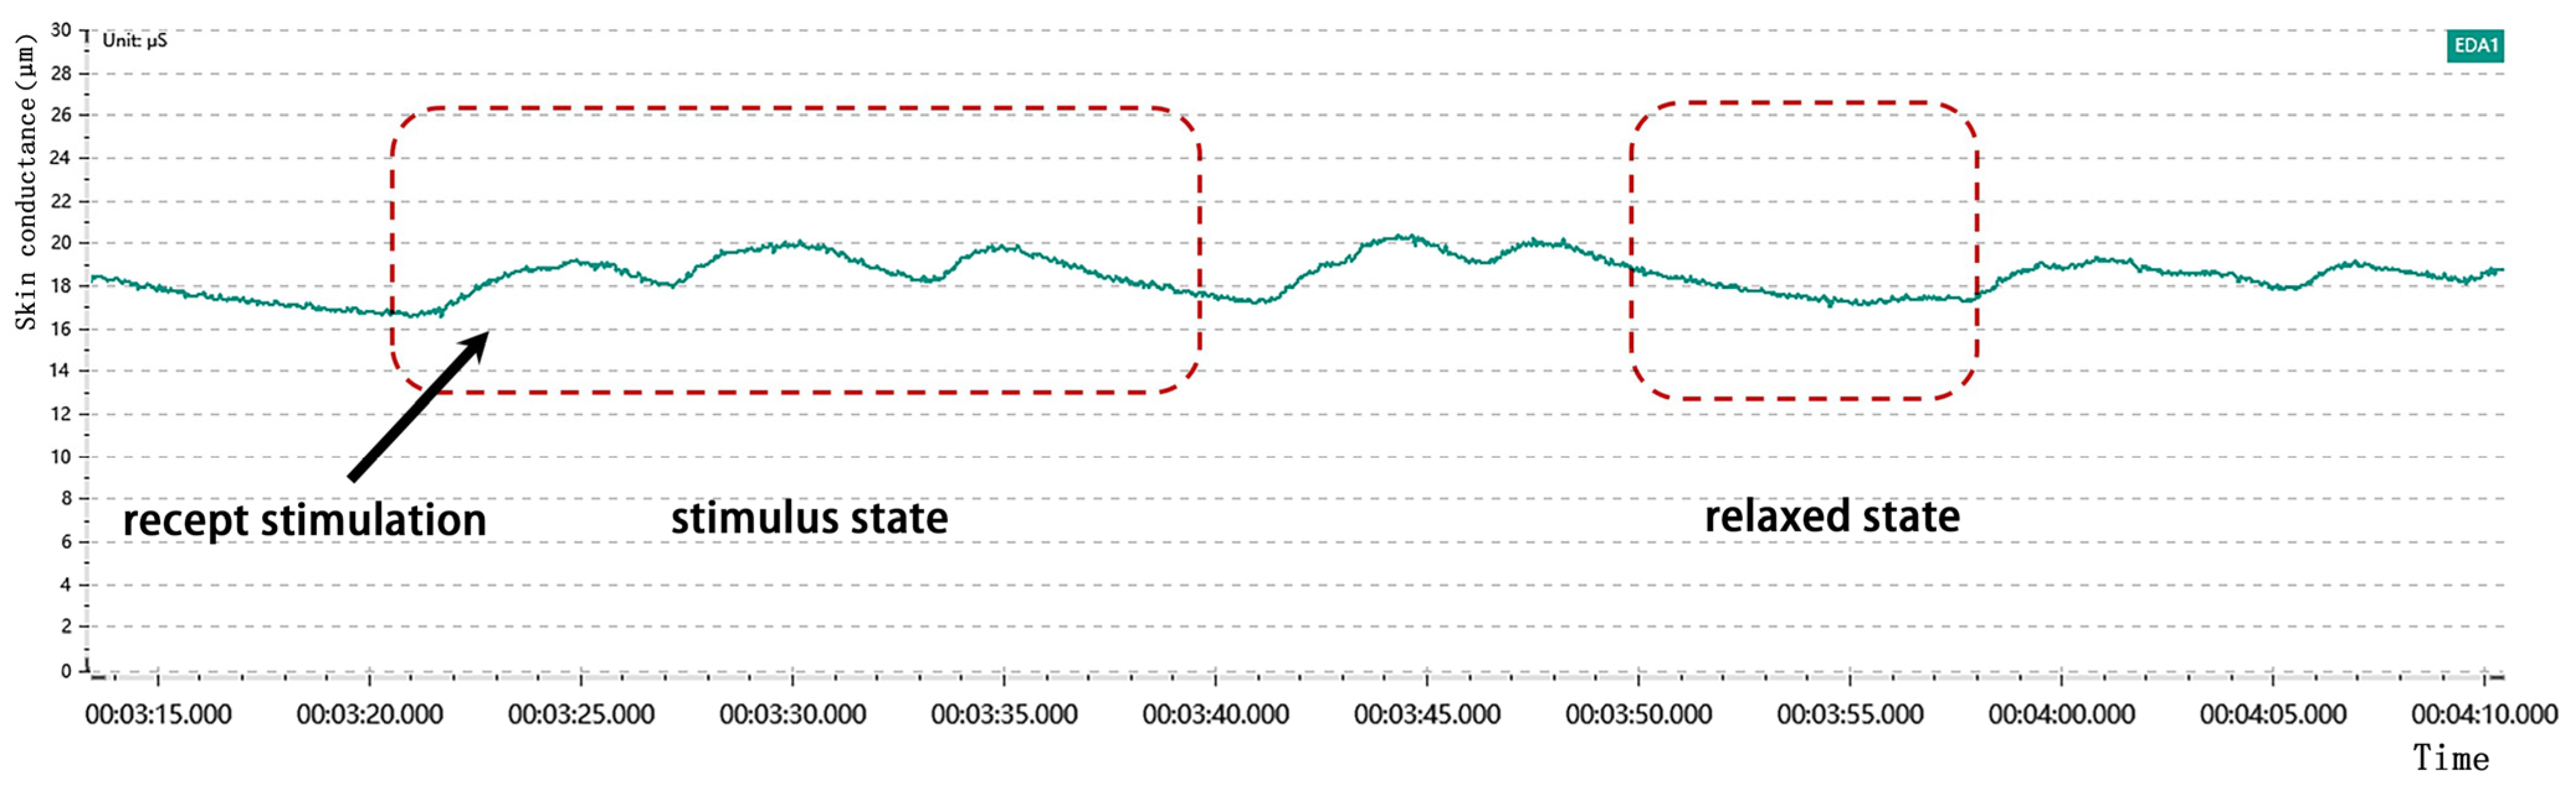
3.1.2. Skin Conductance (SC)

Following the time-domain analysis of the skin electrical signal fragments, three data sets were obtained: the maximum value, minimum value, and average value of the skin conductance (Figure 11). These were recorded as SCmax, SCmin, and SCmean, respectively. The change in SCmean value was primarily subjected to analysis, and all data were also normalized.
The ranking of the SC data under the four types of transparency reveals that the most significant alterations in the skin data occur at a transparency level of 40%, with the least pronounced changes observed at a transparency level of 80%. This suggests that perceived comfort is enhanced at a transparency level of 40%, while it is diminished at a transparency level of 80% (Figure 12b).

3.1.3. Subjective Evaluation

The subjective questionnaire was divided into four levels, with level 1 representing the most comfortable and level 4 representing the least comfortable. The four levels were graded according to the degree of comfort, with level 1 representing the highest level of comfort and level 4 representing the lowest level of comfort: 1 point for level 4, 2 points for level 3, 3 points for level 2, 4 points for level 1. The data statistics of all questionnaire results indicate that the score order of the four types of interface transparency, from high to low, is N2 > N3 > N4 > N1 (Figure 12c). This suggests that the perception of interface transparency is most comfortable at 40% transparency. The subjective evaluation results are largely consistent with the findings of the EDA and HRV data. It can thus be posited that in the four transparent street scenes, the street interface with 40% transparency is the most comfortable for the public.
Figure 12. (a) Column chart of HRV change rate of interface transparency; (b) column chart of SC change rate of interface transparency; (c) column chart of subjective evaluation score of interface transparency.
Buildings 14 03098 g012

3.2. Store Density Data Analysis

3.2.1. Heart Rate Variability (HRV)

The heart rate variability data of the 30 participants indicated that when the store density was 15, the change rate of LF/HF was the lowest and the perceived comfort was higher. Conversely, when the store density was 20 and 10, the change rate of LF/HF was significantly increased (Figure 13a), indicating that the antagonism was obvious at this time and that the visual perception of the subjects was uncomfortable under these two store densities.

3.2.2. Skin Conductance (SC)

As illustrated in the SC histogram of the participants, the lowest change rate is observed when the positive store density is 5, while the highest change rate is evident when the store density is 20 and 15 (Figure 13b). This suggests that the perceived comfort of these two street interfaces undergoes the most significant alteration. Combined with the HRV data, the notable alteration observed at a store density of 20 can be attributed to a change in perceived discomfort. This hypothesis requires verification through a subjective evaluation.

3.2.3. Subjective Evaluation

The results of the subjective questionnaire regarding store density were also scored on a 1–4 scale. The results of the subjective evaluation indicated that the four street interfaces were scored in the order of store density S3 > S1 > S2 > S4 (Figure 13c). This suggests that when the store density was 15, the perceived comfort was the highest, and when the store density was 20, the perceived comfort was the lowest. This finding is consistent with the experimental results of SC and HRV.

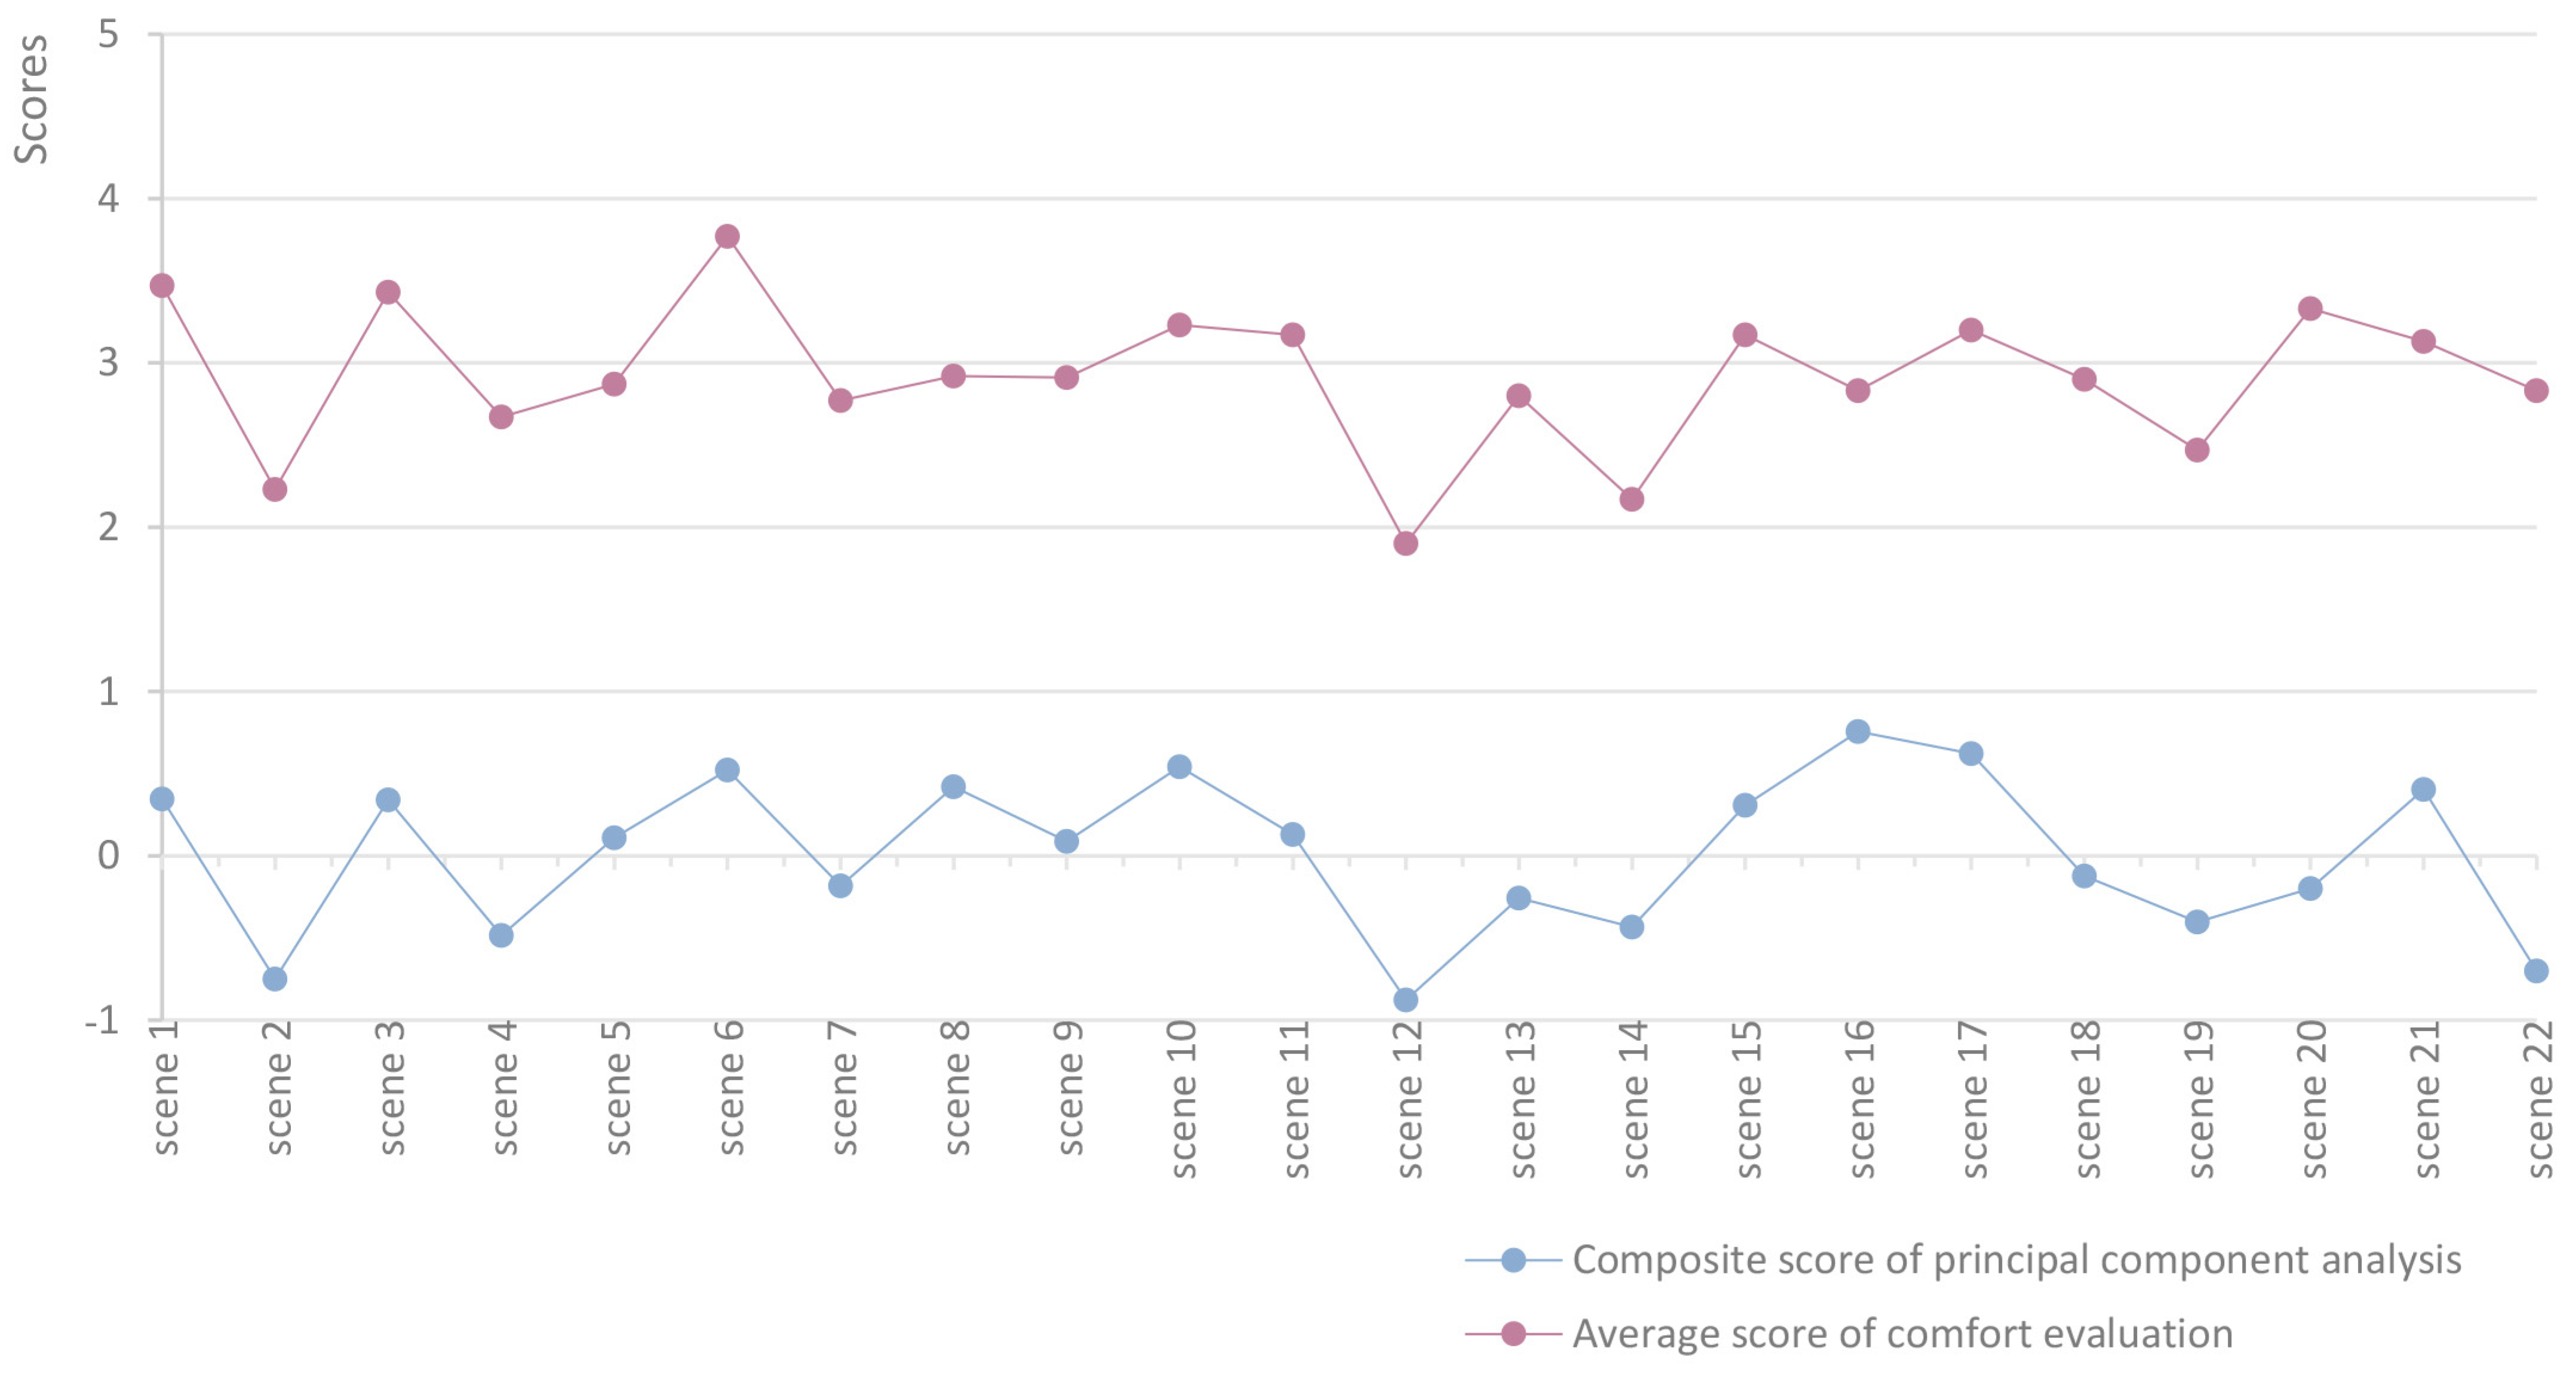
3.3. Color and Material Data Analysis

The data were analyzed using SPSS software, and the resulting Cronbach α coefficient was 0.728, while the KMO test coefficient was 0.752. The questionnaire data were found to be reliable and valid, and the normal Q-Q chart of each evaluation factor demonstrated that all scattered points were distributed evenly around the 45-degree oblique line, indicating that the data were normally distributed. Subsequently, an analysis was conducted.
The mean scores for the six evaluation factors were calculated for male and female participants under 22 scenarios. The variation trend of the scores of male and female participants on the six factors under different scenarios was similar, indicating that there was no bias in the evaluation of perceived comfort of color and material by different genders. Accordingly, the comprehensive data from 30 participants were utilized for an overall analysis.
In the process of validating the evaluation criteria, the principal component analysis method was used to reduce the five factors pertaining to color and material into two dimensions. Component 1 comprised three factors: intimacy, pleasure, and tone; and component 2 comprised two factors: roughness and pattern. The comprehensive score for the scene was calculated according to the contribution rates of these two components. The comprehensive score was calculated as follows: 43.448/73.414 × Component 1 score + 29.966/73.414 × Component 2 score. Meanwhile, the comfort degree of 22 scenarios was sorted according to the average score of the sixth comfort factor, as illustrated in Figure 14. The two calculation methods yielded comparable results in terms of the change trend of the perceived comfort score of each scenario. The scenarios with the highest scores under the two calculation methods are primarily concentrated in scenarios 1, 3, 6, 10, and 17. In contrast, the scenarios with the lowest scores are 2, 4, 12, 14, and 19.
The colors of the scenes with the highest scores are predominantly yellow and brown, which are associated with the warm tone range, whereas the colors of the scenes with the lowest scores are primarily blue and green, which are linked to the cool tone range. The distribution of neutral colors is not contingent on the perceived comfort of a given scene. In terms of material, the high-score scene is characterized by the prevalence of brick veneer and stone, with a greater proportion of stone (rough) than stone (fine). In contrast, the low-score scene is predominantly composed of paint and aluminum-plastic board. The existing results indicate that people perceive the street interface with warm colors and rich textures as more comfortable.

4. Discussion

The above physiological signal data, comprising EDA and PPG, in conjunction with a subjective perception scale, reflect the emotional perception characteristics of street interface elements with varying values to a certain extent. On the one hand, the findings of this research are beneficial for quantitative studies on street interface elements. On the other hand, they can inform the design of urban streetscapes, with the aim of enhancing the emotional experience of those who use them.

4.1. Discussion Based on Experimental Results

The results of the quantitative simulation experiment on street interface transparency demonstrate a significant correlation between people’s perceived comfort and the change in interface transparency. This finding aligns with the research conclusions of Vikas Mehta. Transparent street-facing designs are perceived as attractive, and streets with high permeability also exhibit a strong social atmosphere [60]. The experimental results of the quantitative simulation of street interface transparency indicate that people’s perceived comfort level does not linearly change with the increase of interface transparency. Instead, it reaches a peak when the transparency is about 40%.
In terms of store density, although existing studies have not specified the number of stores on the street, Davies believes that a successful community needs to integrate commercial, educational, health, spiritual and civic uses in close proximity to residential functions to achieve functional mix and increase the vitality of the block [61]. It is therefore recommended that living streets should be guaranteed to have a sufficient number of storefronts to accommodate a greater variety of functions. Furthermore, a publication on the design of Boston’s streets [62] posits that an adequate number of shops, entrances, and exits can enhance pedestrian interaction with the street.
A semantic analysis method was used to conduct a correlation analysis on a range of evaluation factors pertaining to interface color and material. The findings indicate that the overall comfort of the interface is significantly correlated with color affinity, with a correlation coefficient of 0.739. Additionally, the friendliness of color is also found to be highly correlated with hue, with a correlation coefficient of 0.774. The hue of the interface color is closely related to the level of intimacy experienced when using the interface, and also has a significant impact on the overall comfort of the active commercial street. Some researchers have found that the presence of warm street walls and natural materials (such as stone) has a beneficial effect on stress recovery and the restoration of emotional equilibrium [19]. This finding is consistent with the results of the present study, which demonstrate that individuals exhibit a greater sense of emotional comfort in street spaces characterized by warm colors and rich textures.

4.2. Implications for Street Interface Design

At present, a considerable number of countries have published design guidelines pertaining to the urban street space [62,63]. In response to the specific requirements of urban development, numerous cities in China have also proposed guidelines for the control of street space as part of their new round of urban master planning. Examples of this include Shanghai, Nanjing, and Beijing. These street design guidelines examine a range of street interface elements from the perspective of pedestrians, vehicles, and even bicycles, and provide an overview of the positive and dynamic street characteristics. However, it should be noted that these guidelines do not specifically quantify these elements.
In light of the findings of this study, a number of considerations and implications emerge with regard to the design of living streets.
  • At a transparency level of 40%, the type 3 interface—a partially transparent facade—was found to be the most prevalent in the street scene. This suggests that advertising vitrines with display functions can provide a greater sensory experience for individuals, reducing the likelihood of visual fatigue or a decline in recognition due to similar interfaces. It can thus be concluded that the optimal approach to street interface design is to combine multiple interface types and to increase the proportion of interfaces with display functions, such as advertising windows. From an artistic perspective, the combination of different transparency types in the street interface facilitates the formation of a coherent rhythm and enhances the visual appeal of the virtual and real elements within the street.
  • It is recommended that, in order to ensure the functional intensification and diversity of formats on the street, as many functional formats as possible should be placed in a limited number of stores. This will guarantee the convenience of residents’ daily lives, which is an essential factor in the creation of a comfortable living street. It is important to maintain an appropriate level of store density in order to achieve this.
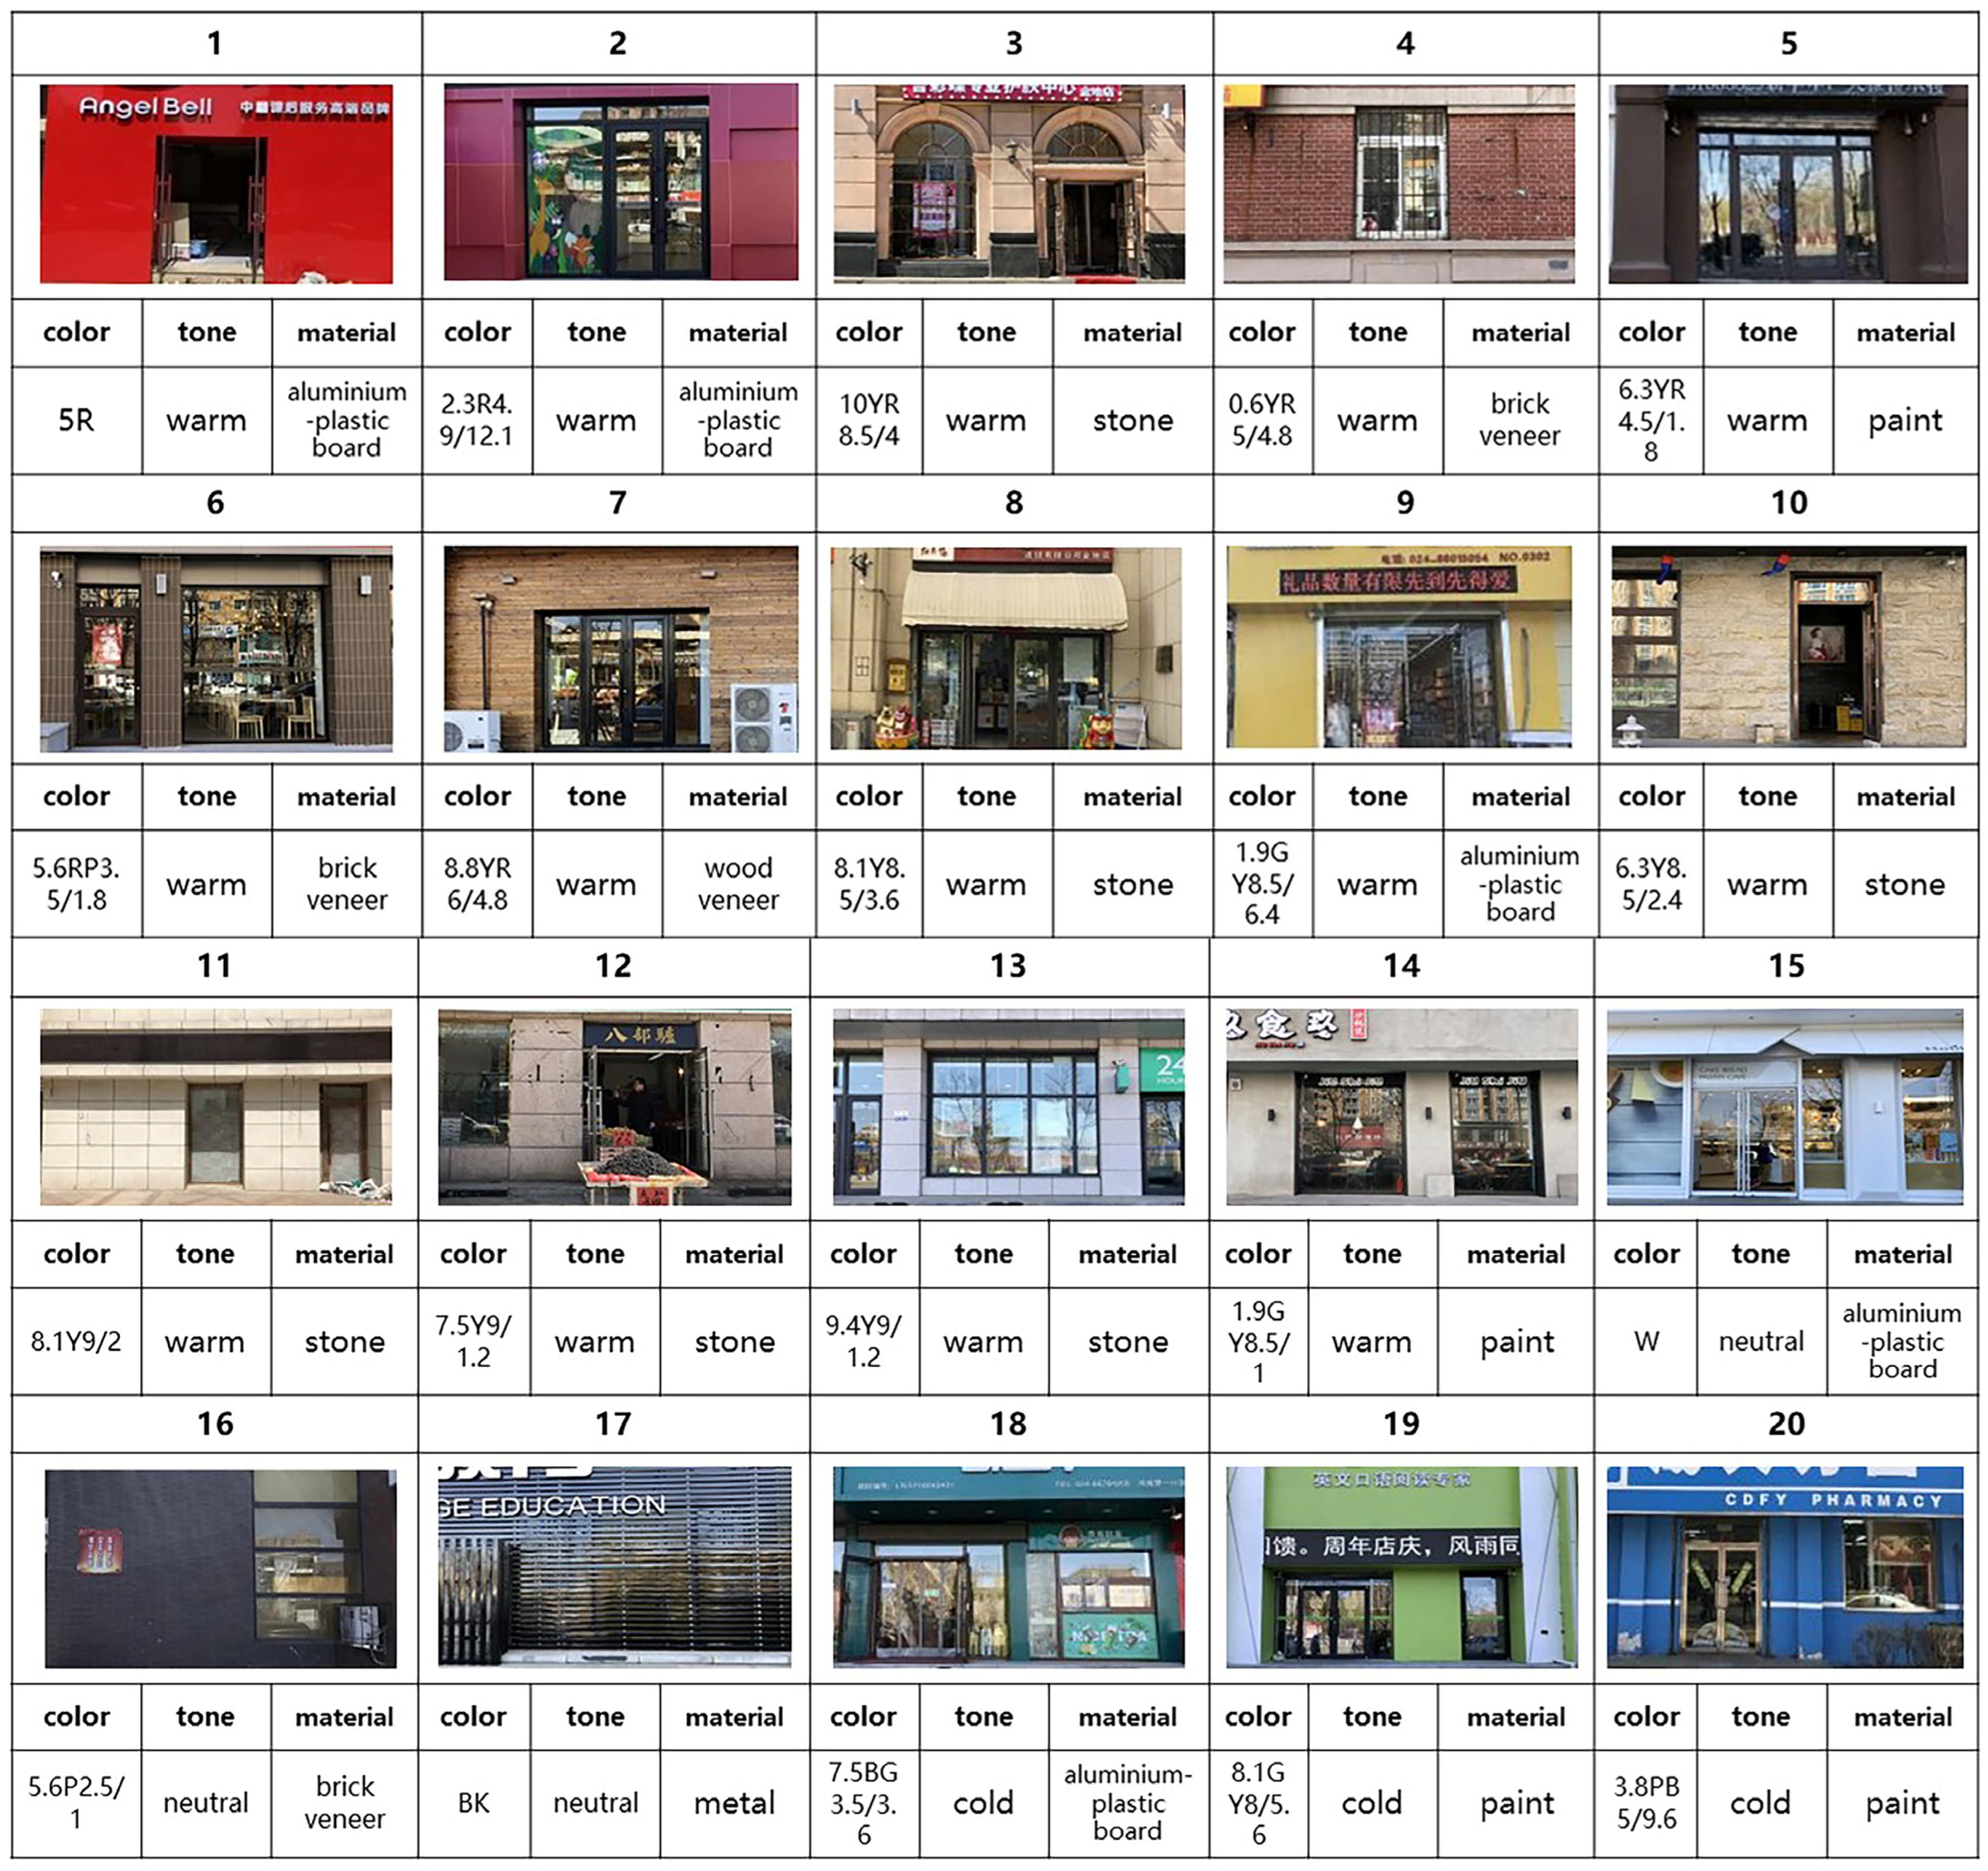
  • It is recommended that a warm street interface be incorporated into the urban design plan. Typically, warm colors evoke feelings of relaxation, warmth, and comfort, whereas cold colors can induce a sense of depression, quietude, and coldness. Consequently, active public spaces frequently use warm colors to create a vibrant ambience. Additionally, the experiment revealed that participants tended to assign higher ratings to rough materials with pronounced textures, including stone, brick veneer, and wood veneer. In the process of interface design, the combination of different materials can be used to enhance the overall design of the interface, thereby increasing the level of detail and richness of the street level interface.

5. Conclusions and Limitations

In this study, physiological measurement technology and the Likert scale were used to investigate the street visual elements that influence people’s emotional perception and the range of elements that enhance people’s sense of comfort. The recording and analysis of physiological data and subjective data demonstrate that for the same interface element, there are significant variations in emotional perception when different values are applied. The findings indicate that when the transparency of the interface is approximately 40%, and the store density is approximately 15, participants exhibit a higher level of perceived comfort. Additionally, the preference for warm colors and rich textures was observed in the context of street interfaces. This study used a quantitative experimental approach to investigate the impact of street interface elements. The methodology used in this study, which involved the utilization of a human factor measurement approach, enabled the perception situation—which was previously subjectively evaluated—to be expressed in a digital format. This experimental method has the potential to provide a novel research avenue for other studies pertaining to spatial perception.
Nevertheless, the present study is not without limitations. Firstly, it is evident that the perceptual activities of individuals within a real street environment were influenced by a multitude of spatial elements. Consequently, it is imperative to conduct further verification of the perceptual situation that arises when various elements are combined. Secondly, the quantitative simulation of interface elements was not a continuous change and could only measure the range value that was perceived as comfortable. Thirdly, the number of participants in this experiment was limited and the age of the participants was similar, which limits the data that could be obtained. Subsequent research should encompass a broader age range of participants and a greater number of subjects to ensure more accurate results. Fourthly, the accuracy of the existing physiological measurement equipment was limited and their operation was more complicated; thus, the experimental efficiency could be improved if there is more efficient and accurate equipment in the future.

Author Contributions

Conceptualization, Y.L. and Y.F.; methodology, Y.L.; software, Y.L.; validation, Y.L.; formal analysis, Y.L.; investigation, Y.L.; resources, Y.F.; data curation, Y.L.; writing—original draft preparation, Y.L.; writing—review and editing, Y.L.; visualization, Y.L.; supervision, Y.F.; project administration, Y.F. All authors have read and agreed to the published version of the manuscript.

Funding

This research received no external funding.

Institutional Review Board Statement

The study was conducted in accordance with the Declaration of Helsinki, and approved by the Ethics Committee of School of Architecture and Urbanplanning, Shenyang Jianzhu University(date of approval: 5 December 2023).

Informed Consent Statement

Informed consent was obtained from all subjects involved in the study.

Data Availability Statement

Data are contained within the article.

Conflicts of Interest

The authors declare no conflicts of interest.

References

  1. Harvey, C.; Aultman-Hall, L. Measuring Urban Streetscapes for Livability: A Review of Approaches. Prof. Geogr. 2016, 68, 149–158. [Google Scholar] [CrossRef]
  2. Ye, Y.; Li, D.; Liu, X. How Block Density and Typology Affect Urban Vitality: An Exploratory Analysis in Shenzhen, China. Urban Geogr. 2018, 39, 631–652. [Google Scholar] [CrossRef]
  3. Gehl, J. Cities for People; Island Press: Washington, DC, USA, 2010; pp. 3–19. [Google Scholar]
  4. Lynch, K. The Image of the City; Publication of the Joint Center for Urban Studies, 33. print; MIT Press: Cambridge, MA, USA, 2008; pp. 46–91. [Google Scholar]
  5. McAndrews, C.; Marshall, W. Livable Streets, Livable Arterials? Characteristics of Commercial Arterial Roads Associated With Neighborhood Livability. J. Am. Plann. Assoc. 2018, 84, 33–44. [Google Scholar] [CrossRef]
  6. Liu, H.; Li, X. Understanding the Driving Factors for Urban Human Settlement Vitality at Street Level: A Case Study of Dalian, China. Land 2022, 11, 646. [Google Scholar] [CrossRef]
  7. Ewing, R.; Handy, S. Measuring the Unmeasurable: Urban Design Qualities Related to Walkability. J. Urban Des. 2009, 14, 65–84. [Google Scholar] [CrossRef]
  8. Alidoust, S. Sustained Liveable Cities: The Interface of Liveability and Resiliency. Cities Health 2023, 1–12. [Google Scholar] [CrossRef]
  9. Scannell, L.; Gifford, R. The Experienced Psychological Benefits of Place Attachment. J. Environ. Psychol. 2017, 51, 256–269. [Google Scholar] [CrossRef]
  10. Saelens, B.E.; Sallis, J.F.; Frank, L.D. Environmental Correlates of Walking and Cycling: Findings From the Transportation, Urban Design, and Planning Literatures. Ann. Behav. Med. 2003, 25, 80–91. [Google Scholar] [CrossRef] [PubMed]
  11. Balsas, C.J.L. Measuring the Livability of an Urban Centre: An Exploratory Study of Key Performance Indicators. Plan. Pract. Res. 2004, 19, 101–110. [Google Scholar] [CrossRef]
  12. Zhang, L.; Ye, Y.; Zeng, W.; Chiaradia, A. A Systematic Measurement of Street Quality through Multi-Sourced Urban Data: A Human-Oriented Analysis. Int. J. Environ. Res. Public. Health 2019, 16, 1782. [Google Scholar] [CrossRef]
  13. Lv, G.; Zheng, S.; Hu, W. Exploring the Relationship between the Built Environment and Block Vitality Based on Multi-Source Big Data: An Analysis in Shenzhen, China. Geomat. Nat. Hazards Risk 2022, 13, 1593–1613. [Google Scholar] [CrossRef]
  14. Li, Q.; Cui, C.; Liu, F.; Wu, Q.; Run, Y.; Han, Z. Multidimensional Urban Vitality on Streets: Spatial Patterns and Influence Factor Identification Using Multisource Urban Data. ISPRS Int. J. Geo-Inf. 2021, 11, 2. [Google Scholar] [CrossRef]
  15. Simpson, J.; Freeth, M.; Simpson, K.J.; Thwaites, K. Street Edge Subdivision: Structuring Ground Floor Interfaces to Stimulate Pedestrian Visual Engagement. Environ. Plan. B Urban Anal. City Sci. 2022, 49, 1775–1791. [Google Scholar] [CrossRef]
  16. Lindal, P.J.; Hartig, T. Architectural Variation, Building Height, and the Restorative Quality of Urban Residential Streetscapes. J. Environ. Psychol. 2013, 33, 26–36. [Google Scholar] [CrossRef]
  17. Bornioli, A.; Parkhurst, G.; Morgan, P.L. Affective Experiences of Built Environments and the Promotion of Urban Walking. Transp. Res. Part Policy Pract. 2019, 123, 200–215. [Google Scholar] [CrossRef]
  18. Kabisch, N.; Püffel, C.; Masztalerz, O.; Hemmerling, J.; Kraemer, R. Physiological and Psychological Effects of Visits to Different Urban Green and Street Environments in Older People: A Field Experiment in a Dense Inner-City Area. Landsc. Urban Plan. 2021, 207, 103998. [Google Scholar] [CrossRef]
  19. Zhang, N.; Zhao, L.; Shi, J.; Gao, W. Impact of Visual and Textural Characteristics of Street Walls on Stress Recovery. Sci. Rep. 2024, 14, 15115. [Google Scholar] [CrossRef] [PubMed]
  20. Wen, Y.; Liu, B.; Li, Y.; Zhao, L. A Review of Research Progress on the Impact of Urban Street Environments on Physical Activity: A Comparison between China and Developed Countries. Buildings 2024, 14, 1779. [Google Scholar] [CrossRef]
  21. Salleh, N.F.M.; Sukadarin, E.H. Defining Human Factor and Ergonomic and Its Related Issues in Malaysia Pineapple Plantations. MATEC Web Conf. 2018, 150, 05047. [Google Scholar] [CrossRef]
  22. Molina-Tanco, L.; Bandera, J.; Marfil, R.; Sandoval, F. Real-Time Human Motion Analysis for Human-Robot Interaction; Universidad de Malaga: Malaga, Spain, 2005; pp. 1402–1407. [Google Scholar]
  23. Ergonomic-Based Design for Enterprise Office Space Planning. J. Civ. Eng. Urban Plan. 2023, 5, 44–50. [CrossRef]
  24. Douglas, I.P.; Murnane, E.L.; Bencharit, L.Z.; Altaf, B.; dos Reis Costa, J.M.; Yang, J.; Ackerson, M.; Srivastava, C.; Cooper, M.; Douglas, K.; et al. Physical Workplaces and Human Well-Being: A Mixed-Methods Study to Quantify the Effects of Materials, Windows, and Representation on Biobehavioral Outcomes. Build. Environ. 2022, 224, 109516. [Google Scholar] [CrossRef]
  25. Eilouti, B. A Framework for Integrating Ergonomics Into Architectural Design. Ergon. Des. Q. Hum. Factors Appl. 2023, 31, 4–12. [Google Scholar] [CrossRef]
  26. Zhang, R. Integrating Ergonomics Data and Emotional Scale to Analyze People’s Emotional Attachment to Different Landscape Features in the Wudaokou Urban Park. Front. Archit. Res. 2023, 12, 175–187. [Google Scholar] [CrossRef]
  27. Pei, W.; Guo, X.; Lo, T. Pre-Evaluation Method of the Experiential Architecture Based on Multidimensional Physiological Perception. J. Asian Archit. Build. Eng. 2023, 22, 1170–1194. [Google Scholar] [CrossRef]
  28. Carter, B.T.; Luke, S.G. Best Practices in Eye Tracking Research. Int. J. Psychophysiol. 2020, 155, 49–62. [Google Scholar] [CrossRef]
  29. Aristizabal, S.; Byun, K.; Porter, P.; Clements, N.; Campanella, C.; Li, L.; Mullan, A.; Ly, S.; Senerat, A.; Nenadic, I.Z.; et al. Biophilic Office Design: Exploring the Impact of a Multisensory Approach on Human Well-Being. J. Environ. Psychol. 2021, 77, 101682. [Google Scholar] [CrossRef]
  30. Brishtel, I.; Khan, A.A.; Schmidt, T.; Dingler, T.; Ishimaru, S.; Dengel, A. Mind Wandering in a Multimodal Reading Setting: Behavior Analysis & Automatic Detection Using Eye-Tracking and an EDA Sensor. Sensors 2020, 20, 2546. [Google Scholar] [CrossRef]
  31. Dirican, A.C.; Göktürk, M. Psychophysiological Measures of Human Cognitive States Applied in Human Computer Interaction. Procedia Comput. Sci. 2011, 3, 1361–1367. [Google Scholar] [CrossRef]
  32. Ojha, V.K.; Griego, D.; Kuliga, S.; Bielik, M.; Buš, P.; Schaeben, C.; Treyer, L.; Standfest, M.; Schneider, S.; König, R.; et al. Machine Learning Approaches to Understand the Influence of Urban Environments on Human’s Physiological Response. Inf. Sci. 2019, 474, 154–169. [Google Scholar] [CrossRef]
  33. Karakas, T.; Yildiz, D. Exploring the Influence of the Built Environment on Human Experience through a Neuroscience Approach: A Systematic Review. Front. Archit. Res. 2020, 9, 236–247. [Google Scholar] [CrossRef]
  34. Yang, S.; Bhanu, B. Facial Expression Recognition Using Emotion Avatar Image. In Proceedings of the Face and Gesture, Santa Barbara, CA, USA, 21–25 March 2011; IEEE: New York, NY, USA, 2011; pp. 866–871. [Google Scholar]
  35. Wang, M.; Deng, W. Deep Face Recognition: A Survey. Neurocomputing 2021, 429, 215–244. [Google Scholar] [CrossRef]
  36. Yu, Z.; Zhang, C. Image Based Static Facial Expression Recognition with Multiple Deep Network Learning. In Proceedings of the 2015 ACM on International Conference on Multimodal Interaction, Seattle, WA, USA, 9–13 November 2015; ACM: Seattle, WA, USA, 2015; pp. 435–442. [Google Scholar]
  37. Lyu, M.; Meng, Y.; Gao, W.; Yu, Y.; Ji, X.; Li, Q.; Huang, G.; Sun, D. Measuring the Perceptual Features of Coastal Streets: A Case Study in Qingdao, China. Environ. Res. Commun. 2022, 4, 115002. [Google Scholar] [CrossRef]
  38. Rundle, A.G.; Bader, M.D.M.; Richards, C.A.; Neckerman, K.M.; Teitler, J.O. Using Google Street View to Audit Neighborhood Environments. Am. J. Prev. Med. 2011, 40, 94–100. [Google Scholar] [CrossRef]
  39. Shen, Y.; Karimi, K. Urban Function Connectivity: Characterisation of Functional Urban Streets with Social Media Check-in Data. Cities 2016, 55, 9–21. [Google Scholar] [CrossRef]
  40. Birenboim, A.; Helbich, M.; Kwan, M.-P. Advances in Portable Sensing for Urban Environments: Understanding Cities from a Mobility Perspective. Comput. Environ. Urban Syst. 2021, 88, 101650. [Google Scholar] [CrossRef]
  41. Oliveira, V. Morpho: A Methodology for Assessing Urban Form. Urban Morphol. 2013, 17, 21–33. [Google Scholar] [CrossRef]
  42. Jin, G. Discussions on Urban Wall Street. City Plan. Rev. 1991, 15, 47–51. [Google Scholar]
  43. Jiang, Y.; Gu, P.; Chen, Y.; Mao, Q. Continuity of Street Facade Analysis with GIS: A Case Study of Jinan City. Urban Transp. China 2016, 14, 1–7. [Google Scholar]
  44. Soga, M.; Evans, M.J.; Tsuchiya, K.; Fukano, Y. A Room with a Green View: The Importance of Nearby Nature for Mental Health during the COVID-19 Pandemic. Ecol. Appl. Publ. Ecol. Soc. Am. 2021, 31, e2248. [Google Scholar] [CrossRef]
  45. Lu, Y. The Association of Urban Greenness and Walking Behavior: Using Google Street View and Deep Learning Techniques to Estimate Residents’ Exposure to Urban Greenness. Int. J. Environ. Res. Public. Health 2018, 15, 1576. [Google Scholar] [CrossRef]
  46. Chen, Y.; Zhao, X. Research on ground-floor interfaces along streets from the perspective of pedestrians: A case study 644 of huaihai road in shanghai. City Plan. Rev. 2014, 38, 24–31. [Google Scholar]
  47. Serra, J.; Manav, B.; Gouaich, Y. Assessing Architectural Color Preference after Le Corbusier’s 1931 Salubra Keyboards: A Cross Cultural Analysis. Front. Archit. Res. 2021, 10, 502–515. [Google Scholar] [CrossRef]
  48. Rogge, E.; Nevens, F.; Gulinck, H. Perception of Rural Landscapes in Flanders: Looking beyond Aesthetics. Landsc. Urban Plan. 2007, 82, 159–174. [Google Scholar] [CrossRef]
  49. Song, C.; Ikei, H.; Miyazaki, Y. Effects of Forest-Derived Visual, Auditory, and Combined Stimuli. Urban For. Urban Green. 2021, 64, 127253. [Google Scholar] [CrossRef]
  50. Shi, H.; Yang, L.; Zhao, L.; Su, Z.; Mao, X.; Zhang, L.; Liu, C. Differences of Heart Rate Variability Between Happiness and Sadness Emotion States: A Pilot Study. J. Med. Biol. Eng. 2017, 37, 527–539. [Google Scholar] [CrossRef]
  51. De Brito, J.N.; Pope, Z.C.; Mitchell, N.R.; Schneider, I.E.; Larson, J.M.; Horton, T.H.; Pereira, M.A. The Effect of Green Walking on Heart Rate Variability: A Pilot Crossover Study. Environ. Res. 2020, 185, 109408. [Google Scholar] [CrossRef]
  52. Valderas, M.T.; Bolea, J.; Laguna, P.; Vallverdu, M.; Bailon, R. Human Emotion Recognition Using Heart Rate Variability Analysis with Spectral Bands Based on Respiration. In Proceedings of the 2015 37th Annual International Conference of the IEEE Engineering in Medicine and Biology Society (EMBC), Milan, Italy, 25–29 August 2015; IEEE: New York, NY, USA, 2015; pp. 6134–6137. [Google Scholar]
  53. Rani, P.; Liu, C.; Sarkar, N.; Vanman, E. An Empirical Study of Machine Learning Techniques for Affect Recognition in Human–Robot Interaction. Pattern Anal. Appl. 2006, 9, 58–69. [Google Scholar] [CrossRef]
  54. Hercegfi, K. Heart Rate Variability Monitoring during Human-Computer Interaction. Acta Polytech. Hung. 2011, 8, 205–224. [Google Scholar]
  55. Wen, W.; Liu, G.; Cheng, N.; Wei, J.; Shangguan, P.; Huang, W. Emotion Recognition Based on Multi-Variant Correlation of Physiological Signals. IEEE Trans. Affect. Comput. 2014, 5, 126–140. [Google Scholar] [CrossRef]
  56. Ekman, P.; Levenson, R.W.; Friesen, W.V. Autonomic Nervous System Activity Distinguishes Among Emotions. Science 1983, 221, 1208–1210. [Google Scholar] [CrossRef]
  57. Britton, J.C.; Taylor, S.F.; Berridge, K.C.; Mikels, J.A.; Liberzon, I. Differential Subjective and Psychophysiological Responses to Socially and Nonsocially Generated Emotional Stimuli. Emotion 2006, 6, 150–155. [Google Scholar] [CrossRef] [PubMed]
  58. Khan, A.; Khan, A.A.; Alam, Q. Detection of Human Stress Using Short Term ECG and HRV Signals. J. Mech. Med. Biol. 2018, 13, 2320–2882. [Google Scholar]
  59. Kim, K.H.; Bang, S.W.; Kim, S.R. Development of Person-Independent Emotion Recognition System Based on Multiple Physiological Signals; IEEE: New York, NY, USA, 2002. [Google Scholar]
  60. Mehta, V. The Street: A Quintessential Social Public Space; Routledge: London, UK, 2013; pp. 117–174. [Google Scholar]
  61. Davies, L. Urban Design Compendium; English Partnerships and the Housing Corporation: London, UK, 2000; pp. 39–41. [Google Scholar]
  62. Boston Complete Streets|Boston.Gov. Available online: https://www.boston.gov/departments/transportation/boston-complete-streets (accessed on 14 September 2024).
  63. Global Designing Cities Initiative; National Association of City Transportation Officials; Bloomberg Philanthropies (Eds.) Global Street Design Guide; Island Press: Washington, DC, USA, 2015; ISBN 978-1-61091-701-8. [Google Scholar]
Figure 1. The research framework.
Buildings 14 03098 g001
Figure 2. Experimental instruments.
Buildings 14 03098 g002
Figure 3. Street scene plane diagram.
Buildings 14 03098 g003
Figure 4. Section view of street scene.
Buildings 14 03098 g004
Figure 6. Schematic diagram of store density experiment flow.
Buildings 14 03098 g006
Figure 7. Common street colors and materials.
Buildings 14 03098 g007
Figure 8. Experimental scene settings for interface colors and materials.
Buildings 14 03098 g008
Figure 9. Color and material experiment flow diagram.
Buildings 14 03098 g009
Figure 10. PPG and HRV analysis interface.
Buildings 14 03098 g010
Figure 11. EDA and SC analysis interface.
Buildings 14 03098 g011
Figure 13. (a) Column chart of HRV change rate of store density; (b) Column chart of SC change rate of store density; (c) Column chart of subjective evaluation score of store density.
Buildings 14 03098 g013
Figure 14. Color and material scene score line chart.
Buildings 14 03098 g014
Table 1. Interface transparency classification.
Interface
Transparency Type
Interface FeaturesCalculated Weight
Type 1Transparent glass doors directly open to the public
(excluding non-transparent, obscured doors)
1.25
Type 2Direct line of sight to interior glass windows1
Type 3Advertised glass windows and clear glass windows with significant sightline obstruction0.75
Type 4Opaque solid walls and opaque adverts0
Table 2. Setting of transparency experimental scene elements.
Scenario QuantificationScenario Variables
Street width18 mInterface transparencyN1 20%
Building formSimple modern N2 40%
Materials and colorsGrey granite N3 60%
SignageThe brand name is omitted and the logo is simplified N4 80%
Building story1 floor
Sidewalk paving formRed rectangular floor tiles are staggered
Store density15 per 100 m
Interface continuityThe length of the street is about 160 m, the middle part is disconnected, and the rest is continuous
Building line ratioAll interfaces remain in the same plane
Playback speed1.2 m/s
Table 3. Setting of store density experimental scene elements.
Scenario QuantificationScenario Variables
Street width18 mStore densityS1 5
Building formSimple modern S2 10
Materials and colorsGrey granite S3 15
SignageThe brand name is omitted and the logo is simplified S4 20
Building story1 floor
Sidewalk paving formRed rectangular floor tiles are staggered
Interface transparency80%
Interface continuityThe length of the street is about 160 m, the middle part is disconnected, and the rest is continuous
Building line ratioAll interfaces remain in the same plane
Playback speed1.2 m/s
Disclaimer/Publisher’s Note: The statements, opinions and data contained in all publications are solely those of the individual author(s) and contributor(s) and not of MDPI and/or the editor(s). MDPI and/or the editor(s) disclaim responsibility for any injury to people or property resulting from any ideas, methods, instructions or products referred to in the content.

