Article

Optimization of Shear Resistance in Horizontal Joints of Prefabricated Shear Walls through Post-Cast Epoxy Resin Concrete Applications

1
Tianjin Key Laboratory of Civil Buildings Protection and Reinforcement, Tianjin 300384, China
2
School of Civil Engineering, Tianjin Chengjian University, Tianjin 300384, China
3
Tangshi Jianhua Building Materials (Tianjin) Co., Ltd., Tianjin 301500, China
*
Author to whom correspondence should be addressed.
Buildings 2024, 14(10), 3119; https://doi.org/10.3390/buildings14103119 (registering DOI)
Submission received: 2 September 2024 / Revised: 23 September 2024 / Accepted: 25 September 2024 / Published: 28 September 2024
(This article belongs to the Special Issue Advances in Novel Precast Concrete Structures)

Abstract

:
The horizontal joint is a critical component of the prefabricated shear wall structure, responsible for supporting both horizontal shear forces and vertical loads along with the wall, thereby influencing the overall structural performance. This study employs direct shear testing and finite element analysis to investigate the horizontal joint in walls with ring reinforcement. It examines the impact of various factors on joint shear performance, including the type of joint material, joint configuration, buckling length of ring reinforcement, strength of precast concrete, reinforcement ratio of ring reinforcement and dowel bars, and the effect of horizontal binding force. The findings indicate that the shear bearing capacity and stiffness of joints incorporating post-cast epoxy resin concrete and keyways are comparable or superior to those of integrally cast specimens. A larger buckling length in ring reinforcement may reduce shear strength, suggesting an optimal buckling length at approximately one-third of the joint width. As the strength of precast concrete increases, ductility decreases while bearing capacity increases, initially at an increasing rate that subsequently declines. Optimal results are achieved when the strength of precast concrete closely matches that of the post-cast epoxy concrete. Enhancing the reinforcement ratio of ring reinforcement improves shear capacity, but excessively high ratios significantly reduce ductility. It is recommended that the diameter of ring reinforcement be maintained between 10 mm and 12 mm, with a reinforcement ratio between 0.79% and 1.13%. Increasing horizontal restraint enhances stiffness and shear capacity but reduces ductility; thus, the axial compression ratio should not exceed 0.5.

1. Introduction

In prefabricated shear wall structures, the quality of connections between the prefabricated walls is critical for ensuring the safety and reliability of the overall structure [1]. An appropriately designed connection structure facilitates a rational and orderly force transfer mechanism, thereby enhancing the overall performance and seismic resilience of the structure. Existing research indicates that the primary methods for improving the performance of prefabricated shear wall joints include [2,3,4,5] the following: the implementation of reliable steel bar connection techniques, the proper treatment of joint surfaces between new and existing concrete, the utilization of high-performance post-cast joint materials such as fiber-reinforced concrete, polymer concrete, and high-strength concrete, as well as the optimization of joint reinforcement ratios.
In terms of reinforcement connections, common connection technologies for steel bars include the sleeve grouting method, the bolt anchoring method, and the slurry anchor connection method [6,7,8]. Engineering practices indicate that these steel bar connection methods can fulfill the quality requirements for steel bar connections. However, they also present challenges, such as high costs, inconvenient construction processes, low efficiency, and difficulties in ensuring the quality of sleeve grouting. The ring reinforcement buckle connection technology, introduced by Yu, Z.-W., et al. [9,10], represents a significant simplification in the reinforcement connection process. This technology not only ensures superior quality in wall connections but also equates the load-bearing capacity and seismic performance of prefabricated concrete shear walls with those of cast-in-place walls. Yu et al. [11] extended this connection technology to precast concrete columns, which exhibited commendable transverse strength and ductility. The ring bar joint technology [9,10,11] is characterized by its straightforward construction process. It involves fastening a U-shaped hoop, which protrudes from the upper and lower prefabricated walls, to an appropriate length, threading the longitudinal bar through the joint area, tying the longitudinal bar and U-shaped hoop together, and finally pouring concrete to form a horizontal joint, thereby achieving the connection of two prefabricated walls (Figure 1).
When it comes to epoxy resin concrete, epoxy concrete exhibits strong interfacial bond strength and possesses favorable thermal stability, chemical resistance, and mechanical properties. Consequently, this material is frequently employed in reinforcement projects, including concrete crack repair and road construction [12,13,14,15,16]. Natarajan et al. [17] investigated the effects of partially replacing cement with epoxy resin, suggesting that this substitution enhanced both the compressive and flexural strength of the concrete. Qian et al. [18] conducted axial tensile tests on both unreinforced and reinforced epoxy concrete, revealing that the tensile and cracking properties of epoxy concrete surpassed those of ordinary concrete, while also demonstrating excellent bonding characteristics with steel reinforcement bars. Additionally, El Mandouh et al. [19] assessed the shear performance of 18 simply supported super-reinforced epoxy resin concrete beams, discovering that these beams exhibited less deformation, higher cracking loads, greater ultimate shear capacity, and enhanced ductility compared to ordinary concrete beams. Chen [20] conducted both experimental and numerical analyses on post-cast epoxy resin concrete shear walls, concluding that the seismic performance of these walls surpassed that of conventional cast-in-place reinforced concrete walls. Consequently, this study proposes the adoption of epoxy resin concrete as the post-cast material to further explore its impact on the shear performance of the horizontal joints in prefabricated shear walls.
Regarding interface treatments between new and old concrete surfaces, Julio et al. [21] conducted an experimental investigation into various treatment technologies. Their findings indicated that sandblasting yielded the highest bond strength. However, the efficiency of field construction was relatively low. Rizkalla et al. [22] examined different horizontal joint configurations in prefabricated shear walls, concluding that shear walls featuring keyways exhibited superior mechanical properties compared to those with conventional horizontal joints. Gopal et al. [23] demonstrated through shear testing that the use of epoxy resin adhesive in keyways significantly enhances the shear bearing capacity of the bonding surface when compared to dry joints. These findings also provides a reference for the research direction of this study.
In terms of finite element analysis, Fan et al. [24] introduced a novel reinforcement lap method that involves the assembly of nodes with X-shaped reinforcement. They employed ABAQUS software to simulate the U-hoop lap in conjunction with X-shaped reinforcement. In this simulation, the interface between the new and old concrete within the precast concrete structure was represented through surface contact, while the tangential interactions were modeled based on a Coulomb friction model. The analysis indicated that the incorporation of additional X-shaped reinforcement alters the force transmission path at the joint, reduces the stress in the cross-sectional area of the joint, and enhances the reliability of the vulnerable sections of the assembled shear wall. Building upon extensive research, the European Union code [25] offers recommendations regarding the friction coefficient values for the joint surfaces of new and old concrete. Jin et al. [26] utilized ABAQUS finite element simulation to investigate the mechanical properties of joints in epoxy concrete truss structures, demonstrating that the numerical model could accurately simulate and predict the strength and failure behavior of the specimens. These research methods provide the basis for the finite element analysis in this study.
In summary, to enhance the shear resistance of the horizontal joint in prefabricated shear walls, seven symmetrical direct shear specimens were designed and fabricated utilizing toroidal joint technology. The design parameters included the joint material, the length of the toroidal joint, and the joint configuration (i.e., with or without a keyway). Direct shear testing and finite element simulation were employed to analyze the effect of these design parameters on the performance of the horizontal joint in prefabricated shear walls, with the aim of identifying the optimal construction scheme for the horizontal joint.

2. Experimental Overview

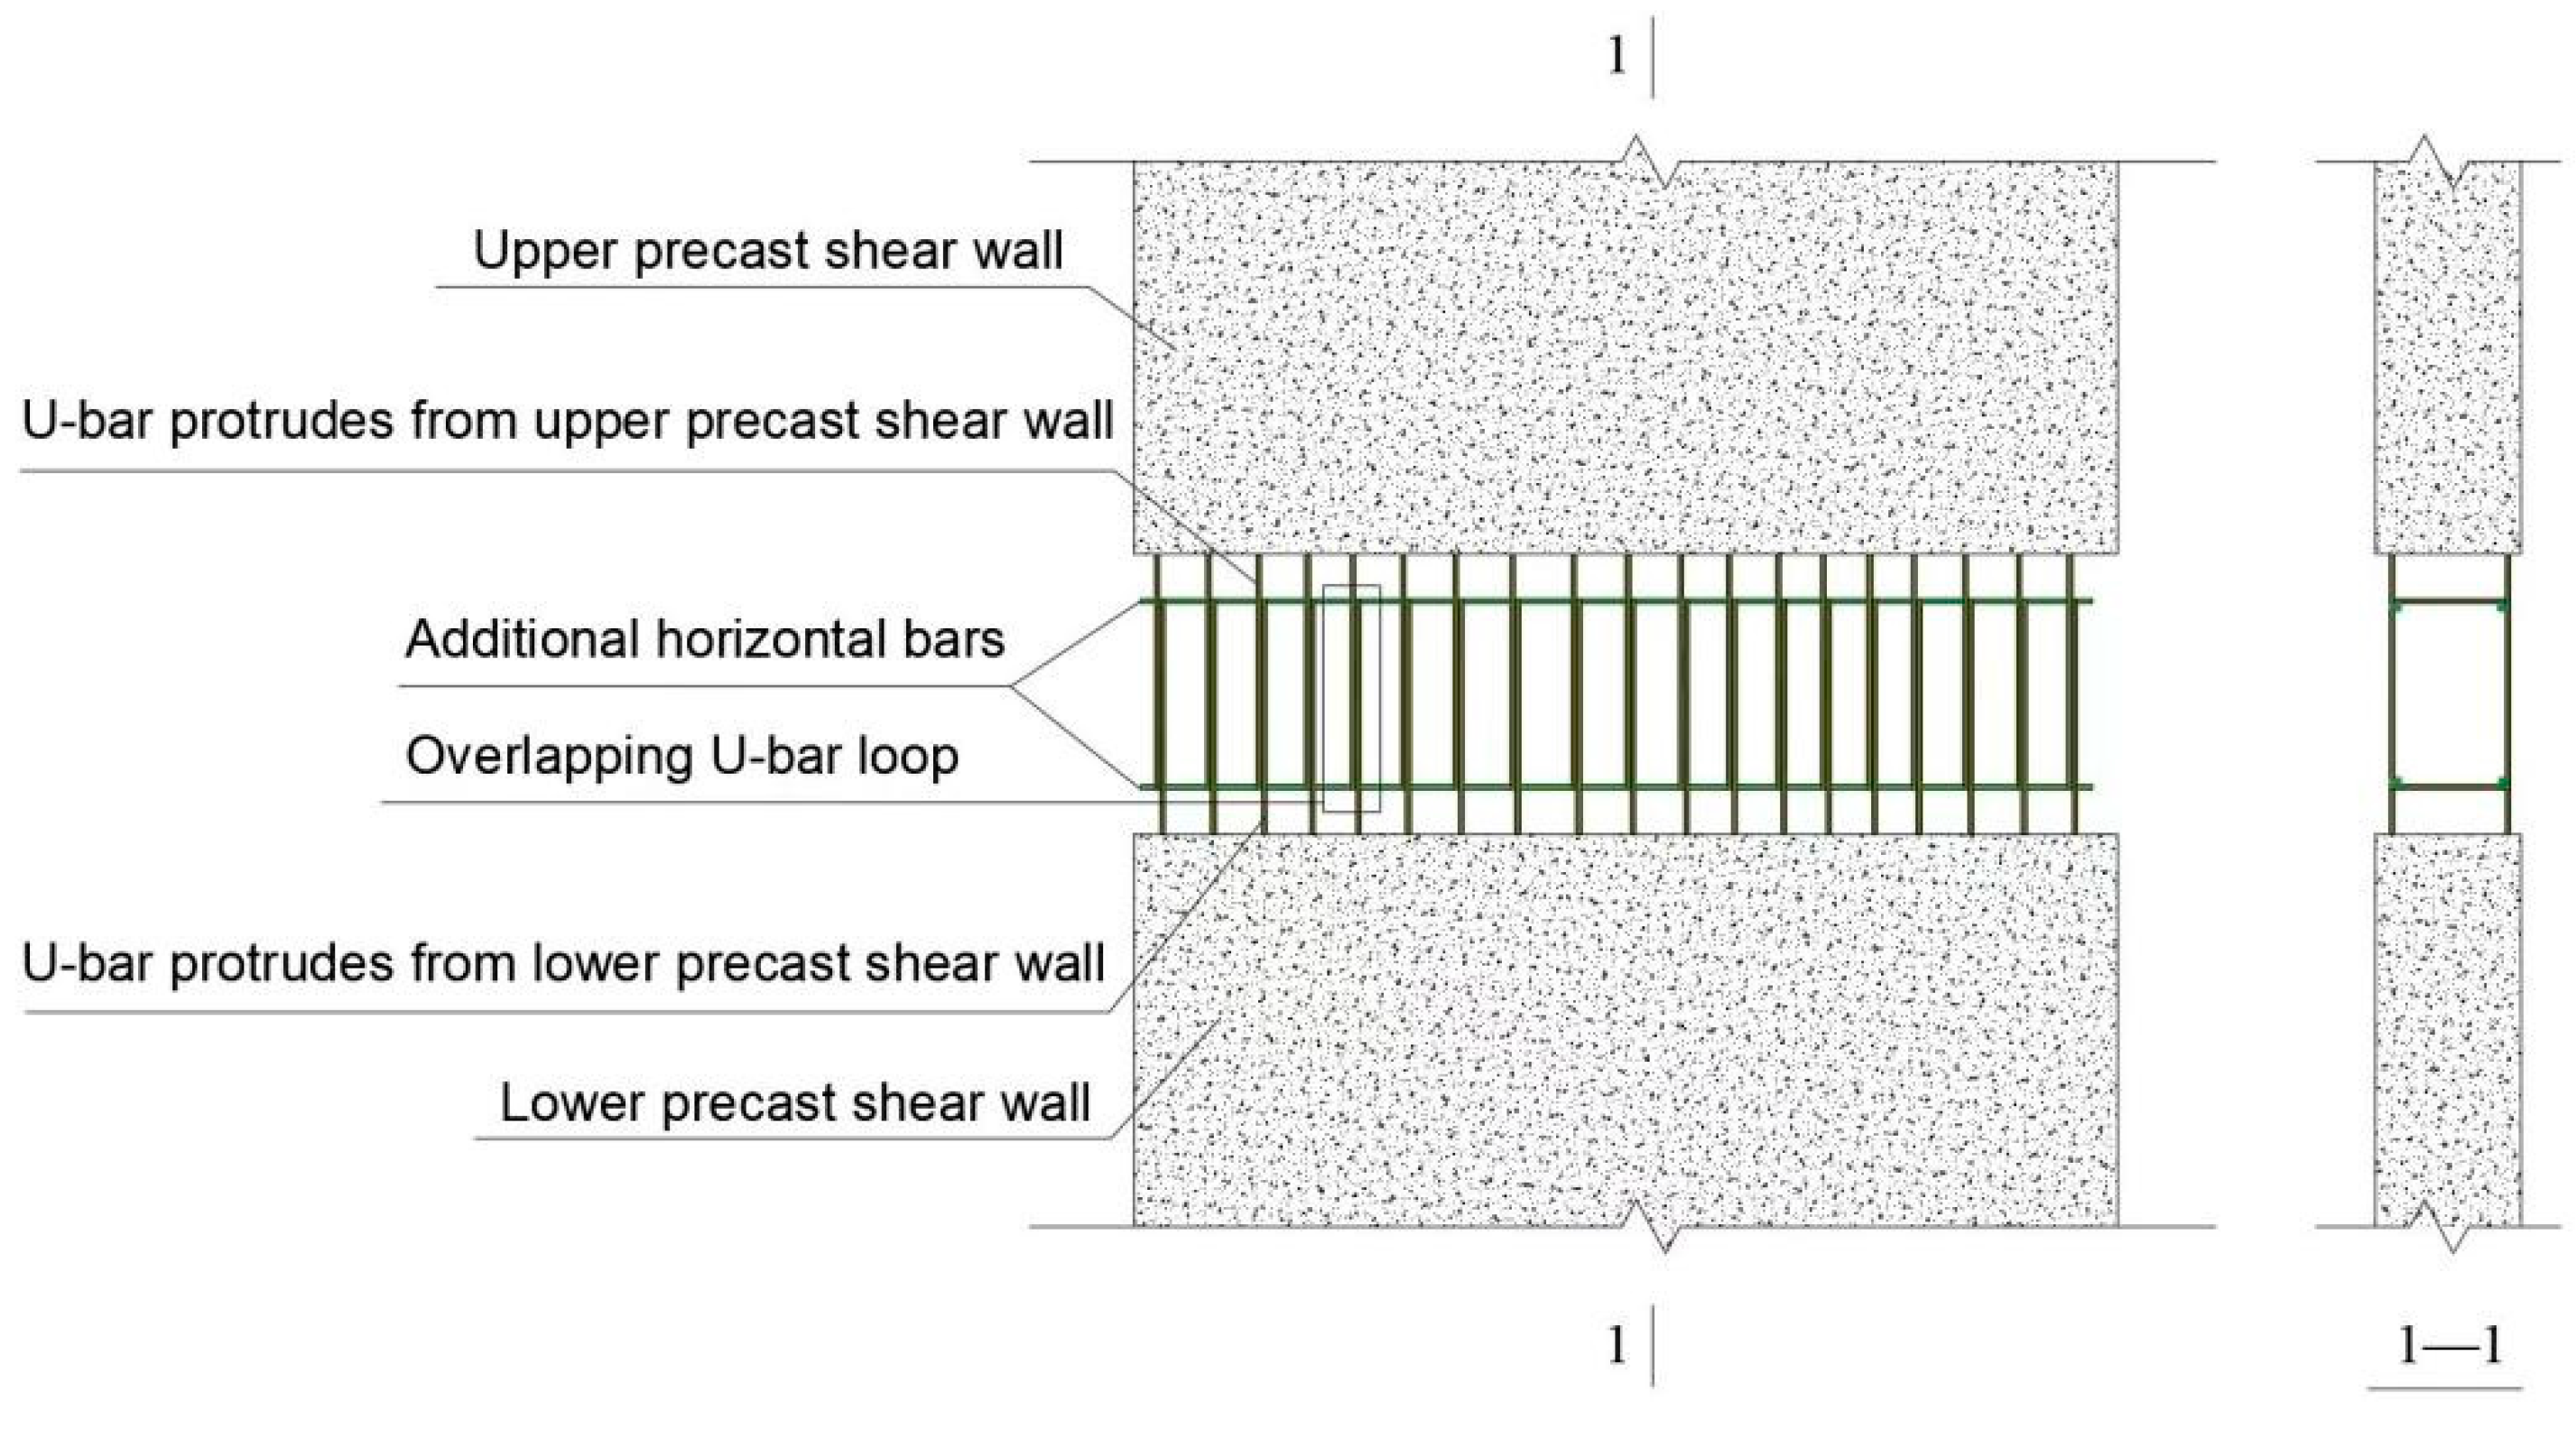
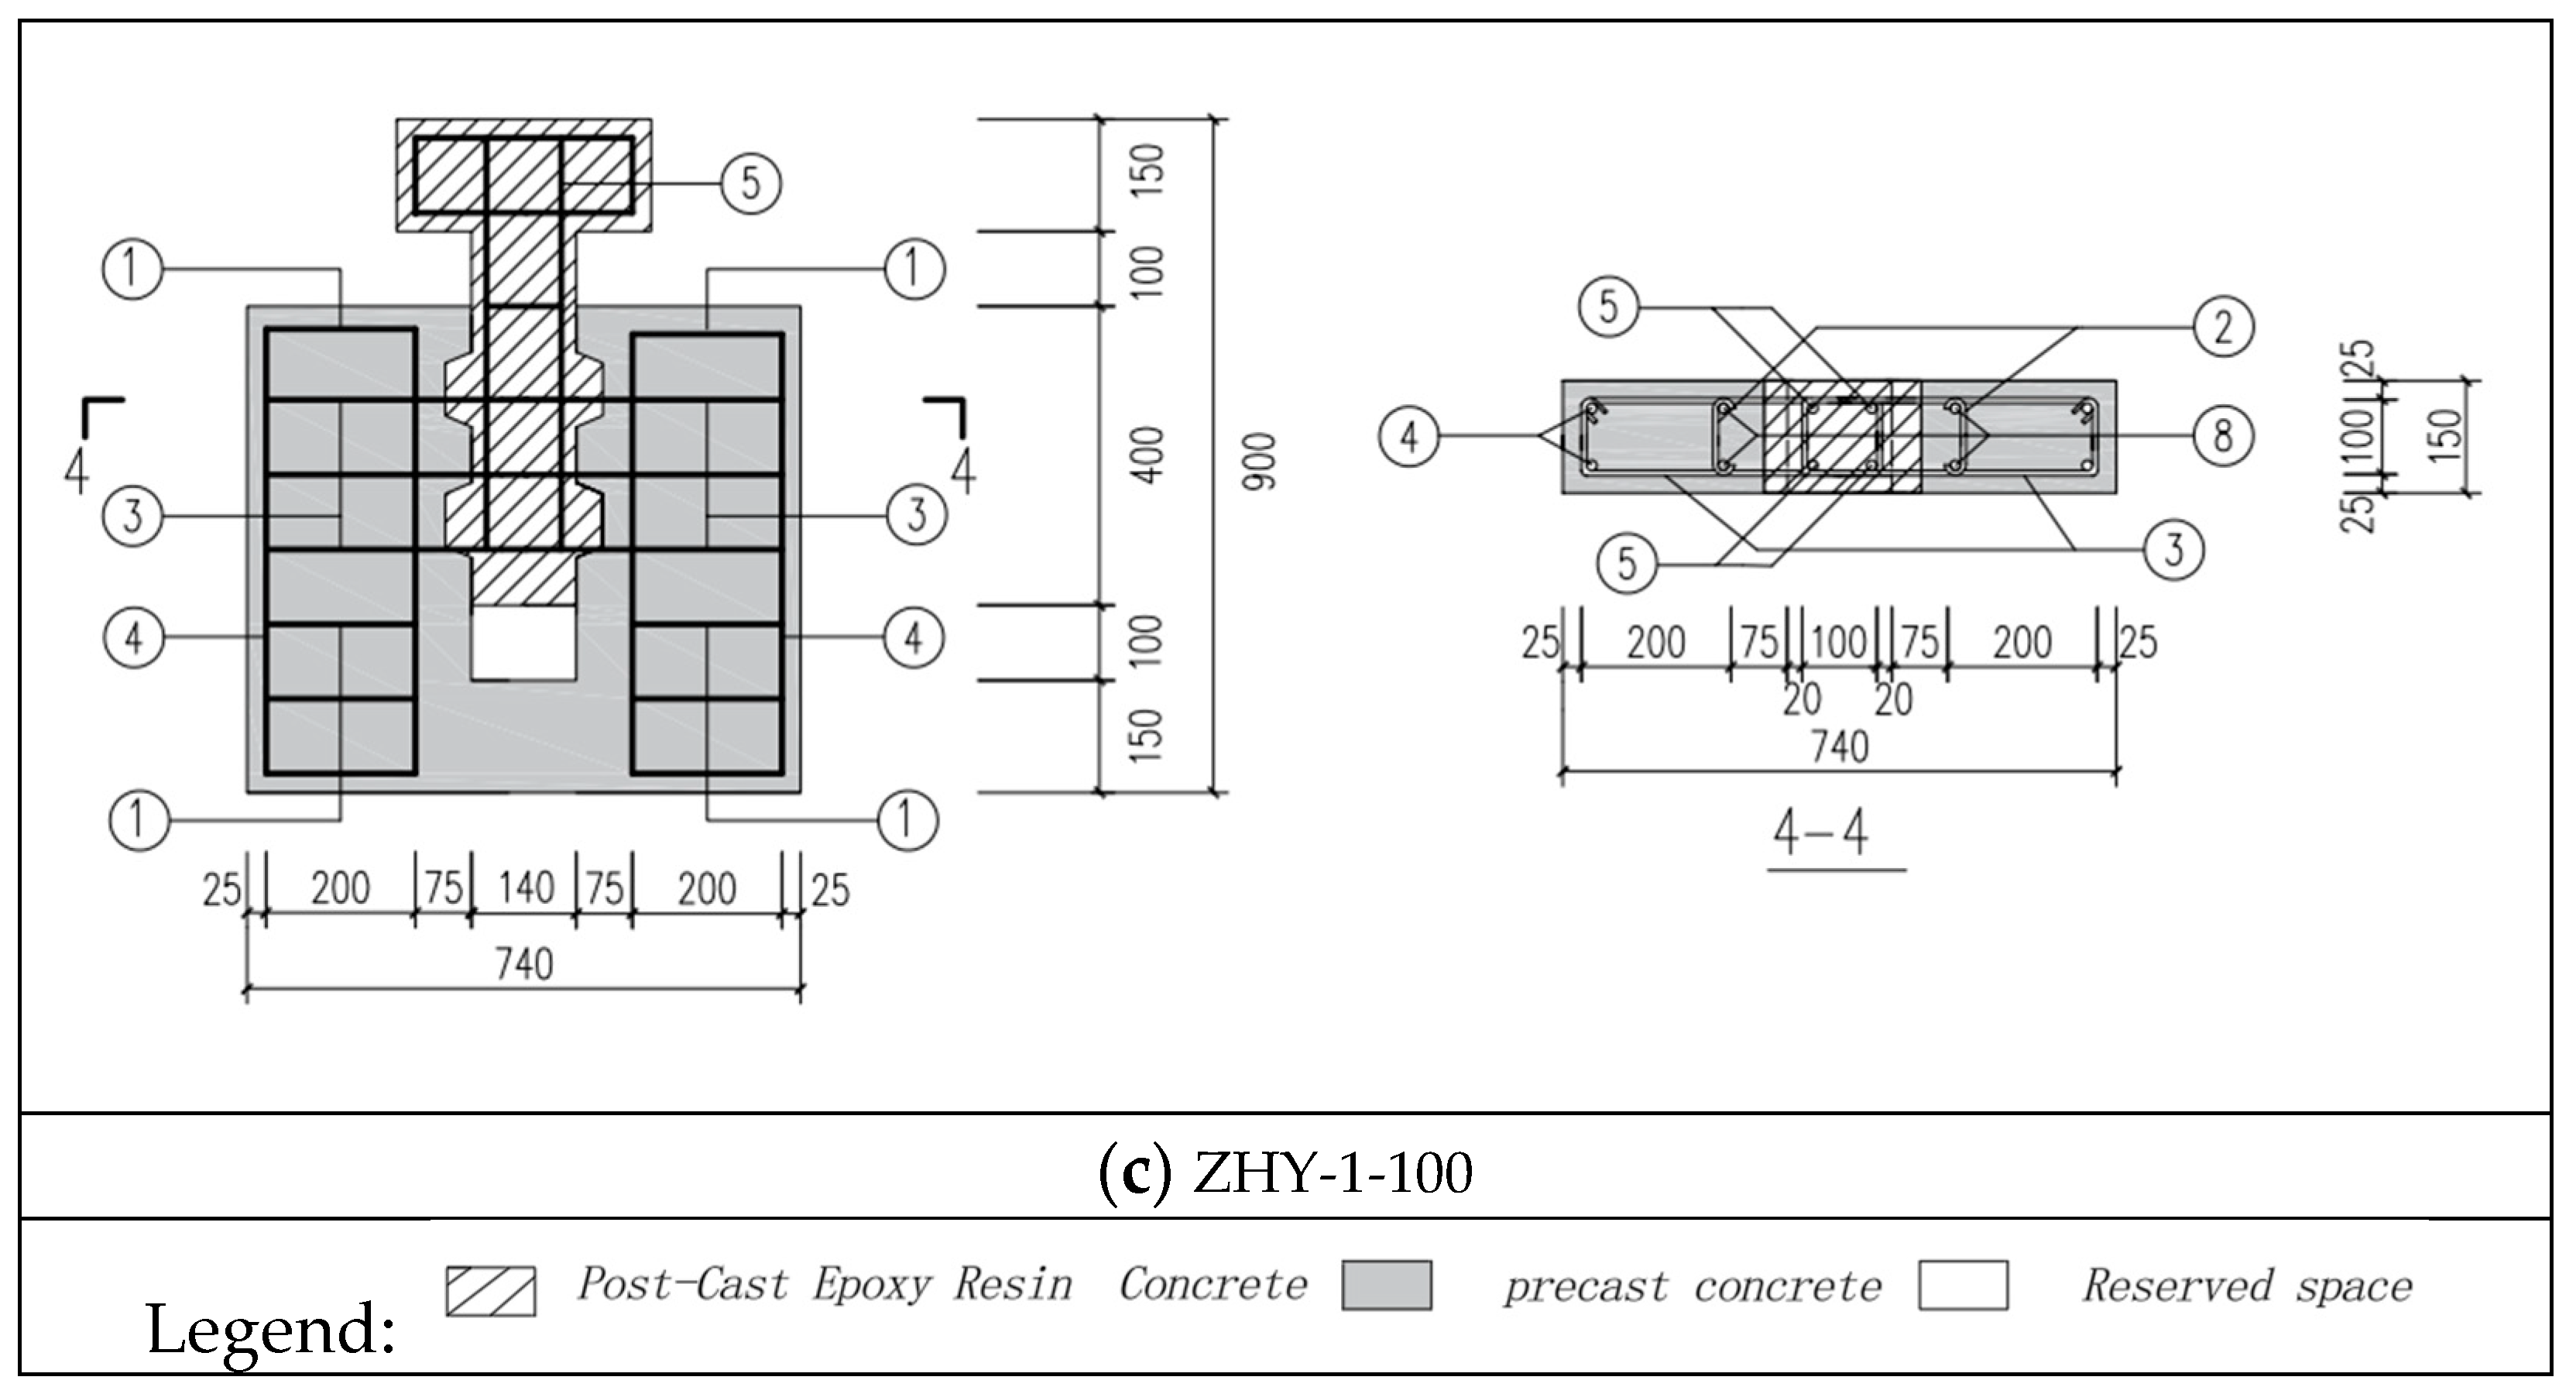
2.1. Specimen Design and Production

The assembled specimen is categorized into two components: prefabrication and post-casting. The post-casting component specifically pertains to the horizontal joint of the shear wall, which employs ring bar joint technology (Figure 2). In accordance with the “Technical standard for precast reinforced concrete shear wall structure assembled by anchoring closed loop reinforcement ” (JGJ/T 430-2018) [27], a U-shaped rebar retention length of 120 mm ensures that the anchoring performance of the shear wall matches that of a cast-in-place structure. Therefore, U-shaped rebar retention length was set to 120 mm for this experiment. As part of the design parameters, 6 prefabricated direct shear specimens were developed, alongside one cast-in-place specimen designated as a comparison specimen. The fundamental information and identification numbers for each specimen are presented in Table 1, while the dimensions and reinforcement details of typical specimens are depicted in Figure 2. For instance, specimen ZHY-1-80 is exemplified in Figure 2a, where the No. 3 rib (6C8) serves as the horizontal joint ring rib, with an annular reinforcement ratio of 0.50%. Additionally, the No. 5 bar (4C8) functions as the horizontal joint insert bar, exhibiting an insert bar reinforcement ratio of 0.83%.

2.2. Basic Mechanical Properties of Materials
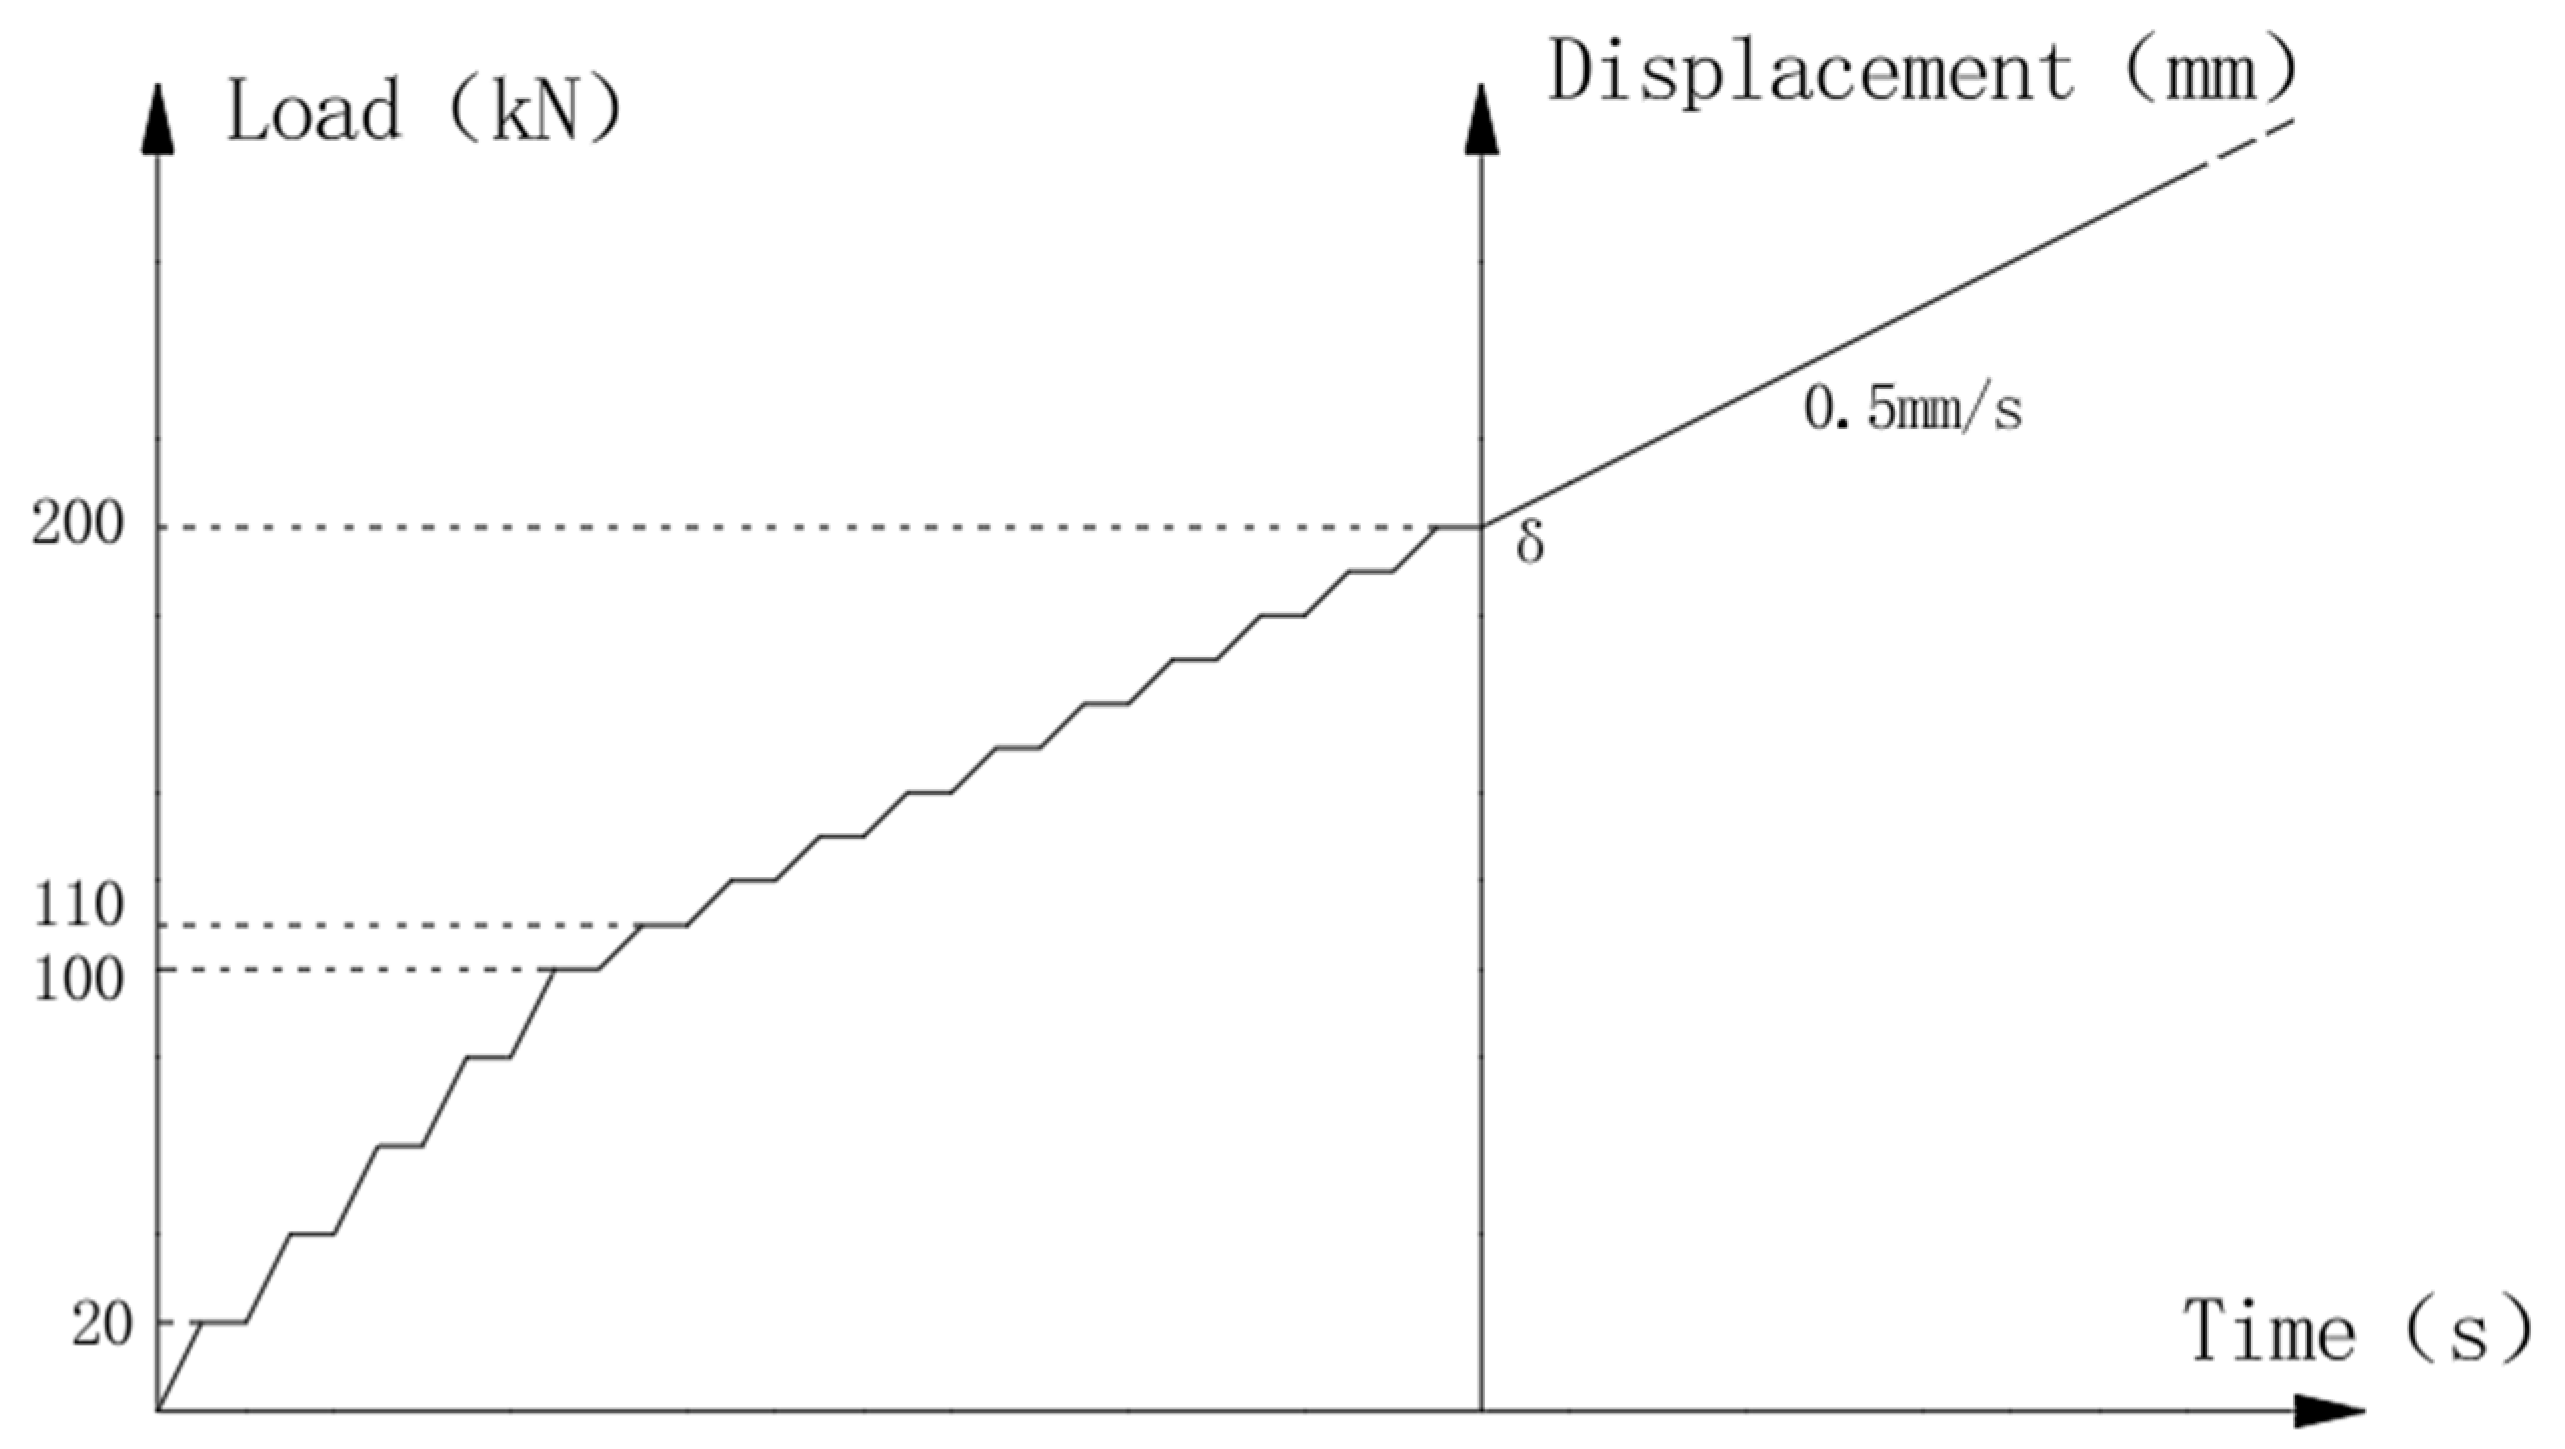
In the proposed test, self-mixed C40 concrete was utilized as the standard for ordinary concrete. The average measured cubic compressive strength of precast concrete was found to be 42.1 MPa, while that of post-cast concrete was 40.6 MPa. Additionally, the average compressive strength of self-mixed epoxy resin concrete was recorded at 55.9 MPa. Furthermore, the average measured yield strength of HPB300 steel bar with a diameter of 6 mm was 268.3 MPa. In contrast, the average yield strengths of the HRB400 steel bars with diameters of 8 mm and 12 mm were measured at 361.1 MPa and 360.0 MPa, respectively.

2.3. Loading Scheme

The test device is shown in Figure 3. The vertical loading equipment utilizes a 30,000 kN electro-hydraulic servo dynamic and static universal testing machine, which can be used for static testing of different materials with high precision and repeatability; it can carry out tensile, compression, bending, shear, and spalling tests of various materials. The test piece is placed on the test bench, and the loading end of the testing machine, the test piece, and the positioning line of the test bench are kept on the same vertical line so as to ensure that the old and new concrete joint surface under load is in a pure shear state.
Load displacement control is employed for vertical loading. When the vertical load is less than the estimated cracking load of 200 kN, load control is utilized. Within the range of 0 kN to 100 kN, loading increments are set at 20 kN, while in the range of 100 kN to 200 kN, increments are adjusted to 10 kN. Once the vertical load exceeds the cracking load, the system switches to displacement control load, with a loading rate of 0.5 mm/min. The test concludes when the displacement of the specimen exceeds 10 times the cracking displacement and the residual load stabilizes. The configuration of the test loading system is depicted in Figure 4.

2.4. Displacement Measurement Scheme

Two displacement meters, designated as W-1 and W-3, were symmetrically positioned on the upper section of the prefabricated component of the specimen. Additionally, two displacement meters, W-2 and W-4, were installed on both the upper and lower surfaces of the post-cast joint to measure the slip at the joint interface between the prefabricated and post-cast sections of the specimen (Figure 5). Specifically, the slip at the joint surface is determined by calculating the difference between the mean values obtained from displacement meters W-2 and W-4.

3. Analysis of Experimental Phenomena and Results

3.1. Effect of Buckle Length on Joint Shear Performance

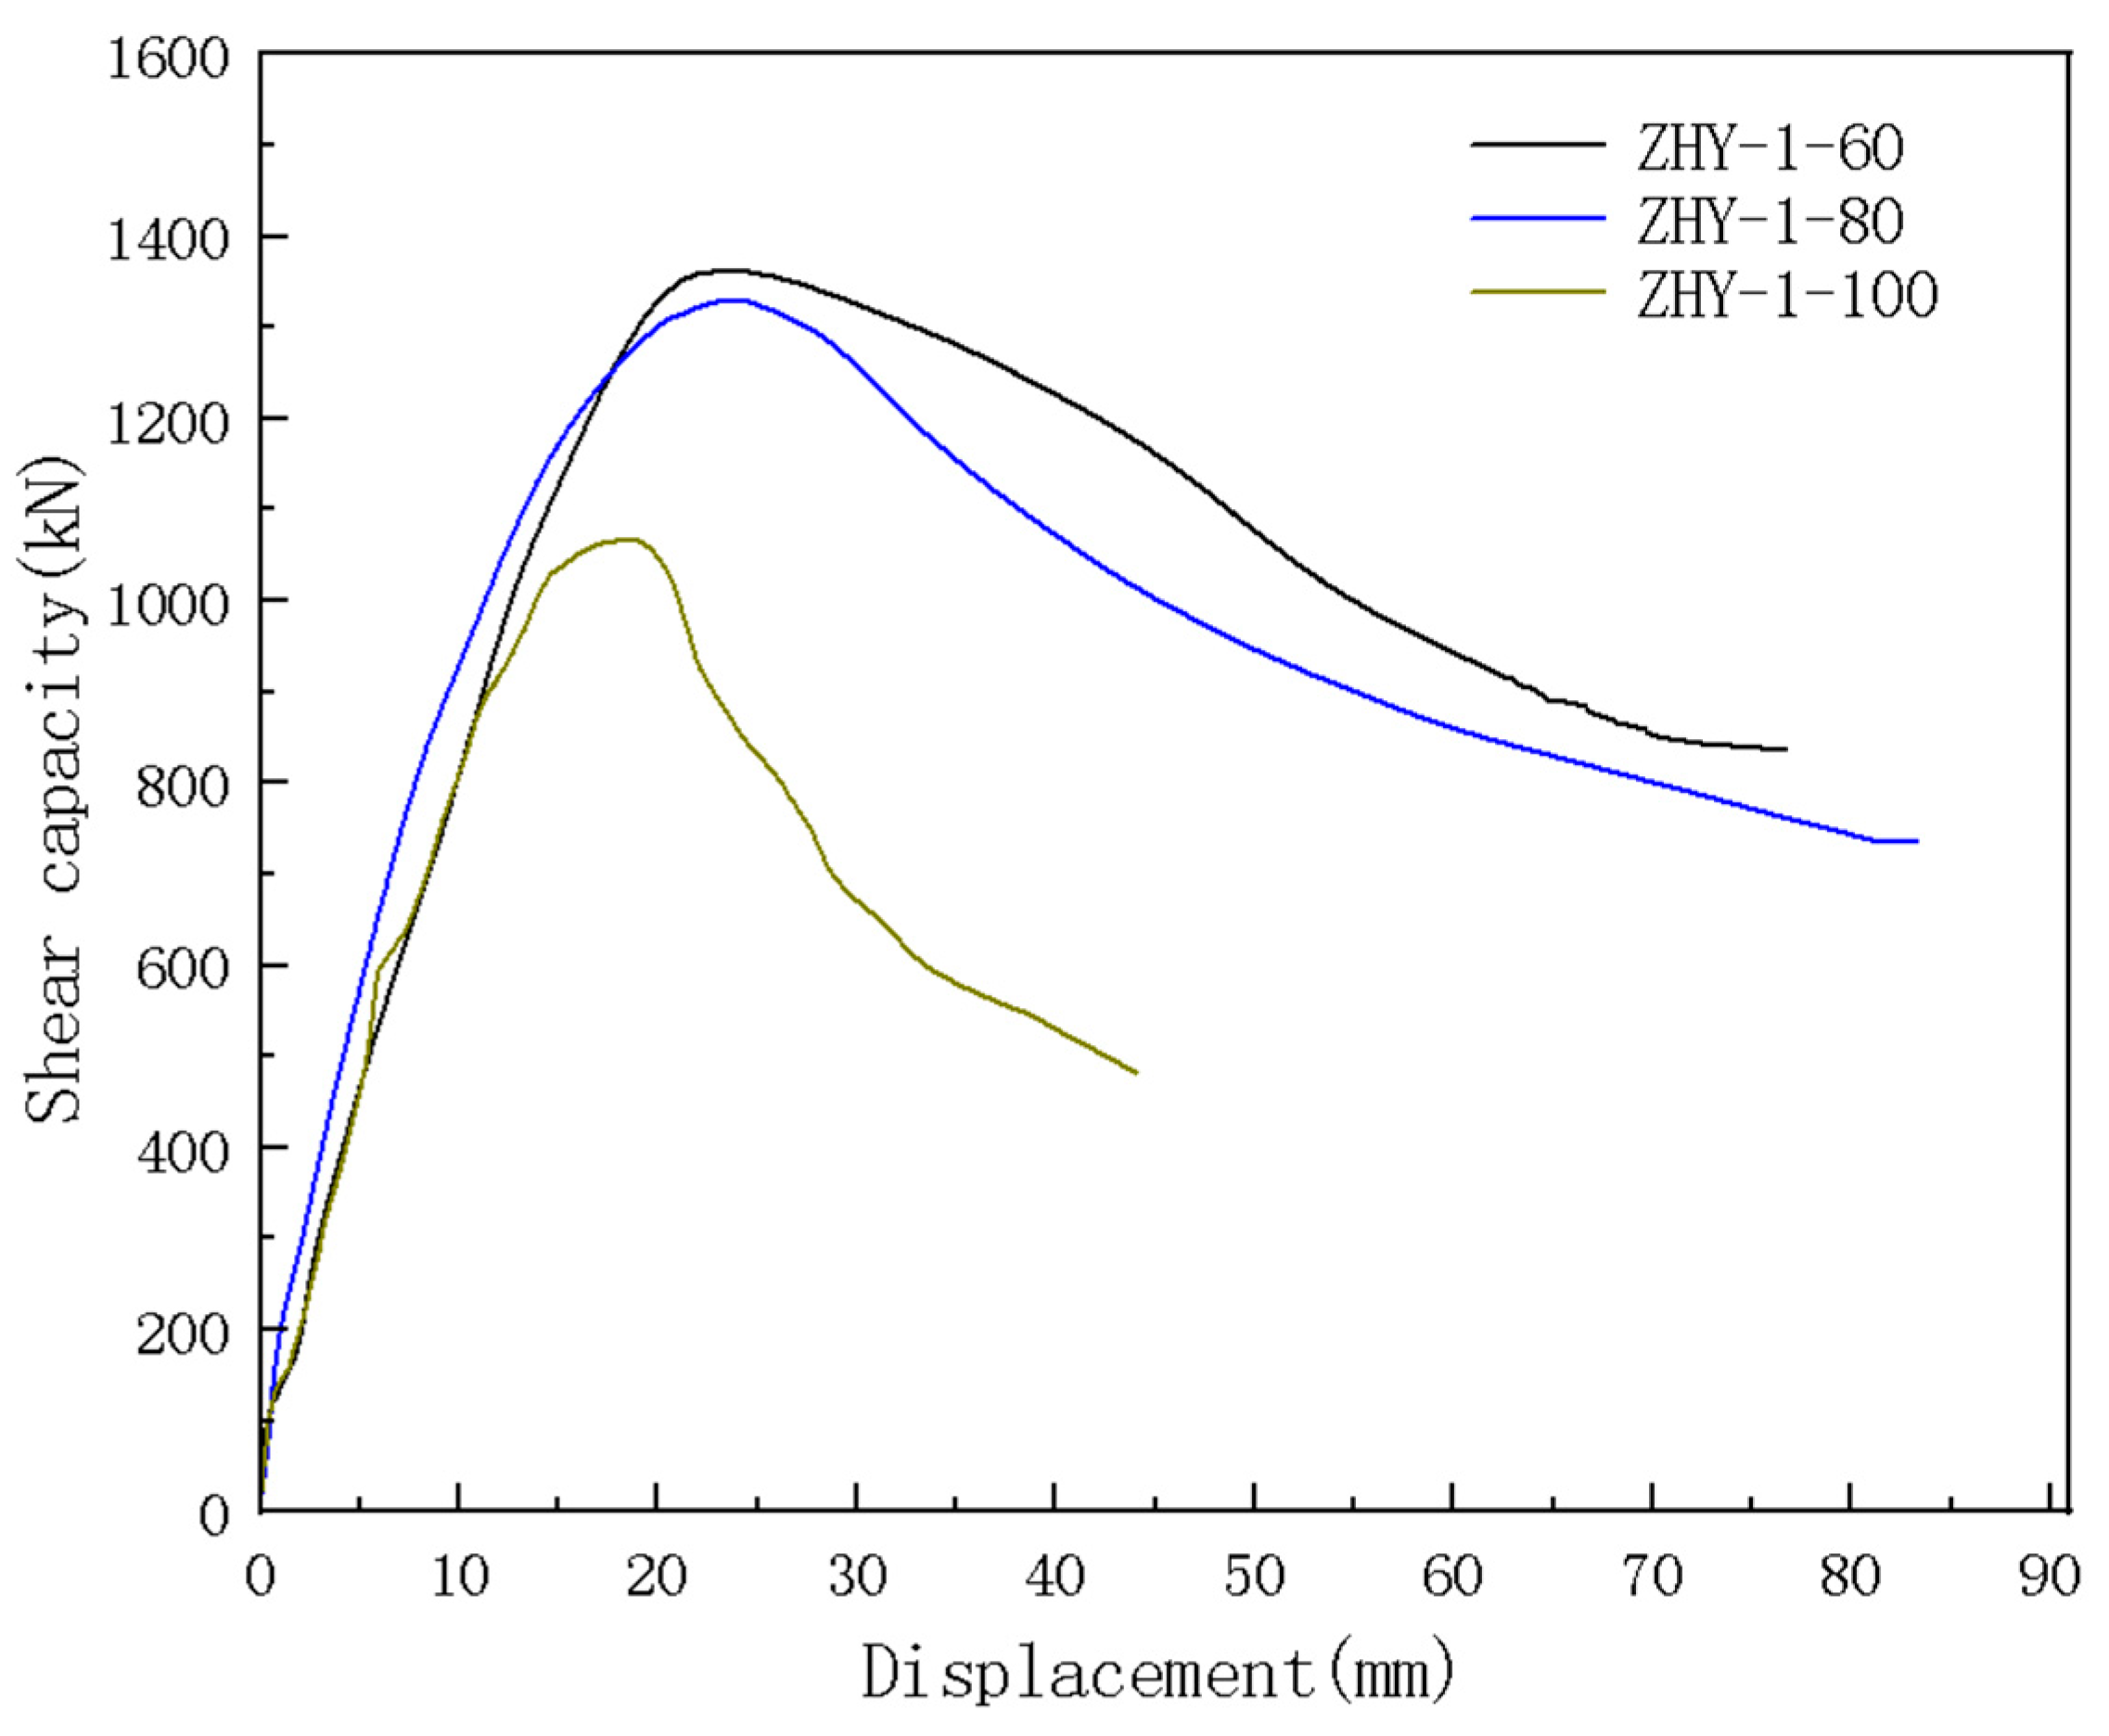
3.1.1. Specimens with Post-Poured Epoxy Concrete and Bonding Surface with Keyway

The specimens ZHY-1-60, ZHY-1-80, and ZHY-1-100 are constructed from epoxy resin concrete, serving as joint materials. Each bonding surface is designed with a keyway. However, the lengths of the buckles vary among the specimens. The failure characteristics of each specimen are illustrated in Figure 6, while the load-displacement curves for each specimen are presented in Figure 7.
The typical failure process observed in this group of specimens is characterized by the following sequence: Initially, upon the commencement of loading, small cracks emerge at the ends of the key teeth located on the lower side of the specimens. As the load increases, these cracks progressively extend along the bonding surface, subsequently leading to the formation of cracks at the root of the keyway. With further increases in load and displacement, the crack at the root of the keyway propagates into the post-poured epoxy concrete. At the peak load, the cracks on the joint surface gradually extend from the bottom to the base, resulting in the cracks at the root of the keyway becoming fully developed and the key teeth experiencing severance. Following this, the spalling of precast concrete adjacent to the keyway becomes increasingly pronounced, while the cracks in the post-cast epoxy concrete also develop, albeit less visibly. When the displacement exceeds 10 times the initial cracking displacement and the residual load stabilizes, the specimen’s bearing capacity is compromised, leading to the conclusion of the test.
In the case of specimen ZHY-1-60, when the load decreased to 64.2% of the peak load, the displacement surpassed 10 times the cracking displacement, at which point the residual load stabilized, leading to the conclusion of the test. For specimen ZHY-1-80, the spalling of concrete adjacent to the keyway following the peak load, as well as the cracking of both the main and secondary diagonals, was more pronounced compared to specimen ZHY-1-60. The test for this specimen concluded when the load diminished to 57.4% of the peak load. Regarding specimen ZHY-1-100, spalling was noted when the load reached 73.6% of the peak load. At the peak load, significant damage was observed at the neck of the keyway, with portions of the epoxy concrete exhibiting spalling and the cracks on the joint surface becoming penetrating. The test was terminated when the load fell to 44.5% of the peak load.
As seen in Figure 7, there is no significant difference in the shear stiffness of the specimens as the buckle length increases. However, a decrease in shear capacity is observed. The shear bearing capacities of the two specimens with buckle lengths of 60 mm and 80 mm are comparable. Notably, the reduction in bearing capacity for specimen ZHY-1-60 is less pronounced after reaching the peak value, suggesting superior ductility.

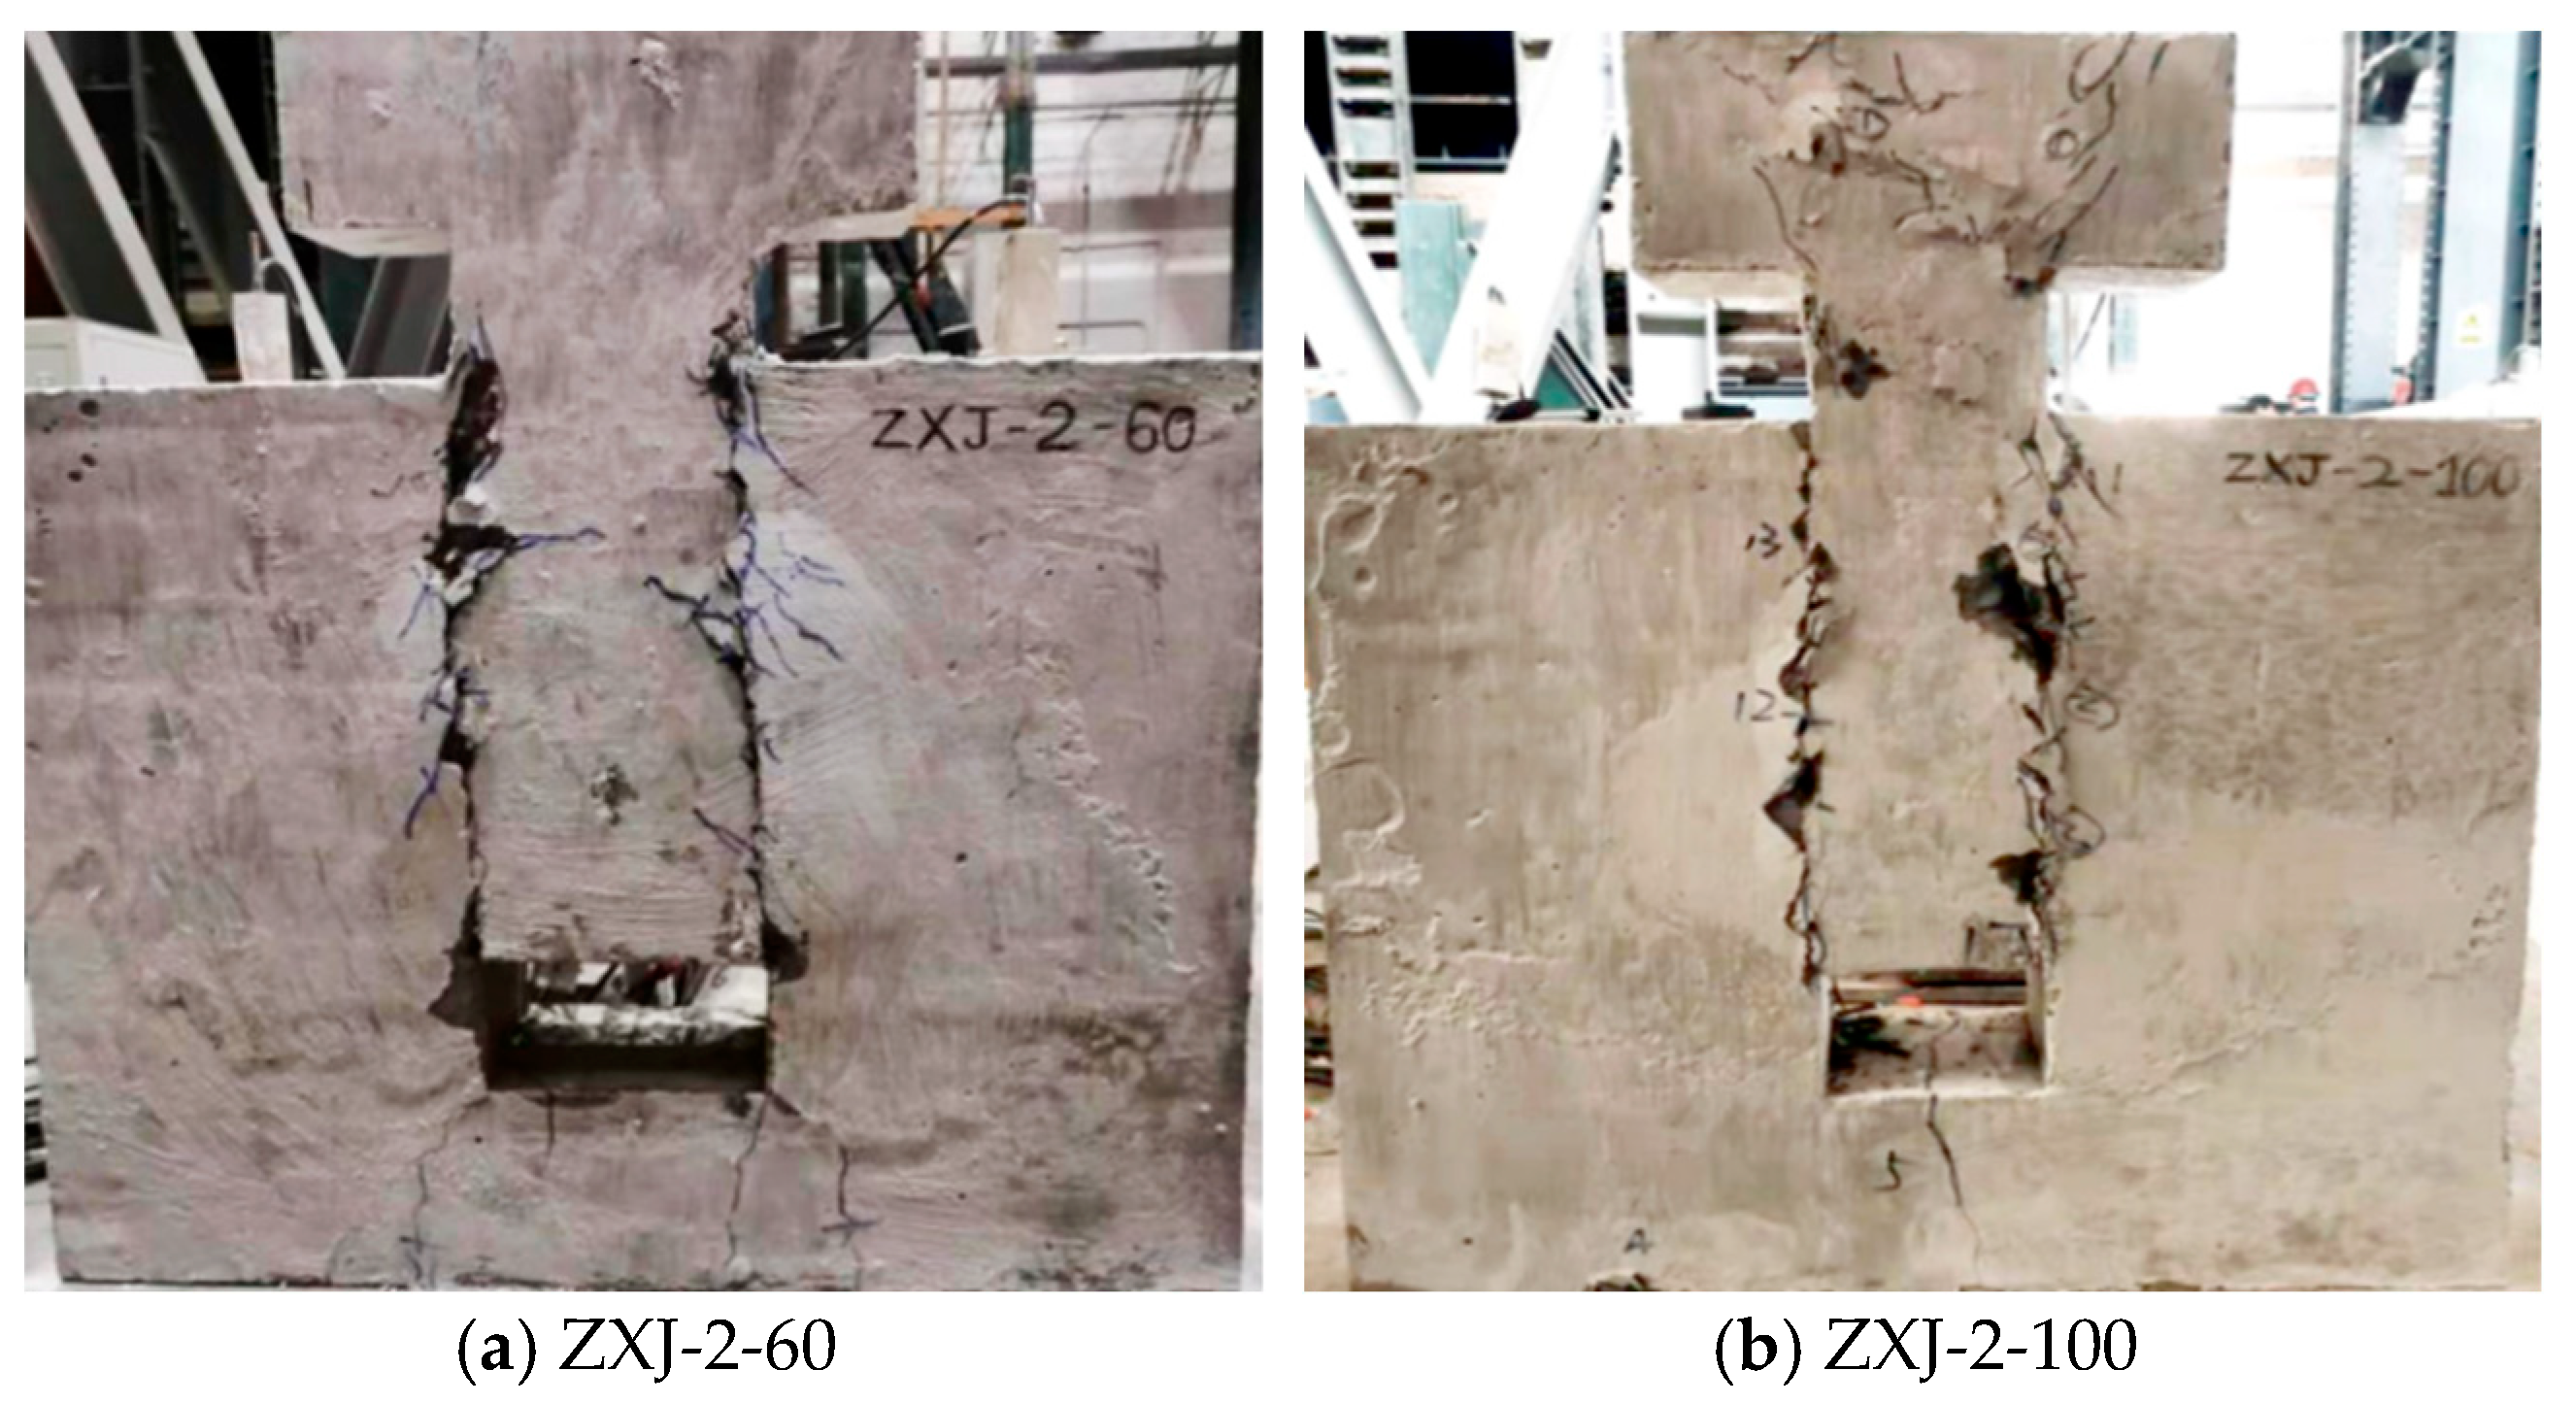
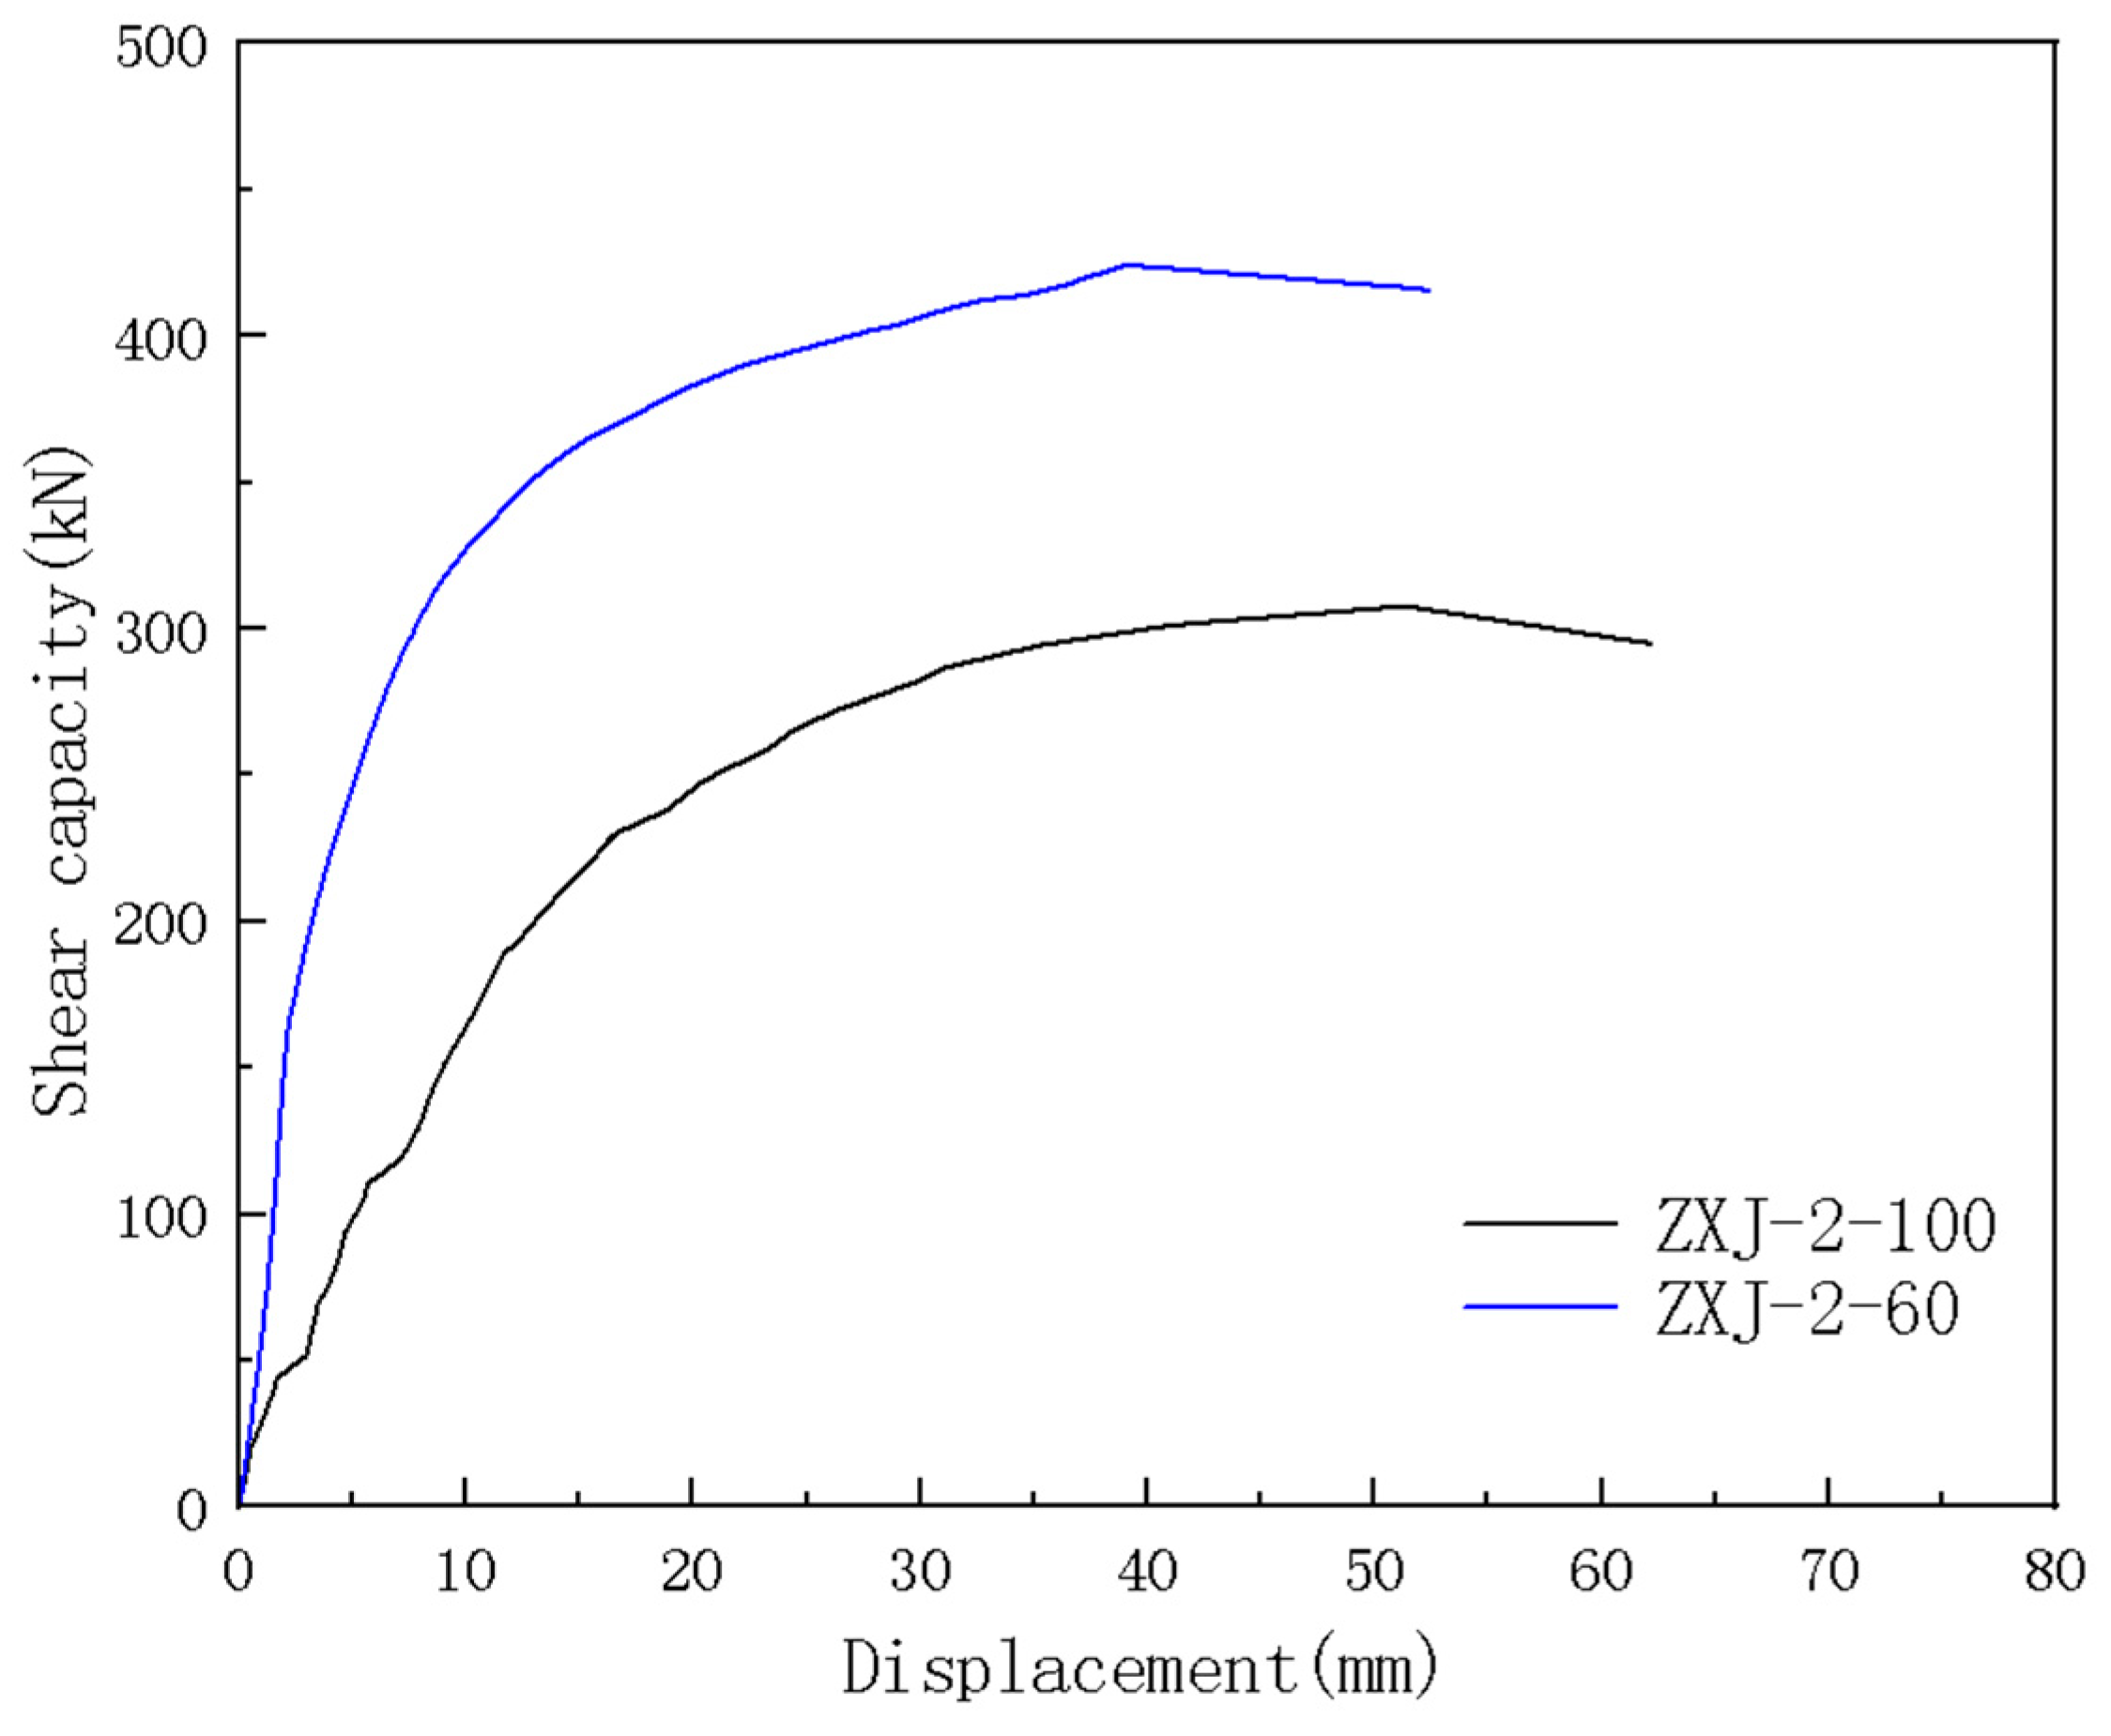
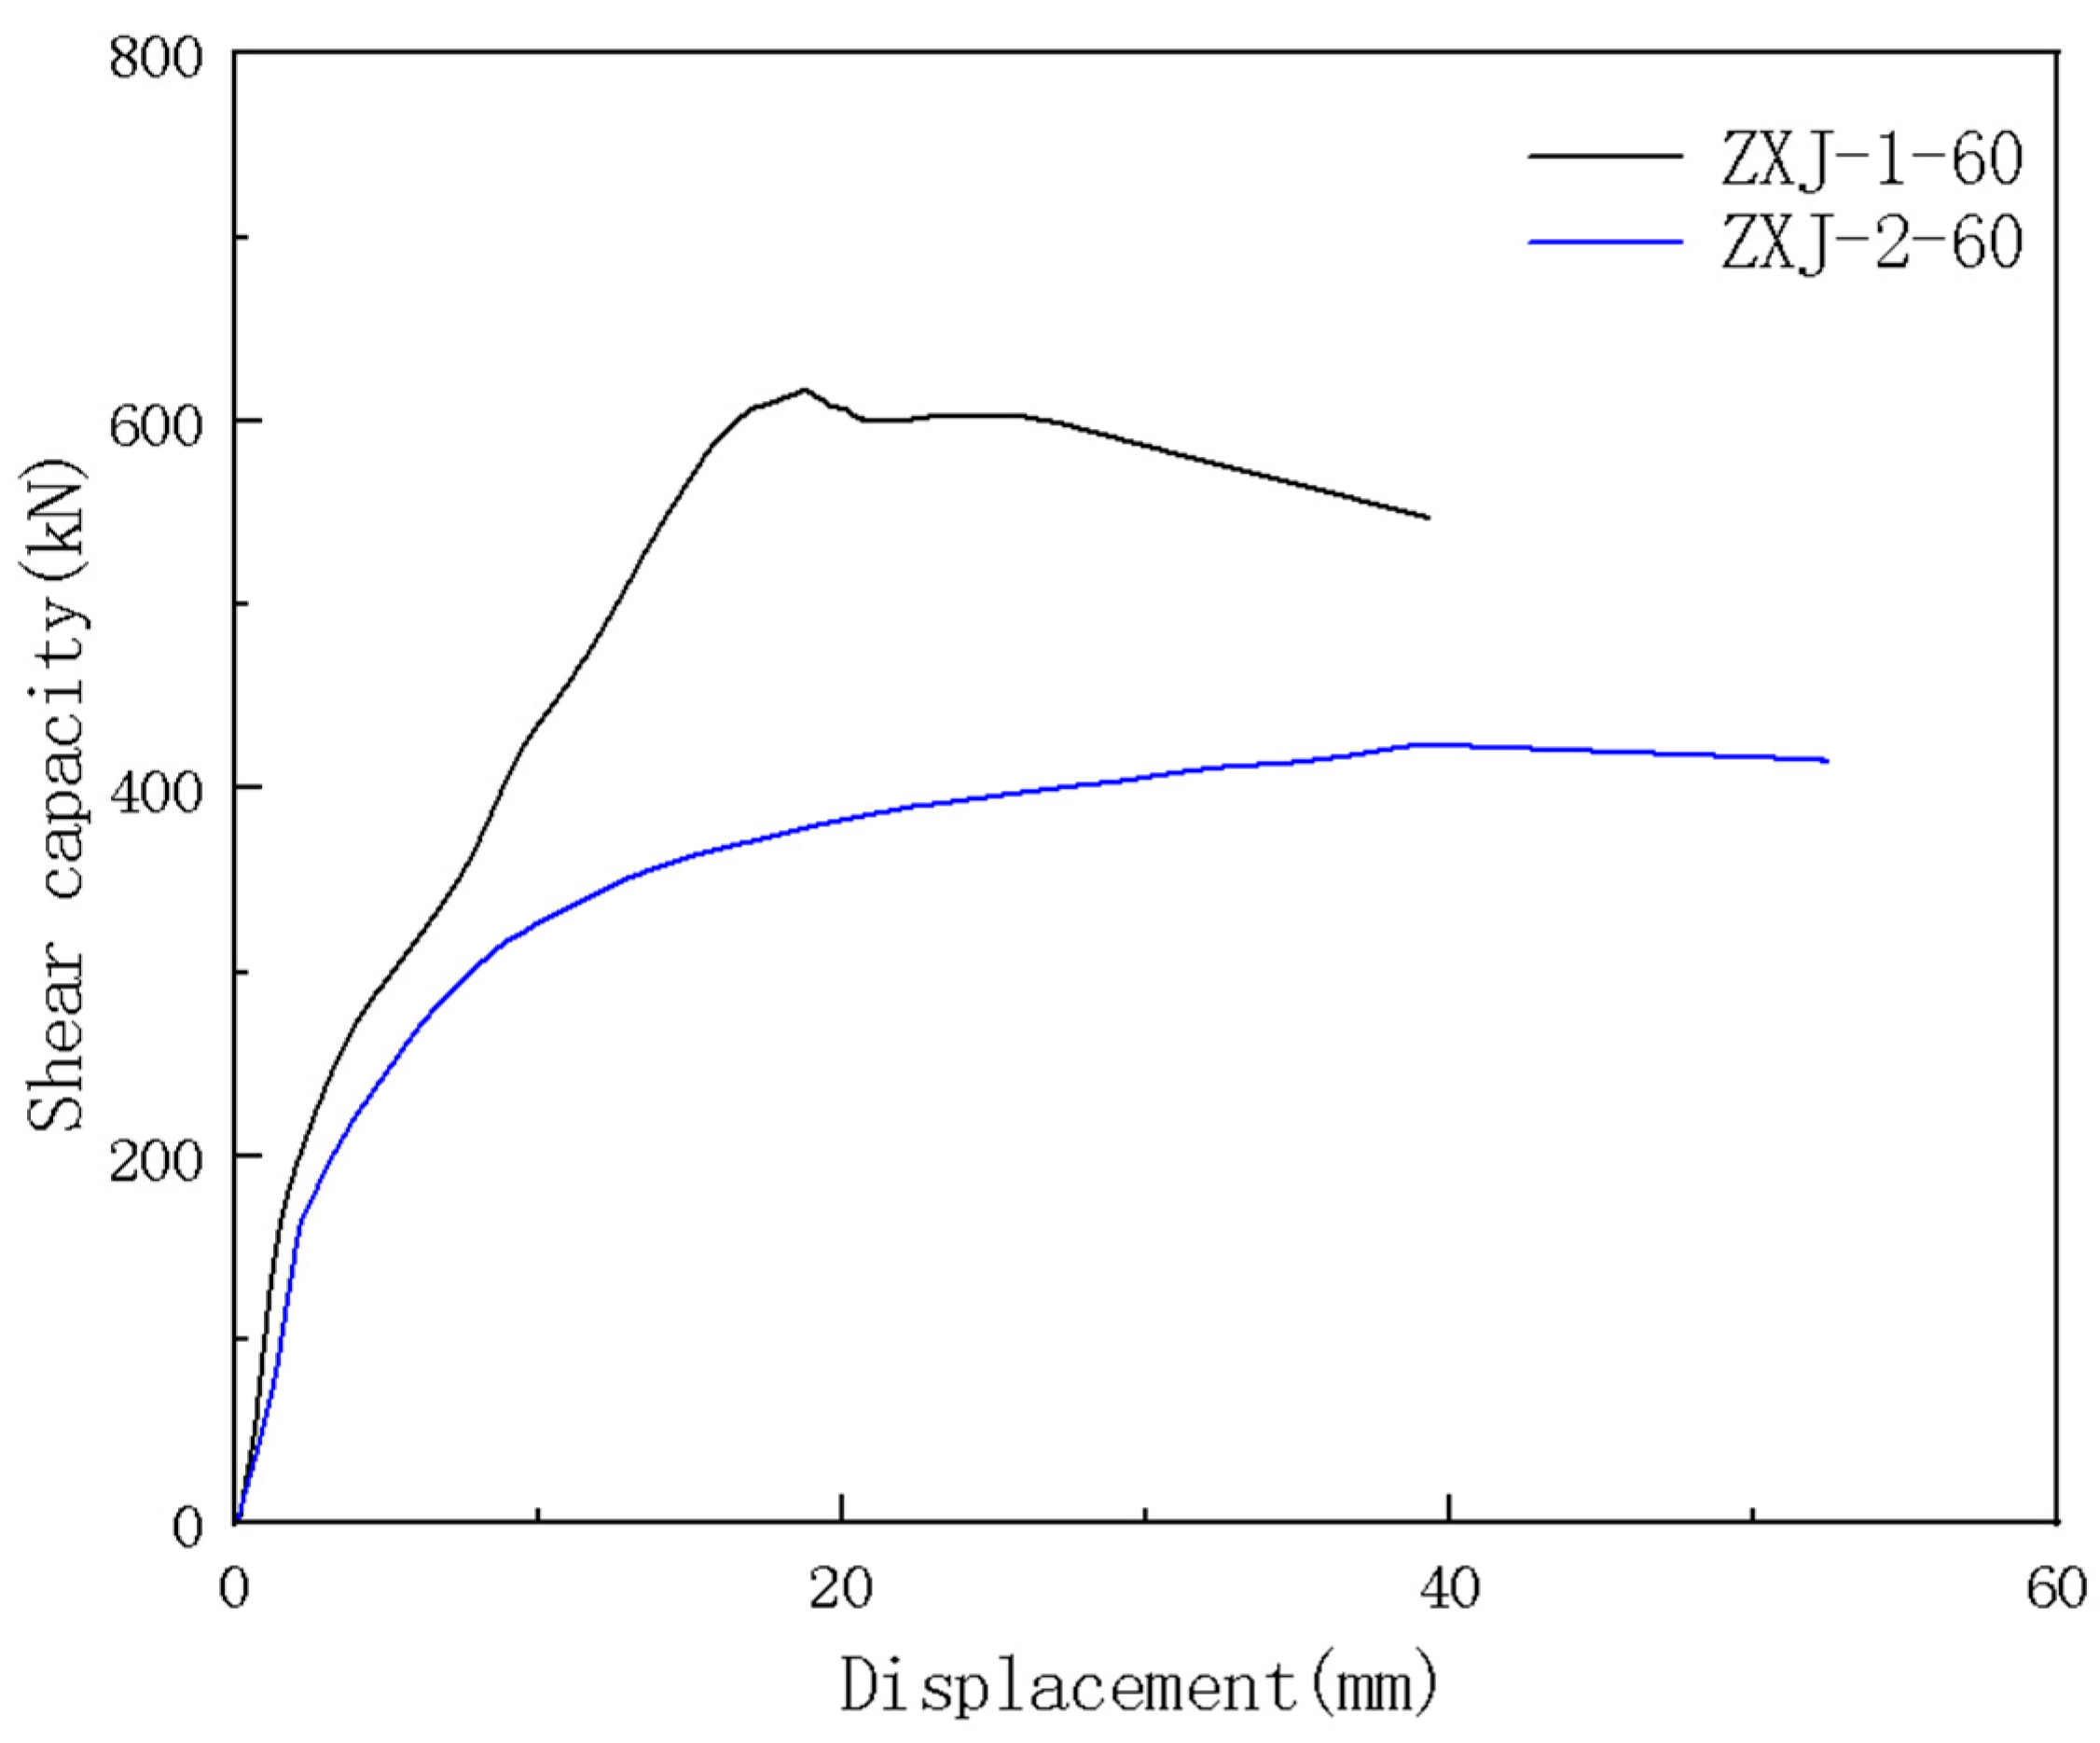
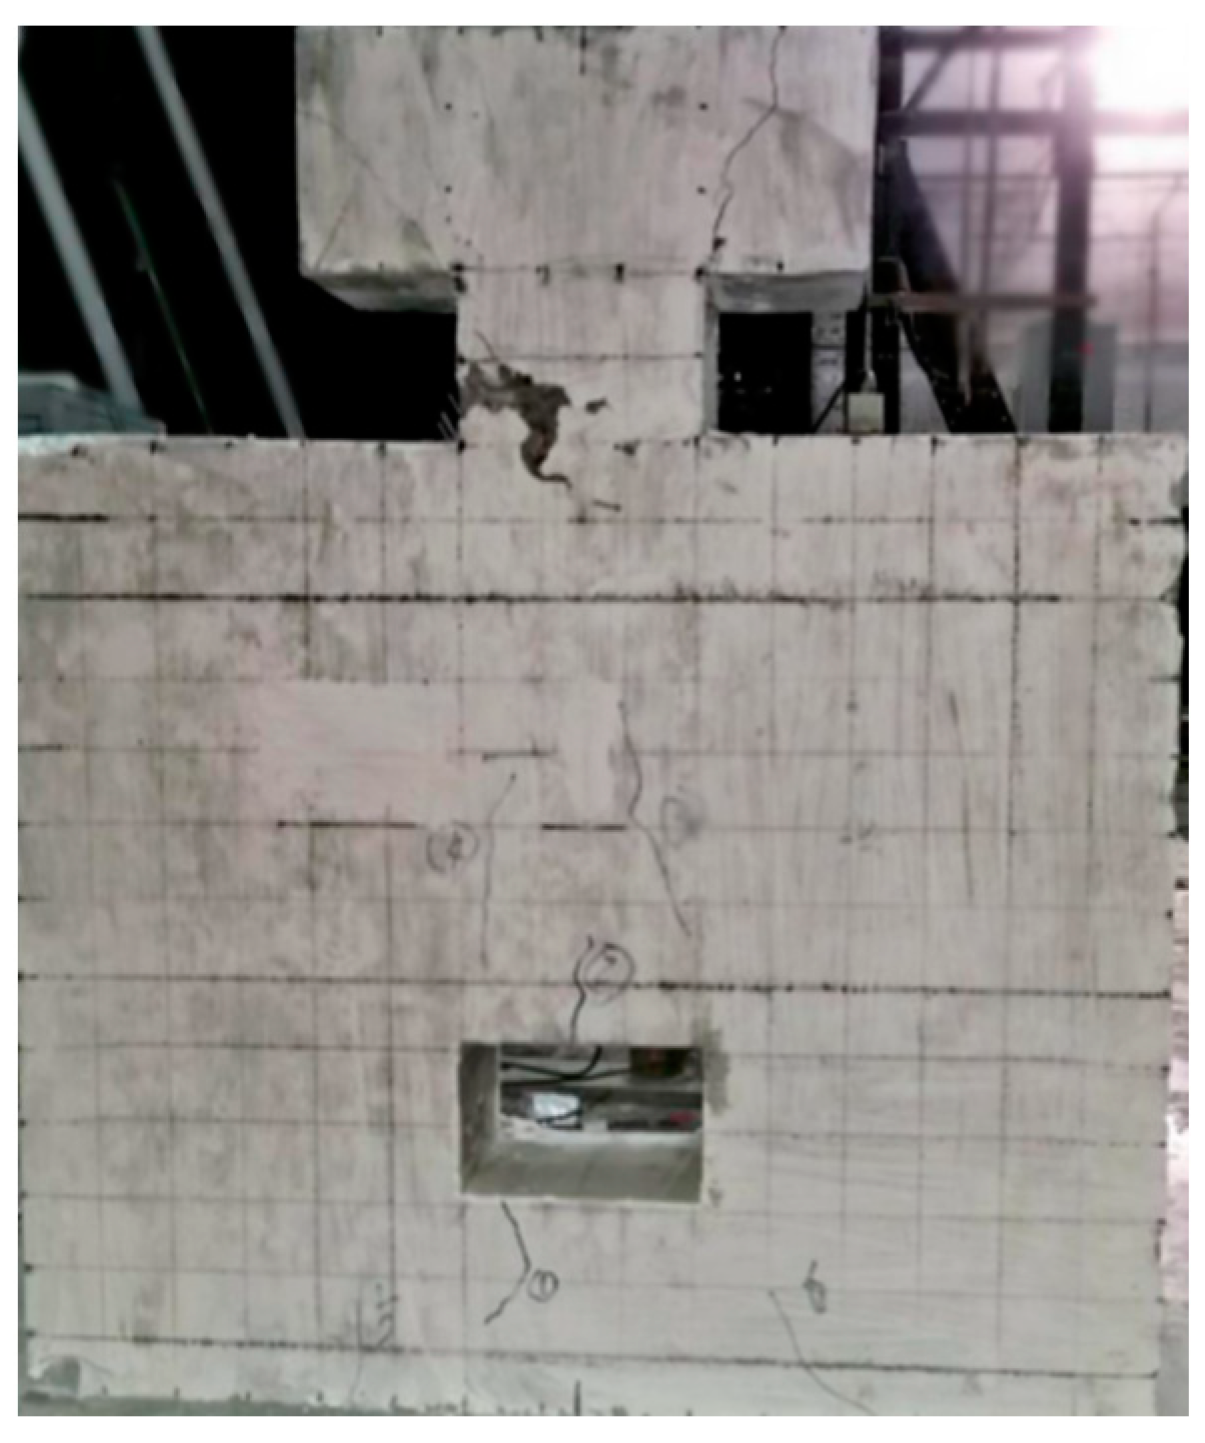
3.1.2. After Pouring Ordinary Concrete Specimens with Joint Surfaces without Keyways

Specimens ZXJ-2-60 and ZXJ-2-100 are constructed using standard concrete as the joint material. The bonding surfaces lack a keyway. However, the annular joint lengths differ between the specimens. The failure characteristics of each specimen are illustrated in Figure 8, while the load-displacement curves are presented in Figure 9.
The typical failure process observed in this group of specimens is characterized by the following sequence: Upon loading, multiple small cracks emerge on both sides of the interface between the new and old concrete. As displacement increases, these cracks progressively connect vertically and widen. Concurrently, spalling of the concrete at the joint surface occurs. At the peak load, the majority of the concrete at the joint surface exhibits significant spalling. The test concludes when the residual load stabilizes.
As shown in Figure 9, both the peak load and shear stiffness of specimen ZXJ-2-60 exceed those of test specimen ZXJ-2-100. This observation suggests that the shear capacity and shear stiffness of specimens cast with ordinary concrete, which lack a keyway on the joint surface, diminish as the binding length of the annulus increases. Furthermore, the absence of a descending section in the load-displacement curves for both specimens indicates that the shear failure of the bonding surface exhibits pronounced brittleness in the absence of a keyway.

3.1.3. Mechanism Analysis

In summary, the optimal performance in terms of shear capacity, stiffness, and ductility is achieved when the buckle length of the ring reinforcement is minimized, such as at 60 mm. This observation can be explained through the structural composition of the joint, as depicted in Figure 10. The joint primarily consists of three segments: the reinforcement skeleton (width b) created by the buckle of the ring reinforcement in the center, the concrete segment (width b1) extending from the edge of the reinforcement skeleton to the joint interface, and the keyway (width b2). The shear bearing capacity of the joint surface is derived from four main components: the friction force at the joint surface, the bite force of the keyway, the pin bolt force exerted by the reinforcement, and the shear capacity of the concrete within width b1. The critical role of the concrete within width b1 becomes evident under shear stress; it interacts with the pin bolt force from the ring reinforcement to enhance the joint’s shear capacity. Thus, the larger the b1 dimension, the more significant its contribution to the overall shear resistance. However, it is essential to maintain a balance, as excessively increasing b1 can diminish the integrity of the reinforcement skeleton (width b), thereby adversely affecting the joint’s shear performance.
When the buckle length of the ring reinforcement is maintained at 60 mm, the width b of the reinforcement skeleton occupies one-third of the total joint width. Consequently, the dimension b1, from the edge of the reinforcement skeleton to the joint interface, also measures 60 mm, mirroring the buckle length. With the retaining length of the U-shaped reinforcement held constant, larger buckle lengths reduce the size of b1. Therefore, in comparison to specimens with buckle lengths of 80 mm and 100 mm, the specimen with a 60 mm buckle length offers the most substantial contribution to shear resistance and enhances the shear ductility of the joint surface.

3.2. Effect of Post-Poured Concrete Type on Joint Shear Performance

Specimens ZHY-1-60 and ZXJ-1-60 are characterized by a joint length of 60 mm and a bonding surface featuring a keyway. However, they differ in the materials used for the joints following the pouring process. The failure modes observed in each specimen are illustrated in Figure 11. Additionally, the load-displacement curves for each specimen are presented in Figure 12.
The failure process of the post-cast epoxy concrete specimen ZHY-1-60 exhibits similarities to that of the post-cast ordinary concrete specimen ZXJ-1-60, as previously discussed. In the case of specimen ZXJ-1-60, spalling of the concrete was observed at the interface of the new and old concrete surfaces when the load reached 78.2% of the peak load. Following the attainment of the peak load, all cracks were identified at the interface, resulting in the crushing of the keyway concrete. Although neither specimen exhibited brittle failure during the testing process, the damage observed at the joint of the post-poured ordinary concrete specimens was notably more severe.
In Figure 12, the peak load of specimen ZHY-1-60 exhibits a substantial increase of 120% in comparison to specimen ZXJ1-60. However, the rate of decline in the curve and the overall trend remain relatively consistent between the two specimens. This observation suggests that the utilization of epoxy resin concrete as the material for joint pouring enhances the shear performance of the joint surface.

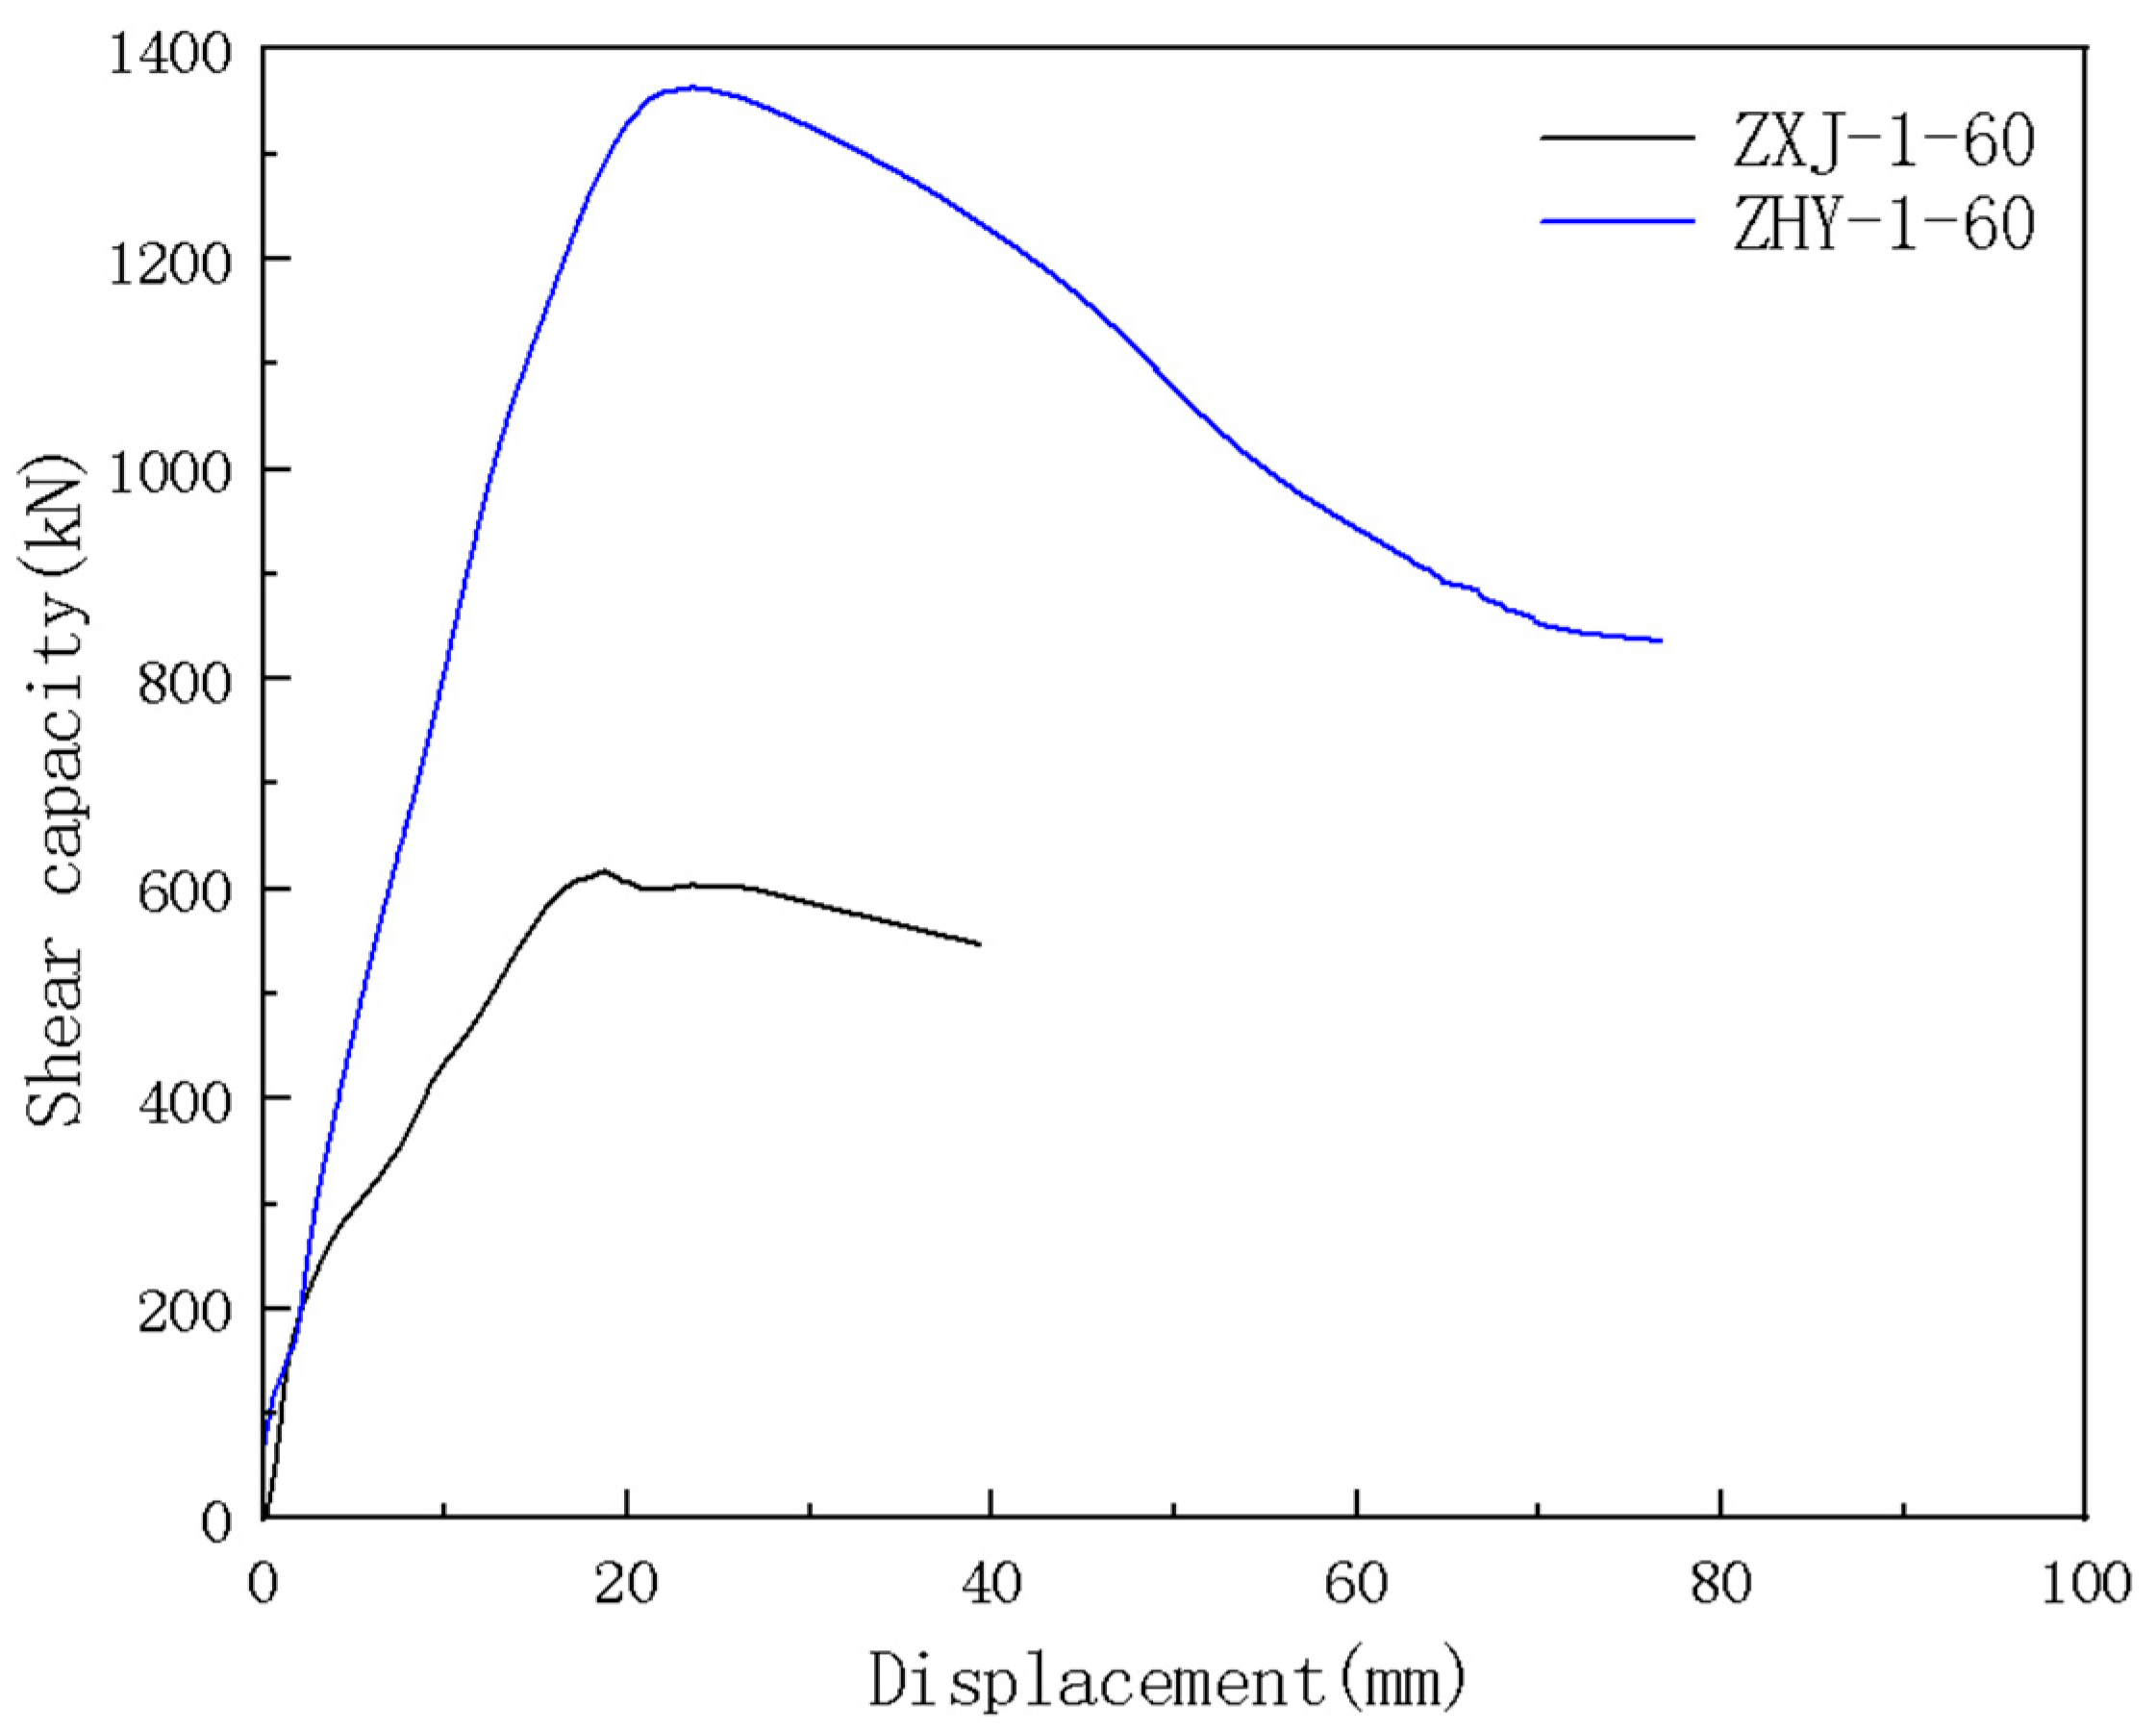
3.3. Effect of Keyway on Joint Shear Performance

Specimens ZXJ-1-60 and ZXJ-2-60 are characterized by a joint length of 60 mm and are constructed from ordinary concrete following the pouring process. However, these specimens differ in the design of the keyways incorporated into the joint surface. The failure conditions for each specimen are illustrated in Figure 13, while the corresponding load-displacement curves are presented in Figure 14.
As previously noted, during the initial loading of the ZXJ-2-60 specimen, which lacks a keyway on the bonding surface, penetrating cracks emerged at the interface between the old and new concrete, accompanied by spalling of the concrete at this junction. In contrast, during the loading process of the ZXJ-1-60 specimen, which features a keyway on the bonding surface, significant damage was observed at both the bonding surface of the old and new concrete and the keyway itself as the load and displacement increased. This observation suggests that the presence of the keyway is critical to enhancing the shear resistance of the bonding surface.
As shown in Figure 14, a comparison between specimen ZXJ-2-60 and specimen ZXJ-1-60, which incorporates a keyway, reveals a significant increase in both peak load and shear stiffness for the latter. Specifically, the peak load for specimen ZXJ-1-60 increased by 46.1%. The load-displacement curve for specimen ZXJ-2-60 does not exhibit a different decreasing section, suggesting that brittle shear failure occurs at the bonding surface in the absence of a keyway. Conversely, the presence of a keyway enhances the interlocking force between the prefabricated component and the cast-in-place element of the specimen, thereby improving the shear resistance of the bonding surface.

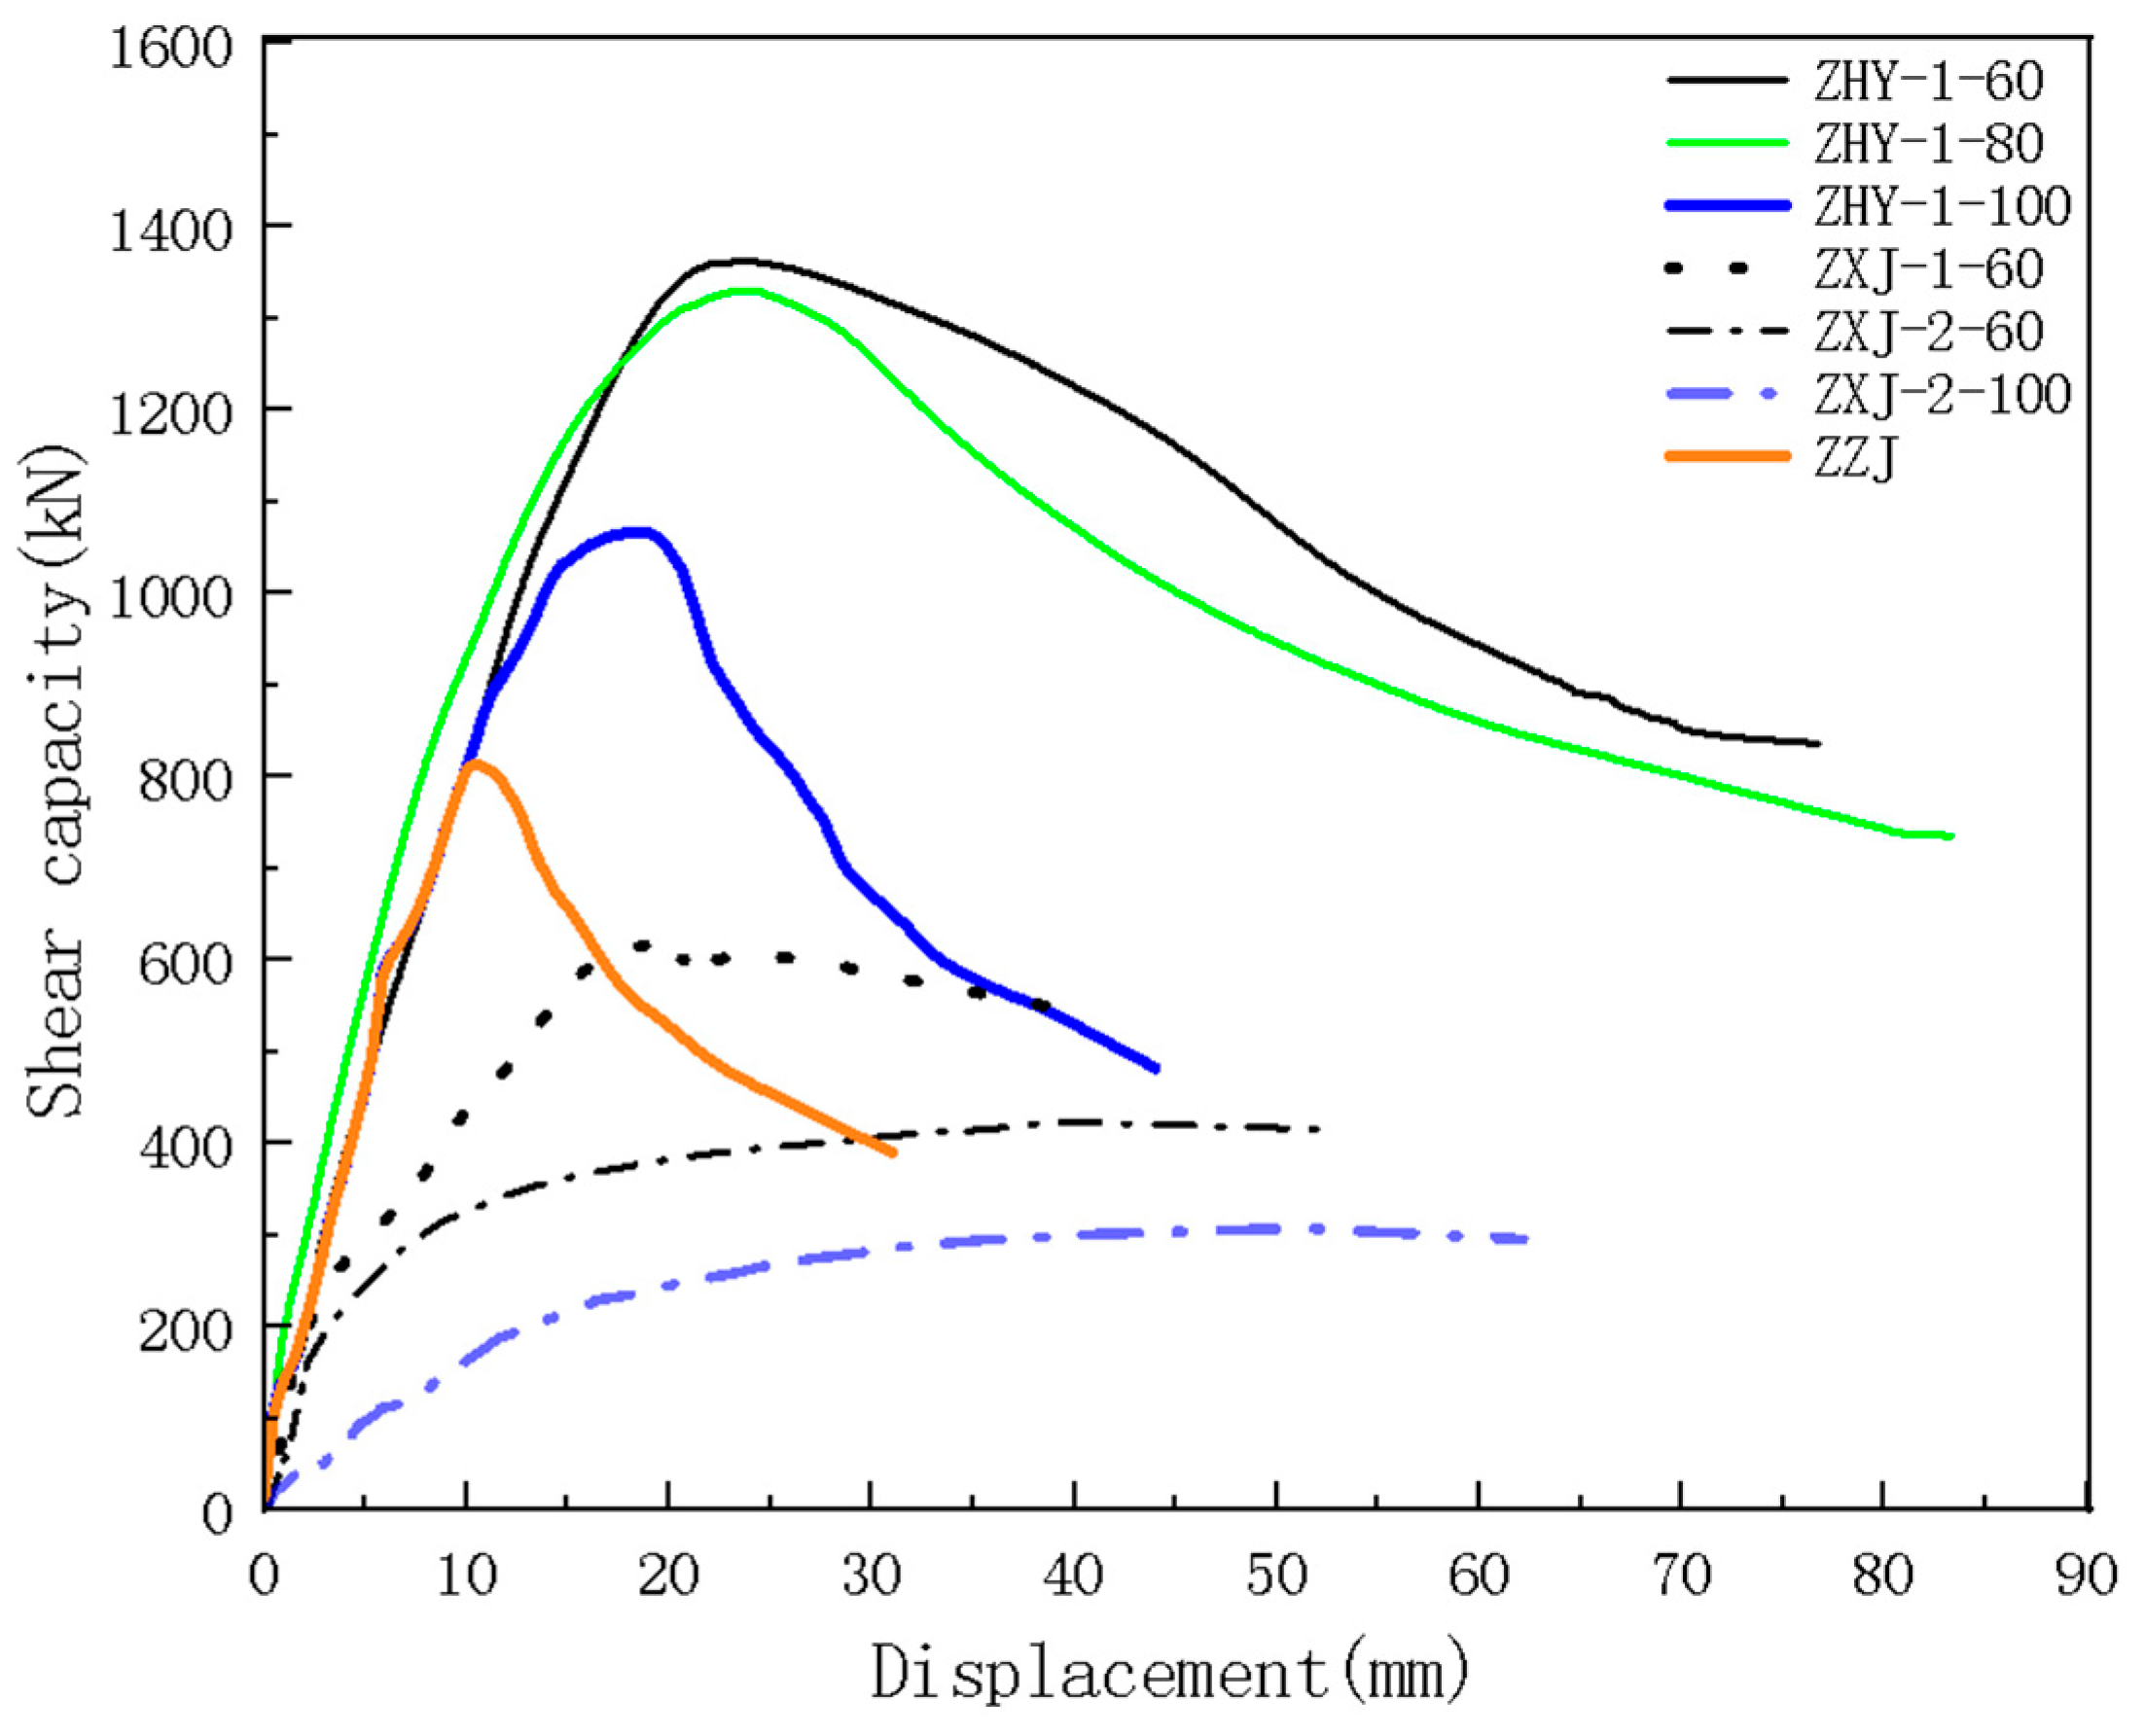
3.4. Comparison and Analysis of Monolithic Cast Specimen and Assembled Specimen

The damage condition of the entire pouring specimen ZZJ is illustrated in Figure 15. A comparison of the load-displacement curves for all specimens is presented in Figure 16, while the characteristic point data corresponding to these curves are provided in Table 2.
Due to the in situ casting of specimen ZZJ, which exhibited commendable integrity, the failure during loading was not localized to the two shear planes. Upon the initiation of loading, cracks emerged in the lower right corner of the specimen. As the load increased, vertical cracks developed in proximity to the shear plane, resulting in the crushing and spalling of the concrete at the neck of the specimen. When the load decreased to 44.7% of the peak load, the displacement surpassed 10 times the cracking displacement, and the residual load stabilized, marking the conclusion of the test.
In Figure 16 and Table 2, the following results can be summarized:
(1)
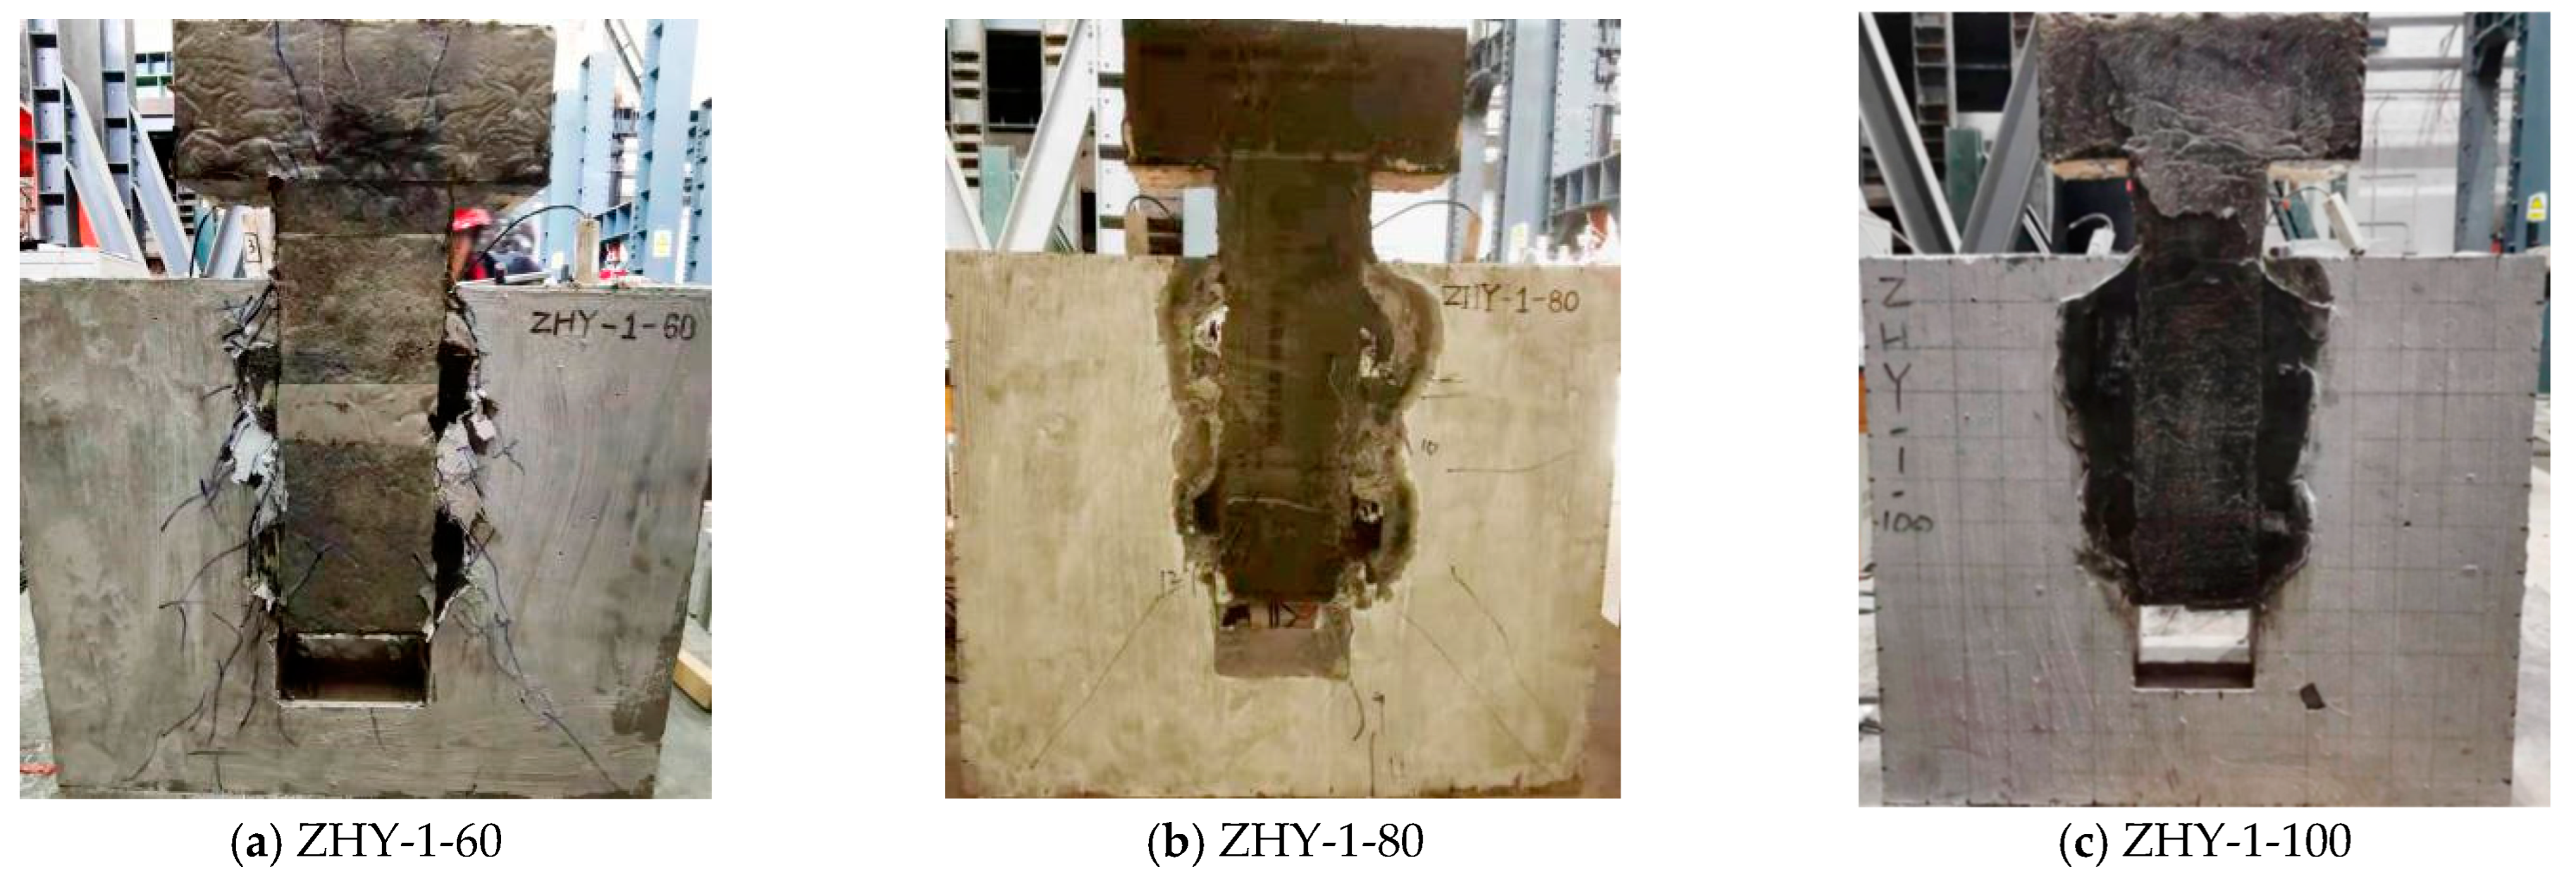
The shear stiffness of the test specimen featuring a keyway and poured epoxy resin concrete at the joint is comparable to that of the entire poured test specimen. However, the shear strength of the test specimen exceeds that of the complete poured test specimen. Specifically, the shear strength of the specimen with a buckle length of 60 mm exhibits an increase of 70%, while the specimen with a buckle length of 80 mm shows an increase of 59%. Furthermore, specimens with a bonding length of 100 mm demonstrate an improvement of 32%. These results suggest that the incorporation of keyways on the bonding surface, along with the use of epoxy resin concrete as a joint material, are effective strategies for enhancing the shear resistance of the interface between new and old concrete. Additionally, it is recommended that the bonding length of the ring reinforcement not exceed a certain limit, ideally being approximately one-third of the total width of the horizontal joint.
(2)
The shear stiffness and shear bearing capacity of the post-poured ordinary concrete specimens at the joint are lower than those of the fully poured specimens. Specifically, the shear bearing capacity of the specimens featuring a keyway decreases by 23%, while the specimens without a keyway and with a rib length of 60 mm exhibit a decrease of 47%. Furthermore, the specimens with a rib length of 100 mm demonstrate a reduction of 62%. This indicates that an increase in buckle length adversely affects the shear performance of the joint surface, assuming a constant retaining length of the annulus. Additionally, the load-displacement curve for the test specimen without a keyway does not exhibit a different decreasing section; rather, it shows a prolonged peak load holding time and significant shear displacement. This suggests that the shear resistance of the joint surface is predominantly attributed to the pin force provided by the reinforcement at the joint surface. Upon the loss of this pin force, the bearing capacity experiences an immediate decline from the peak value, thereby illustrating the brittle property of shear failure.

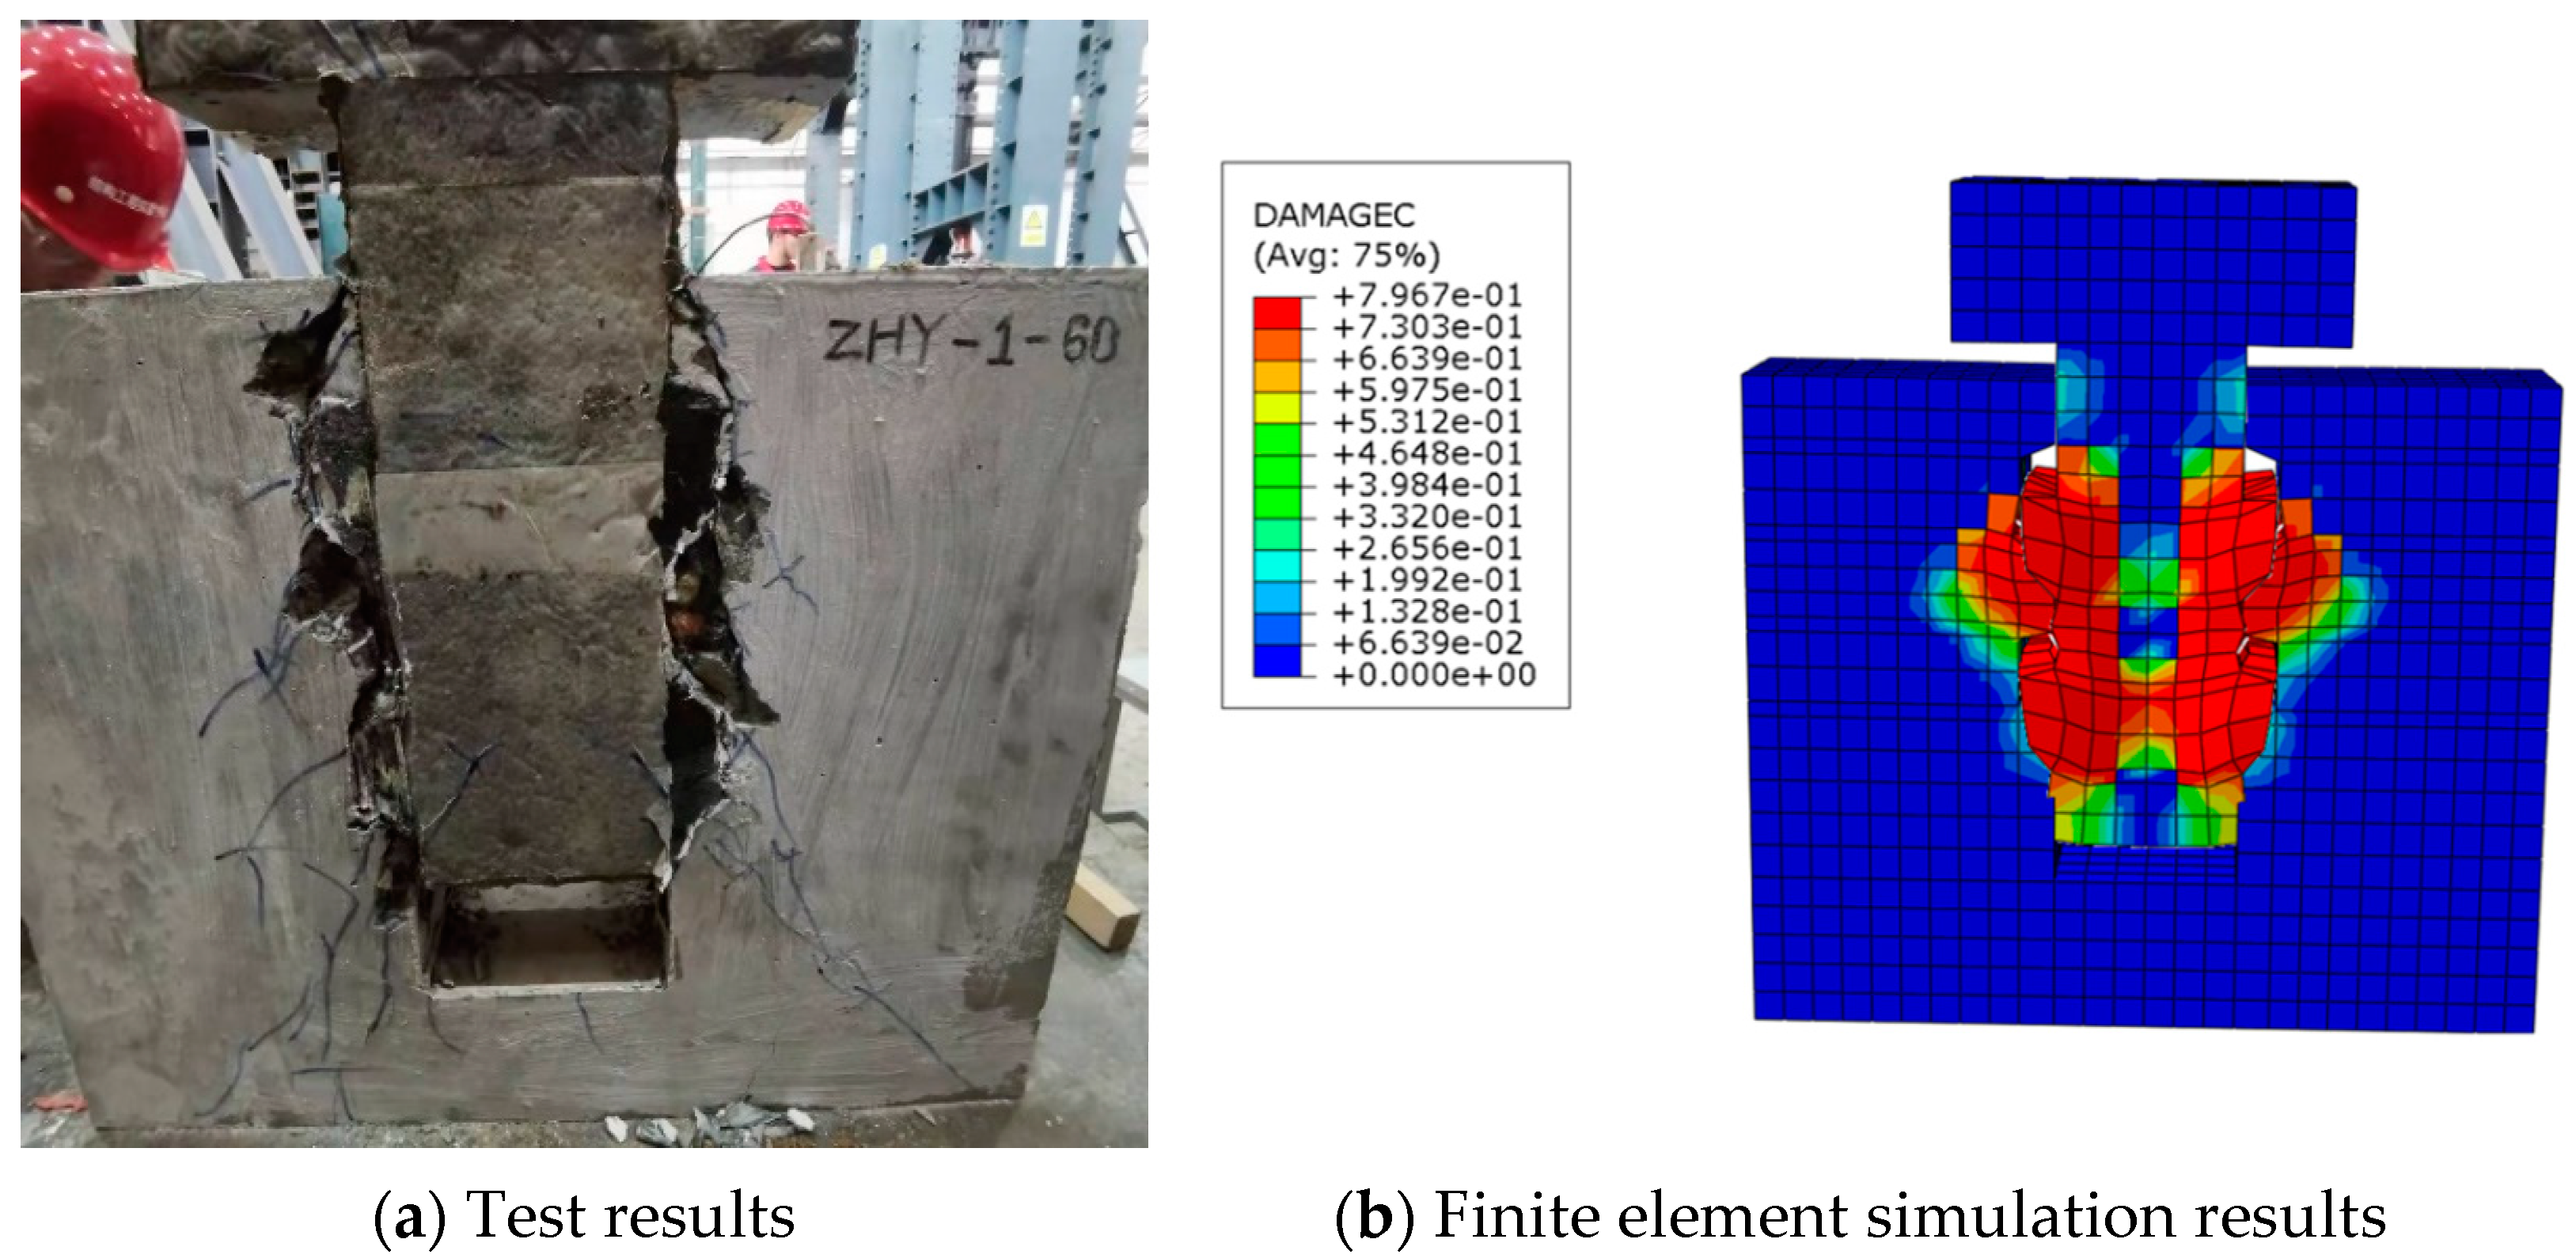
4. Development and Verification of Finite Element Model

4.1. Material Constitutive Model

The finite element model was developed and analyzed using ABAQUS software. A plastic damage model was employed for the concrete material. The uniaxial stress-strain curve recommended in “Code for Design of Concrete Structures” (GB 50010-2010) [28] was utilized as the constitutive relationship for ordinary concrete. For epoxy resin concrete, the constitutive relationship is represented by the complete stress-strain curve equation, which was fitted in this study based on prior experimental results (Equation (1)). The stress-strain behavior of the rebar is modeled using a double broken-line approach:
y = a x + ( 4.9 4.23 a ) x 2 + ( 4.67 + 6.67 a ) x 3 + ( 0.27 4.74 a ) x 4 + ( 1.07 + 1.27 a ) x 5 , 0 x 1 x b ( x 1 ) 2 + x , x > 1
where a and b are the undetermined parameters, which can be determined as follows:
0 < a < 1.0 1.0 < b < 10.0
where a is set as 0.7 and b is set as 7.0 in this study.

4.2. Model Establishment

A finite element model of the typical specimen ZHY-1-60 has been established as shown in Figure 17. The solid element type C3D8R is employed for both epoxy concrete and ordinary concrete, while 2D truss element type T2D2 is utilized for the reinforcement bars. Structured grid technology is implemented to discretize the mesh. Referring to the numerical modeling of perforated composite materials by Khan et al. [29] and others, achieving more accurate results necessitates a reduction in the mesh size around the keyway. Consequently, the mesh size at the keyway is determined to be 15 × 35 mm, whereas the remainder of the mesh is set at 30 × 35 mm, and the mesh size for the reinforcement is standardized at 30 mm. A surface-to-surface contact model is adopted to simulate the interfacial contact between precast concrete and post-cast concrete. The normal interaction is governed by a “hard contact”, while the tangential interaction is modeled using the Coulomb friction model, with a friction coefficient of 0.6 [15].
The boundary conditions of the model align with those established by the test. Specifically, the bottom of the component is designated as a fixed constraint, while the center point of the top surface of the loading beam serves as the reference point for controlling vertical displacement during loading. Additionally, a coupling method is employed to mitigate stress concentration throughout the loading process.

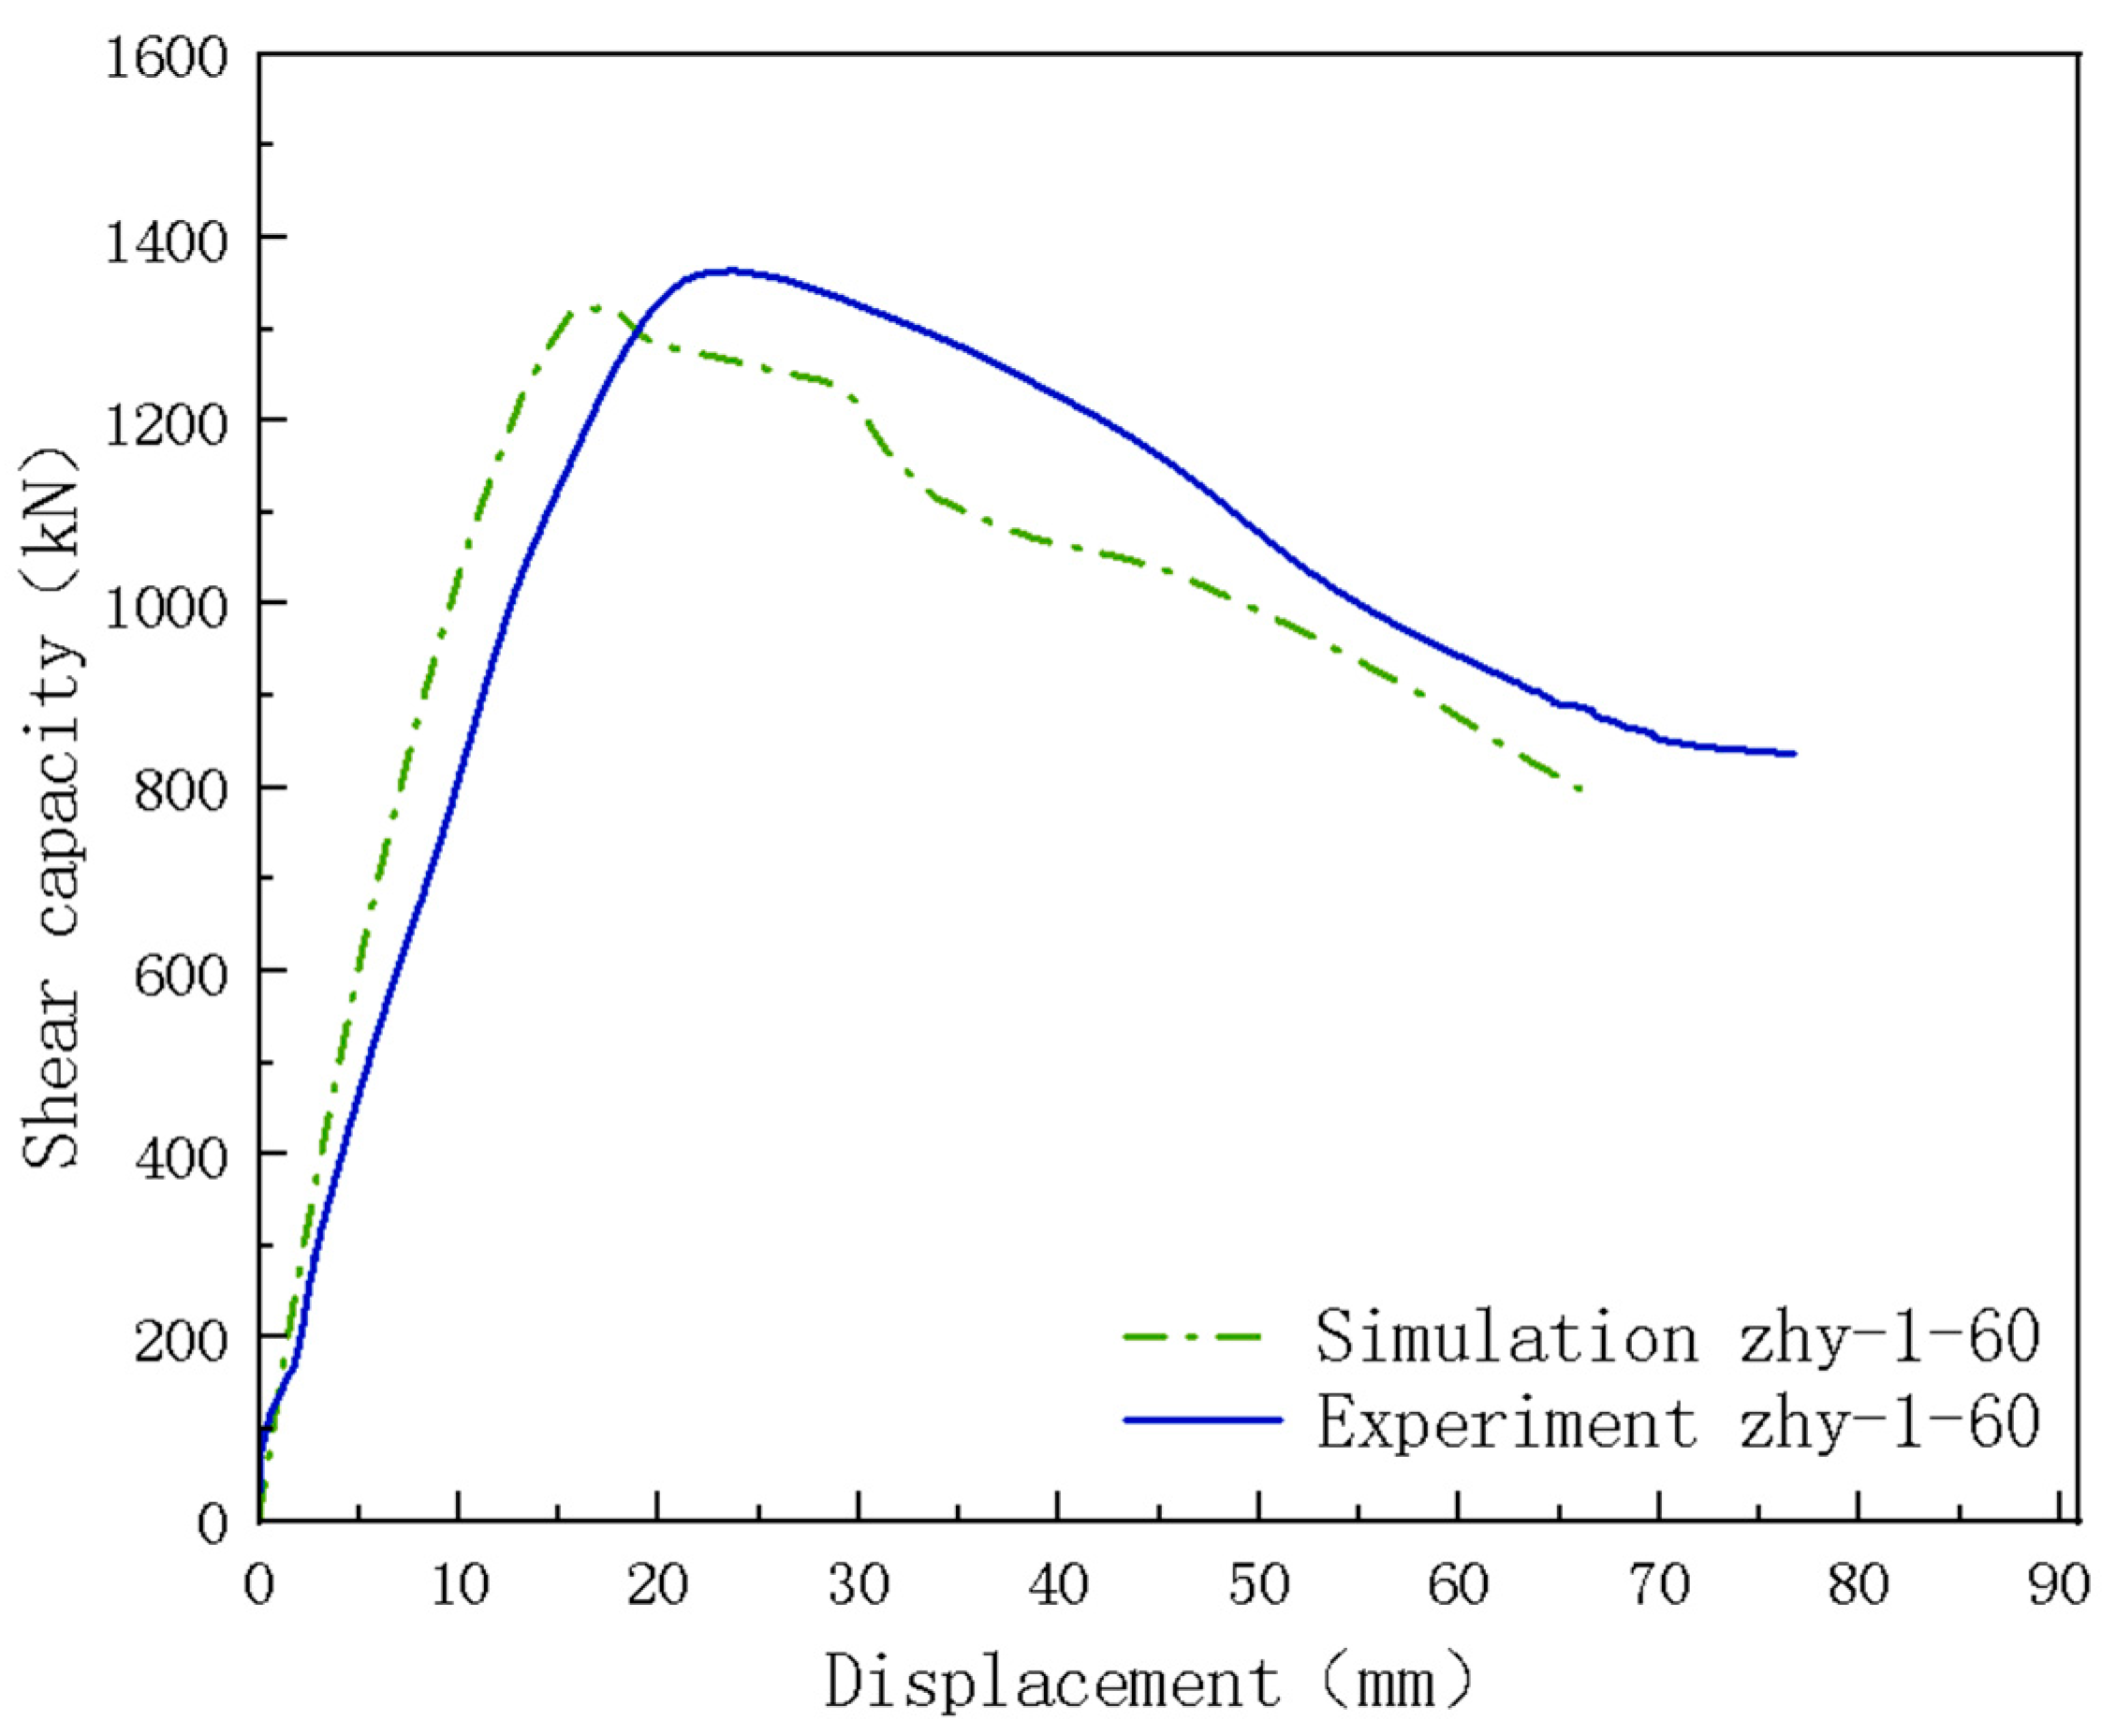
4.3. Verification of Model

Figure 18 presents a comparative analysis of the experimental results and finite element simulations regarding the failure morphology of the ZHY-1-60 specimen. As shown in Figure 18b, the distribution of concrete compression damage factors is employed to approximate the model’s failure. Both the experimental data and the finite element simulations indicate that the damage is predominantly concentrated in the keyway. As displacement increases, the damage at the root of the keyway progressively extends along the bonding surface until the damaged surface becomes interconnected, resulting in the severance of the key teeth.
Figure 19 depicts a comparison between the test results and the finite element simulation results for the load-displacement curve of specimen ZHY-1-60. The overall trend of the curve exhibits a similar pattern, and the discrepancies between the two sets of results fall within an acceptable range.
In summary, the modeling approach presented in this paper demonstrates the capability to effectively simulate the shear behavior of direct shear specimens.

5. Finite Element Analysis of Factors Affecting Horizontal Joint Shear Performance

A finite element variable parameter analysis was conducted using specimen ZHY-1-60. Following the modification of four parameters (e.g., the grade of precast concrete, the reinforcement ratio of the horizontal joint annulus, the reinforcement ratio of the horizontal joint insertion, and the horizontal binding force), a total of 17 finite element models were developed across four groups. The parameters of the test specimens are outlined in Table 3.

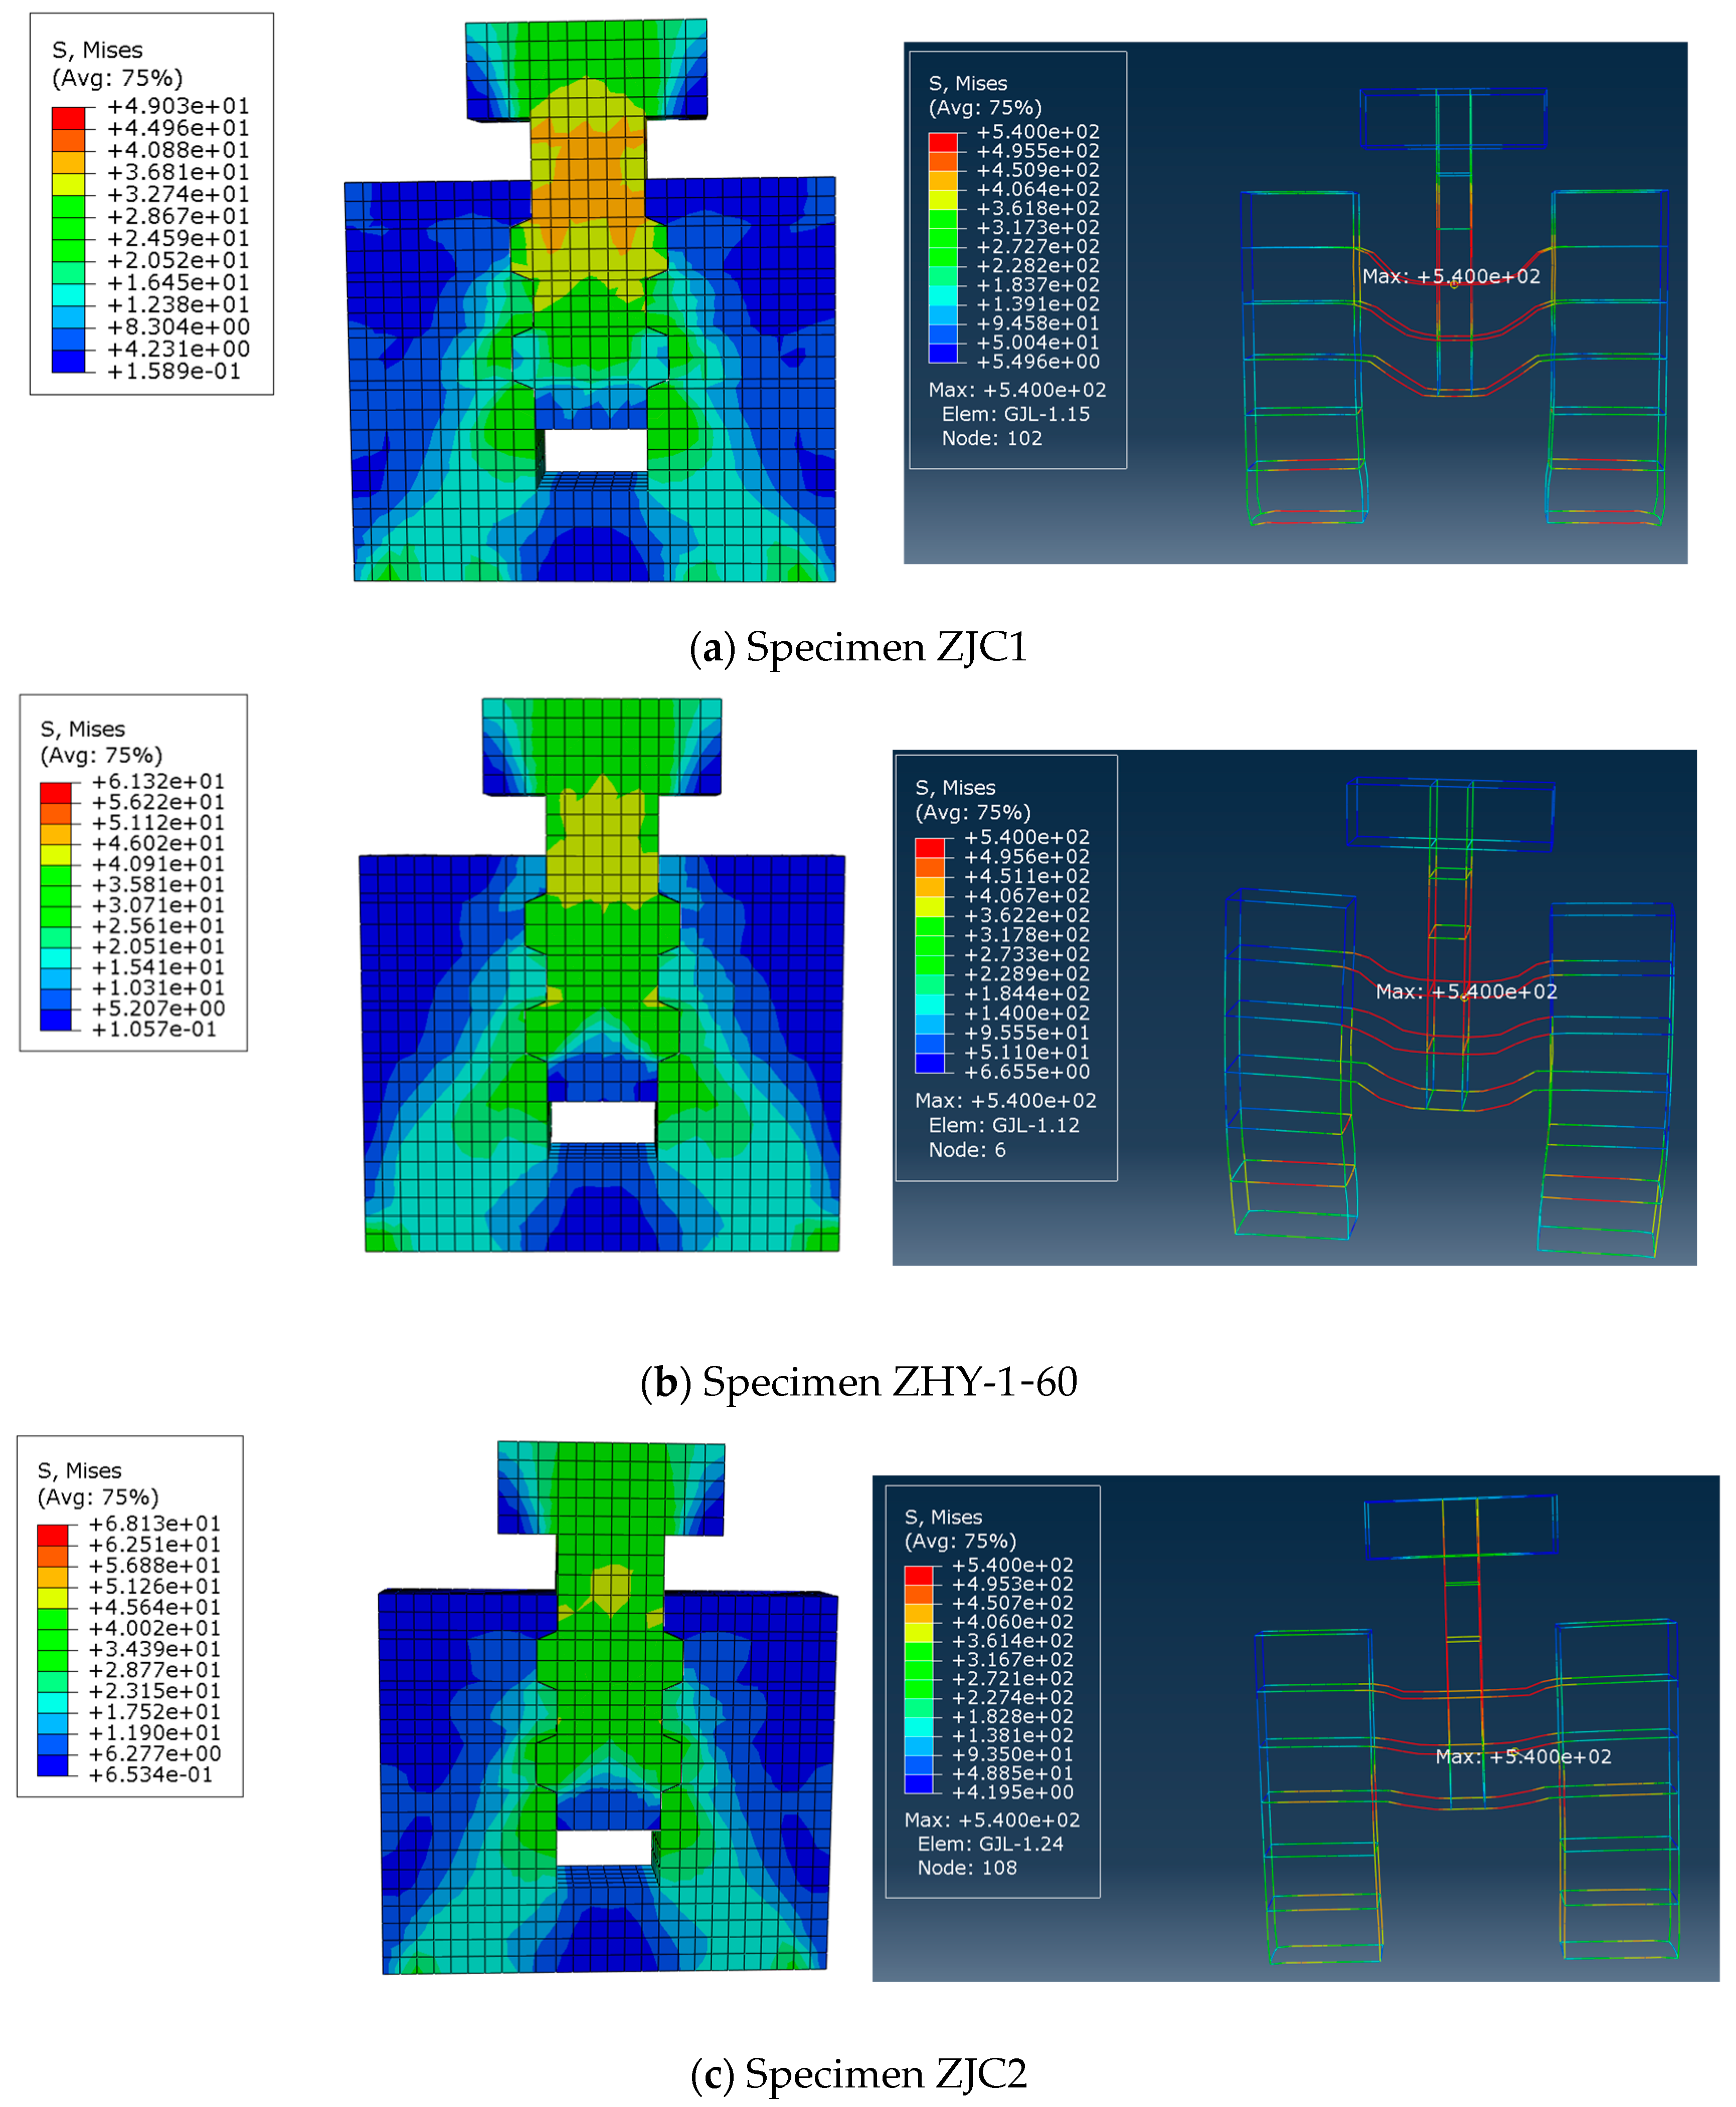
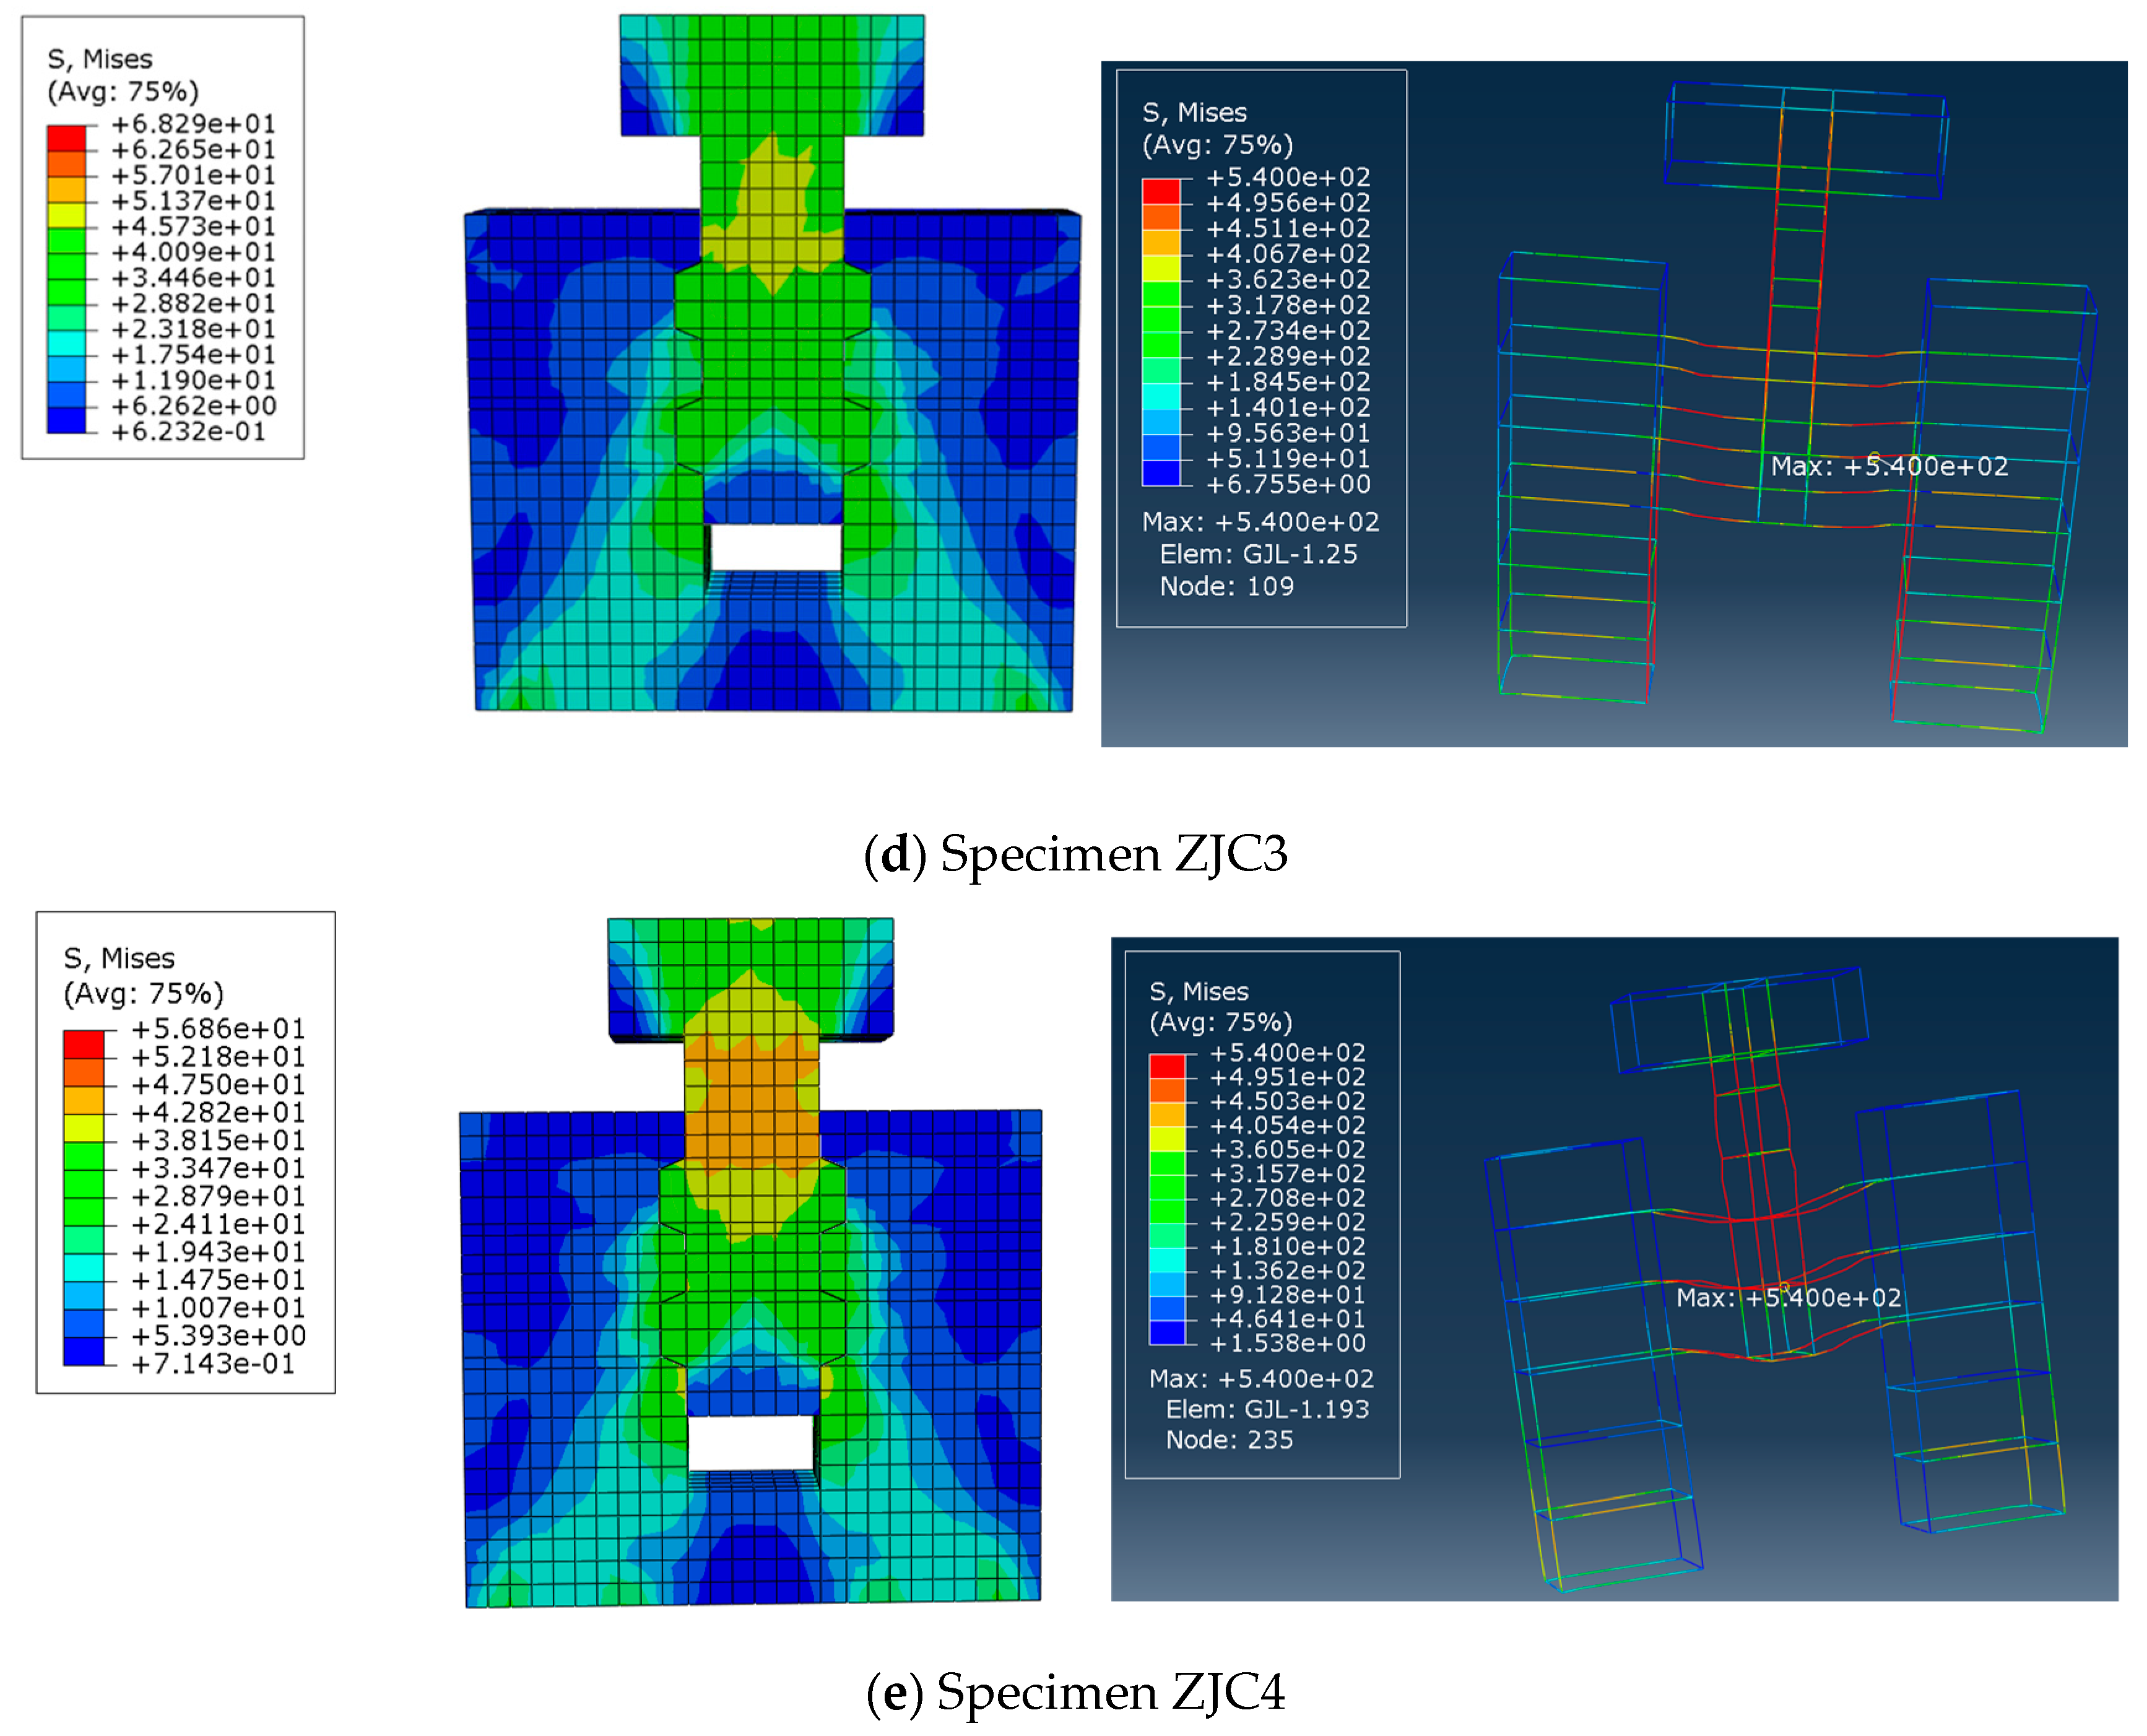
5.1. Effect of Precast Partial Concrete Strength

Finite element models ZJC1, ZHY-1-60, ZJC2, ZJC3, and ZJC4 were developed utilizing precast concrete with strength grades of C30, C40, C50, C60, and C70, respectively (Table 3). This study examines the effect of the strength of precast concrete on the shear performance of horizontal joints. Notably, the strength grade of the precast concrete in model ZHY-1-60 is approximately equivalent to C40. Figure 20 illustrates the stress distribution across the concrete and steel reinforcement of each specimen, while Figure 21 depicts the relationship between the strength of precast concrete and the shear capacity of the joints.
As illustrated in the concrete stress distribution cloud map in Figure 20, the keyway serves as a critical shear element of the bonding surface, exhibiting an increase in stress value corresponding to the enhancement of concrete strength. This phenomenon underscores the keyway’s effectiveness in shear resistance. However, when the strength of the precast concrete reaches C70, the stress value decreases. Analysis of the stress distribution nephogram for reinforcement, along with the distribution of maximum stress points, reveals substantial stress at the joint interface between new and existing concrete. This indicates that the ring reinforcement plays a vital role in shear resistance by exerting a pin bolt force. This force is subsequently transmitted to the surrounding concrete through the embedded effect of the ring reinforcement, enhancing the shear resistance of the overall structure and ensuring effective bonding between the new and old concrete. Additionally, the stress concentration in the upper part of the horizontal joint dowel bar and the lower part of the vertical reinforcement on both sides of the horizontal joint is significant, forming a force transmission pathway from the loading end to the dowel bar, then to the ring reinforcement, and finally to the vertical reinforcement of the prefabricated wall. Thus, to ensure adequate shear resistance at horizontal joints, the reinforcement quantity of dowel bars, ring bars, and longitudinal reinforcement in prefabricated walls adjacent to horizontal joints should not be minimal.
In Figure 21, an increase in the strength grade of precast concrete from C30 to C40 results in a 15.4% enhancement in interfacial shear resistance. Subsequently, when the strength grade is elevated from C40 to C50, the shear resistance improves by 6.4%. Further increases from C50 to C60 yield a 4.7% rise in shear resistance, while an increase from C60 to C70 leads to a decrease of 7.5% in shear resistance. These results suggest that the specimen’s performance is optimized when the strength of the post-cast epoxy concrete closely matches that of the precast concrete, particularly within the C40 to C60 range. This phenomenon can be attributed to the equal interaction capacity of the new and old concrete at the joint surface, which includes shear bond characteristics, thereby resulting in the most favorable overall performance.

5.2. Effect of Horizontal Joint Annulus Reinforcement Ratio

Finite element models ZJH1, ZHY-1-60, ZJH2, ZJH3, and ZJH4 (Table 3) were developed utilizing horizontal joint annulus diameters of 6 mm, 8 mm, 10 mm, 12 mm, and 14 mm, respectively. This study explored the effect of the reinforcement ratio (diameter) on the shear performance of horizontal joints. The load-displacement curves for each specimen are presented in Figure 22, while Figure 23 illustrates a comparison of the shear capacities of the specimens.
In Figure 22, an increase in the reinforcement ratio (diameter) of the annulus significantly enhances the shear capacity of the joint surface. Nonetheless, when the reinforcement ratio reaches 1.54% (diameter 14 mm), there is a notable decrease in the specimen’s ductility. This reduction may be attributed to the excessive reinforcement ratio and diameter, which over-constrain the concrete at the keyway and lead to stress concentration in the local area, particularly at the keyway. This stress concentration tends to diminish the overall deformation energy of the concrete and increases the risk of brittle failure. Despite the relatively high shear bearing capacity at this reinforcement level, the ductility performance is markedly compromised. Based on the findings of this study and relevant standards, it is recommended that the diameter of the ring reinforcement be limited to 12 mm.
As shown in Figure 23, an increase in the diameter of the annulus from 6 mm to 14 mm resulted in corresponding increases in the shear strength of each specimen, specifically by 6.9%, 7.2%, 6.5%, and 4.8%, respectively. This trend indicates an initial increase in shear strength followed by a subsequent decrease. Furthermore, the ductility of the joint diminishes when the reinforcement ratio of the ring reinforcement is excessively high. Consequently, for practical design considerations, it is advisable to select a ring diameter ranging from 10 mm to 12 mm, which corresponds to a reinforcement ratio of 0.79% to 1.13%, as this range is more appropriate.

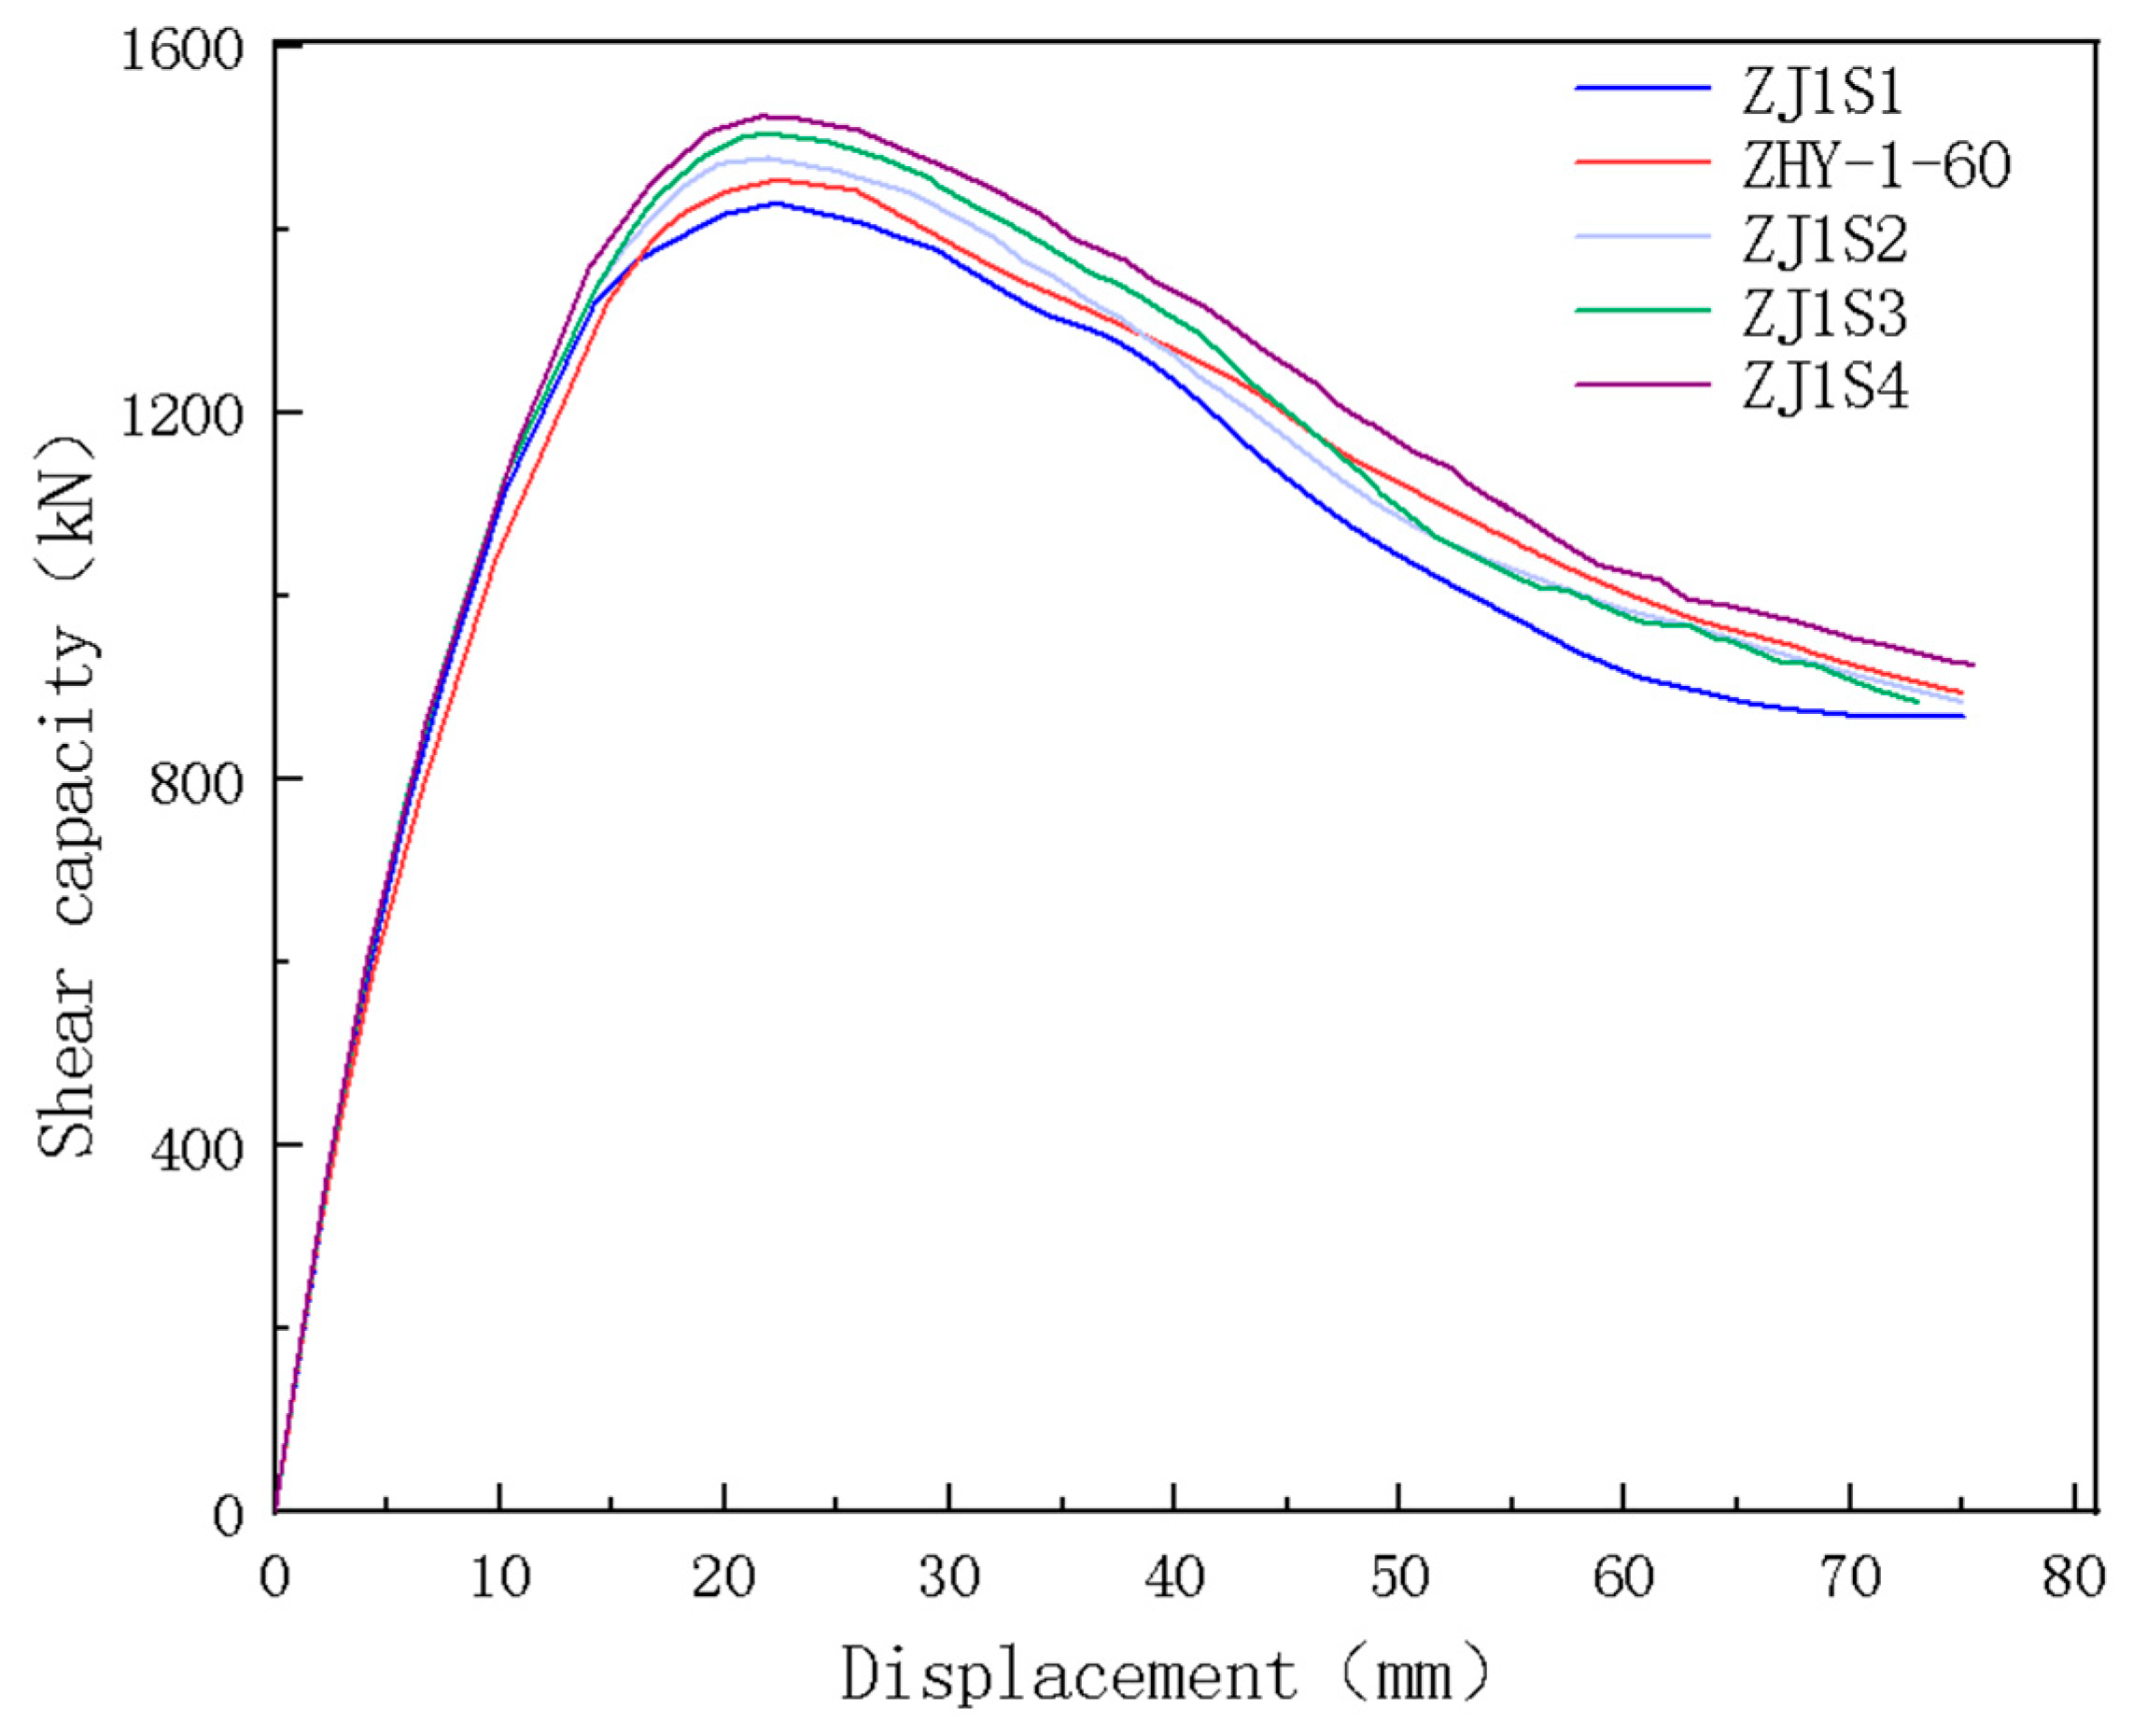
5.3. Effect of Horizontal Joint Insertion Reinforcement Ratio

The insert bar is defined as a long steel bar that traverses the U-shaped closed sleeve. The presence of the insert bar facilitates the buckle connection of the ring reinforcement within the prefabricated wall, thereby forming a concealed beam with a rectangular cross-section. This configuration contributes to the enhancement of structural integrity and reliability. Finite element models, designated as ZJS1, ZHY-1-60, ZJS2, ZJS3, and ZJS4 (Table 3), were developed using insert bar diameters of 6 mm, 8 mm, 10 mm, 12 mm, and 14 mm, respectively. This study investigates the effect of the reinforcement ratio (diameter) of the insert bar on the shear resistance of horizontal joints. The load-displacement curves for each test specimen are presented in Figure 24, while Figure 25 illustrates a comparative analysis of the shear capacities of the various specimens.
As shown in Figure 24 and Figure 25, an increase in the reinforcement ratio (diameter) of the insert bars correlates with an enhancement in the shear capacity of the joint surface for each specimen. However, the extent of this improvement is limited. Specifically, when the diameter of the insert bar is increased from 6 mm to 14 mm, the shear capacity each specimen exhibits increases by 1.8%, 1.6%, 1.8%, and 1.0%, respectively. This indicates that joint reinforcement has a minimal effect on the shear capacity of the joint surface. Consequently, when selecting the diameter of the insert bar in practical design applications, it is sufficient to meet the fundamental structural requirements or to utilize the same diameter as that of the prefabricated wall. There is no necessity to increase the diameter of the insert bar to enhance the bearing capacity of the joint surface.

5.4. Effect of Horizontal Binding Force

The horizontal joint of a precast shear wall experiences vertical compressive stress during its operational phase, and the magnitude of this stress significantly impacts the performance of the horizontal joint. To simulate vertical compressive stress, horizontal binding forces of 0 kN, 100 kN, 200 kN, 300 kN, 400 kN, and 500 kN were applied to the side of the model, corresponding to axial compression ratios of 0.09, 0.17, 0.26, 0.35, and 0.44, respectively. Finite element models designated as ZHY-1-60, ZJF1, ZJF2, ZJF3, ZJF4, and ZJF5 were developed to examine the effect of vertical compressive stress on the shear performance of horizontal joints. Figure 26 illustrates the load-displacement curves for each specimen under varying binding forces, while Figure 27 presents the peak load diagrams for each specimen at different binding force levels.
As shown in Figure 26 and Figure 27, an increase in lateral horizontal constraint correlates with an enhancement in the initial elastic modulus and shear capacity of the specimens. Conversely, the peak displacement and ductility exhibit a decline. Specifically, when the horizontal restraint force is elevated from 0 kN to 500 kN, the shear capacity of each specimen increases by 2.4%, 3.7%, 5.2%, 4.0%, and 0.9%, respectively. Notably, in comparison to specimen ZJF4, which has a horizontal constraint of 400 kN, the bearing capacity of specimen ZJF5, subjected to a horizontal constraint of 500 kN, shows minimal improvement. Furthermore, the shear capacity of specimen ZJF5 decreases significantly after reaching the peak load. This suggests that while increased horizontal constraint offers limited enhancements in bearing capacity, it may also lead to rapid degradation post-peak load. Engineering standards and requirements recommend controlling the maximum axial compression ratio to 0.5.

6. Conclusions

In this study, epoxy resin concrete was utilized as the post-cast material. The horizontal joint of a shear wall reinforced with ring buckles was subjected to direct shear tests and finite element analysis. The conclusions derived from this research offer valuable insights for the application of epoxy resin concrete in structural engineering, which can be summarized as follows:
(1)
When epoxy resin concrete is employed as the post-cast material in prefabricated components, it exhibits excellent bonding performance with the ordinary concrete of the prefabricated sections. Additionally, incorporating a keyway on the joint surface significantly enhances the interlock between the old and new concrete, thereby improving the shear resistance of the joint surface. Therefore, the shear bearing capacity and stiffness of horizontal joints with epoxy resin concrete and keyways can match or even exceed those of fully cast specimens.
(2)
An increase in the buckle length of the ring reinforcement negatively affects the shear bearing capacity of the joint surface. When ordinary concrete is used as the post-cast material alongside a large buckle length, the shear stiffness may also be compromised. This study recommends that the buckle length of the ring reinforcement be approximately one-third of the total width of the horizontal joint to optimize performance.
(3)
As the strength of the precast concrete increases, there is a corresponding increase in bearing capacity, but a decrease in ductility. The rate of increase in bearing capacity initially rises and then diminishes. Therefore, it is recommended that the strengths of the precast concrete and the post-cast epoxy concrete be closely matched to achieve the optimal strength design.
(4)
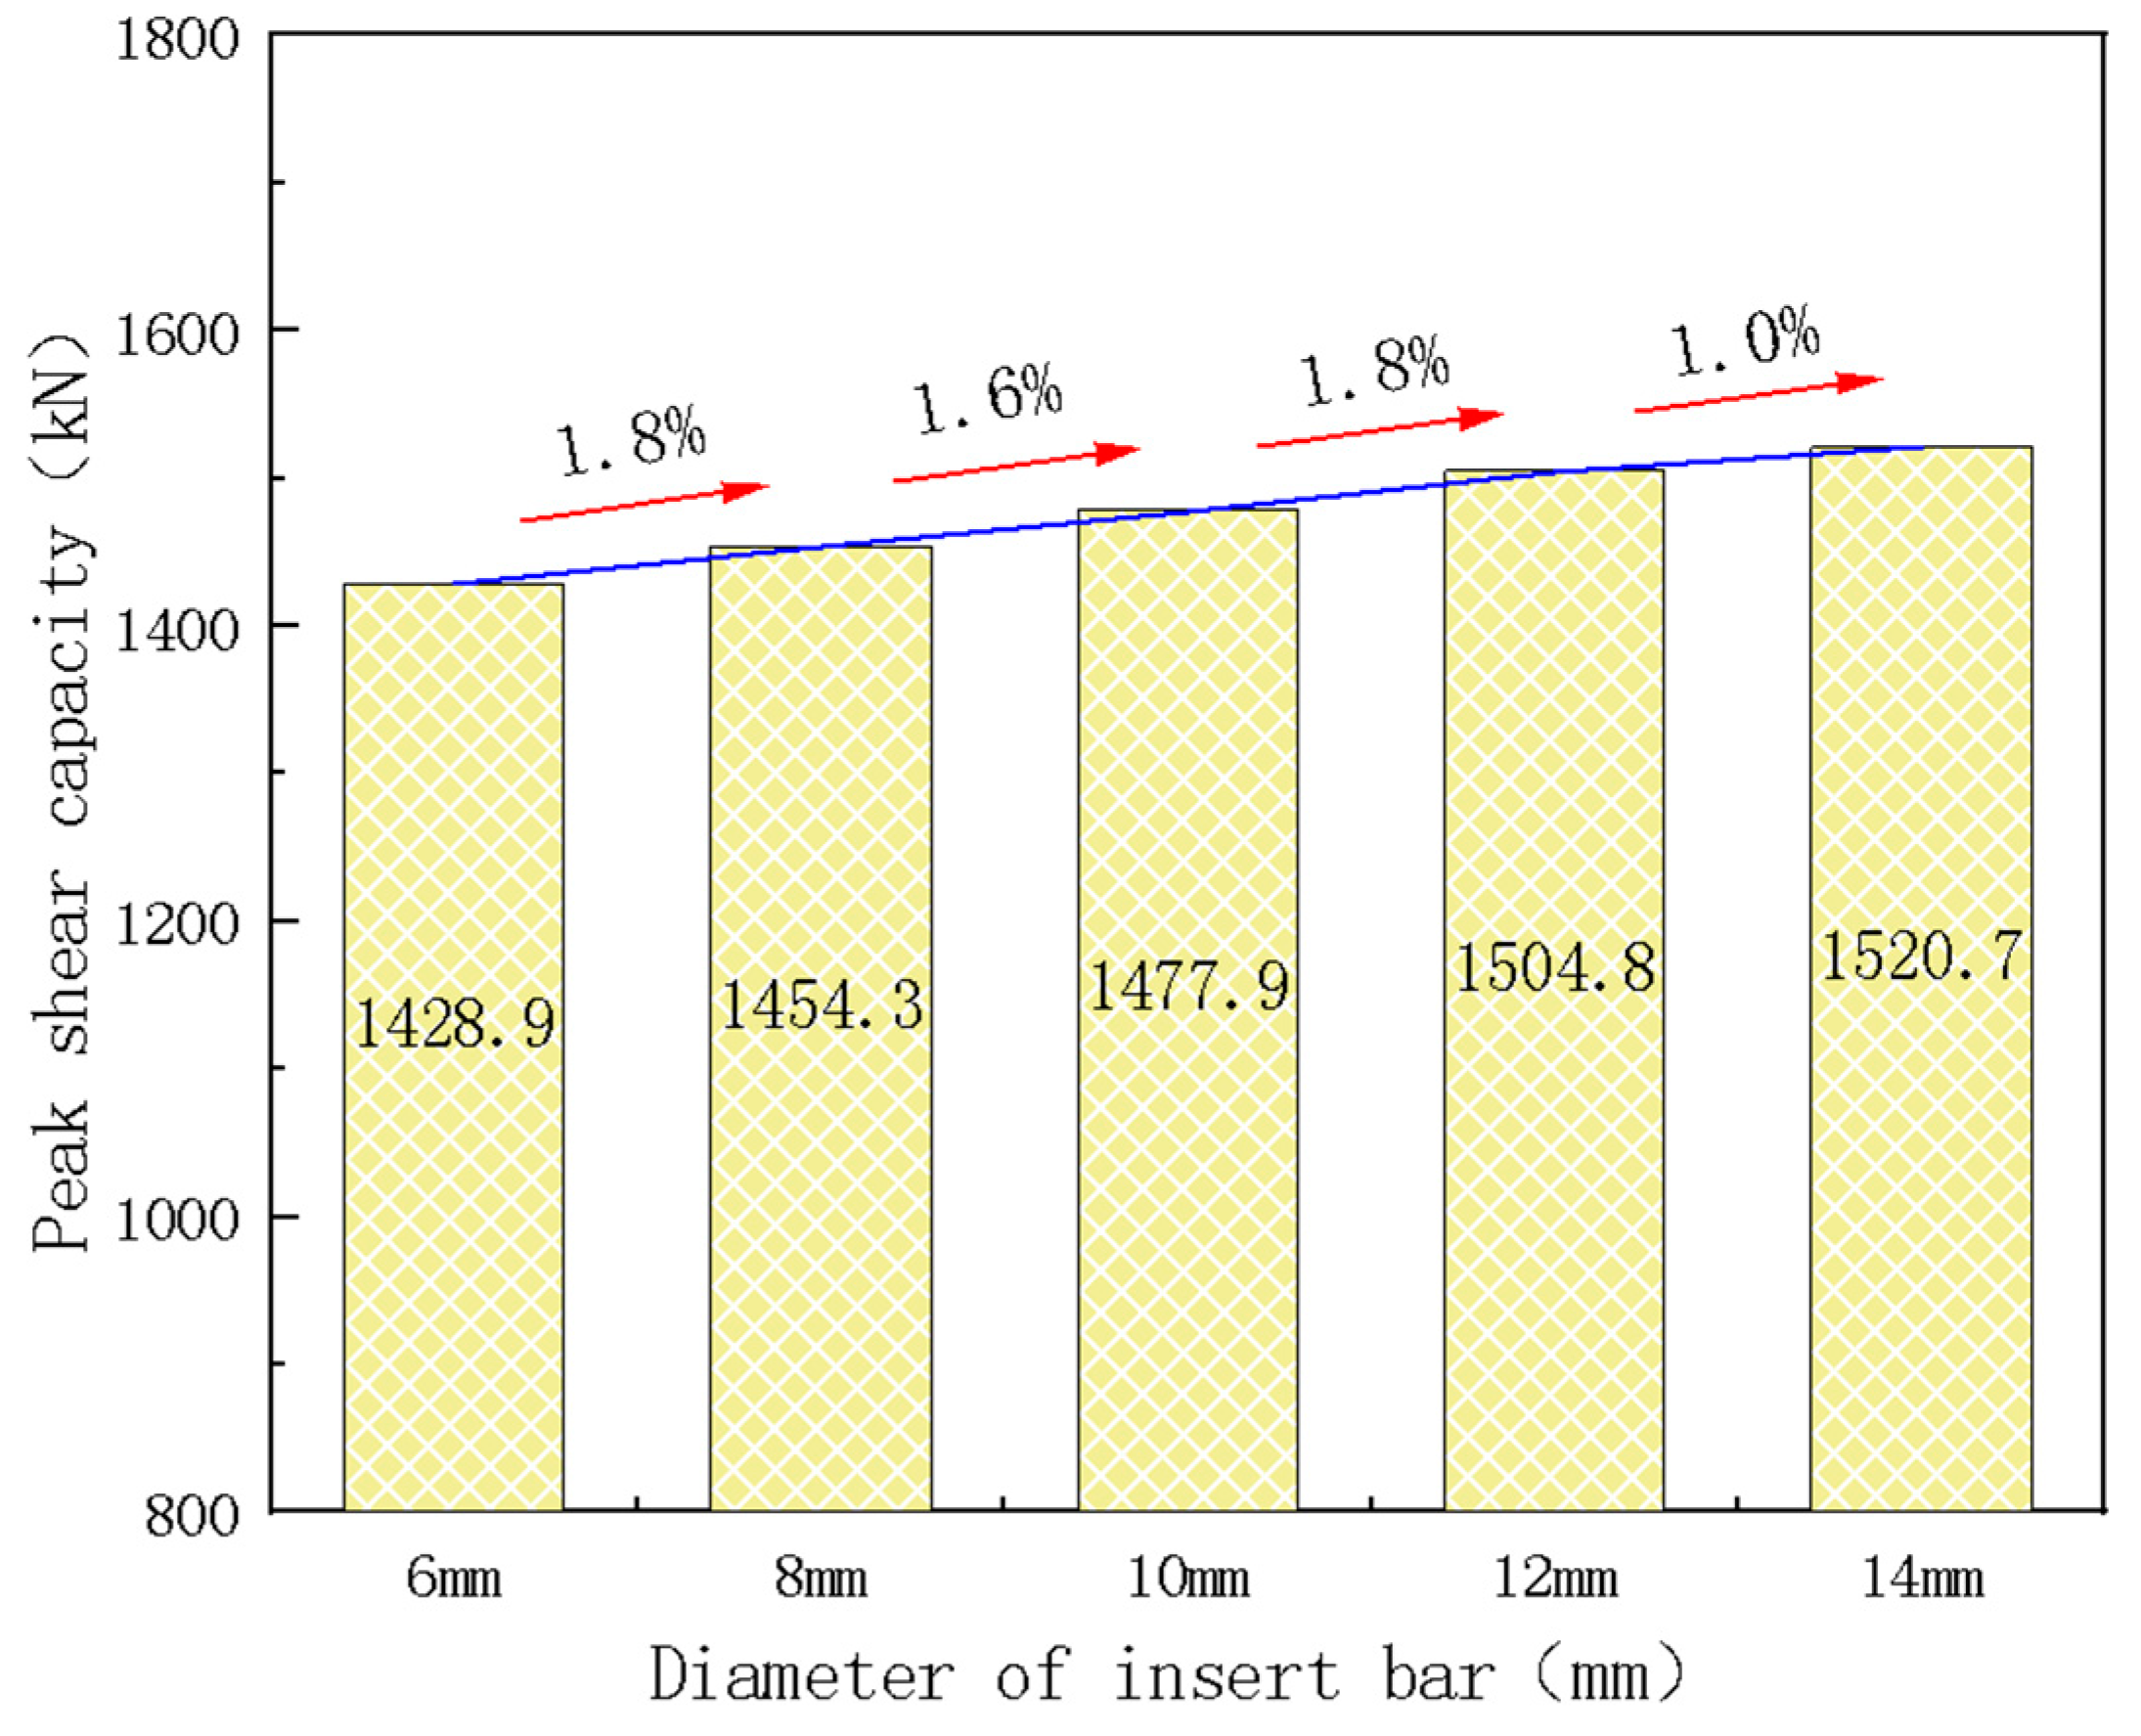
The shear capacity of the wall improves with higher reinforcement ratios in both the horizontal joint ring reinforcement and the inserted reinforcement. The effect of the ring reinforcement is more significant than that of the inserted reinforcement. However, when the reinforcement ratio surpasses a certain threshold, the wall’s ductility decreases markedly. It is advised that the diameter of the ring reinforcement be between 10 mm and 12 mm, with a reinforcement ratio ranging from 0.79% to 1.13%.
(5)
Increasing the lateral horizontal constraint force on the specimen enhances both stiffness and shear capacity. However, it also reduces ductility, particularly when the constraint force reaches 500 kN, leading to a significant decrease in ductility. Therefore, it is recommended that the axial compression ratio of the wall not exceed 0.5.

7. Outlook

Future research will provide a comprehensive technical reference for the application of epoxy resin concrete in prefabricated buildings. Planned activities include the following:
(1)
Focusing on key parameters, such as joint surface roughness, keyway slotting angle, and the number of keyways, to conduct more detailed experimental and numerical simulation studies and develop construction recommendations for shear walls composed of post-cast epoxy resin concrete.
(2)
Based on the findings, proposing a set of formulas to calculate the bearing capacity of the horizontal joint in walls using ring reinforcement buckle connection technology, thereby providing theoretical support for practical engineering applications.
(3)
Investigating the durability of joints in prefabricated shear walls with post-cast epoxy resin concrete and optimizing construction technology.

Author Contributions

Software, S.Z. and Y.L.; Investigation, P.X. and X.Z.; Resources, P.X.; Data curation, X.Z.; Writing—original draft, S.Z.; Writing—review & editing, P.C.; Project administration, P.C. All authors have read and agreed to the published version of the manuscript.

Funding

This research was funded by the National Natural Science Foundation of China, grant number 51678389.

Data Availability Statement

The original contributions presented in the study are included in the article, further inquiries can be directed to the corresponding author.

Conflicts of Interest

Author Pengzhan Xu was employed by the company Tangshi Jianhua Building Materials (Tianjin) Co., Ltd. The remaining authors declare that the research was conducted in the absence of any commercial or financial relationships that could be construed as a potential conflict of interest.

References

  1. Cholewicki, A. Loadbearing capacity and deformability of vertical joints in structural walls of large panel buildings. Build. Sci. 1971, 6, 163–184. [Google Scholar] [CrossRef]
  2. Hemamalini, S.; Vidjeapriya, R.; Jaya, K.P. Performance of precast shear wall connections under monotonic and cyclic loading: A state-of-the-art review. Iran. J. Sci. Technol. Trans. Civ. Eng. 2021, 45, 1307–1328. [Google Scholar] [CrossRef]
  3. Hu, R.; Fang, Z.; Shi, C.; Benmokrane, B.; Su, J. A review on seismic behavior of ultra-high performance concrete members. Adv. Struct. Eng. 2021, 24, 1054–1069. [Google Scholar] [CrossRef]
  4. Basereh, S.; Okumus, P.; Aaleti, S. Seismic retrofit of reinforced concrete shear walls to ensure reparability. In Proceedings of the Structures Congress 2020, St. Louis, MO, USA, 5–8 April 2020; American Society of Civil Engineers: Reston, VA, USA, 2020; pp. 498–509. [Google Scholar]
  5. Sharma, S.; Aaleti, S.; Okumus, P. Experimental testing of RC shear wall seismic retrofit using selective weakening, self-centering and Ultra High performance concrete. Resilient Cities Struct. 2023, 2, 76–90. [Google Scholar] [CrossRef]
  6. Han, W.L.; Zhao, Z.Z.; Qian, J.R. Global experimental response of a three-story, full-scale precast concrete shear wall structure with reinforcing bars spliced by grouted couplers. PCI J. 2019, 64, 65–80. [Google Scholar] [CrossRef]
  7. Xiong, F.; Malla, P.; Cai, G.; Larbi, A.S.; Zhong, Y.; Tufail, R.F.; Chen, W.; Huang, W. Numerical analysis of precast concrete shear walls with horizontal bolted joints under seismic loads. J. Earthq. Eng. 2022, 26, 4737–4760. [Google Scholar] [CrossRef]
  8. Pall, A.S.; Marsh, C.; Fazio, P. Friction joints for seismic control of large panel structures. J. Prestress. Concr. Inst. 1980, 25, 38–61. [Google Scholar] [CrossRef]
  9. Yu, Z.-W.; Peng, X.-D.; Guo, W.; Peng, M.-P. Seismic performance of precast concrete shear wall with U-type reinforcements ferrule connection. Zhejiang Daxue Xuebao (Gongxue Ban)/J. Zhejiang Univ. (Eng. Sci.) 2015, 49, 975–984. [Google Scholar]
  10. Yu, Z.; Peng, X.; Guo, W.; Peng, M. New node connection mode and seismic performance of precast concrete shear wall structure. Xi’an Jianzhu Keji Daxue Xuebao/J. Xi’an Univ. Archit. Technol. 2015, 47, 160–164+191. [Google Scholar]
  11. Yu, Z.; Lv, X.; Yu, Y.; Ding, F.; Peng, X. Seismic performance of precast concrete columns with improved u-type reinforcement ferrule connections. Int. J. Concr. Struct. Mater. 2019, 13, 54. [Google Scholar] [CrossRef]
  12. Issa, C.A.; Debs, P. Experimental study of epoxy repairing of cracks in concrete. Constr. Build. Mater. 2007, 21, 157–163. [Google Scholar] [CrossRef]
  13. Rahman, M.M.; Akhtarul Islam, M. Application of epoxy resins in building materials: Progress and prospects. Polym. Bull. 2022, 79, 1949–1975. [Google Scholar] [CrossRef]
  14. Yu, T. The Experimental Study of Repairing Concrete Cracks with Epoxy Resin Grouting. Master’s Thesis, Beijing University of Technology, Beijing, China, 2016. (In Chinese). [Google Scholar]
  15. Xiang, Q.; Xiao, F. Applications of epoxy materials in pavement engineering. Constr. Build. Mater. 2020, 235, 117529. [Google Scholar] [CrossRef]
  16. Zhang, W.; Guan, X.; Ren, J.; Gu, X. Experimental study on chloride permeability of concrete surface-treated with epoxy resin. J. Build. Mater. 2008, 11, 340–344. [Google Scholar]
  17. Natarajan, S.; Neelakanda Pillai, N.; Murugan, S. Experimental investigations on the properties of epoxy-resin-bonded cement concrete containing sea sand for use in unreinforced concrete applications. Materials 2019, 12, 645. [Google Scholar] [CrossRef]
  18. Qian, Y.; Li, Z.; Jin, Y.; Wang, R. Experimental Study on Axial Tension Members of a New Epoxy Resin Concrete. Sci. Adv. Mater. 2021, 13, 2005–2015. [Google Scholar] [CrossRef]
  19. El-Mandouh, M.A.; El-Maula, A.S.A. Shear strength of epoxy-modified reinforced concrete beams. Innov. Infrastruct. Solut. 2021, 6, 105. [Google Scholar] [CrossRef]
  20. Chen, P.; Liu, Z.; Zhou, X.; Xu, S.; Wang, J. Research on Work Performance of Monolithic Precast Concrete Shear Walls with Post-Cast Epoxy Resin Concrete. Buildings 2024, 14, 1675. [Google Scholar] [CrossRef]
  21. Julio, E.N.B.S.; Branco, F.A.B.; Silva, V.D. Concrete-to-concrete bond strength. influence of the roughness of the substrate surface. Constr. Build. Mater. 2004, 18, 675–681. [Google Scholar] [CrossRef]
  22. Rizkalla, S.H.; Serrette, R.L.; Heuvel, J.S.; Attiogbe, E.K. Multiple shear key connections for precast shear wall panels. PCI J. 1989, 34, 104–120. [Google Scholar] [CrossRef]
  23. Gopal, B.A.; Hejazi, F.; Hafezolghorani, M.; Voo, Y.L. Shear strength of dry and epoxy joints for ultra-high-performance fiber-reinforced concrete. ACI Struct. J. 2020, 117, 279–288. [Google Scholar] [CrossRef]
  24. Fan, H.; Zhang, Y.; Zhang, Y.; Jiang, H.; Du, L.; Liu, Q. Mechanical Properties and Energy Conservation Analysis for The New Connection of The Fabricated Shear Wall. IOP Conf. Ser. Earth Environ. Sci. 2021, 804, 022094. [Google Scholar] [CrossRef]
  25. EN1992-1-2; Euro-Code2: Design of Concrete Structures-Part1: General Rules and Rules for Buildings. European Committee for Standardization: Bruxelles, Belgium, 2021.
  26. Jin, Y.; Zhao, Y.; Xie, X.; Zhang, X.; Cai, J. Simulation Analysis of Joint Connection of New Epoxy Resin Concrete Truss Structure. Int. J. Perform. Eng. 2021, 17, 143. [Google Scholar]
  27. JGJ/T 430-2018; Technical standard for precast reinforced concrete shear wall structure assembled by anchoring closed loop reinforcement. China Architecture & Build Press: Beijing, China, 2018.
  28. GB 50010-2010; Code for Design of Concrete Structures. China Architecture & Building Press: Beijing, China, 2015.
  29. Khan RM, A.; Shafighfard, T.; Ali, H.Q.; Mieloszyk, M.; Yildiz, M. Strength prediction and experimental damage investigations of plain woven CFRPs with interacting holes using multi-instrument measurements. Polym. Compos. 2023, 44, 3594–3609. [Google Scholar] [CrossRef]
Figure 1. Technical diagram of the buckle connection of ring reinforcement.
Buildings 14 03119 g001
Figure 2. Size and reinforcement diagram of typical specimen.
Buildings 14 03119 g002aBuildings 14 03119 g002b
Figure 3. Test device diagram.
Buildings 14 03119 g003
Figure 4. Loading system.
Buildings 14 03119 g004
Figure 5. Displacement meter layout.
Buildings 14 03119 g005
Figure 6. Failure condition of each specimen.
Buildings 14 03119 g006
Figure 7. Load-displacement curves of ZHY specimen.
Buildings 14 03119 g007
Figure 8. Failure of each specimen.
Buildings 14 03119 g008
Figure 9. Load-displacement curves of ZXJ-2-60 and ZXJ-2-100 specimen.
Buildings 14 03119 g009
Figure 10. Schematic diagram of ZHY-1-60 joint structure.
Buildings 14 03119 g010
Figure 11. Damage condition of each specimen.
Buildings 14 03119 g011
Figure 12. Load-displacement curves of ZXJ-1-60 and ZHY-1-60 specimen.
Buildings 14 03119 g012
Figure 13. Comparison of failure conditions of each specimen.
Buildings 14 03119 g013
Figure 14. Load-displacement curve of an ordinary concrete specimen with a 60mm length of U-shaped steel bar.
Buildings 14 03119 g014
Figure 15. Failure condition of specimen ZZJ.
Buildings 14 03119 g015
Figure 16. Comparison of load-displacement curves of all specimens.
Buildings 14 03119 g016
Figure 17. Finite element model of specimen ZHY-1-60.
Buildings 14 03119 g017
Figure 18. Comparison of test and simulation results of failure morphology of specimens.
Buildings 14 03119 g018
Figure 19. Comparison of experimental and finite element simulation results of load-displacement curves of specimens.
Buildings 14 03119 g019
Figure 20. Stress distribution of concrete and steel bars under peak load.
Buildings 14 03119 g020aBuildings 14 03119 g020b
Figure 21. Influence of precast partial concrete strength on joint shear capacity.
Buildings 14 03119 g021
Figure 22. Load-displacement curves of specimens with different annulus diameters.
Buildings 14 03119 g022
Figure 23. Comparison of the peak load of each specimen under different annulus diameters.
Buildings 14 03119 g023
Figure 24. Load displacement curve of each specimen under different dowel bar diameters.
Buildings 14 03119 g024
Figure 25. Peak load of each specimen under different insert bar diameters.
Buildings 14 03119 g025
Figure 26. Load displacement curve of each specimen under different horizontal binding forces.
Buildings 14 03119 g026
Figure 27. Peak load under different levels of restraint.
Buildings 14 03119 g027
Table 1. Basic information and structural details of test specimens.
Specimen NumberHorizontal Joint Construction
After-Cast MaterialWhether There Is a KeywayRing Buckle Length (mm)
ZHY-1-80Epoxy concreteYes80
ZHY-1-60Yes60
ZHY-1-100Yes100
ZXJ-2-60Ordinary concrete (C40)No60
ZXJ-1-60Yes80
ZXJ-2-100No100
ZZJ--60
Table 2. Summary of primary load-displacement curve metrics for each specimen.
Specimen NumberCracking Load FC (kN)Cracking Displacement (mm)Peak Load Fm (kN)Peak Displacement (mm)
ZHY-1-602452.351384.323.6
ZHY-1-802802.571295.521.1
ZHY-1-1002433.511073.418.9
ZXJ-1-601031.02621.818.8
ZXJ-2-601061.63425.739.0
ZXJ-2-100774.14307.742.1
ZZJ1801.72813.310.3
Table 3. Parameters and configurations of finite element models.
Specimen NumberStrength Grade of ConcreteRatio of Joint Ring Reinforcement (Diameter)Reinforcement Ratio of Horizontal Joint Insertion (Diameter)Horizontal Binding Force (kN)
ZHY-1-60C400.50% (8 mm)0.74% (8 mm)0
ZJC1C300.50% (8 mm)0.74% (8 mm)0
ZJC2C500.50% (8 mm)0.74% (8 mm)0
ZJC3C600.50% (8 mm)0.74% (8 mm)0
ZJC4C700.50% (8 mm)0.74% (8 mm)0
ZJH1C400.28% (6 mm)0.74% (8 mm)0
ZJH2C400.79% (10 mm)0.74% (8 mm)0
ZJH3C401.13% (12 mm)0.74% (8 mm)0
ZJH4C401.54% (14 mm)0.74% (8 mm)0
ZJS1C400.50% (8 mm)0.42% (6 mm)0
ZJS2C400.50% (8 mm)1.20% (10 mm)0
ZJS3C400.50% (8 mm)1.70% (12 mm)0
ZJS4C400.50% (8 mm)2.30% (14 mm)0
ZJF1C400.50% (8 mm)0.74% (8 mm)100
ZJF2C400.50% (8 mm)0.74% (8 mm)200
ZJF3C400.50% (8 mm)0.74% (8 mm)300
ZJF4C400.50% (8 mm)0.74% (8 mm)400
ZJF5C400.50% (8 mm)0.74% (8 mm)500
Disclaimer/Publisher’s Note: The statements, opinions and data contained in all publications are solely those of the individual author(s) and contributor(s) and not of MDPI and/or the editor(s). MDPI and/or the editor(s) disclaim responsibility for any injury to people or property resulting from any ideas, methods, instructions or products referred to in the content.

