Article

Effects of the Acoustic-Visual Indoor Environment on Relieving Mental Stress Based on Facial Electromyography and Micro-Expression Recognition

School of Environmental and Municipal Engineering, Qingdao University of Technology, Qingdao 266520, China
*
Author to whom correspondence should be addressed.
Buildings 2024, 14(10), 3122; https://doi.org/10.3390/buildings14103122 (registering DOI)
Submission received: 31 August 2024 / Revised: 26 September 2024 / Accepted: 27 September 2024 / Published: 29 September 2024
(This article belongs to the Special Issue Recently Advances in the Thermal Performance of Buildings)

Abstract

:
People working and studying indoors for a long time can easily experience mental fatigue and stress. Virtual natural elements introduced into indoor environments can stimulate the human visual and auditory senses, thus relieving psychological stress. In this study, stress induction was achieved through noise playback, and the recovery effects on psychological stress of three set indoor environments, visual, auditory, and audio-visual, were investigated through changes in subjects’ facial expressions, electromyographic (EMG) signals, and subjective questionnaires. The experiment found that after stress induction through noise, the participants’ stress levels changed significantly. At this time, the subject scored low on the questionnaire, with electromyography readings higher than usual, and micro-expression recognition indicated negative emotions. After the restoration effects under the three working conditions of visual, auditory, and audio-visual combination, the average EMG values during the recovery period decreased from the baseline period (10 min after the subject acclimated to the environment), respectively. The results indicate that all three restoration conditions have the effect of relieving psychological stress, with the stress recovery effects of auditory and audio-visual conditions being superior to visual conditions. This study is of great significance for creating comfortable indoor environments and minimizing psychological pressure on indoor office workers.

1. Introduction

Nowadays, people spend 90% of their time working, studying, and living in indoor environments [1]. Working indoors for a long time, exposed to high-density cities and away from the natural environment, people could easily become negative, mentally exhausted, and stressed [2]. These negative emotions have a severe impact on people’s lives and work. For the work environment, half of the global workforce suffered from psychological stress in 2010 [3]. In a certain sense, the indoor environment has a far more significant impact on people’s work, study, and life than the outdoor environment. Scientists researching methods to alleviate psychological stress have discovered that elements of nature are beneficial. Studies have shown that the natural environment contributes to the relief of stress and fatigue, as well as to mental health [4,5]. Ulrich, an environmental psychologist, proposed the Stress Recovery Theory, which states that when an individual is in a state of stress, exposure to certain natural environments could alleviate the negative physical and psychological effects caused by the stressor and promote positive emotions [5]. Research by Elsadek indicates that viewing flowering plants can enhance physiological functions and improve psychological relaxation for office workers [6]. Ulrich experimentally demonstrated that natural scenarios could moderate blood pressure, skin conductivity, and muscle conductivity. Moreover, viewing natural landscapes has a more comfortable feeling than urban landscapes, which is conducive to rapid stress relief and mental state [7,8]. In addition, previous studies have found that placing plants in indoor settings such as schools and workplaces provides a restorative potential for people [9,10]. Therefore, the biophilic theory proposed by Kellert has gradually been applied to buildings. People use multisensory factors such as visual and auditory stimuli to alleviate stress [11]. Lipovac reviewed a lot of the literature and found that the current study shows that visual wood exposure may improve certain indicators of human stress, but additional research is needed to confirm the existing findings [12]. To provide occupants with a restorative indoor environment, theoretical improvements are essential for better utilizing these stimuli.
The natural fresh green environment (such as trees, sky, etc.) has an improving effect on mood [2]. Van den Berg measured and analyzed respiratory sinus arrhythmia (RSA) in 46 subjects while viewing green and urban landscapes [13]. The results of the study showed that their RSA increased when they viewed green landscapes, suggesting that their parasympathetic nerves were activated. Therefore, urban green landscapes have a stress-recovery-promoting effect. The above studies only focused on visual stimulation and human psychological stress recovery. In contrast, the effect of the environment on humans is reflected in multiple sensory dimensions.
Acoustic comfort is also an important factor influencing psychological stress recovery. In outdoor public spaces, acoustic comfort has been defined as one of the fundamental perceptions of the sound environment [14]. In indoor spaces, a lack of acoustic comfort can lead to distractions at work [15]. People tend to show greater tolerance when evaluating acoustic comfort [16].
Natural sounds have also been proven in studies to offer potential psychological benefits and stress restoration. In the comparison experiment of the three soundtracks, including birds, streaming water, and wind, the stress recovery effect was highest for water sounds, which used immersive virtual reality to present natural scenes and designed four sensory stimulation conditions (audiovisual, visual only, auditory-only, and no artificial sensory input) [17,18]. The results showed that for the stimulation, subjects had the most significant decrease in respiration rate, the lowest blood pressure, and the best relaxation during the audiovisual conditions. Li found that using static images and sound to reproduce the natural environment elicited more physiological relaxation and subjective recovery [19]. At the same time, people generally feel more relaxed when exposed to natural sounds compared to mechanical sounds [20]. Hence, the introduction of pro-natural elements in the indoor environment to induce multisensory stimulation is beneficial in relieving the stress and discomfort of the body due to external stimuli.
The electromyography (EMG) is a crucial bioelectrical signal that accompanies muscle activity. Kroll et al. found that EMG is a more appropriate biomarker for identifying self-evaluation of stress [21]. Hong et al. found that the EMG was the most pronounced and sensitive among the physiological parameters when exploring the relationship between perceived soundscape and acoustic parameters [22].
In addition, along with stress, subjects’ moods change as stress increases [23]. Most of the mood changes are presented by human facial micro-expressions [24,25]. For example, tension arises when viewing videos and pictures, and a person may feel discomfort and show it through facial expressions [26]. Facial micro-expressions are defined as short-term involuntary movements of facial muscles that reflect the real emotions that a person is trying to hide. It has a certain degree of uncontrollability. Studies have pointed out that the activity of the eyebrows is associated with negative emotions [27]. In addition, the frontal muscle is one of the main muscles responsible for emotional expression involving the eyebrows. When people are in a negative emotional state, there are large fluctuations in the measured EMG of the frontal muscle [28]. Denise M. Sloan found different levels of corrugator EMG and zygomatic EMG activity when people viewed pictures of happy and unhappy expressions [29]. Kim experimentally demonstrated the potential usability of emotion recognition methods based on facial electromyography (FEMG) and electroencephalography (EEG) in practical scenarios [30]. Künecke revealed an important relationship between emotion-related responses and emotion perception abilities [31]. In addition, they explored the role of facial muscle activation in emotion perception from the perspective of individual differences at the same time.
It is feasible to use physiological parameters to evaluate humans’ emotional and psychological states in different environments. However, in practical applications, the physiological parameters are complicated to collect, and this method is challenging to use widely. In addition, facial expressions certainly play a vital role in the analysis of emotions [32,33]. Research has shown that facial expression recognition is a highly effective method for emotion assessment [34,35]. Nowadays, micro-expression recognition research is relatively mature. However, there are few studies on the use of facial expression recognition for evaluating human comfort and mental stress. Hu et al. applied facial micro-expressions to thermal comfort evaluation for the first time and established the micro-expression recognition model (MERCNN) [36]. However, it did not focus on the effect of different recovery environments on relieving psychological stress.
Although numerous studies have explored the benefits of natural environments (scenes, sounds) for stress recovery, there is still a lack of verification that combines multiple methods. This study aims to investigate the effects of natural factors on visual, auditory, and audiovisual stimuli for stress recovery under stress conditions. At the same time, this paper will combine subjective questionnaires, micro-expression analysis, and human electromyography signals to validate the results.

2. Materials and Methods

2.1. Subjects

Effect size is a parameter used to indicate the difference between the true value and the assumed value. The expected effect size can be determined to be 0.5 [37]. The required sample size calculated by Gpower is 22. Finally, a total of 28 healthy subjects were recruited for this experiment. The primary information of the subjects was shown in Table 1. All subjects had normal hearing and normal or corrected-to-normal vision, and they do not have any facial nerve-related diseases. Subjects were fully adapted to the local climate. They provided written informed consent approved by an institutional review board.
To avoid influencing the experimental results, subjects were required to refrain from strenuous exercise, smoking, alcoholic, and coffee beverages, and staying calm for 24 h before the start of the experiment. To control the variables, the temperature of the experimental environment was controlled at 21~23 °C, and the thermal resistance of the subjects’ clothing was about 0.9 clo [38,39]. Each subject’s self-reported thermoneutral state was ensured.

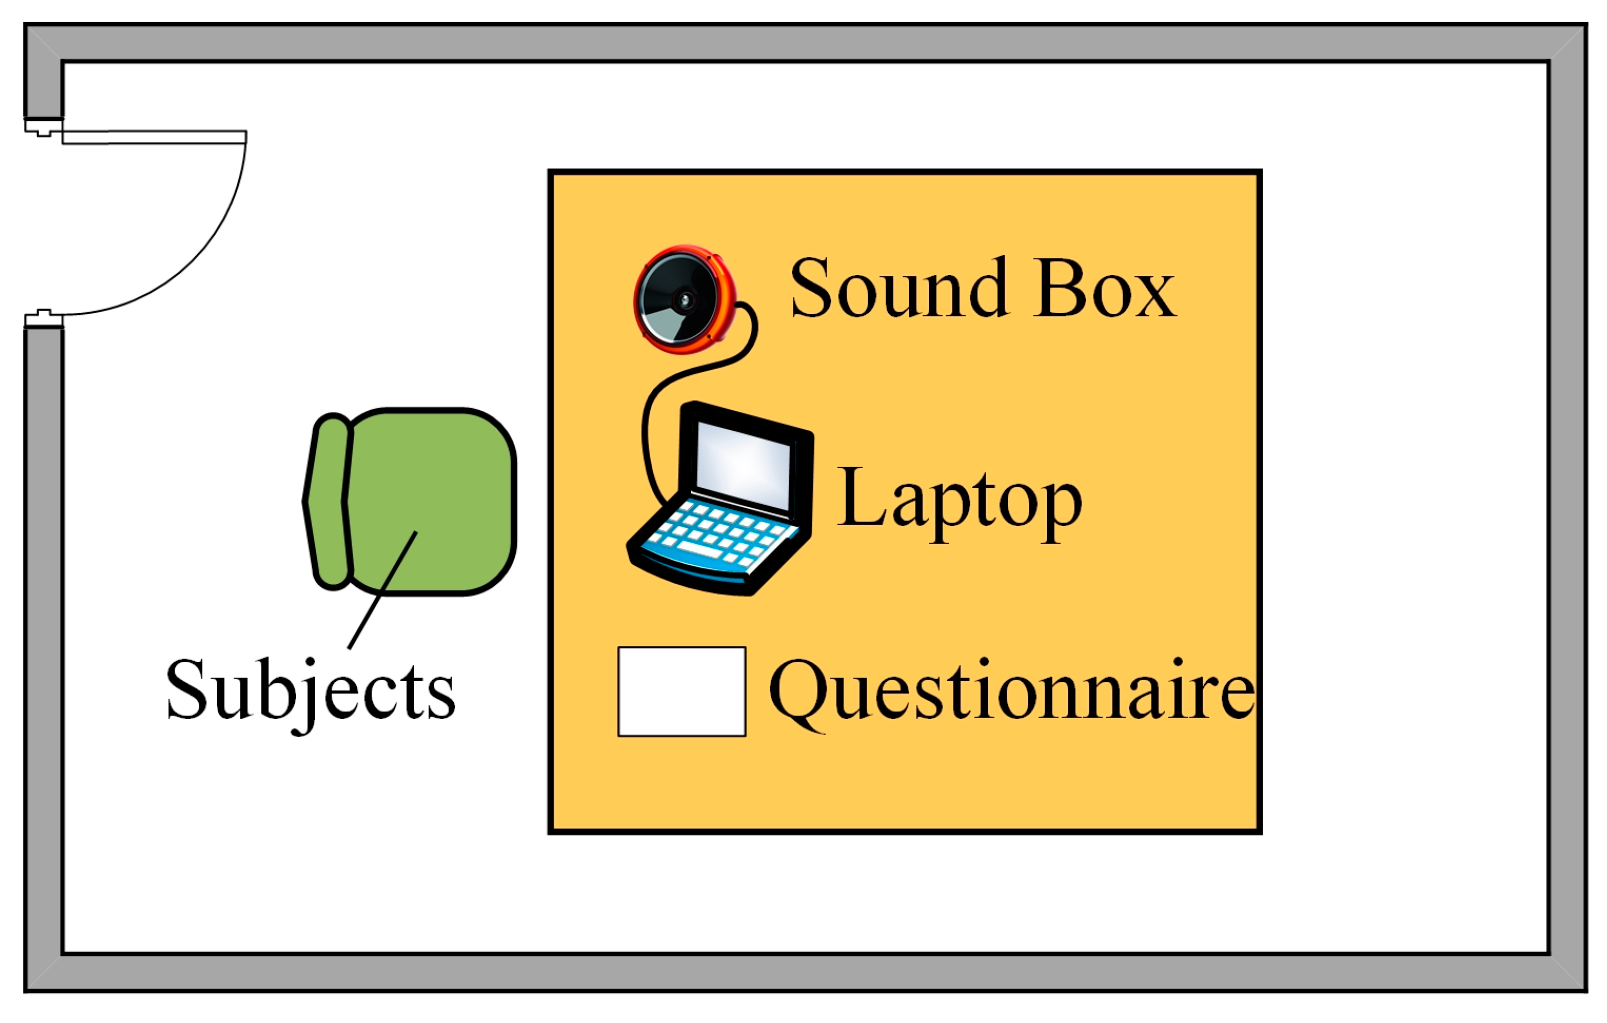
2.2. Experimental Site

This experiment was conducted in the environmental laboratory of Qingdao University of Technology. The laboratory (area: 15 m2) was equipped with a split-type air conditioner that can maintain a constant room temperature and relative humidity. The laboratory had no windows, and plain white walls surround the walls with a double-layer insulation structure. It can effectively isolate the outside noise and eliminate the fluctuation of indoor temperature. The test bench was in the center of the lab, including a laptop, a sound box, and other test equipment. During different stages of the experiment, the sound system played different audio. Noise was emitted during the stress induction phase, while restorative stimuli were provided during the recovery phase. In addition, the visual stimuli were provided by the digital slides of natural scenes (such as the forest) played on the laptop. Figure 1 shows the floor plan of the lab.

2.3. Experimental Contents

2.3.1. Collection of Facial EMG Signals and Micro-Expression

Before the formal experiment begins, participants are required to wear the apparatus and acclimate to the sensation. Before obtaining facial EMG signals, all subjects were asked to relax and feel real feelings during the recording. The EMG sensing device adopted a non-invasive surface electrode method and used surface-mounted electrode pads combined with dual-lead electrodes to acquire EMG signals. The sampling frequency of the EMG acquisition equipment was 50 Hz. In addition, a previous study has been conducted on muscle fatigue assessment methods with similar EMG acquisition equipment, which demonstrated the reliability of the equipment [40]. The micro-expression video recording equipment adopts an HD camera. The details of the test equipment are shown in Table 2.
The facial muscles of the forehead reflect mental and emotional stress better than other muscles. Frontal muscle activity decreases or increases when people are influenced by the environment positively or negatively impacted by the environment [22]. Thus, the EMG signals at the frontal muscle were recorded in this experiment.

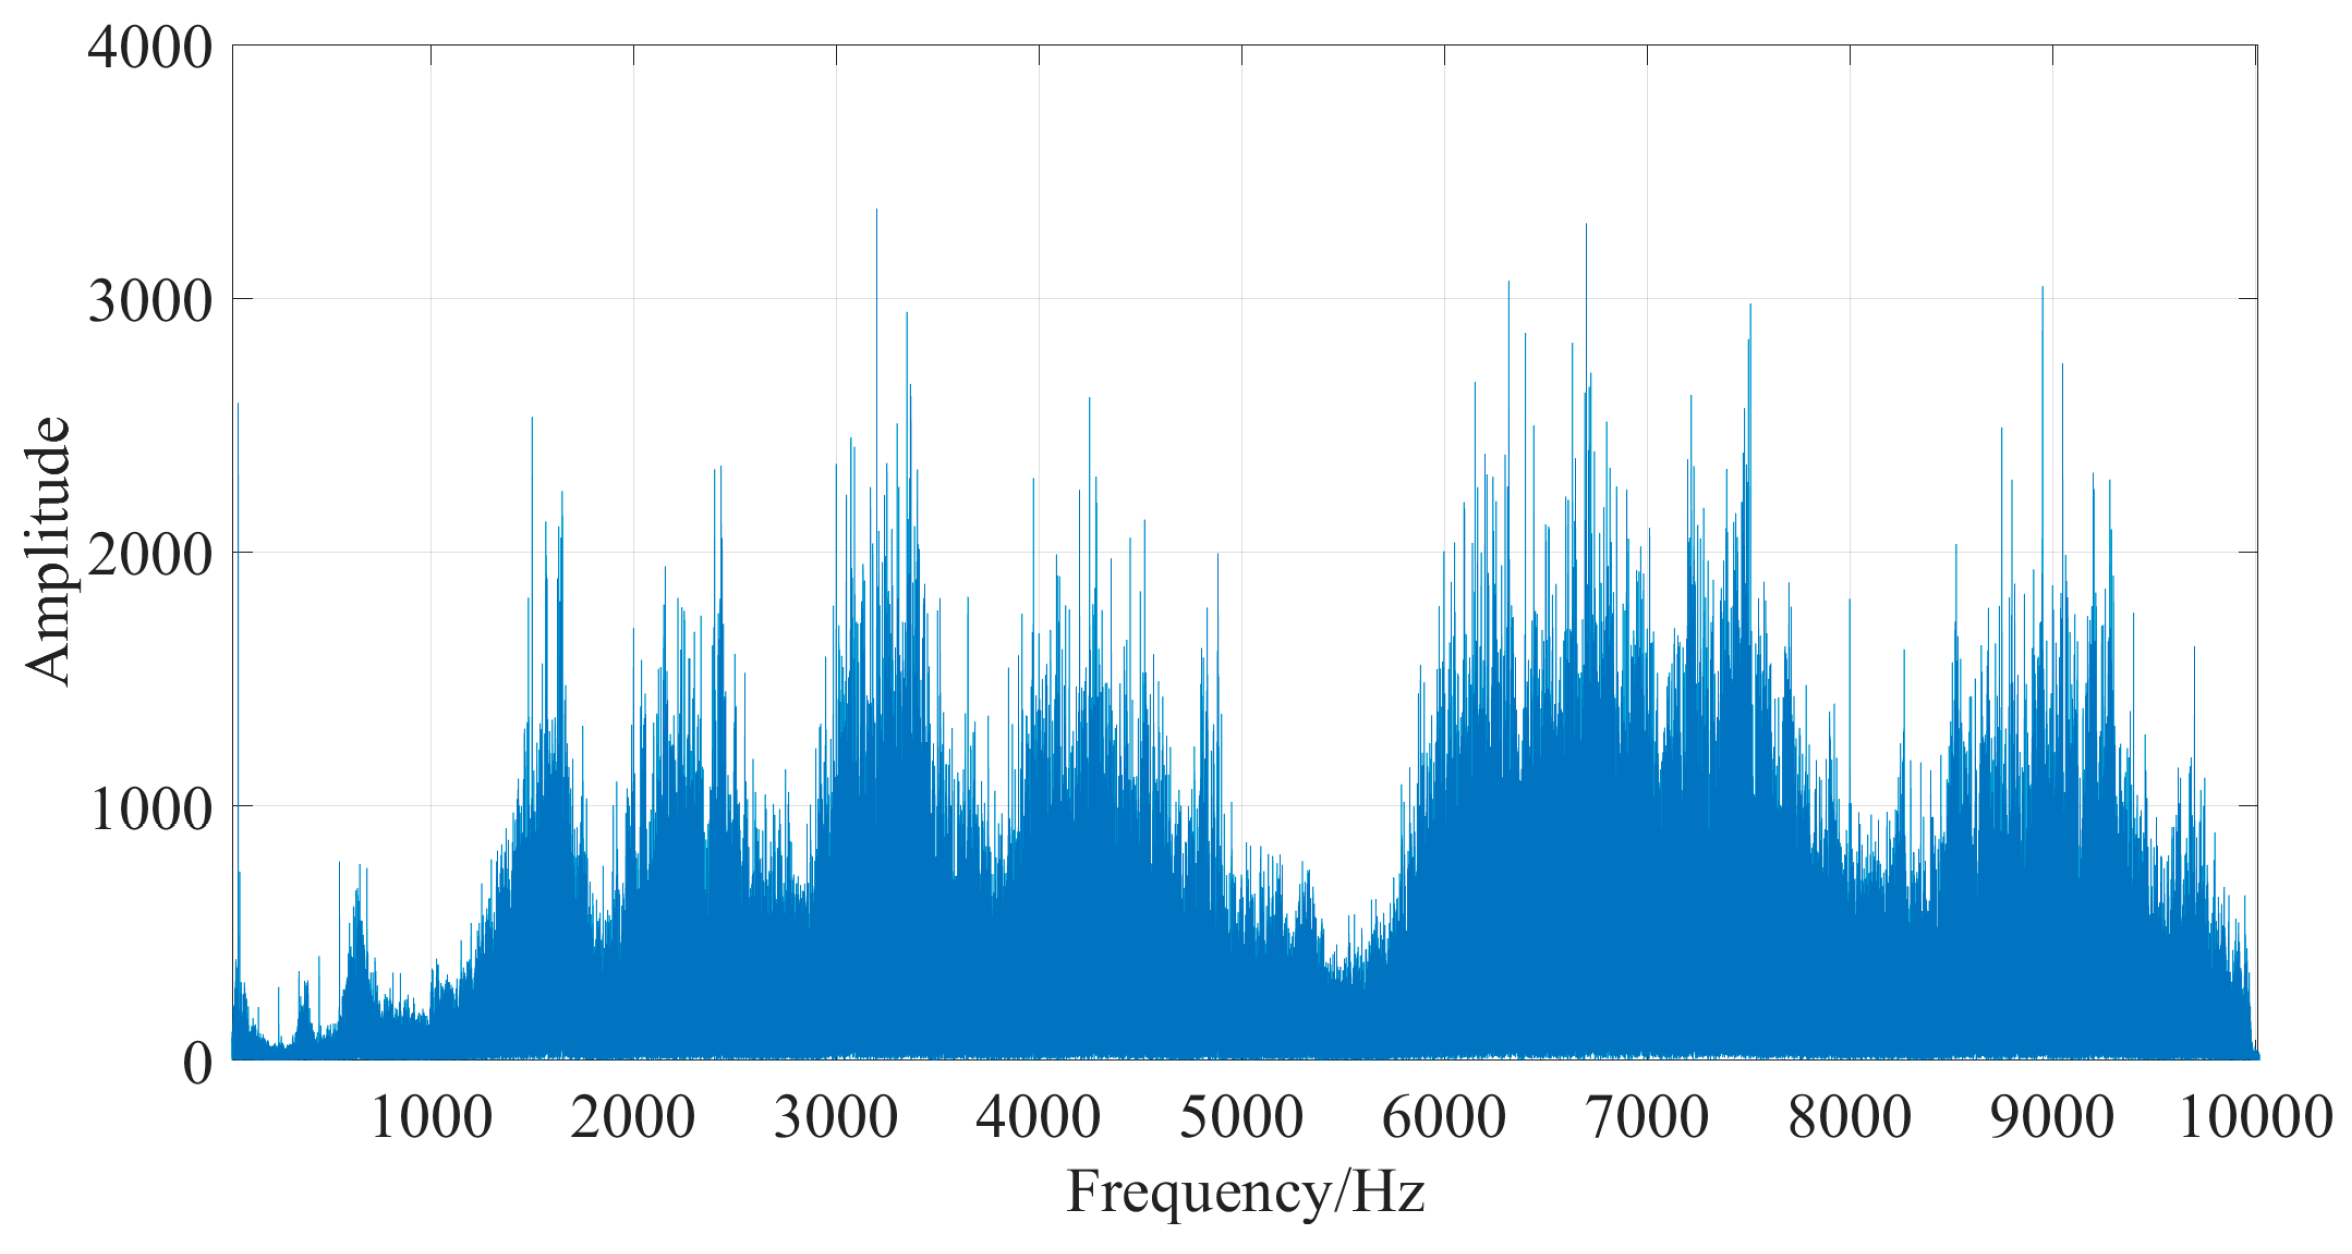
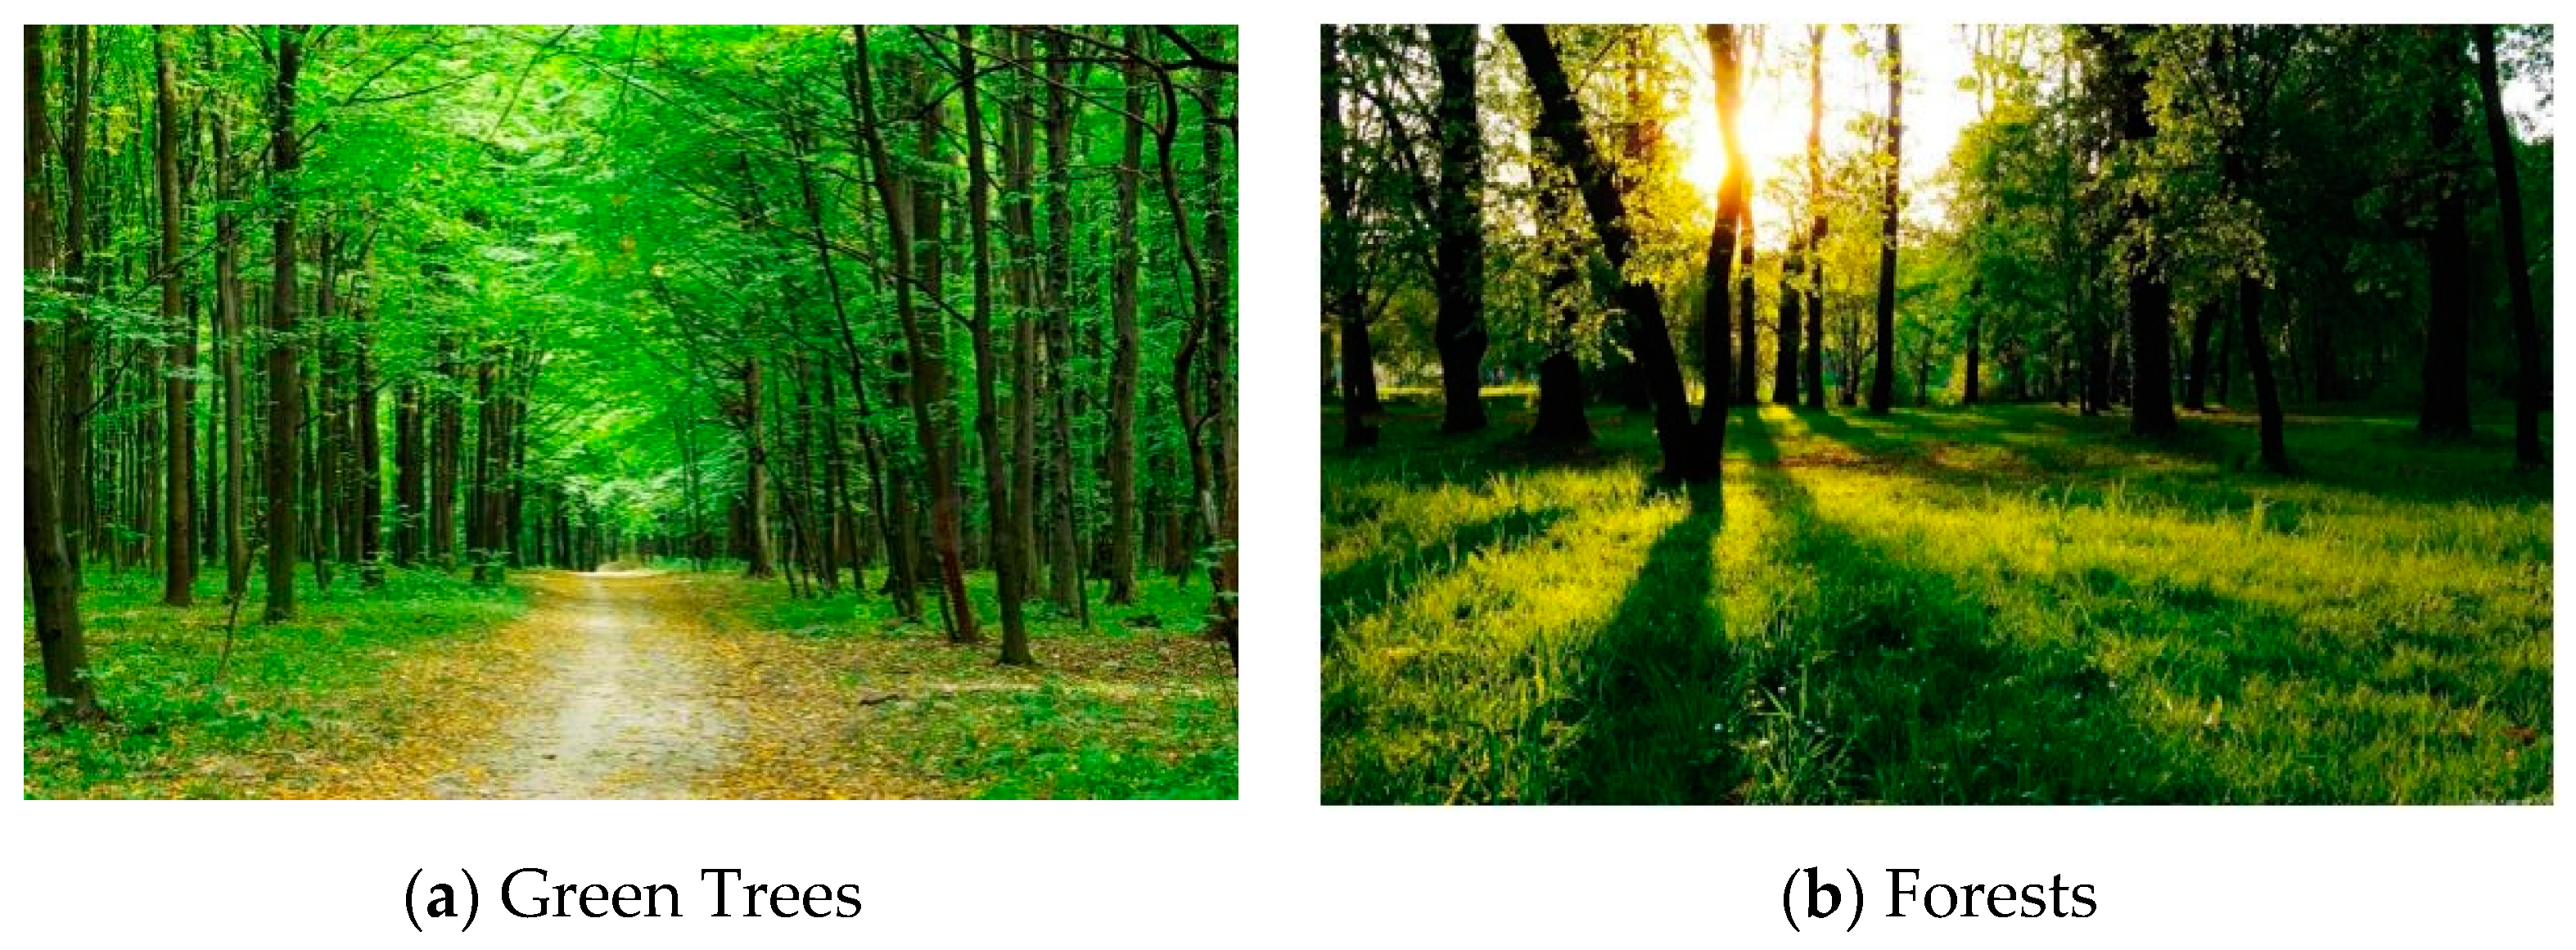
2.3.2. Methods of Stress Induction and Recovery

Noise can have negative effects on the human body, causing people to feel annoyance and stress in noisy environments [41,42]. Additionally, noise can impact work performance and learning ability [43,44]. In similar studies, high-frequency noise was typically used as the stress source [45,46], with the duration for inducing mental stress usually being 10 min [47]. Therefore, high frequency noise was used as the pressure source in this study. Figure 2 shows the frequency domain distribution of the noise played. It can be seen that the frequency distribution of the noise source is relatively wide, which will cause the subjects to feel stressed. After calculation, the average frequency of the audio is about 5489 Hz, which is high frequency audio. The audio level experienced by participants is between 70 and 80 dB. Additionally, research showed that exposure to high-frequency noise for 10 min was sufficient to trigger a stress response [13,38]. According to a previous study, it took 20 min for the body to return to the stress-free state indicated by cortisol concentrations [48]. Therefore, the stress induction phase lasted ten minutes, and the recovery stage in this experiment lasted for a total of 20 min.
Ulrich’s recovery theory suggested that viewing videos of natural environments, with either their colors or sounds, could help alleviate stress [8]. Prior research had shown that color slides of outdoor natural scenes could be effective in promoting stress recovery [49]. Similarly, studies had shown that the sound of streaming water could serve as an effective auditory restorative approach [17]. Therefore, visual and auditory factors influence stress recovery. Based on these findings, this study explored the impact of three stress-recovery environments utilizing visual and auditory factors— visual, auditory, and audiovisual environments—on stress recovery. This study used images of green trees and forests (as shown in Figure 3) to establish a visually restorative environment, employed the sound of streaming water to establish an auditory restorative environment, and designed a combined audiovisual environment. The visual and auditory elements in this comprehensive environment were consistent with those used in the individual visual and auditory settings.

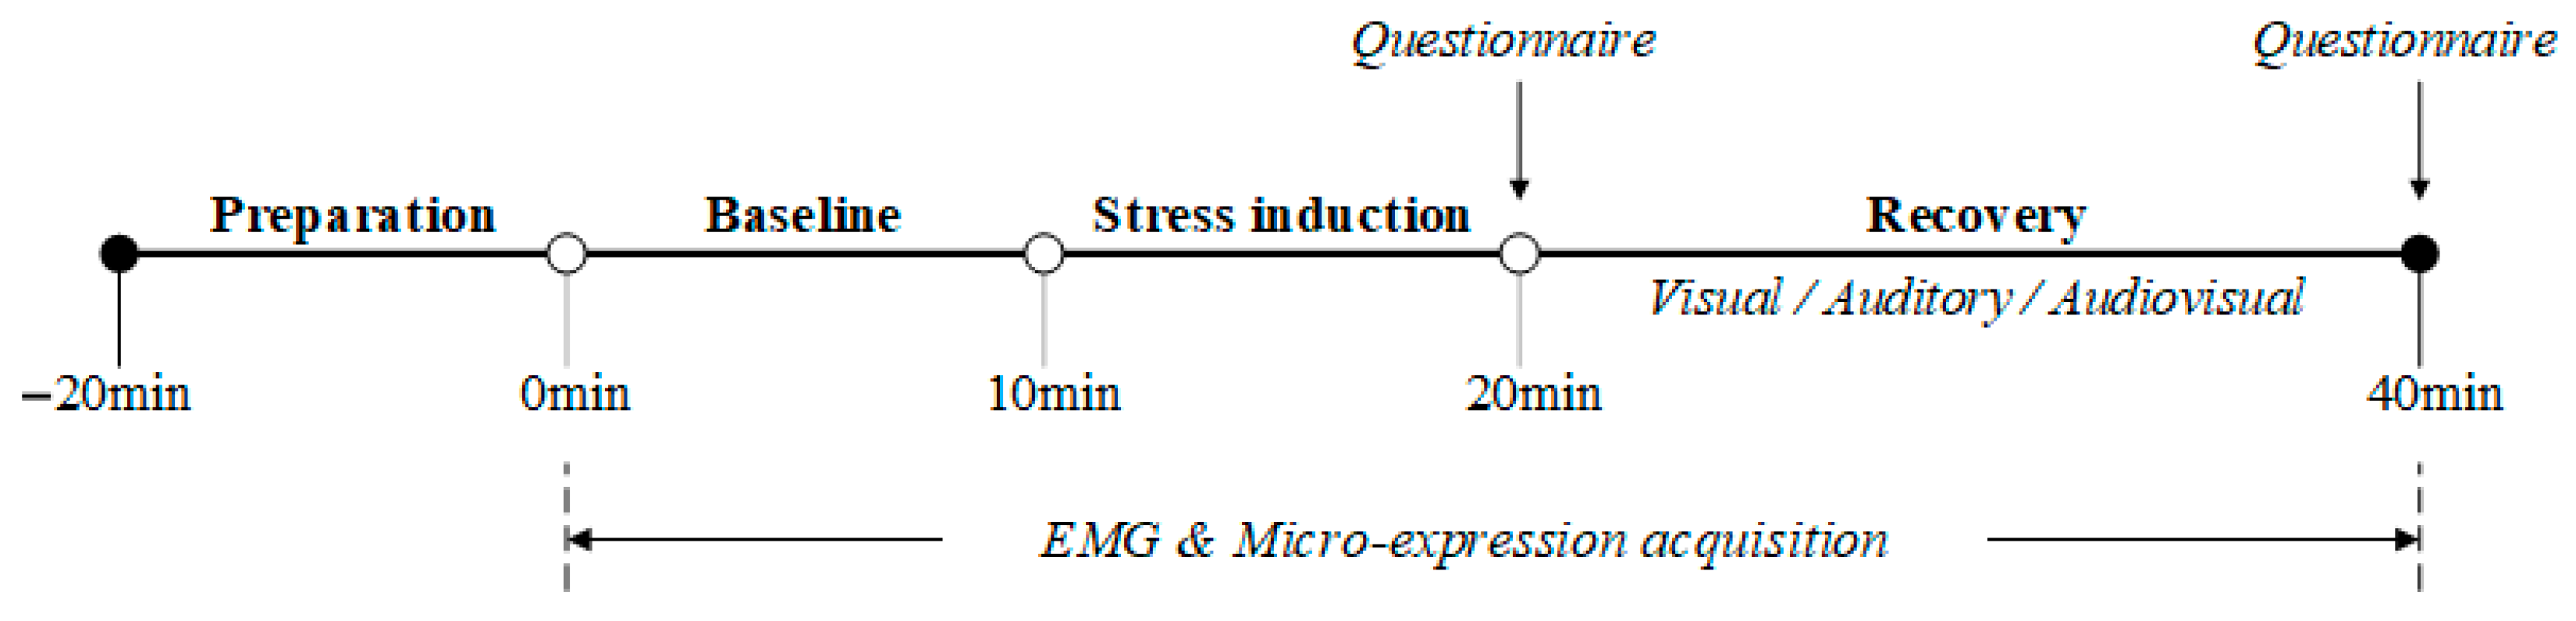
2.4. Experimental Procedures

To investigate the effects of different visual and auditory environments on stress recovery, all 28 subjects were required to experience three conditions: visual, auditory, and audiovisual environments, with a total of 84 experiments conducted. To ensure consistency across experiments, the same stimuli were used, but the restorative measures varied depending on the condition. The sequence in which each subject would experience these three conditions was randomized and disclosed only when the subject was presented with the respective restorative stimuli. The same subject had a 14-day interval between experiments to avoid adaptation to the stimuli. Considering that humans need at least 15 min to adapt themselves to a new physical environment, subjects arrived at the lab 20 min earlier in this study [48]. The experimenter checked and adjusted the equipment in advance to avoid inaccurate or even lost data due to equipment failure.
The experiment consisted of three stages, lasting a total of 40 min. The three stages were the baseline stage, the stress induction stage, and the stress recovery stage, with each stage lasting 10 min, 10 min, and 20 min. Subjects were instructed to remain as still as possible during all stages. During the baseline stage, baseline EMG data and micro-expression videos were collected. In the stress induction stage, subjects were exposed to noise stimulation for 10 min, then completed subjective questionnaires about their current stress level and emotional state. During the stress recovery stage, subjects underwent 20 min of stress recovery and then completed the same questionnaires. All participants experienced three different recovery environments (visual, auditory, and audiovisual environments). EMG data collection and micro-expression recording were conducted continuously throughout the entire experiment. The detailed experimental procedure is shown in Figure 4.

2.5. Subjective Questionnaire

The subjective questionnaire for this experiment was shown in Table 3 [50]. The questionnaire’s content focused on the subjects’ current emotional state. The scale can assess the environment’s comfort, and it was validated through numerous experiments in 2010 [51]. Thus, the scale was used as a basis for subjective evaluation of human comfort and psychological stress in indoor environments.
Based on the preceding text, people will show negative emotions, such as tension and anxiety, when they are under stress. In contrast, people will show positive emotions such as happiness and satisfaction when relaxed. Subjects need to score all emotions. When the sum of positive emotions is more significant than the sum of negative emotions, the subject is comfortable and under less pressure. Otherwise, the subject’s impact is uncomfortable and under more pressure.

2.6. Data Analysis

Origin Pro 2022 and IBM SPSS Statistics 25 were used to conduct the data analysis in this study. The normality of the data was first examined. In addition, outliers were determined using the Inter-Quartile Range method (IQR) [52]. This method is widely applied in statistical analysis. Values that fall outside those IQR fences chart were regarded as outliers and removed. Thereafter, the homogeneity of variance of variables was tested to facilitate the significance test.
For the EMG in this study, if normally distributed, the paired t-test was carried out separately for the EMG data among the baseline, the stress induction, and the stress recovery stage to compare the effects of the stress-recovery effects of these 3 kinds of stimuli. If it does not follow a normal distribution, non-parametric tests will be used.
Throughout the data analysis, the significance level was set at 0.05. This indicated that differences were considered meaningful at the determined level of statistical significance less than 0.05. The obtained EMG data were first filtered using MATLAB 2018b software.
The data were filtered and segmented into three segments: the baseline stage, stress induction stage, and recovery stage. Secondly, this paper analyzes the facial EMG signals solely in the time domain and chooses the index of mean value to represent the characteristics. The mean value was calculated as the sum of all the data in a set and then divided by the amount of data in this set.
In addition, when processing the acquired facial EMG signals, the facial EMG signals themselves are highly variable. In addition, the basis of muscle reflection varies from person to person. There are individual differences in the results. Therefore, the results need to be normalized for a comparison. The data are linearly transformed so that the data process falls in the [0, 1] interval. Both positive and negative indicators in the data are transformed into positive indicators, which act in the same direction and make it easy to observe trend changes. The normalization method is shown in Equation (1).
X * = X X m i n X m a x X m i n
X is the original value of the data in a set of samples. X m a x and X m i n are the maximum and minimum values of the data in the set of samples. X * are the results of normalized data in this group of samples.

3. Results

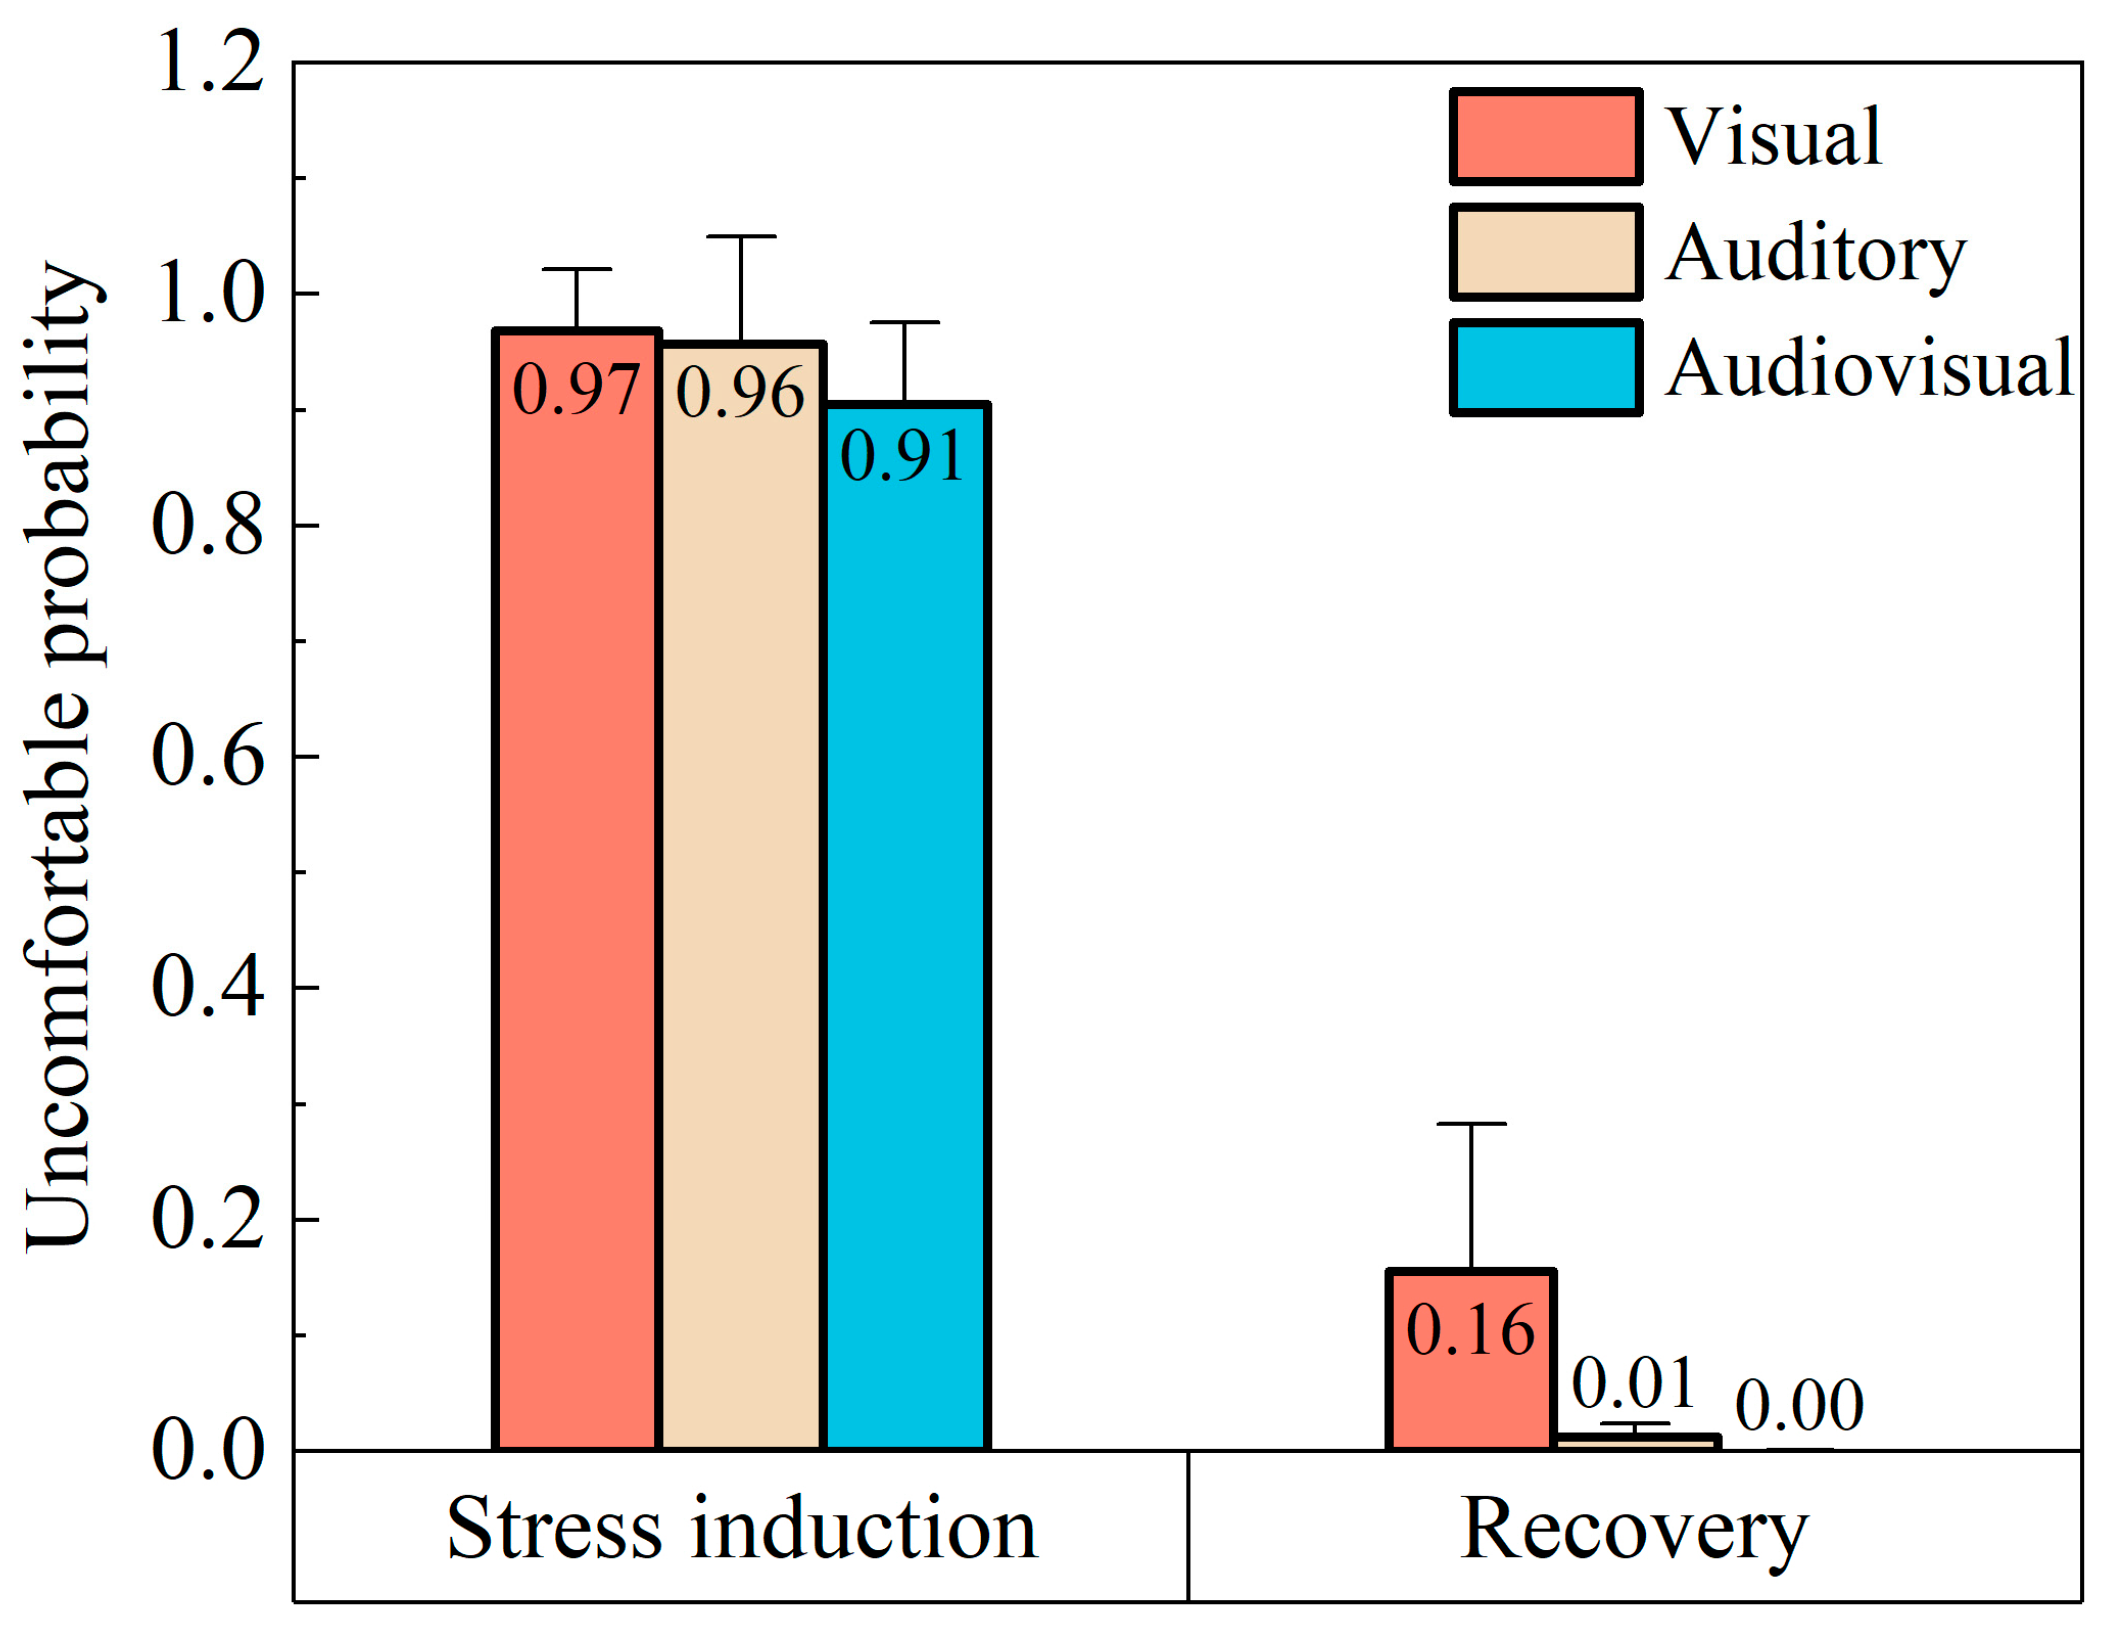
3.1. Facial Micro-Expression Recognition Results for Three Environments

Hu et al. established the MERCNN model to evaluate environmental comfort through facial micro-expression recognition [36]. The MERCNN can qualitatively judge whether the subjects are comfortable and relaxed in different stages of different experiment conditions. In this paper, it was used to analyze the relationship between facial micro-expressions and the comfort of the visual environment and auditory environment.
The subjective questionnaire results can be divided into two situations. When the sum of positive emotion scores is bigger than that of negative emotion scores, it indicates comfort and less indicates discomfort.
The MERCNN model results obtained from each stage were averaged to obtain the mean values of discomfort probability for the stress induction and recovery stages under three environments. The outliers were excluded from the calculation. The results are shown in Figure 5.
As shown in Figure 5, the mean values of the probability of discomfort during the stress induction stage are close to 1 for all three environments, indicating that the subjects felt highly uncomfortable due to the stress stimulation. During recovery, the uncomfortable probability mean values of the visual, auditory, and audiovisual environments were 0.16, 0.01, and 0.00, respectively, close to 0. The results showed that the subjects felt comfortable at this time and indicated that the conditions had significant help for stress recovery.
Although the mean values of discomfort probabilities during the stress induction and recovery stages were within the corresponding comfort/discomfort classification scales, the model outputs showed that some subjects felt comfortable and pleasant during the stress induction stage or uncomfortable during the recovery stage. Therefore, the percentage of uncomfortable people during different stages for each environment is shown in Figure 6.
As shown in Figure 6, in the visual environment, the percentage of subjects who felt uncomfortable during the stress induction was 96.55%, and the number of subjects who felt uncomfortable during the recovery reached 12%. It indicates that the visual recovery environment is not comfortable for all.
In the auditory environment, the number of subjects who felt uncomfortable during the stress induction stage was as high as 100%, and the number who felt uncomfortable during the recovery stage was 0%. The results showed that all subjects felt uncomfortable during the stress induction stage, and most were comfortable during the recovery stage, indicating that audiovisual stimulation helps stress recovery.

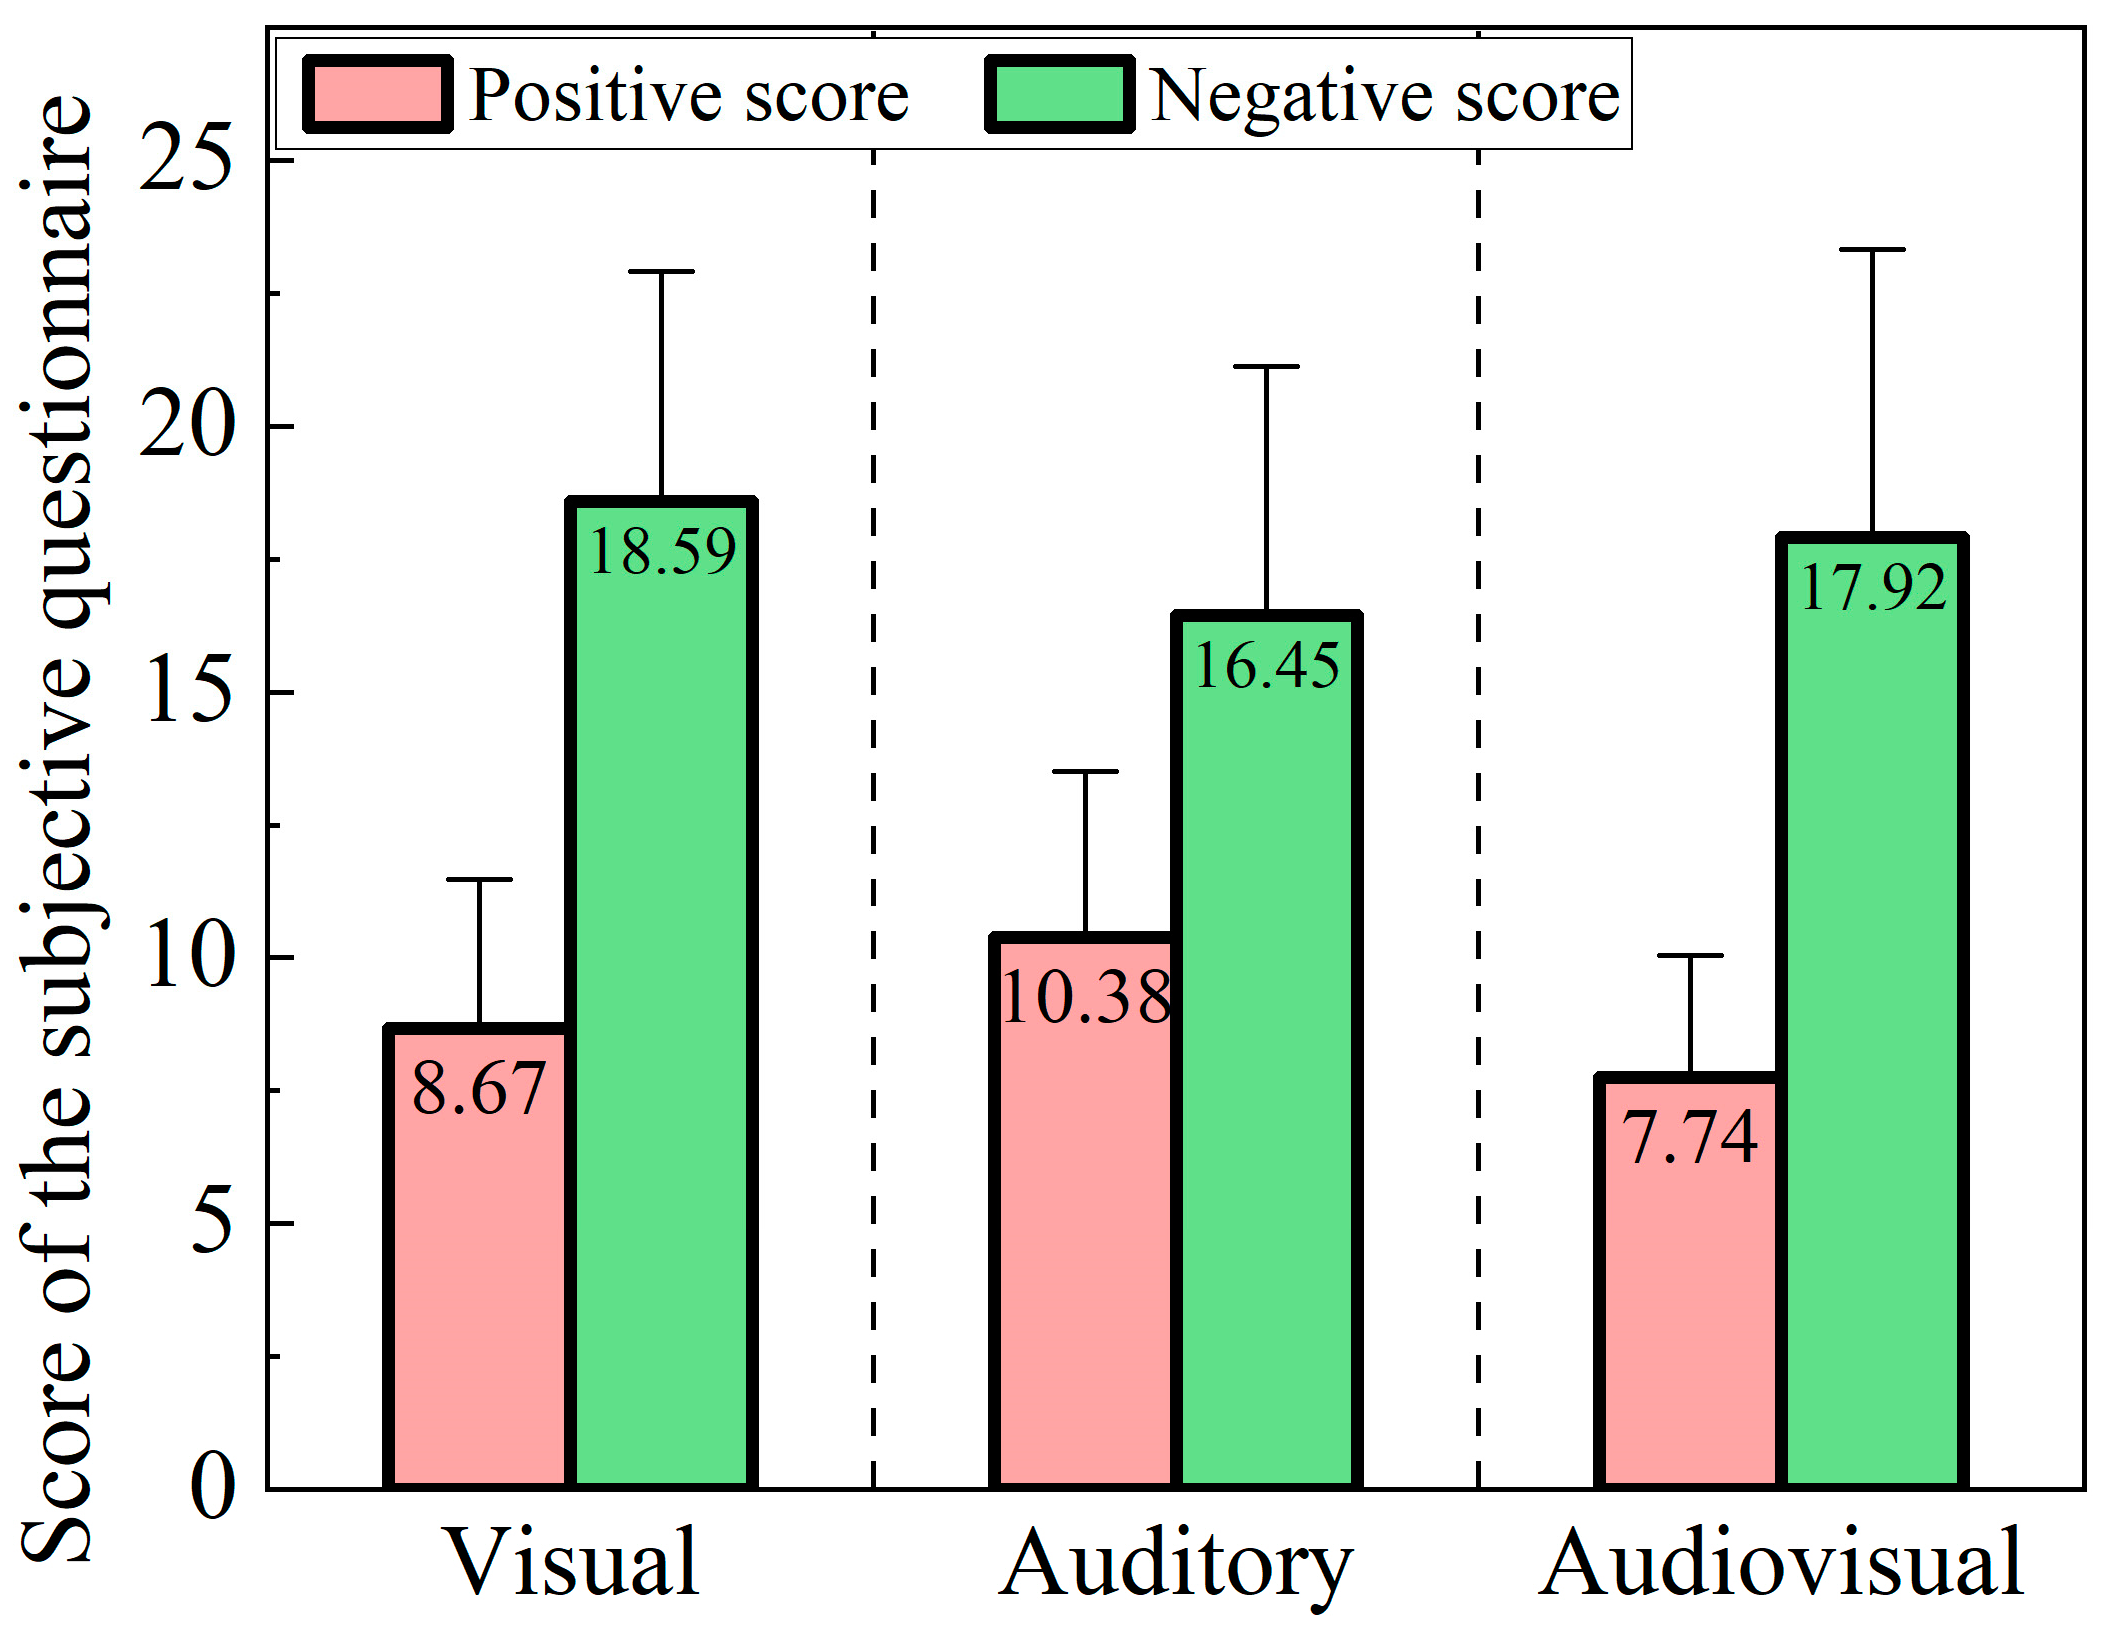
3.2. Subjective Questionnaire Results for Three Environments

In the previous section, the variation of the MERCNN model recognition results under different environments has been investigated. Nevertheless, the correctness of the stress induction and recovery stages cannot be fully verified by facial micro-expression recognition alone. Therefore, the results of the subjective questionnaires for the three environments need to be investigated. The results of the questionnaires for the visual, auditory, and audiovisual environments were pooled for the stress induction stage. The positive emotion scores and negative emotion scores were summed separately, and the results obtained are shown in Figure 7.
As shown in Figure 7, the subjects’ negative scores after noise stress stimulation were all higher than their positive mood. For example, in the visual environment, the positive vote was 8.67, and the negative vote was 18.59. During the stress induction stage, the negative scores for the three environments were 9.92, 6.07, and 10.18 points higher than the positive scores, respectively. This indicates that the subjects were in a negative and uncomfortable self-perception within this stage.
Next, the recovery’s positive and negative scores in visual, auditory, and audiovisual environments were summed separately. The experimental results are shown in Figure 8. From the figure, the positive emotions of the subjects were higher than the negative emotions after the restorative stimulation in all three modalities. It indicates that subjects were positive and comfortable after the therapeutic stimulation. The positive scores were 10.86, 12.31, and 12.70 points higher than the negative ones in the visual, auditory, and audiovisual restorative environments. After three types of therapeutic stimuli, the subjects showed an increase in positive and a decrease in negative emotions, indicating that the negative emotions due to the stressful stimuli were relieved. Because the same stress stimulus and recovery stimulus may affect each person differently, not all people’s questionnaire results were uncomfortable during the stress induction; not all people’s results showed comfort and stress recovery during the recovery. Therefore, the percentage of people who were uncomfortable during the stress induction and recovery under the three environments was counted according to the subjective questionnaire evaluation. The statistical results are shown in Table 4.
During the stress induction, the percentage of subjects who were uncomfortable under the visual environment was 96.55%; the percentage of subjects who were uncomfortable under the auditory and audiovisual environments was 100%. It indicates that the subjects were in an uncomfortable state with negative emotions and high psychological stress during stress provocation (noise).
The percentage of uncomfortable people during the recovery decreased substantially to 7.4% for the visual environment, 3.44% for the auditory environment, and 0% for the audiovisual environment. The subjects’ psychological stress and negative emotions were relieved after the recovery. It can be seen that the auditory and audiovisual means of recovery can better relieve people’s negative emotions and psychological stress. In contrast, 7.4% of people were still in an uncomfortable state during the recovery from the visual environment. The stress recovery effect of the visual recovery environment was the worst among the three environments.

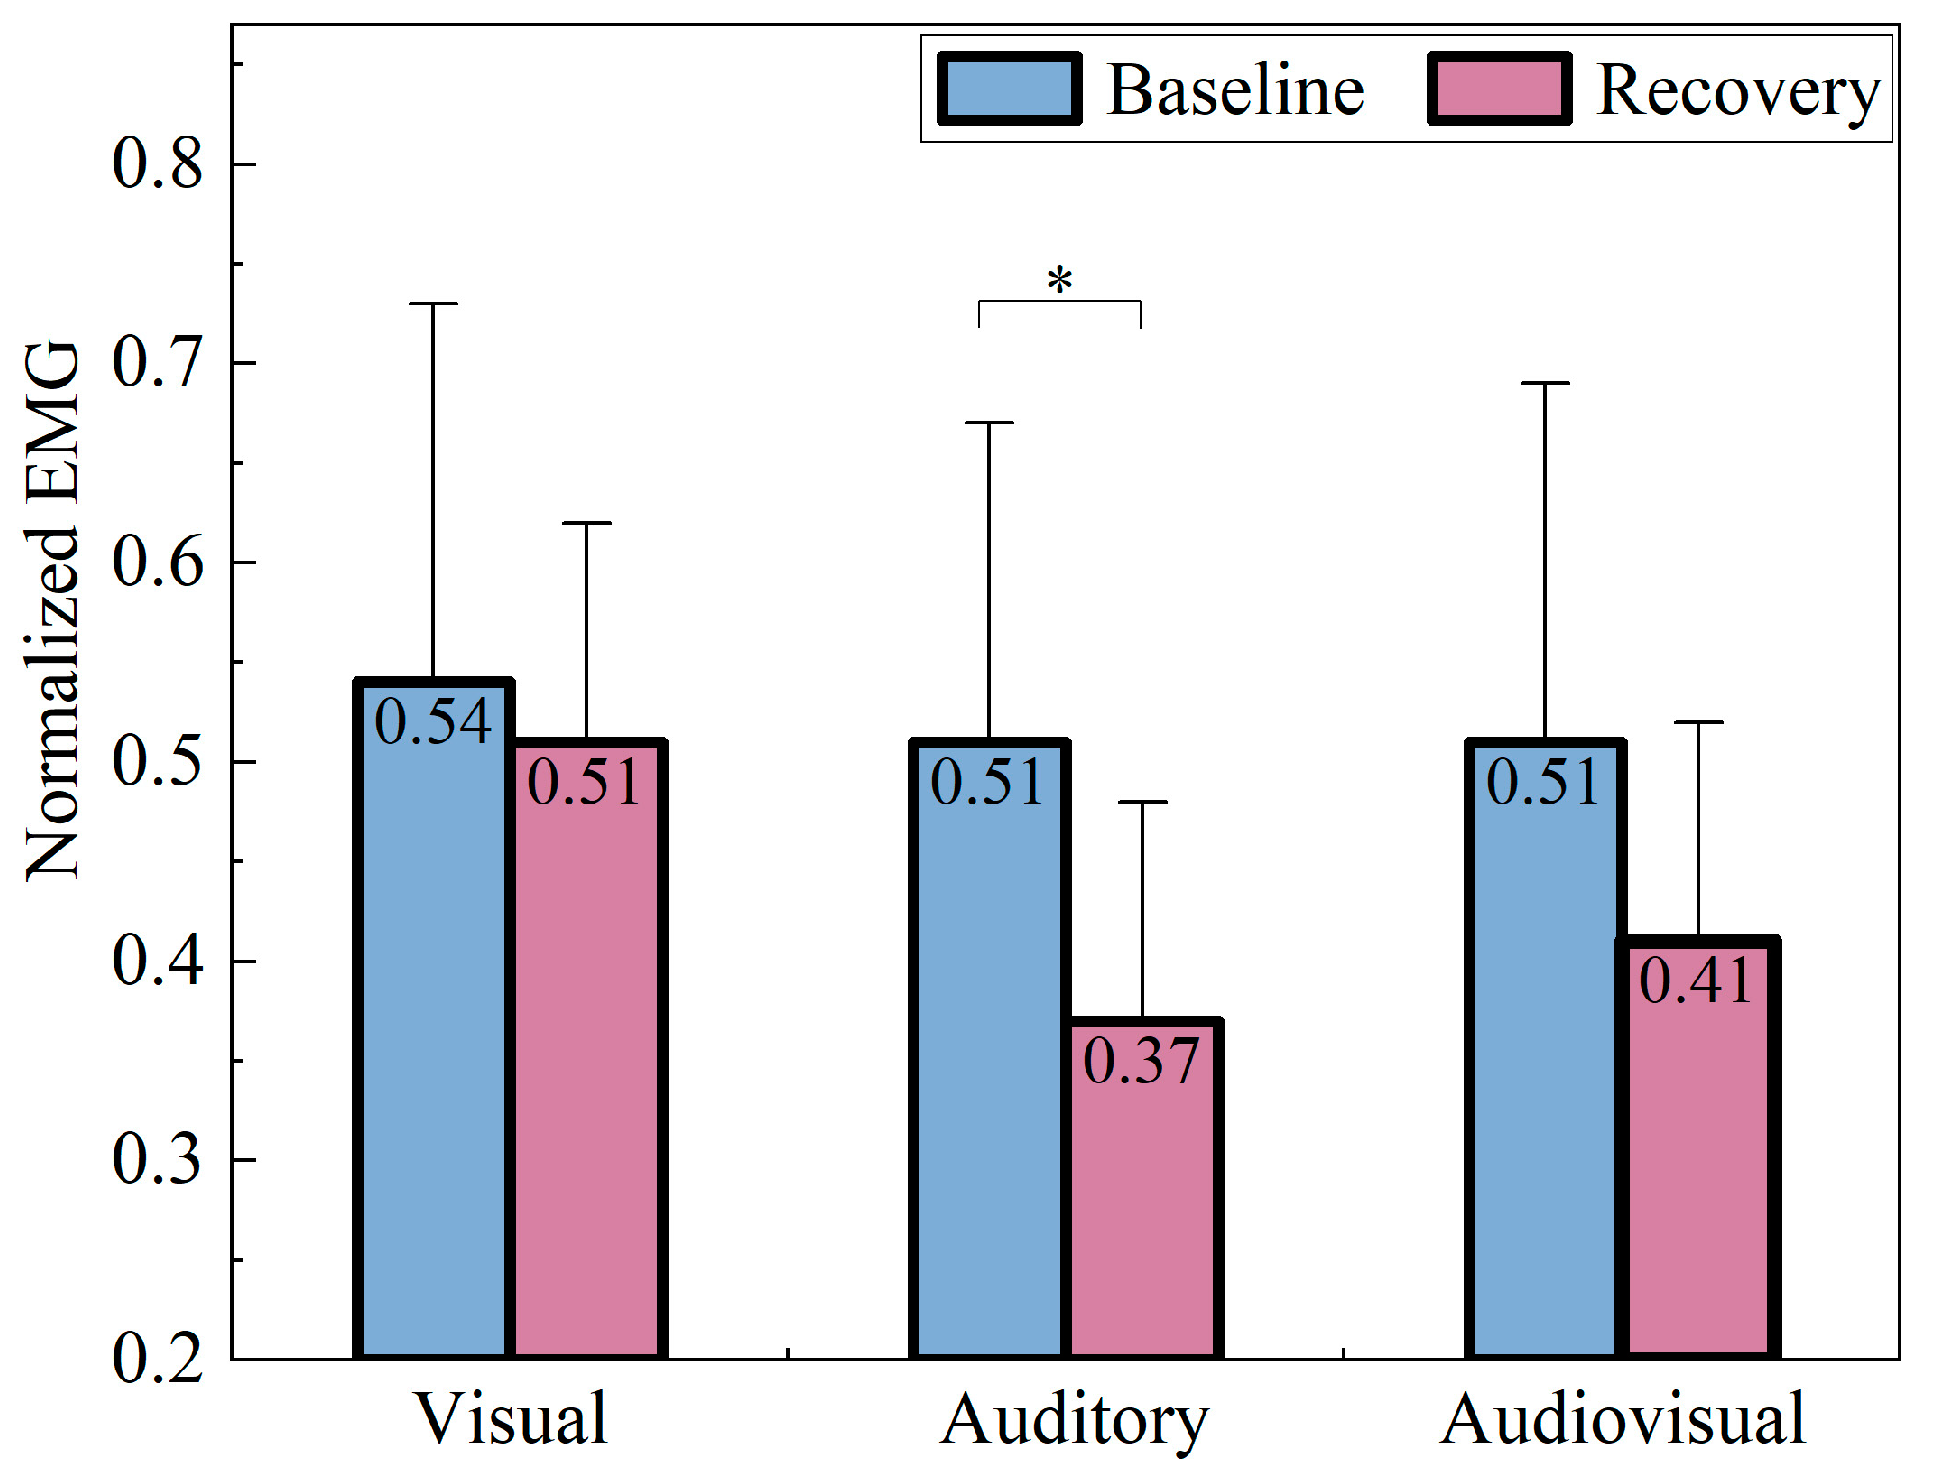
3.3. Results of Facial EMG under Three Environments

The above study is only a qualitative analysis, which shows that the three recovery environments are effective. Still, it is not possible to quantitatively compare the differences in recovery effects between visual, auditory, and audiovisual environments. Therefore, in this paper, the physiological parameter of the facial EMG signal was chosen to reflect the recovery effect of the human body.
The mean values of normalized EMG at different experimental stages in three environments are shown in Figure 9.
As shown in Figure 9a, in the visual environment, the mean EMG of the subjects increased from 0.54 to 0.76 (40.74% increase) from the baseline stage to the stress induction stage, which showed a significant difference in EMG between the two stages after paired t-test. Higher values in the graph indicate greater EMG signals and more intense corresponding muscle activity. This result indicates that the effect of applied pressure induction was significant, and the subjects’ facial muscle activity was enhanced. The mean EMG of the subjects in the recovery stage was 0.51 (a 32.89% decrease compared to the stress induction stage). The paired t-test showed a significant decrease in the mean EMG of the subjects during the recovery stage, indicating that the visual restorative stimulation had some restorative effect on the subjects’ psychological stress.
The changes in the mean EMG of the subjects in the three experimental stages of the auditory environment are shown in Figure 9b. The mean EMG showed an increasing and then decreasing trend, which was consistent with the trend in the visual environment. The mean EMG of the subjects in the baseline and stress induction stages were 0.51 and 0.81, respectively, and their degree of increase was 58.82%. A paired t-test revealed a significant difference between them, indicating that the subjects’ facial muscle activity significantly increased after stress induction, which reflected their increased psychological stress and negative moods. Then, from the stress induction stage to the recovery stage, the mean EMG of the subjects decreased from 0.81 to 0.37 (54.32% decrease), indicating that after the auditory restorative stimulation, the subjects’ psychological stress was effectively relieved when the facial muscles relaxed and the eyebrow area expression was relaxed.
The changes in the mean EMG of the subjects in the three experimental stages of the visual and auditory environments are shown in Figure 9c. The mean EMG change pattern of rising and falling was the same as the three stages in the visual and auditory stimulation environments. The mean EMG of subjects in the baseline and stress induction stages were 0.51 and 0.79, respectively, and increased by 54.90% after stress induction. The paired t-test results indicated a significant difference in the mean EMG between the two stages because of facial muscle contraction and increased psychological stress of the subjects. The mean EMG of the subjects decreased from 0.79 to 0.41 (48.10% decrease) from the stress induction stage to the recovery stage. The paired t-tests showed that the mean EMG was significantly lower for subjects in the recovery stage, indicating reduced facial muscle activity and psychological stress at this time. This indicates a significant effect of audiovisual restorative stimulation on the subjects’ psychological stress recovery.

4. Discussion

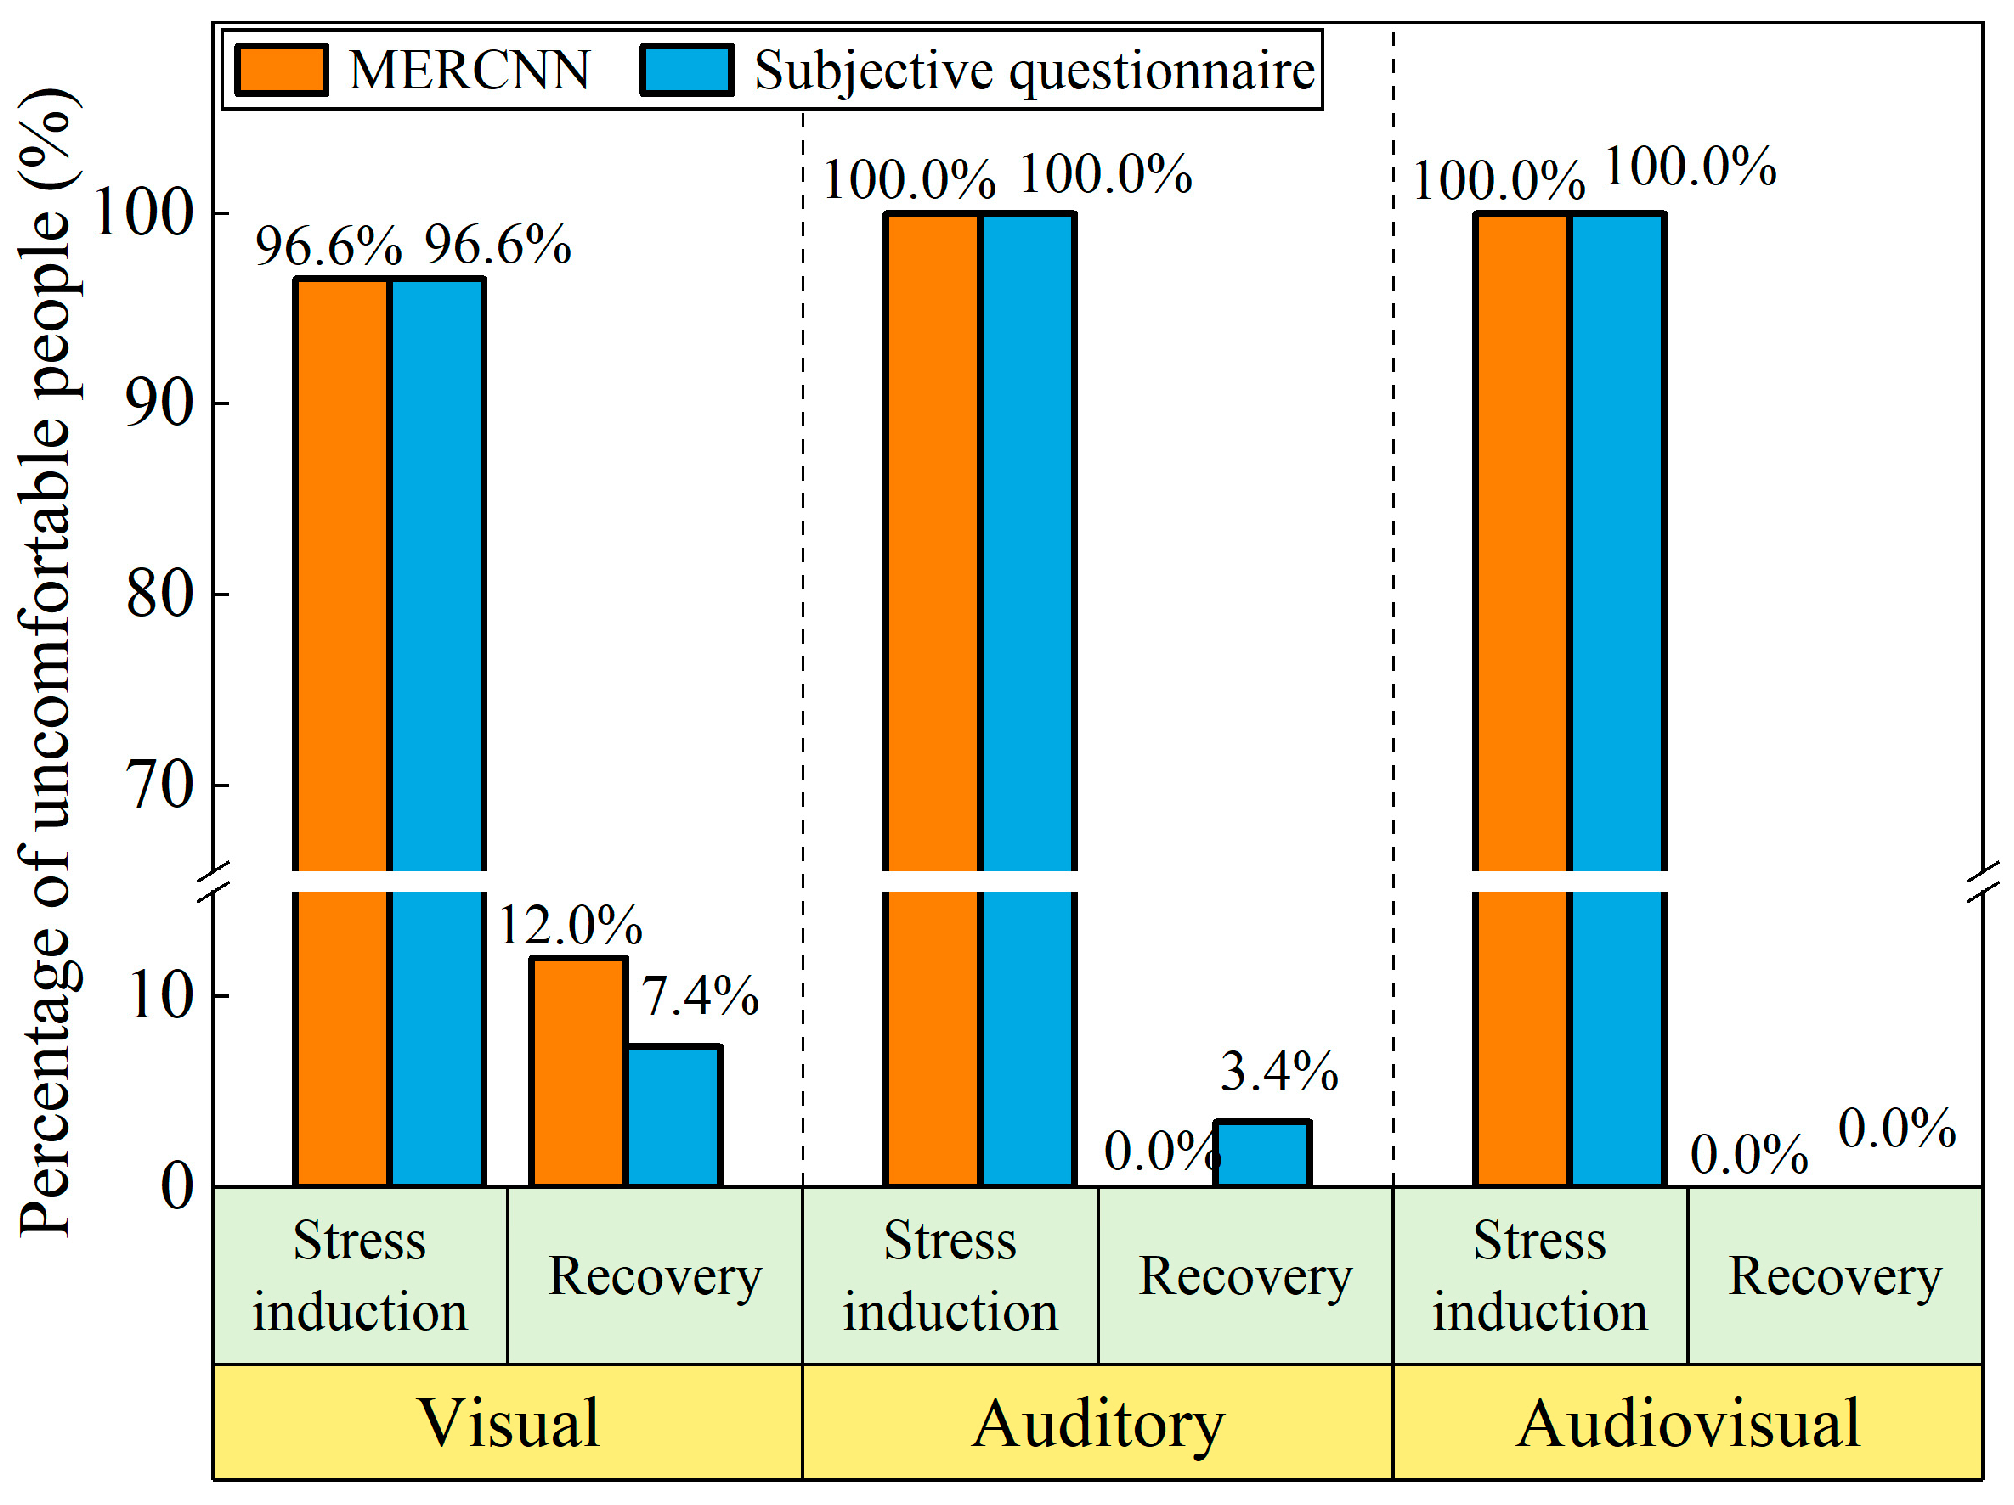
4.1. Comparative Analysis of Facial Micro-Expression Recognition and Subjective Questionnaire Results

The negative feelings score is subtracted from the positive feelings score, and the resultant difference can vary from −24 to 24 [50]. The micro-expression recognition results under different environments and the total score of the subjective questionnaire were plotted in a two-dimensional coordinate graph as shown in Figure 10. The horizontal axis is the MERCNN model results, ranging from 0 to 1, and the vertical axis is the positive emotion minus negative emotion score result, ranging from −24 to 24.
Figure 10 shows that the MERCNN evaluation and the subjective questionnaire are generally consistent during the stress induction and recovery stages. Most of the data in the stress induction stage show that the micro-expression recognition results are close to 1, and the questionnaire results are positive emotion score minus negative emotion score less than 0. The majority of the recovery stage data indicate that the findings of the micro-expression recognition are near to 0, and the results of the questionnaire are positive emotion score minus negative emotion score more than 0. The results showed that people were uncomfortable during the stress induction stage, while most were in the comfort zone during recovery. There were individual subjects whose MERCNN results were not consistent with the results of the questionnaire. The accuracy of the MERCNN model evaluation results under the three experimental conditions with the subjective questionnaire was 86% for the visual environment, 92.5% for the auditory environment, and 97.67% for the audiovisual environment.
The results show that the MERCNN model can identify the facial micro-expressions of different emotions of the subjects and then evaluate the comfort of the environment. The results of the MERCNN model and the subjective questionnaire indicated that the visual, auditory, and audiovisual recovery environments effectively relieve human psychological stress.
To represent the performance of the MERCNN model more visually, it is necessary to compare the results of the MERCNN model with the results of the subjective questionnaire. The percentages of uncomfortable people in the stress induction and recovery stages obtained by the MERCNN model and the subjective questionnaire are integrated into Figure 11.
The MERCNN model evaluation was consistent with the results of the subjective questionnaire in that the subjects showed discomfort during the stress induction stage. After a restorative stimulus environment, the psychological stress was relieved and the subjects felt comfortable. In subsequent studies, the MERCNN model can be used as a contactless means of indoor comfort evaluation.
In addition, both evaluation methods show that auditory and audiovisual recovery methods have a lower percentage of uncomfortable people during the recovery stage. It suggests that auditory and audiovisual recovery methods better relieve psychological stress than visual recovery methods.

4.2. Comparing the Recovery Effects of Different Environments

This section will determine which recovery environment has a better stress recovery effect by comparing the differences in EMG physiological indicators between the baseline and recovery stages. The results of the comparison are shown in Figure 12.
As can be seen from Figure 12, the differences in mean EMG during the baseline stage between the three environments were slight, indicating that subjects in different groups were in essentially the same stable mood during the baseline stage. After the recovery, the mean EMG all decreased compared to the baseline stage. Still, the magnitude of the decrease was different, indicating that the recovery effect varied with different sensory stimuli. The mean EMG in the visual, auditory, and audiovisual environments decreased by 5.56%, 27.45%, and 19.61%, respectively, compared to the values in the baseline stage. The paired t-test was then performed on the EMG in both the baseline and recovery stages with a confidence interval of 95%, i.e., α = 0.05. The results showed a significant decrease in the EMG index compared to the baseline level in the auditory environment. However, there was no significant difference in EMG between the baseline and recovery stages in the visual and the audiovisual environments, except for a slightly lower level of EMG in the recovery stage. In summary, the auditory recovery environment was most effective in the recovery of facial EMG.

4.3. Comparison with Results from Other Studies

This paper investigated the difference in the effects of three types of indoor recovery environments on human stress recovery. The current results suggest that participants felt stress upon hearing the noise, which is similar to the findings of Cassina L [53]. Preis A pointed out that when the scene does not match the audio content, it can affect perception [54]. Yang X found that when the sound remains the same, changes in the scene can influence people’s evaluations of the environment [55]. This study found that the recovery effect of the auditory condition was better than that of the audio-visual condition. All these findings indicate that visual factors have a certain impact on the perception of the environment.

4.4. Limitations and Future Research

This study used a subjective questionnaire combined with a facial micro-expression intelligence system to verify whether different auditory and visual environments are restorative. Subsequently, it evaluated the changes in psychological stress by EMG, which still has some limitations. First, the validated MERCNN model can qualitatively identify stress situations but lacks the ability to quantify mental stress levels. Second, this study was performed only on visual landscapes and soundscapes, while humans have five senses and stress recovery may be related to more than just visual and soundscapes. Olfactory, tactile, and gustatory exposures, as well as their interactions, possess the potential to contribute to psychological recovery.
The effects of including all five senses and their interactions on stress recovery will be studied in the future. New research ideas will be provided for the future enhancement of indoor comfort.

5. Conclusions

This study revealed the stress recovery of the human body under different recovery environments, including visual, auditory, and audiovisual settings. There are several innovations in this study. First, single, and comprehensive indoor environmental factors are considered, and their effects on stress recovery are examined. Next, in this study, a combination of the subjective questionnaire, the physiological indicator, and the MERCNN model was employed to determine human mental stress. The accuracy of the model is also validated.
The following conclusions were ultimately reached.
  • Changes in micro-expressions occur when stimulated by stress. Facial micro-expression recognition and facial EMG can be used as assessment methods for psychological stress.
  • Natural visual, auditory, and audiovisual environments help relieve human mental stress.
  • The analysis of the results of the emotional subjective questionnaire and MERCNN model in different visual-acoustic environments revealed a high degree of consistency between the two results.
  • The results of the facial EMG showed that the recovery effect in the auditory and the audiovisual environments was better than that in the visual environment.
This study demonstrated that visual and auditory stimuli with natural elements were helpful for stress recovery in humans. In practice, the results of this study could provide some references for the design of indoor environments, helping to create a space that alleviates occupants’ stress and enhances productivity and health.

Author Contributions

All authors contributed to the study conception and design. Material preparation and data collection were performed by Y.Y.; Data analysis was performed by G.L. and P.H.; The method was suggested by J.S.; The first draft of the manuscript was written by G.L. and J.Z.; G.L., P.H., H.Z. (Huiyang Zhong) and Y.J. commented on previous versions of the manuscript. H.Z. (Hui Zhu) and S.H. Supervised the progress of the research. All authors have read and agreed to the published version of the manuscript.

Funding

This work was supported by a grant from the National Natural Science Foundation of China (Grant No. 52378101) and the Youth Project of the Natural Science Foundation of Shandong Province (Grant No. ZR2022QE075). We also thank those subjects who participated in this experiment.

Institutional Review Board Statement

The study was conducted in accordance with the Declaration of Helsinki. The experiment protocol was approved by the Ethics Committee of Qingdao University (QDU-HEC-2023084).

Informed Consent Statement

Informed consent for participation was obtained from all subjects involved in the study.

Data Availability Statement

Data are not publicly available due to restrictions regarding the privacy of the participants.

Conflicts of Interest

The authors declare that they have no known competing financial interests or personal relationships that could have appeared to influence the work reported in this paper.

References

  1. Esslinger, G.E. Human Health and the Indoor Environment: An Analysis of Building Materials and Sustainable Architecture. Doctoral Dissertation, The University of Texas at Austin, Austin, TX, USA, 2020. [Google Scholar] [CrossRef]
  2. Cai, M.; Xiang, L.Y.; Ng, E. How does the visual environment influence pedestrian physiological stress? Evidence from high-density cities using ambulatory technology and spatial machine learning. Sust. Cities Soc. 2023, 96, 14. [Google Scholar] [CrossRef]
  3. Chandola, T.; Heraclides, A.; Kumari, M. Psychophysiological biomarkers of workplace stressors. Neurosci. Biobehav. Rev. 2010, 35, 51–57. [Google Scholar] [CrossRef] [PubMed]
  4. Olafsdottir, G.; Cloke, P.; Schulz, A.; Van Dyck, Z.; Eysteinsson, T.; Thorleifsdottir, B.; Vögele, C. Health Benefits of Walking in Nature: A Randomized Controlled Study Under Conditions of Real-Life Stress. Environ. Behav. 2020, 52, 248–274. [Google Scholar] [CrossRef]
  5. Ulrich, R.S.; Simons, R.F.; Losito, B.D.; Fiorito, E.; Miles, M.A.; Zelson, M. Stress recovery during exposure to natural and urban environments. J. Environ. Psychol. 1991, 11, 201–230. [Google Scholar] [CrossRef]
  6. Elsadek, M.; Liu, B. Effects of viewing flowering plants on employees’ wellbeing in an office-like environment. Indoor Built Environ. 2021, 30, 1429–1440. [Google Scholar] [CrossRef]
  7. Dannenmaier, M. Healing gardens. Landsc. Archit. 1995, 85, 56. [Google Scholar]
  8. Ulrich, R. Archive: Reports: The Effect of Healthcare Architecture and Art on Medical Outcomes. Reports on Arts Council England Architecture Week Event. 25 June 2003. Available online: https://www.mendeley.com/catalogue/da92a65d-2da3-3439-b28e-5b48cf9bef00/ (accessed on 25 August 2024).
  9. Evensen, K.H.; Raanaas, R.K.; Hagerhall, C.M.; Johansson, M.; Patil, G.G. Restorative Elements at the Computer Workstation. Environ. Behav. 2015, 47, 288–303. [Google Scholar] [CrossRef]
  10. Han, K.-T. Influence of Limitedly Visible Leafy Indoor Plants on the Psychology, Behavior, and Health of Students at a Junior High School in Taiwan. Environ. Behav. 2009, 41, 658–692. [Google Scholar] [CrossRef]
  11. Mehaffy, M. Biophilic Design: The Theory, Science, and Practice of Bringing Buildings to Life. Proc. Inst. Civ. Eng. Urban Des. Plan. 2012, 165, 193. [Google Scholar] [CrossRef]
  12. Lipovac, D.; Burnard, M.D. Effects of visual exposure to wood on human affective states, physiological arousal and cognitive performance: A systematic review of randomized trials. Indoor Built Environ. 2021, 30, 1021–1041. [Google Scholar] [CrossRef]
  13. van den Berg, M.; Maas, J.; Muller, R.; Braun, A.; Kaandorp, W.; van Lien, R.; van Poppel, M.N.M.; van Mechelen, W.; van den Berg, A.E. Autonomic Nervous System Responses to Viewing Green and Built Settings: Differentiating Between Sympathetic and Parasympathetic Activity. Int. J. Environ. Res. Public Health 2015, 12, 15860–15874. [Google Scholar] [CrossRef] [PubMed]
  14. Zhang, X.; Ba, M.; Kang, J.; Meng, Q. Effect of soundscape dimensions on acoustic comfort in urban open public spaces. Appl. Acoust. 2018, 133, 73–81. [Google Scholar] [CrossRef]
  15. Golmohammadi, R.; Aliabadi, M.; Nezami, T. An Experimental Study of Acoustic Comfort in Open Space Banks Based on Speech Intelligibility and Noise Annoyance Measures. Arch. Acoust. 2017, 42, 333–345. [Google Scholar] [CrossRef]
  16. Yang, W.; Kang, J. Acoustic comfort evaluation in urban open public spaces. Appl. Acoust. 2005, 66, 211–229. [Google Scholar] [CrossRef]
  17. Michels, N.; Hamers, P. Nature Sounds for Stress Recovery and Healthy Eating: A Lab Experiment Differentiating Water and Bird Sound. Environ. Behav. 2023, 55, 175–205. [Google Scholar] [CrossRef]
  18. Naef, A.C.; Jeitziner, M.-M.; Knobel, S.E.J.; Exl, M.T.; Müri, R.M.; Jakob, S.M.; Nef, T.; Gerber, S.M. Investigating the role of auditory and visual sensory inputs for inducing relaxation during virtual reality stimulation. Sci. Rep. 2022, 12, 17073. [Google Scholar] [CrossRef]
  19. Li, Z.Z.; Ba, M.H.; Kang, J. Physiological indicators and subjective restorativeness with audio-visual interactions in urban soundscapes. Sust. Cities Soc. 2021, 75, 103360. [Google Scholar] [CrossRef]
  20. Xu, Z.; Yang, M.; Yu, L. Identification, Evaluation, and Influencing Factors of Soundscapes in Public Open Spaces in High-Density Residential Areas. Applied Sciences 2024, 14, 6946. [Google Scholar] [CrossRef]
  21. Kroll, S.L.; Mayo, L.M.; Asratian, A.; Yngve, A.; Perini, I.; Heilig, M. Negative self-evaluation induced by acute stress indexed using facial EMG. Psychoneuroendocrinology 2021, 133, 105402. [Google Scholar] [CrossRef] [PubMed]
  22. Hong, X.C.; Cheng, S.; Liu, J.; Dang, E.; Wang, J.B.; Cheng, Y.N. The Physiological Restorative Role of Soundscape in Different Forest Structures. Forests 2022, 13, 1920. [Google Scholar] [CrossRef]
  23. Lazarus, R.S. Stress and Emotion: A New Synthesis; Springer Publishing Company: Berlin/Heidelberg, Germany, 2006. [Google Scholar]
  24. Goldman, A.I.; Sripada, C.S. Simulationist models of face-based emotion recognition. Cognition 2005, 94, 193–213. [Google Scholar] [CrossRef] [PubMed]
  25. Vuilleumier, P.; Pourtois, G. Distributed and interactive brain mechanisms during emotion face perception: Evidence from functional neuroimaging. Neuropsychologia 2007, 45, 174–194. [Google Scholar] [CrossRef] [PubMed]
  26. Scherer, K.R. Voice, Stress, and Emotion; Springer US: Boston, MA, USA, 1986; pp. 157–179. [Google Scholar] [CrossRef]
  27. Chen, Y.M.; Yang, Z.L.; Wang, J.P. Eyebrow emotional expression recognition using surface EMG signals. Neurocomputing 2015, 168, 871–879. [Google Scholar] [CrossRef]
  28. Cacioppo, J.T.; Petty, R.E.; Losch, M.E.; Kim, H.S. Electromyographic activity over facial muscle regions can differentiate the valence and intensity of affective reactions. J. Personal. Soc. Psychol. 1986, 50, 260–268. [Google Scholar] [CrossRef]
  29. Sloan, D.M.; Bradley, M.M.; Dimoulas, E.; Lang, P.J. Looking at facial expressions: Dysphoria and facial EMG. Biol. Psychol. 2002, 60, 79–90. [Google Scholar] [CrossRef] [PubMed]
  30. Kim, H.; Zhang, D.; Kim, L.; Im, C.H. Classification of Individual’s discrete emotions reflected in facial microexpressions using electroencephalogram and facial electromyogram. Expert Syst. Appl. 2022, 188, 116101. [Google Scholar] [CrossRef]
  31. Künecke, J.; Hildebrandt, A.; Recio, G.; Sommer, W.; Wilhelm, O. Facial EMG Responses to Emotional Expressions Are Related to Emotion Perception Ability. PLoS ONE 2014, 9, e84053. [Google Scholar] [CrossRef]
  32. Mohan, K.; Seal, A.; Krejcar, O.; Yazidi, A. Facial Expression Recognition Using Local Gravitational Force Descriptor-Based Deep Convolution Neural Networks. IEEE Trans. Instrum. Meas. 2021, 70, 1–12. [Google Scholar] [CrossRef]
  33. Golland, Y.; Hakim, A.; Aloni, T.; Schaefer, S.; Levit-Binnun, N. Affect dynamics of facial EMG during continuous emotional experiences. Biol. Psychol. 2018, 139, 47–58. [Google Scholar] [CrossRef] [PubMed]
  34. Okada, G.; Yonezawa, T.; Kurita, K.; Tsumura, N. [Paper] Monitoring Emotion by Remote Measurement of Physiological Signals Using an RGB Camera. ITE Trans. Media Technol. Appl. 2018, 6, 131–137. [Google Scholar] [CrossRef]
  35. Torre, F.D.L.; Chu, W.S.; Xiong, X.; Vicente, F.; Cohn, J. IntraFace. In Proceedings of the 2015 11th IEEE International Conference and Workshops on Automatic Face and Gesture Recognition (FG), Ljubljana, Slovenia, 4–8 May 2015. [Google Scholar] [CrossRef]
  36. Hu, S.T.; Sun, J.; Zhang, J.; Liu, G.D.; Zhao, S.P. Thermoacoustic environment comfort evaluation method based on facial micro-expression recognition. Build. Environ. 2022, 221, 109263. [Google Scholar] [CrossRef]
  37. Lan, L.; Lian, Z. Application of statistical power analysis—How to determine the right sample size in human health, comfort and productivity research. Build. Environ. 2010, 45, 1202–1213. [Google Scholar] [CrossRef]
  38. Seppänen, O.A.; Fisk, W. Some Quantitative Relations between Indoor Environmental Quality and Work Performance or Health. HVAC&R Res. 2006, 12, 957–973. [Google Scholar] [CrossRef]
  39. Zhu, H.; Wang, H.Q.; Liu, Z.Q.; Li, D.R.; Kou, G.X.; Li, C. Experimental study on the human thermal comfort based on the heart rate variability (HRV) analysis under different environments. Sci. Total Environ. 2018, 616, 1124–1133. [Google Scholar] [CrossRef] [PubMed]
  40. Dang, Y.; Liu, Z.; Yang, X.; Ge, L.; Miao, S. A fatigue assessment method based on attention mechanism and surface electromyography. Internet Things Cyber-Phys. Syst. 2023, 3, 112–120. [Google Scholar] [CrossRef]
  41. Tagawa, Y.; Maskeliūnas, R.; Damaševičius, R. Acoustic Anomaly Detection of Mechanical Failures in Noisy Real-Life Factory Environments. Electronics 2021, 10, 2329. [Google Scholar] [CrossRef]
  42. Miedema, H.M.; Oudshoorn, C.G. Annoyance from transportation noise: Relationships with exposure metrics DNL and DENL and their confidence intervals. Environ. Health Perspect. 2001, 109, 409–416. [Google Scholar] [CrossRef]
  43. Rossi, L.; Prato, A.; Lesina, L.; Schiavi, A. Effects of low-frequency noise on human cognitive performances in laboratory. Build. Acoust. 2018, 25, 17–33. [Google Scholar] [CrossRef]
  44. Minichilli, F.; Gorini, F.; Ascari, E.; Bianchi, F.; Coi, A.; Fredianelli, L.; Licitra, G.; Manzoli, F.; Mezzasalma, L.; Cori, L. Annoyance Judgment and Measurements of Environmental Noise: A Focus on Italian Secondary Schools. Int. J. Environ. Res. Public Health 2018, 15, 208. [Google Scholar] [CrossRef]
  45. Reuter, C.; Oehler, M. Psychoacoustics of chalkboard squeaking. J. Acoust. Soc. Am. 2011, 130, 2545. [Google Scholar] [CrossRef]
  46. Westman, J.C.; Walters, J.R. Noise and stress: A comprehensive approach. Environ. Health Perspect. 1981, 41, 291–309. [Google Scholar] [CrossRef] [PubMed]
  47. Kreutz, G.; Quiroga Murcia, C.; Bongard, S. Psychoneuroendocrine Research on Music and Health: An Overview; Oxford University Press: Oxford, UK, 2012; pp. 458–476. [Google Scholar] [CrossRef]
  48. Nicol, J.F.; Humphreys, M.A. Adaptive thermal comfort and sustainable thermal standards for buildings. Energy Build. 2002, 34, 563–572. [Google Scholar] [CrossRef]
  49. Shuttleworth, S. The use of photographs as an environmental presentation medium in landscape studies. Environ. Manag. J. Environ. Manag. 1980, 11, 61–76. [Google Scholar]
  50. Diener, E.; Wirtz, D.; Biswas-Diener, R.; Tov, W.; Kim-Prieto, C.; Choi, D.-W.; Oishi, S. New Measures of Well-Being; Springer: Dordrecht, The Netherlands, 2009; pp. 247–266. [Google Scholar] [CrossRef]
  51. Diener, E.; Wirtz, D.; Tov, W.; Kim-Prieto, C.; Choi, D.-W.; Oishi, S.; Biswas-Diener, R. New Well-being Measures: Short Scales to Assess Flourishing and Positive and Negative Feelings. Soc. Indic. Res. 2010, 97, 143–156. [Google Scholar] [CrossRef]
  52. Vinutha, H.P.; Poornima, B.; Sagar, B.M. Detection of Outliers Using Interquartile Range Technique from Intrusion Dataset; Springer: Singapore, 2018; pp. 511–518. [Google Scholar] [CrossRef]
  53. Cassina, L.; Fredianelli, L.; Menichini, I.; Chiari, C.; Licitra, G. Audio-Visual Preferences and Tranquillity Ratings in Urban Areas. Environments 2017, 5, 1. [Google Scholar] [CrossRef]
  54. Preis, A.; Hafke-Dyx, H.; Szychowska, M.; Kocinski, J.; Felcyn, J. Audio-visual interaction of environmental noise. Noise Control. Eng. J. 2016, 64, 34–43. [Google Scholar] [CrossRef]
  55. Yang, X.; Kang, J. Effect of Audio–Visual Factors in the Evaluation of Crowd Noise. Appl. Sci. 2023, 13, 3652. [Google Scholar] [CrossRef]
Figure 1. Floor plan of the laboratory.
Buildings 14 03122 g001
Figure 2. Audio spectrum.
Buildings 14 03122 g002
Figure 3. Restorative environment pictures.
Buildings 14 03122 g003
Figure 4. Experimental procedure.
Buildings 14 03122 g004
Figure 5. Mean values of uncomfortable probability during the stress induction and recovery stages.
Buildings 14 03122 g005
Figure 6. Percentage of uncomfortable people in the stress induction and recovery stages.
Buildings 14 03122 g006
Figure 7. Score of the subjective questionnaire for the stress induction of the three environments.
Buildings 14 03122 g007
Figure 8. Score of the subjective questionnaire for the recovery of the three environments.
Buildings 14 03122 g008
Figure 9. Mean values of normalized EMG in three types of environments. Note. * p < 0.05, 95% confidence intervals.
Buildings 14 03122 g009
Figure 10. Scatter plot of MERCNN evaluation and questionnaire results.
Buildings 14 03122 g010
Figure 11. Percentage of uncomfortable people during the stress induction and recovery stages obtained by MERCNN and questionnaire.
Buildings 14 03122 g011
Figure 12. Comparison of mean values of normalized EMG between baseline and recovery stages. Note. * p < 0.05, 95% confidence intervals.
Buildings 14 03122 g012
Table 1. Brief information of subjects (mean ± SD).
GenderNumber of
Subjects
Age (Years)Height (cm)Weight (kg)
Male1423.23 ± 0.83177.23 ± 3.5973.13 ± 12.44
Female1422.38 ± 0.60163.38 ± 5.3758.25 ± 8.36
Table 2. Test equipment and information.
NameParametersEquipment DiagramType, Manufacturer, CountryMeasurement Range
EMG acquisition equipmentEMG signalsBuildings 14 03122 i001MyoWare Muscle Sensor, Advancer Technologies, USA0~1500 Hz
CameraMicro-expressionBuildings 14 03122 i002Mosengsm Q15, Mosengsm, ChinaP480
Table 3. Subjective questionnaire.
EmotionsRating
12345
Positive
Good
Pleasant
Happy
Joyful
Contented
Negative
Bad
Unpleasant
Sad
Afraid
Angry
NOTE: 1 = Very rarely or never; 2 = rarely; 3 = Sometimes; 4 = Often; 5 = Very often or always.
Table 4. Percentage of uncomfortable people evaluated by the subjective questionnaire.
Experimental StageExperimental Conditions
VisualAuditoryAudiovisual
Stress induction96.55%100%100%
Recovery7.4%3.44%0%
Disclaimer/Publisher’s Note: The statements, opinions and data contained in all publications are solely those of the individual author(s) and contributor(s) and not of MDPI and/or the editor(s). MDPI and/or the editor(s) disclaim responsibility for any injury to people or property resulting from any ideas, methods, instructions or products referred to in the content.

