
Development of Worth Estimation and Key Target Selection Methods for Effective VE


Abstract
:1. Introduction
1.1. Research Background and Purpose
- (1)
- Collect cost data from the Public Procurement Service Construction Cost Information Plaza and digitize it into a database, and establish standard costs for each type of construction to serve as the basis for determining the “Worth”.
- (2)
- Set user value to consider weights according to user requirements.
- (3)
- Establish the value index (VI) as the benchmark for VE target selection.
1.2. Scope and Progress of Research
2. Literature Review
3. Method of Research
4. Results of the Study

4.1. Data Analysis of Construction Cost Information Plaza Website
4.2. Estimating Cost Worth C
- Worth C: Cost by Detailed Construction Item Worth (Cost);
- Worth V: Customer Value by Detailed Construction Item Worth (Value);
- Worth F: Worth by Detailed Construction Item (Final) = Worth C × Worth V Weight.
4.3. Calculating the Customer Value Worth V
4.4. Derive the Final Worth F
4.5. Value Index (VI) Calculation
4.6. Derivation of Value Index (VI) Standard Value
4.7. Selection of Key Target Construction Types (Functions)
5. Model Validation and Effect
5.1. Selection of the Respective Project
5.2. Calculate the Cost of the Target Sample Worth C
5.3. Calculation of Customer Value Worth V and Final Worth F
5.4. Derivation of Value Index (VI) and Standard Value
5.5. Selection and Analysis of Key Target Categories (Functions)
6. Conclusions
Author Contributions
Funding
Data Availability Statement
Conflicts of Interest
References
- Algase, D.; Bolton, J.; Kirk, S.; Lenzer, B.; Rains, J. The Value Methodology Memory Jogger, 2nd ed.; SAVE International: Mount Royal, NJ, USA, 2018; pp. ix–x. ISBN 978-1-57681-203-7. [Google Scholar]
- SAVE International. VM Guide; SAVE International: Mount Royal, NJ, USA, 2020; pp. 2–15. ISBN 978-1-7350880-0-6. [Google Scholar]
- Liu, J.N.; Qiao, L.; Park, J.Y.; Kim, B.S. VE Alternative Verification Method Using KANO Model. J. Korean Soc. Civ. Eng. 2019, 39, 923–932. [Google Scholar]
- Heo, W.-Y. The Methodology of Decision Making for VE Components by Cost Index of Building Work. Ph.D. Thesis, Hoseo University, Asan-si, Republic of Korea, 2022; pp. 3–11. [Google Scholar]
- Jung, B.J. VE Object Selection Method of Express Way by Value Index. Master’s Thesis, Pu-Kyong National University, Busan, Republic of Korea, 2010; pp. 16, 37–41. [Google Scholar]
- Yoon, S.-H. A Study on the Improvement for Cost Modelling Techniques in the Construction VE. Master’s Thesis, University of Seoul, Seoul, Republic of Korea, 2001; pp. i–iii. [Google Scholar]
- Lee, H.-S. An Improvement of the Quantity Take-off Process for Reducing Errors during Detailed Design Development of Building Projects. Master’s Thesis, Chung-Ang University, Seoul, Republic of Korea, 2014; pp. 9, 12–14. [Google Scholar]
- Construction Cost Information Plaza. Available online: https://pcae.g2b.go.kr:8044/pbs/psa/psa0000/index.do (accessed on 25 November 2023).
- de Graaf, R.; Van der Linde, G.; De Jong, H.; Vogt, B. Value Engineering as a Specialty for Systems Engineering: Exploring Opportunities. Insight 2019, 22, 41–44. [Google Scholar] [CrossRef]
- Ilayaraja, K.; Eqyaabal, M.Z. Value engineering in construction. Indian J. Sci. Technol. 2015, 8, 1–8. [Google Scholar] [CrossRef]
- Behncke, F.G.; Maisenbacher, S.; Maurer, M. Extended model for integrated value engineering. Procedia Comput. Sci. 2014, 28, 781–788. [Google Scholar] [CrossRef]
- Rahman, H.Z. Enhancing value for money of mega infrastructure projects. Procedia Technol. 2014, 16, 1037–1046. [Google Scholar]
- Al-Muaybid, A.I.; Abdulghafour, A.; Mlybari, E.A. Value Engineering Role in Construction Sustainability during COVID-19 Pandemic in KSA. Indian J. Sci. Technol. 2022, 15, 518–526. [Google Scholar] [CrossRef]
- Nejatyan, E.; Sarvari, H.; Hosseini, S.A.; Javanshir, H. Determining the Factors Influencing Construction Project Management Performance Improvement through Earned Value-Based Value Engineering Strategy: A Delphi-Based Survey. Buildings 2023, 13, 1964. [Google Scholar] [CrossRef]
- Chen, W.T.; Merrett, H.C.; Liu, S.S.; Fauzia, N.; Liem, F.N. A decade of value engineering in construction projects. Adv. Civ. Eng. 2022, 2022, 2324277. [Google Scholar] [CrossRef]
- Jin, L.; Yin, Y.; Du, F.; Yuan, H.; Zheng, C. Impact of Engineering Changes on Value Movement in Fund Flow: Monte Carlo-System Dynamics Modeling Approach. Buildings 2023, 13, 2218. [Google Scholar] [CrossRef]
- Song, C.Y.; Yang, B.S. Development of Mobile-Based Design Value Engineering (VE) Supporting System for VE Process Improvement. J. Korea Inst. Build. Constr. 2021, 21, 433–443. [Google Scholar]
- Park, C.Y.; Yun, S.; Lee, D.E. Establishing the Strategy of Effective Construction VE for Construction Firms. Korean J. Constr. Eng. Manag. 2021, 22, 80–87. [Google Scholar]
- Ikhbayar, K.; Jin, C.; Hyun, C.T.; Lee, S. A process for Reviewing the Applicability of VE Alternatives using BIM-based VR. Proc. Korean Inst. Build. Constr. Conf. 2021, 21, 89–90. [Google Scholar]
- Park, B.S.; Kim, O.K. A Study on the Application of Design VE Process in Pre-Construction Phase for GMP Determination of CM at Risk Project. Korean J. Constr. Eng. Manag. 2022, 23, 56–64. [Google Scholar]
- Lee, D.H. An Efficient Owner’s Requirements Reflecting Process at the Planning Stage of the Building Project. Ph.D. Thesis, Chung-Ang University, Seoul, Republic of Korea, 2006; p. 4. [Google Scholar]
- Jeong, H.G. Improvement of the Design Phase VE Selection by the Analysis of the Required Items of Owners, Users and Experts in the Apartment. Master’s Thesis, Dong Eui University, Busan, Republic of Korea, 2008; p. 2. [Google Scholar]
- Chen, W.T.; Chang, P.-Y.; Huang, Y.-H. Assessing the overall performance of value engineering workshops for construction projects. Int. J. Proj. Manag. 2010, 28, 514–527. [Google Scholar] [CrossRef]
- Jae, H.S. A Study on Method for Effective Function Definition of Construction Project Design Value Engineering. Master’s Thesis, Namseoul University, Cheonan-si, Republic of Korea, 2010; pp. 45–48. [Google Scholar]
- Jeong, S.E. A Process Model for Design Value Engineering (VE) Using the Chimera Idea Creation Concept (CICC). Master’s Thesis, Namseoul University, Cheonan-si, Republic of Korea, 2012; pp. 24–25. [Google Scholar]
- Kim, M.S. Improvement of Design VE Process Using the Quality Model by Construction Project Type. Master’s Thesis, Namseoul University, Cheonan-si, Republic of Korea, 2010; pp. 39–40. [Google Scholar]
- Kwon, B.S. A Study on Improvement of Subjection Method for Value Engineering in Early Design Stage. Master’s Thesis, Dankook University, Yongin-si, Republic of Korea, 2001; pp. 25–31. [Google Scholar]
- Yun, S.W.; Kim, H.H.; Min, K.S. Improvement for Subject Selection using SWOT Analysis in the Design Value Engineering. In Proceedings of the Korean Institute of Construction Engineering and Management, Seoul, Republic of Korea, 7 November 2008; Volume 7, pp. 872–876. [Google Scholar]
- Zhang, R.; Ashuri, B.; Shyr, Y.; Deng, Y. Forecasting Construction Cost Index based on visibility graph: A network approach. Physica A 2018, 493, 239–252. [Google Scholar] [CrossRef]
- El-Nashar, W.Y.; Elyamany, A.H. Value engineering for canal tail irrigation water problem. Ain Shams Eng. J. 2018, 9, 1989–1997. [Google Scholar] [CrossRef]
- Kim, J.H. Advance of Method for An Object Selection in Construction Value Engineering. Master’s Thesis, Pukyong National University, Busan, Republic of Korea, 2011; p. V. [Google Scholar]
- Likert, R. A Technique for the measurement of attitudes. Arch. Psychol. 1932, 140, 5–55. [Google Scholar]
- Kim, S.M. A Comparison of Structural Equation Model Estimation Methods According to the Attributes of Likert Scale Data. Master’s Thesis, Keimyung University, Daegu, Republic of Korea, 2011; pp. 1, 10, 104. [Google Scholar]


| VE Target Selection Method | Evaluation Standard | Evaluation Items | Characteristic |
|---|---|---|---|
| High-cost field selection technique | Cost | Select high-cost items | Construction that is easy to calculate costs |
| “Cost to Worth” Technique | Comprehensively judge cost and value | VI = Cost ÷ Worth Select the item with the highest VI value | Construction that is easy to calculate costs or has past performance data When using worth, use the concept of functional analysis |
| Cost performance evaluation technique | Comprehensively judge cost and performance | Item with the lowest performance ratio/cost ratio value | Construction with insufficient past performance data Performance evaluation criteria include ordering body/user requirements, construction period, etc. |
| Complex evaluation technique | Expected improvement effects, available effort, team capabilities, etc. | Evaluation by evaluation item | Large-scale project Construction VE |
| Building Use | Number of Samples | Unit Construction Cost Average (KRW/m2) | SEM (Standard Error of the Mean) | Standard Deviation | Minimum Construction Cost per Unit Area (KRW/m2) | Maximum Construction Cost per Unit Area (KRW/m2) | |
|---|---|---|---|---|---|---|---|
| Public building | General | 163 | 3,369,047.5 | 45,369.2 | 579,234.6 | 2,072,265 | 5,158,590 |
| Large | 74 | 3,328,716.6 | 111,514.5 | 959,284.3 | 2,465,224 | 10,584,173 | |
| Library | 21 | 3,449,470.3 | 115,376.0 | 528,719.1 | 2,267,530 | 4,195,593 | |
| Warehouse | 8 | 1,897,827.3 | 166,336.4 | 470,470.5 | 1,164,246 | 2,836,082 | |
| Dormitory | 14 | 3,400,605.6 | 133,406.2 | 499,160.4 | 2,714,915 | 4,474,552 | |
| Factory | 23 | 2,867,950.1 | 203,884.8 | 977,797.3 | 1,385,877 | 4,839,010 | |
| Welfare facilities | 22 | 3,640,164.6 | 220,683.2 | 1,035,096.0 | 2,735,033 | 7,716,943 | |
| Medical facilities | 16 | 3,559,654.4 | 99,429.1 | 397,716.3 | 2,702,300 | 4,251,077 | |
| Training facilities | 29 | 3,908,666.6 | 176,132.3 | 948,501.6 | 2,628,219 | 6,307,060 | |
| Sports facilities | 41 | 4,481,404.3 | 201,608.4 | 1,290,923.3 | 3,029,790 | 10,324,043 | |
| Exhibition facilities | 49 | 3,956,687.2 | 111,544.7 | 780,813.0 | 2,874,435 | 6,653,951 | |
| Facilities for the elderly | 50 | 3,380,304.9 | 93,702.0 | 662,573.3 | 2,499,938 | 5,718,689 | |
| University | 56 | 3,011,569.6 | 51,564.2 | 385,871.3 | 2,449,153 | 4,354,924 | |
| Laboratory | 53 | 3,739,241.5 | 111,069.6 | 808,598.8 | 2,578,894 | 6,471,361 | |
| Subtotal | 619 | 3,427,950.7 | 131,544.3 | 737,482.8 | 2,397,701.3 | 5,991,860 | |
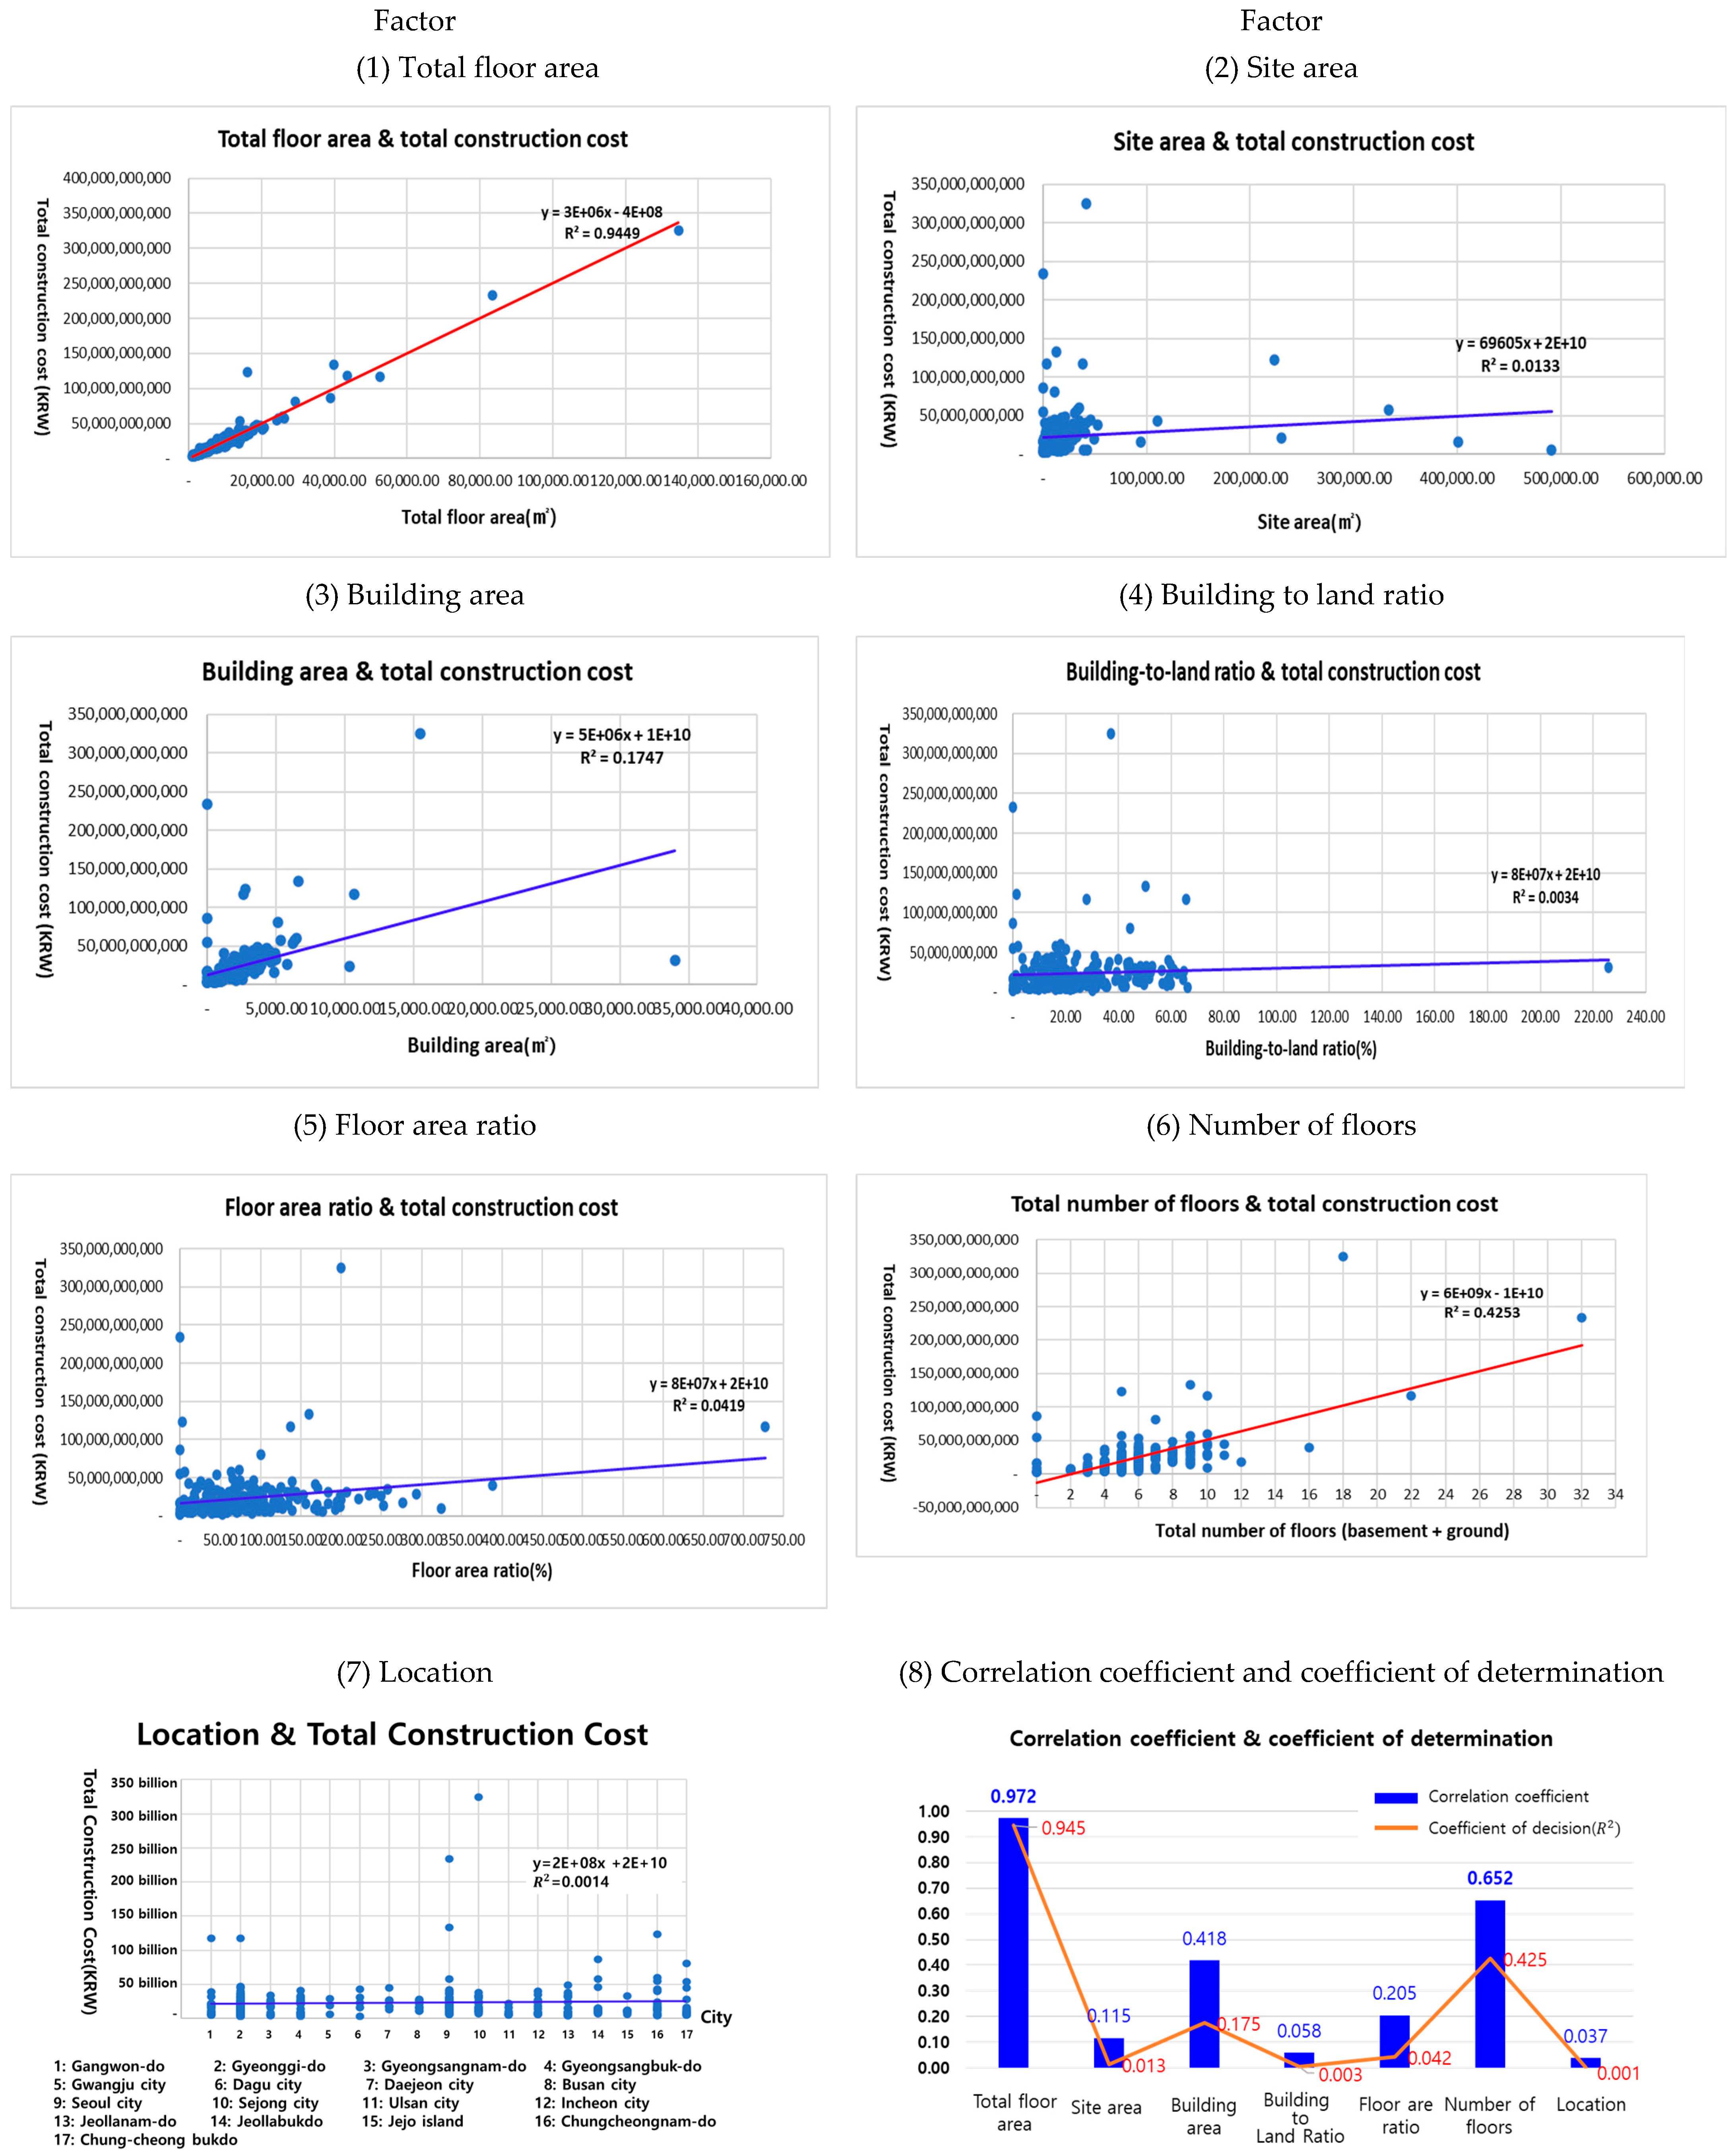
| Factor | Regression Equation | Correlation Coefficient | Coefficient of Decision | Adjusted Coefficient of Determination | Significance Level |
|---|---|---|---|---|---|
| Total floor area | Y = 3 × 100.6X − 4 × 100.8 | 0.972063 | 0.9449 | 0.9447 | 6.4 × 10−150 |
| Site area | Y = 69,605X + 2 × 10¹⁰ | 0.115279 | 0.0133 | 0.0091 | 7.7 × 10−02 |
| Building area | Y = 5 × 100.6X + 1 × 10¹⁰ | 0.418012 | 0.1747 | 0.1712 | 1.9 × 10⁻¹¹ |
| Building-to-land ratio | Y = 8 × 100.7X + 2 × 10¹⁰ | 0.057906 | 0.0034 | −0.0009 | 3.7 × 10−01 |
| Floor area ratio | Y = 8 × 100.7X + 2 × 10¹⁰ | 0.204732 | 0.0419 | 0.0378 | 1.5 × 10−03 |
| Number of floors | Y = 8 × 100.9X − 1 × 10¹⁰ | 0.652180 | 0.4253 | 0.4229 | 4.3 × 10⁻³⁰ |
| Location | Y = 2 × 100.8X + 2 × 10¹⁰ | 0.037360 | 0.0014 | −0.0029 | 5.7 × 10−01 |
| Division | Detailed Work Type | Average Market Share | ||
|---|---|---|---|---|
| General Government Building (163) | Large Government Building (74) | All Government Building (237) | ||
| Building | Temporary | 5.73% | 5.36% | 5.62% |
| Foundation | 1.79% | 1.30% | 1.64% | |
| Reinforced concrete | 15.36% | 12.96% | 14.61% | |
| Iron frame | 1.47% | 2.32% | 1.73% | |
| Brick | 1.80% | 1.56% | 1.72% | |
| Waterproofing | 2.62% | 2.24% | 2.50% | |
| Stone | 3.95% | 3.03% | 3.66% | |
| Tile | 1.24% | 0.74% | 1.09% | |
| Metal | 4.74% | 4.75% | 4.74% | |
| Plastering | 1.68% | 1.32% | 1.57% | |
| Windows and glass | 4.80% | 4.79% | 4.80% | |
| Wood and interior finishing | 13.30% | 9.44% | 12.09% | |
| Painting | 1.35% | 1.26% | 1.32% | |
| Dismantling and demolition | 0.56% | 0.71% | 0.61% | |
| Waste disposal | 0.02% | 0.00% | 0.02% | |
| Gravel and transportation | 0.57% | 0.46% | 0.54% | |
| Work by-product | −0.05% | −0.07% | −0.06% | |
| Quality test fee | 0.08% | 0.09% | 0.08% | |
| Other | 2.16% | 2.30% | 2.21% | |
| Subtotal | 63.16% | 54.57% | 60.48% | |
| Mechanical | Equipment installation | 1.21% | 1.14% | 1.19% |
| Outdoor plumbing | 0.11% | 0.09% | 0.10% | |
| Machine room plumbing | 0.82% | 1.07% | 0.89% | |
| Air conditioning piping | 0.65% | 1.35% | 0.87% | |
| Gas piping | 0.37% | 0.22% | 0.32% | |
| Water supply piping | 1.10% | 0.94% | 1.05% | |
| Sewage piping | 0.98% | 0.97% | 0.98% | |
| Heating piping | 0.17% | 0.12% | 0.15% | |
| Flue installation | 0.09% | 0.15% | 0.11% | |
| Duct installation | 1.24% | 2.47% | 1.62% | |
| Rainwater treatment facility | 0.26% | 0.37% | 0.30% | |
| Sanitary equipment installation | 0.71% | 0.53% | 0.65% | |
| Underfloor heating | 0.04% | 0.06% | 0.05% | |
| Geothermal facility | 0.39% | 0.88% | 0.55% | |
| Soundproofing and dustproofing installation | 0.11% | 0.24% | 0.15% | |
| Other | 0.76% | 1.58% | 1.02% | |
| Subtotal | 9.00% | 12.19% | 10.00% | |
| Electrical | Electricity inlet | 0.63% | 0.51% | 0.60% |
| Main power line facility | 1.63% | 1.42% | 1.56% | |
| Outdoor security lighting | 0.49% | 0.26% | 0.41% | |
| Power facility | 0.79% | 0.81% | 0.79% | |
| Remote meter reading facility | 0.05% | 0.06% | 0.05% | |
| Lighting equipment | 3.01% | 2.99% | 3.01% | |
| Lighting and power control facility | 0.17% | 0.22% | 0.19% | |
| Electric heating equipment | 1.61% | 1.40% | 4.54% | |
| Heating/cooling equipment | 0.42% | 0.38% | 0.41% | |
| Grounding and lightning protection | 0.57% | 0.33% | 0.49% | |
| Cable tray and duct facility | 0.44% | 0.51% | 0.46% | |
| Other | 0.40% | 0.46% | 0.42% | |
| Subtotal | 10.21% | 9.35% | 9.94% | |
| Telecommunications | Outdoor communication equipment | 0.35% | 0.27% | 0.33% |
| Integrated wiring facility | 2.61% | 2.77% | 2.66% | |
| CATV and TV equipment | 0.48% | 0.47% | 0.47% | |
| Broadcasting facilities | 0.69% | 0.66% | 0.68% | |
| A/V equipment | 0.22% | 0.19% | 0.21% | |
| CCTV facility | 0.26% | 0.33% | 0.28% | |
| Access control equipment | 0.25% | 0.49% | 0.32% | |
| Parking control facility | 0.06% | 0.10% | 0.07% | |
| Cable tray and duct installation | 0.47% | 0.50% | 0.48% | |
| Other | 0.17% | 0.30% | 0.21% | |
| Subtotal | 5.57% | 6.08% | 5.73% | |
| Firefighting | Fire extinguishing equipment installation | 0.28% | 0.20% | 0.26% |
| Outdoor fire-fighting piping | 0.04% | 0.03% | 0.04% | |
| Indoor fire-fighting piping | 0.62% | 0.67% | 0.64% | |
| Pump room piping | 0.26% | 0.15% | 0.22% | |
| Sprinkler piping | 0.89% | 2.00% | 1.24% | |
| Fire extinguishing gas piping | 0.12% | 0.22% | 0.15% | |
| Fire extinguishing | 0.17% | 0.21% | 0.18% | |
| Smoke control duct installation | 0.01% | 0.14% | 0.05% | |
| Guide light equipment | 0.54% | 0.51% | 0.53% | |
| Automatic fire detection | 1.57% | 1.52% | 1.56% | |
| Wireless communication auxiliary equipment | 0.03% | 0.16% | 0.07% | |
| Other | 0.38% | 0.20% | 0.33% | |
| Subtotal | 4.91% | 6.02% | 5.26% | |
| Civil | Earth retaining facility | 3.46% | 3.88% | 3.60% |
| Earth construction | 2.27% | 2.72% | 2.41% | |
| Rainwater treatment | 0.90% | 0.43% | 0.75% | |
| Sewage treatment | 0.24% | 0.15% | 0.21% | |
| Water construction | 0.04% | 0.02% | 0.03% | |
| Paving construction | 0.73% | 0.44% | 0.64% | |
| Civil structural | 0.65% | 0.30% | 0.54% | |
| Company-supplied materials | 0.72% | 0.48% | 0.65% | |
| Transportation costs | 0.03% | 0.02% | 0.03% | |
| Other | 0.56% | 0.40% | 0.51% | |
| Subtotal | 9.61% | 8.83% | 9.37% | |
| Landscaping | Planting | 1.65% | 1.68% | 1.66% |
| Pedestrian road paving | 0.76% | 0.44% | 0.66% | |
| Landscaping facilities | 0.53% | 0.70% | 0.58% | |
| Other | 0.09% | 0.14% | 0.11% | |
| Subtotal | 3.03% | 2.95% | 3.00% | |
| Total | 100.00% | 100.00% | 100.00% | |
| Detailed Construction Work in the Field of Public Building Construction | Cost Share Worth C (A) | Customer Value Worth V Weighting (B) | Final Worth F (A × B) |
|---|---|---|---|
| Temporary | 4.85% | 0.4 | 1.94% |
| Foundation | 7.84% | 1.0 | 7.84% |
| Reinforced concrete | 17.85% | 0.7 | 12.50% |
| Iron frame | 0.62% | 1.0 | 0.62% |
| Brick | 2.18% | 0.7 | 1.53% |
| Waterproofing | 2.06% | 1.6 | 3.30% |
| Stone | 4.79% | 1.3 | 6.23% |
| Tile | 1.04% | 1.3 | 1.35% |
| Metal | 3.20% | 1.3 | 4.16% |
| Plastering | 1.71% | 0.7 | 1.20% |
| Windows and glass | 4.44% | 1.3 | 5.77% |
| Wood and interior | 7.67% | 1.6 | 12.27% |
| Painting | 1.02% | 1.3 | 1.33% |
| Waste disposal | 0.04% | 0.7 | 0.03% |
| Gravel and transportation | 0.70% | 0.7 | 0.49% |
| Other (architect) | 1.36% | 0.7 | 0.95% |
| Subtotal | 61.37% | 1.002 | 61.51% |
| Detailed Construction Work in the Field of Public Building Construction | Of the Project COST (C) | Final Worth F (D) | VI (Value Index) (C ÷ D) |
|---|---|---|---|
| Temporary | 5.02% | 1.94% | 2.59 |
| Foundation | 5.15% | 7.84% | 0.66 |
| Reinforced concrete | 12.85% | 12.49% | 1.03 |
| Iron frame | 1.41% | 0.62% | 2.27 |
| Brick | 4.95% | 1.53% | 3.24 |
| Waterproofing | 2.76% | 3.30% | 0.84 |
| Stone | 1.01% | 6.23% | 0.16 |
| Tile | 1.68% | 1.35% | 1.24 |
| Metal | 4.96% | 4.16% | 1.19 |
| Plastering | 1.74% | 1.20% | 1.45 |
| Windows and glass | 6.57% | 5.77% | 1.14 |
| Wood and interior | 6.67% | 12.27% | 0.54 |
| Painting | 1.17% | 1.33% | 0.88 |
| Waste disposal | 0.08% | 0.03% | 2.67 |
| Gravel and transportation | 1.16% | 0.49% | 2.37 |
| Other (architect) | 4.09% | 0.95% | 4.31 |
| Subtotal | 61.27% | 61.50% | 0.996 |
| Progress Project | Total Floor Area Similarity (m2) | Cumulative Number of Samples | Number of Floors | SEM (Standard Error of the Mean) |
|---|---|---|---|---|
| Building use Public building Number of floors: basement floors (1) Ground floors (4) Total floor area: 6993 m2 | 99% (6923~7063) | 2 | Basement floors (1) Ground floors (4) | 0.15405467 |
| 95% (6643~7342) | 6 | 0.08385151 | ||
| 90% (6293~7692) | 7 | 0.07630537 | ||
| 85% (5944~8042) | 13 | 0.05403102 | ||
| 80% (5594~8391) | 13 | 0.05403102 | ||
| 75% (5244~8741) | 16 | 0.04819095 | ||
| 70% (4895~9090) | 19 | 0.04374134 |
| Category | Content | A Bird’s-Eye View of Building |
|---|---|---|
| Progress Project | Daegu Gang-Buk Fire Station New Construction |  |
| Location | Guam-dong, Buk-Gu, Daegu | |
| Local district | Central commercial area | |
| Building use | Public building | |
| Number of floors | Basement floors (1) Ground floors (4) | |
| Site area | 8009.90 m2 | |
| Total floor area | 6.993.04 m2 | |
| Building-to-land ratio | 30.79% | |
| Floor area ratio | 71.52% | |
| Total construction cost | 17,582,741,000 KRW |
| Architectural Field Detailed Work | Cost Share Worth C (A) | Customer Value Worth V (B) | Total Worth F (A × B) |
|---|---|---|---|
| Temporary | 4.85% | 0.7 | 3.395% |
| Foundation | 7.84% | 1.0 | 7.84% |
| Reinforced concrete | 17.85% | 1.0 | 17.85% |
| Iron frame | 0.62% | 1.0 | 0.62% |
| Brick | 2.18% | 0.7 | 1.526% |
| Waterproofing | 2.06% | 1.3 | 2.678% |
| Stone | 4.79% | 1.0 | 4.79% |
| Tile | 1.04% | 1.0 | 1.04% |
| Metal | 3.20% | 1.0 | 3.2% |
| Plastering | 1.71% | 0.7 | 1.197% |
| Windows and glass | 4.44% | 1.0 | 4.44% |
| Wood and interior | 7.67% | 1.6 | 12.272% |
| Painting | 1.02% | 1.0 | 1.02% |
| Waste disposal | 0.04% | 0.4 | 0.016% |
| Gravel and transportation | 0.70% | 0.4 | 0.28% |
| Other (architect) | 1.36% | 1.0 | 1.36% |
| Subtotal | 61.37% | 1.035 | 63.524% |
| Division | Detailed | VI Value | Number of Alternatives | Increase/Decrease Amount (KRW) |
|---|---|---|---|---|
| Building | Temporary | 1.48 | 3 | −33,600,000 |
| Iron frame | 2.28 | 3 | −50,800,000 | |
| Brick | 3.90 | |||
| Tile | 1.61 | |||
| Metal | 1.86 | 3 | −354,200,000 | |
| Plastering | 1.45 | 2 | −52,000,000 | |
| Windows and glass | 1.48 | 5 | ||
| Gravel and transportation | 4.13 | 1 | ||
| Other construction | 2.20 | 3 | −217,700,000 | |
| Mechanical | Heating piping | 3.98 | 2 | −42,700,000 |
| Duct installation | 1.21 | 2 | −1,650,000 | |
| Sanitary equipment | 4.23 | 1 | ||
| Electrical | Electric main line | 1.26 | 5 | −93,000,000 |
| Remote meter reading | 3.02 | 2 | −74,700,000 | |
| Heating and cooling | 1.20 | 1 | −1,500,000 | |
| Thunderstroke ground connection | 5.90 | 1 | −1,000,000 | |
| Cable tray | 2.58 | 1 | −12,000,000 | |
| Telecommunications | AV equipment | 2.00 | 4 | −39,000,000 |
| CCTV | 1.53 | |||
| Firefighting | Outdoor fire piping | 1.31 | 2 | −12,600,000 |
| Other construction | 145.62 | 3 | −58,500,000 | |
| Civil | Earthwork | 11.85 | 2 | −233,100,000 |
| Company-supplied materials | 22.05 | 2 | −268,000,000 | |
| Landscaping | Landscaping facilities | 1.64 | 1 | −34,400,000 |
| Other construction | 2.65 | 2 | −600,000 | |
| Subtotal | 11.85 | 51 | −1,581,050,000 | |
| VE Implementation Steps | Target Project | Sample Target | Number of Target Selected Construction Types Derived from This Study | Number of Construction Types for Deriving Target Project Alternatives | Match Rate |
|---|---|---|---|---|---|
| Design stage | Gang-Buk Fire Station | Jeong-Seon Police Station | 25 | 22 | 88% |
| Chang-Won Marine Police Station |
| Comparison Target | Number of Targets Selected Work Types | Number of Alternatives Derived | Savings Amount (KRW) |
|---|---|---|---|
| Previous project (A) | 42 | 68 | 1,820,000,000 |
| This study (B) | 25 | 51 | 1,580,000,000 |
| Efficiency (B ÷ A) × 100 | 59.5% | 75.0% | 86.8% |
Disclaimer/Publisher’s Note: The statements, opinions and data contained in all publications are solely those of the individual author(s) and contributor(s) and not of MDPI and/or the editor(s). MDPI and/or the editor(s) disclaim responsibility for any injury to people or property resulting from any ideas, methods, instructions or products referred to in the content. |
© 2024 by the authors. Licensee MDPI, Basel, Switzerland. This article is an open access article distributed under the terms and conditions of the Creative Commons Attribution (CC BY) license (https://creativecommons.org/licenses/by/4.0/).
Share and Cite
Jeong, Y.-G.; Jeong, H.-M.; Kim, B.-S. Development of Worth Estimation and Key Target Selection Methods for Effective VE. Buildings 2024, 14, 1235. https://doi.org/10.3390/buildings14051235
Jeong Y-G, Jeong H-M, Kim B-S. Development of Worth Estimation and Key Target Selection Methods for Effective VE. Buildings. 2024; 14(5):1235. https://doi.org/10.3390/buildings14051235
Chicago/Turabian StyleJeong, Yeon-Goo, Hye-Min Jeong, and Byung-Soo Kim. 2024. "Development of Worth Estimation and Key Target Selection Methods for Effective VE" Buildings 14, no. 5: 1235. https://doi.org/10.3390/buildings14051235