Article

Development of a Vibration-Based Pre-Alarming Method for Bolt Looseness of Seismic Sway Braces

1
School of Civil Engineering and Architecture, Jinling Institute of Technology, Nanjing 211169, China
2
School of Civil Engineering, Southeast University, Nanjing 210096, China
*
Author to whom correspondence should be addressed.
Buildings 2024, 14(9), 2711; https://doi.org/10.3390/buildings14092711
Submission received: 20 July 2024 / Revised: 11 August 2024 / Accepted: 22 August 2024 / Published: 30 August 2024
(This article belongs to the Section Building Structures)

Abstract

:
Typical seismic sway braces (SSBs) are composed of several bolted steel components. As the connecting bolts become loose, the stiffness and bearing capacity of SSBs decline from which their seismic performance degrades significantly. Based on the vibration response of the brace components, a framework of a vibration-based pre-alarming method for the bolt looseness of SSBs is created and established. Four damage indexes were constructed based on the methods of Fast Fourier Transform (FFT), Wavelet Packet (WP), Intrinsic Mode Function (IMF) and Hilbert-Huang Transform (HHT). Having tested and verified their sensitivity to the bolting torque of bolts, a multi-index hierarchical early warning system (MHES) was established by associating the four damage indexes with the tightening torque of the bolts, by which the threshold of the yellow (slightly damaged) and red (severely damaged) warnings were defined and confirmed. By means of the application in an actual project, the validation of the MHES was finally verified and confirmed according to its stability and accuracy.

1. Introduction

As one of the critical non-structural elements, the suspended piping system serves to guarantee the functionality of buildings by providing the supply of water, gas, air-conditioning wind, electric power and telecom signals, etc. The suspended piping system is composed of pipes with several joints, structural supports attached to the building structure and other accessory equipment. Some pipes have great weight and pressure to achieve the goals of water distribution and circulation and gas transmission. If the structure of these pipes is damaged to render the leakage of high-pressure water and gas, the temporary evacuation or disaster of the building could be forced due to indoor waterlogging and fire hazards [1,2,3]. Several decades ago, vertical supports were merely designed to sustain the gravity of pipes. During several major earthquakes, however, dozens of critical facilities such as hospitals and schools were not operational for weeks after the earthquake due to the damage to the suspended fire sprinkler and the water supply system. More seriously, some hospitals lost most medical functions or were even rendered inoperable [4,5,6].
Due to substantial post-earthquake loss caused by damage to the piping system, the seismic design of the piping system has attracted worldwide attention from the academic and engineering fields. It was observed that sway-braced components were essential and crucial to maintain the post-earthquake capacity of piping systems [7,8,9]. The typical structural supports depend frequently on the components in the vertical, transverse and longitudinal directions, respectively, as shown in Figure 1. As shown in the figure, the vertical hangers are designed properly to sustain the gravity of the supporting pipes. And, the horizontal and longitudinal components are primarily designed to resist the action of horizontal earthquakes, and they are called seismic sway braces (SSBs). It has been shown in the recent major earthquakes that piping systems supported by SSBs have represented much better seismic performance than those with only vertical support, and these have been applied in tdesign guidelines and technical specifications in some countries and industry agencies [10,11,12].
For SSB-supported piping systems, several static and quasi-static seismic tests have been carried out to evaluate their seismic performance [12,13]. It has been shown through experimental research that two failure modes were mainly found and confirmed, which are shown in Figure 2 [14]. As shown in the figure, Mode I is the buckling of connecters, and Mode II is the slipslop between the connecters and their connected steel members. With the reduction in interfacial friction performance, the ultimate bearing capacity of Mode II is much smaller than that of Mode I. Some tests have also detected the relationship between the tightening state of bolts and the ultimate bearing capacity, in which the ultimate bearing capacity is reduced significantly with a decrease in the tightening torque of the bolts. Consequently, some technical codes have recommended the tightening torque of bolts as one of the typical acceptance parameters of SSBs [15].
To assess the damage of structures, such as bridges and buildings, accurately and efficiently, several vibration methods have been established and applied in actual structural heath monitoring projects based on the ANN methods, by which vehicle- or temperature-induced damage could be evaluated properly [16,17,18]. Bolt looseness triggers a reduction in the bolting pre-pressure, which leads to potential sliding between two connected components, inducing nonlinear transformation of the structure’s vibration. It has been observed from previous investigations that the complication of nonlinear vibration is mainly caused by modulated and harmonic resonance resulting from the interaction between the external excitation frequency and the structural frequency [19,20]. Several researchers have experimentally identified structural damage by bolt looseness. A time reversal method was also applied, and an impulse modulation method was introduced to assess the damage on the satellite bolted structure [21,22,23]. However, the above methods have shown specificity and selectivity on structural types and their geometrical dimensions. To recover such disadvantages, the Empirical Mode Decomposition (EMD) and Hilbert–Huang Transformation (HHT) have been recommended to assess damage induced by bolt looseness, cracking, and local failure, which were proven as stable and efficient methods for nonlinear structural damage [24]. Although the previous methods have been applied in mechanical gears, bolted steel towers, and even bridges, their applications and effects are not available in assessing the structural damage of SSBs for the particularity on structural dynamic performance [25,26].
The main objective of this study is to develop a vibration-based pre-alarming method for the bolt looseness of SSBs based on the relationship between the tightening torque of bolts and the vibration indicators. Four different damage warning indexes (DWIs) are built by integrating methods of Fast Fourier Transform (FFT), Wavelet Packet (WP), Intrinsic Mode Function (IMF), and Hilbert–Huang Transform (HHT). The vibration experiment is then conducted to profile the influence of the bolting torque on the four DWIs, by which the determined method for the two-level threshold value of four DWIs is investigated and confirmed. Finally, the precision and efficiency are examined by an actual project by which the technique can be extended to engineering applications.

2. Nonlinear Vibration Model of SSBs

A single-freedom nonlinear vibration model integrating bolting looseness is established and shown in Figure 3, by assuming that the value of damping ratio and mass are constant while the stiffness varies nonlinearly. As shown in the figure, the vibration model consists of three parts: a single mass m, a spring with a nonlinear stiffness KN and a damper with a linear damper coefficient c. Under an external excitation with an amplitude F and a frequency v, the motion equation of the nonlinear vibration model is presented as follows:
m x ¨ + c x ˙ + k 1 x + k 2 x 2 = F cos ( υ t )
where x , x ˙ and x ¨ denote displacement, speed and acceleration of the single mass m , respectively; k1 and k2 denote linear stiffness and square nonlinear stiffness, respectively.
As some parameters are formulated that 2 ε μ = c m , ω 2 = k 1 m , ε α = k 2 m and f = F m , the Equation (1) can be formulated as follows:
x ¨ + ω 0 2 x = 2 ε u x ˙ ε α x 2 + f cos ( υ t )
where ε is a minimal parameter, μ is viscous damping coefficient, ω is structural frequency and a is a coefficient of the nonlinear term. In addition, two formulations are defined using Lagrange’s equation as follows:
d d t = d T 0 d t T 0 + d T 1 d t T 1 + Λ = D 0 + ε D 1 + Λ
d 2 d t 2 = D 0 2 + 2 ε D 0 D 1 + ε 2 D 1 2 + 2 D 0 D 2 + Λ
where D 0 , D 1 and D 2 are dissipative functions at T 0 , T 1   and T 2 .
A multi-scale method is used to solve Equation (2), and the first-order approximate solution considering is set as follows:
x t , ε = x 0 T 0 , T 1 + ε x 1 T 0 , T 1
where T 0 = t , T 1 = ε t .
By substituting Equation (5) into (2), Equation (6) is obtained as follows:
D 0 2 x 0 + 2 ε D 0 D 1 x 0 + ε D 0 2 x 1 + ω 0 2 x 0 + ε ω 0 2 x 1 = 2 ε μ D 0 x 0 ε α x 0 2 + f cos ( υ t )
Assuming the ε -related terms equalling to 0.0 for x 0 and x 1 , respectively, the Equation (6) is transformed as Equations (7) and (8):
D 0 2 x 0 + ω 0 2 x 0 = f cos ( υ t )
D 0 2 x 1 + ω 0 2 x 1 = 2 D 0 D 1 x 0 2 μ D 0 x 0 α x 0 2
By solving Equation (7), the Equation (9) is obtained as follows:
x 0 = A ( T 1 ) e i ω 0 T 0 + Λ e i υ T 0 + c c
where Λ = f 2 ( ω 0 2 υ 2 ) and c c is the conjugate of the previous terms. The Equation (10) is obtained by substituting Equation (9) into (8) and shown as follows:
D 0 2 x 1 + ω 0 2 x 1 = Ψ 1 e i ω 0 T 0 + Ψ 2 e i υ T 0 + Ψ 3 e 2 i ω 0 T 0 + Ψ 4 e 2 i υ T 0 + Ψ 5 e i ( υ + ω 0 ) T 0 + Ψ 6 e i ( υ ω 0 ) T 0 + c c
where Ψ i ( i = 1 ~ 6 ) is the amplitude of each frequency component.
According to Equation (10), the first-order asymptotic solution of the nonlinear vibration incorporates several factors. The factors involve the natural frequency of structure, the multiplication frequency, the external excitation frequency and various harmonic frequencies. Among this four factors, the natural frequency of SSBs is not sensitive to bolting looseness because the low-order frequency accounts for large proportion of the vibration signal of the SSBs’ structure. In contrast, nonlinear energy harmonization may occur as the bolt loosens, inducing energy redistribution of the vibration signal. Therefore, the bolting-looseness related DWI can be constructed by profiling the redistribution of higher-order frequency energy, by which the bolting degradation of SSBs can be effectively detected and evaluated.

3. Construction of Four DWIs

Having obtained vibration data of the monitored SSBs, the data recovery is first carried out as some certain data may be missing by problems of vibration measurement, signal communication and data storage [27]. Thereafter, indicators are investigated and established to profile vibration responses of SSBs. It is previously researched that the SSBs possess high structural frequency for their light weight and large stiffness, by which the variation of some certain damage indicators may not be sensitive to the bolting looseness. Therefore, the assessment methods that rely on multiple indicators are more reliable and less volatile. In this section, four methods, i.e., Fast Fourier Transform (FFT), Wavelet Packet (WP), Intrinsic Mode Function (IMF) and Hilbert-Huang Transform (HHT) are involved to construct multiple damage warning indexes (DWIs) for SSBs, respectively [28,29,30,31,32].

3.1. Pre-Alarming Indicator Based on FFT (EI_FFT)

As one of principal parameters, the natural frequencies of certain structure can be calculated as follows:
ω d = ω 1 ξ 2
ω = k m
where ω d and ω denote natural frequencies with and without structural damper, k, m and ξ are structural stiffness, mass and damper ratio, respectively.
As bolting looseness occurs, the structural stiffness of SSBs decreases as other parameters remain constant, causing the natural frequencies drops according to Equation (11). Having obtained vibration data of SSBs, the natural frequency can be calculated by the FFT method as follows:
s ( f ) = + s ( t ) e 2 i π t f d t
where s ( t ) and s ( f ) are vibration responses presented, respectively, by the time domain t and the frequency domain f.
Defining the natural frequencies of SSBs in the healthy and damaged states as F h and F d , respectively, the pre-alarming indicator is then defined and constructed based on FFT, which is named EI_FFT, as follows:
E I _ F F T = F h F d F h × 100

3.2. Pre-Alarming Indicator Based on WP (EI_WP)

It has been previously investigated that the bolting-loosenness-related damage of SSBs may be sensitive to the energy of the vibration signal in certain frequency band ranging from 150 Hz to 250 Hz, where the energy of vibration signal E w can be constructed as follows:
E w = 0 t 0 x 2 ( t ) d t
where x ( t ) is the time-history signal of vibration response, t 0 is the length of frequency band.
Therefore, the pre-alarming indicator based on WP, i.e., EI_WP, is defined by defining the energy of vibration signal of SSBs in the healthy states ( E h w ) and damaged states ( E d w ) as follows:
E I _ W P = E h w E d w E h w × 100

3.3. Pre-Alarming Indicator Based on IMF (EI_IMF)

To eliminate or reduce the negative influence of strong noises, a method has been proposed by Empirical Mode Decomposition (EMD), which can the resolution of non-stationary signal can be improved by obtaining series of Intrinsic Mode Function (IMF). To reduce zero mean noises, a cubic correlation time series function is introduced to amplify the intensity of characteristic signal components. Subsequently, the correlation coefficient between the EMD decomposed IMF in each order and the simplified cubic-correlation time-series function is calculated to filter the false IMF components by setting a reasonable threshold. The filtered signal is then divided into several groups with different frequency bands. When some structural damage occurs in the SSBs, the energy of signal in different bands varies by different rules. Among all-order IMF components, the first-order IMF component typically has the highest ratio with significantly low noises. The energy of the first-order IMF component is defined as follows:
E e = 0 t 0 I M F 2 d t
where t 0 is length of the frequency band. Therefore, a pre-alarming indicator based on IMF, i.e., EI_IMF, is profiled as follows:
E I _ I M F = E h w E d w E h w × 100
where E h w and E d w are signal energy of SSBs in the healthy and damaged states, respectively.

3.4. Pre-Alarming Indicator Based on MHS (EI_MHS)

Traditional time-frequency analysis methods have made great contributions to analyzing vibration signals, and have been widely used in engineering practice. However, it is presented by several researches that their performance is unsatisfactory in processing non-stationary signals. The Hilbert-Huang transform (HHT) method has risen for its advantage of time-frequency adaptivity. In processing a signal by HHT method, the signal is first decomposed into a series of Intrinsic Mode functions (IMF) through Empirical Mode Decomposition (EMD). After that, the corresponding instantaneous spectrum can be obtained by HHT method of the IMFs, and then the spectrum distribution of the entire signal can be obtained. Based on the calculated Hilbert spectrum, the Marginal Hilbert Spectrum (MHS) can be calculated by MCTS-HHT with correlation threshold processing. The energy based on the MHS is defined as follows:
E m = ω 1 ω 2 X 2 ω d ω
where E m is signal energy based on MHS, X ( ω ) is the Hilbert marginal spectrum, ω 2 and ω 1 are the upper and lower limits of the selected frequency range, respectively. The characteristic energy early warning index W m based on the MHS is defined as:
E I _ M H S = E h m E d m E h m × 100
where the E m h and E m d is the MHS-based signal energy of SSBs in the healthy and damaged states, respectively.

4. Pre-Alarming Method for Bolting Looseness

In this section, a vibration-based pre-warning method and its technical route are presented by explaining its research idea and steps in implementation. Figure 4 presents a chart of research procedure integrating experiential verification and project application. As shown in the figure, there are three main steps for bolting looseness assessing of SSBs based on the measured acceleration data, which are presented as follows:
(a)
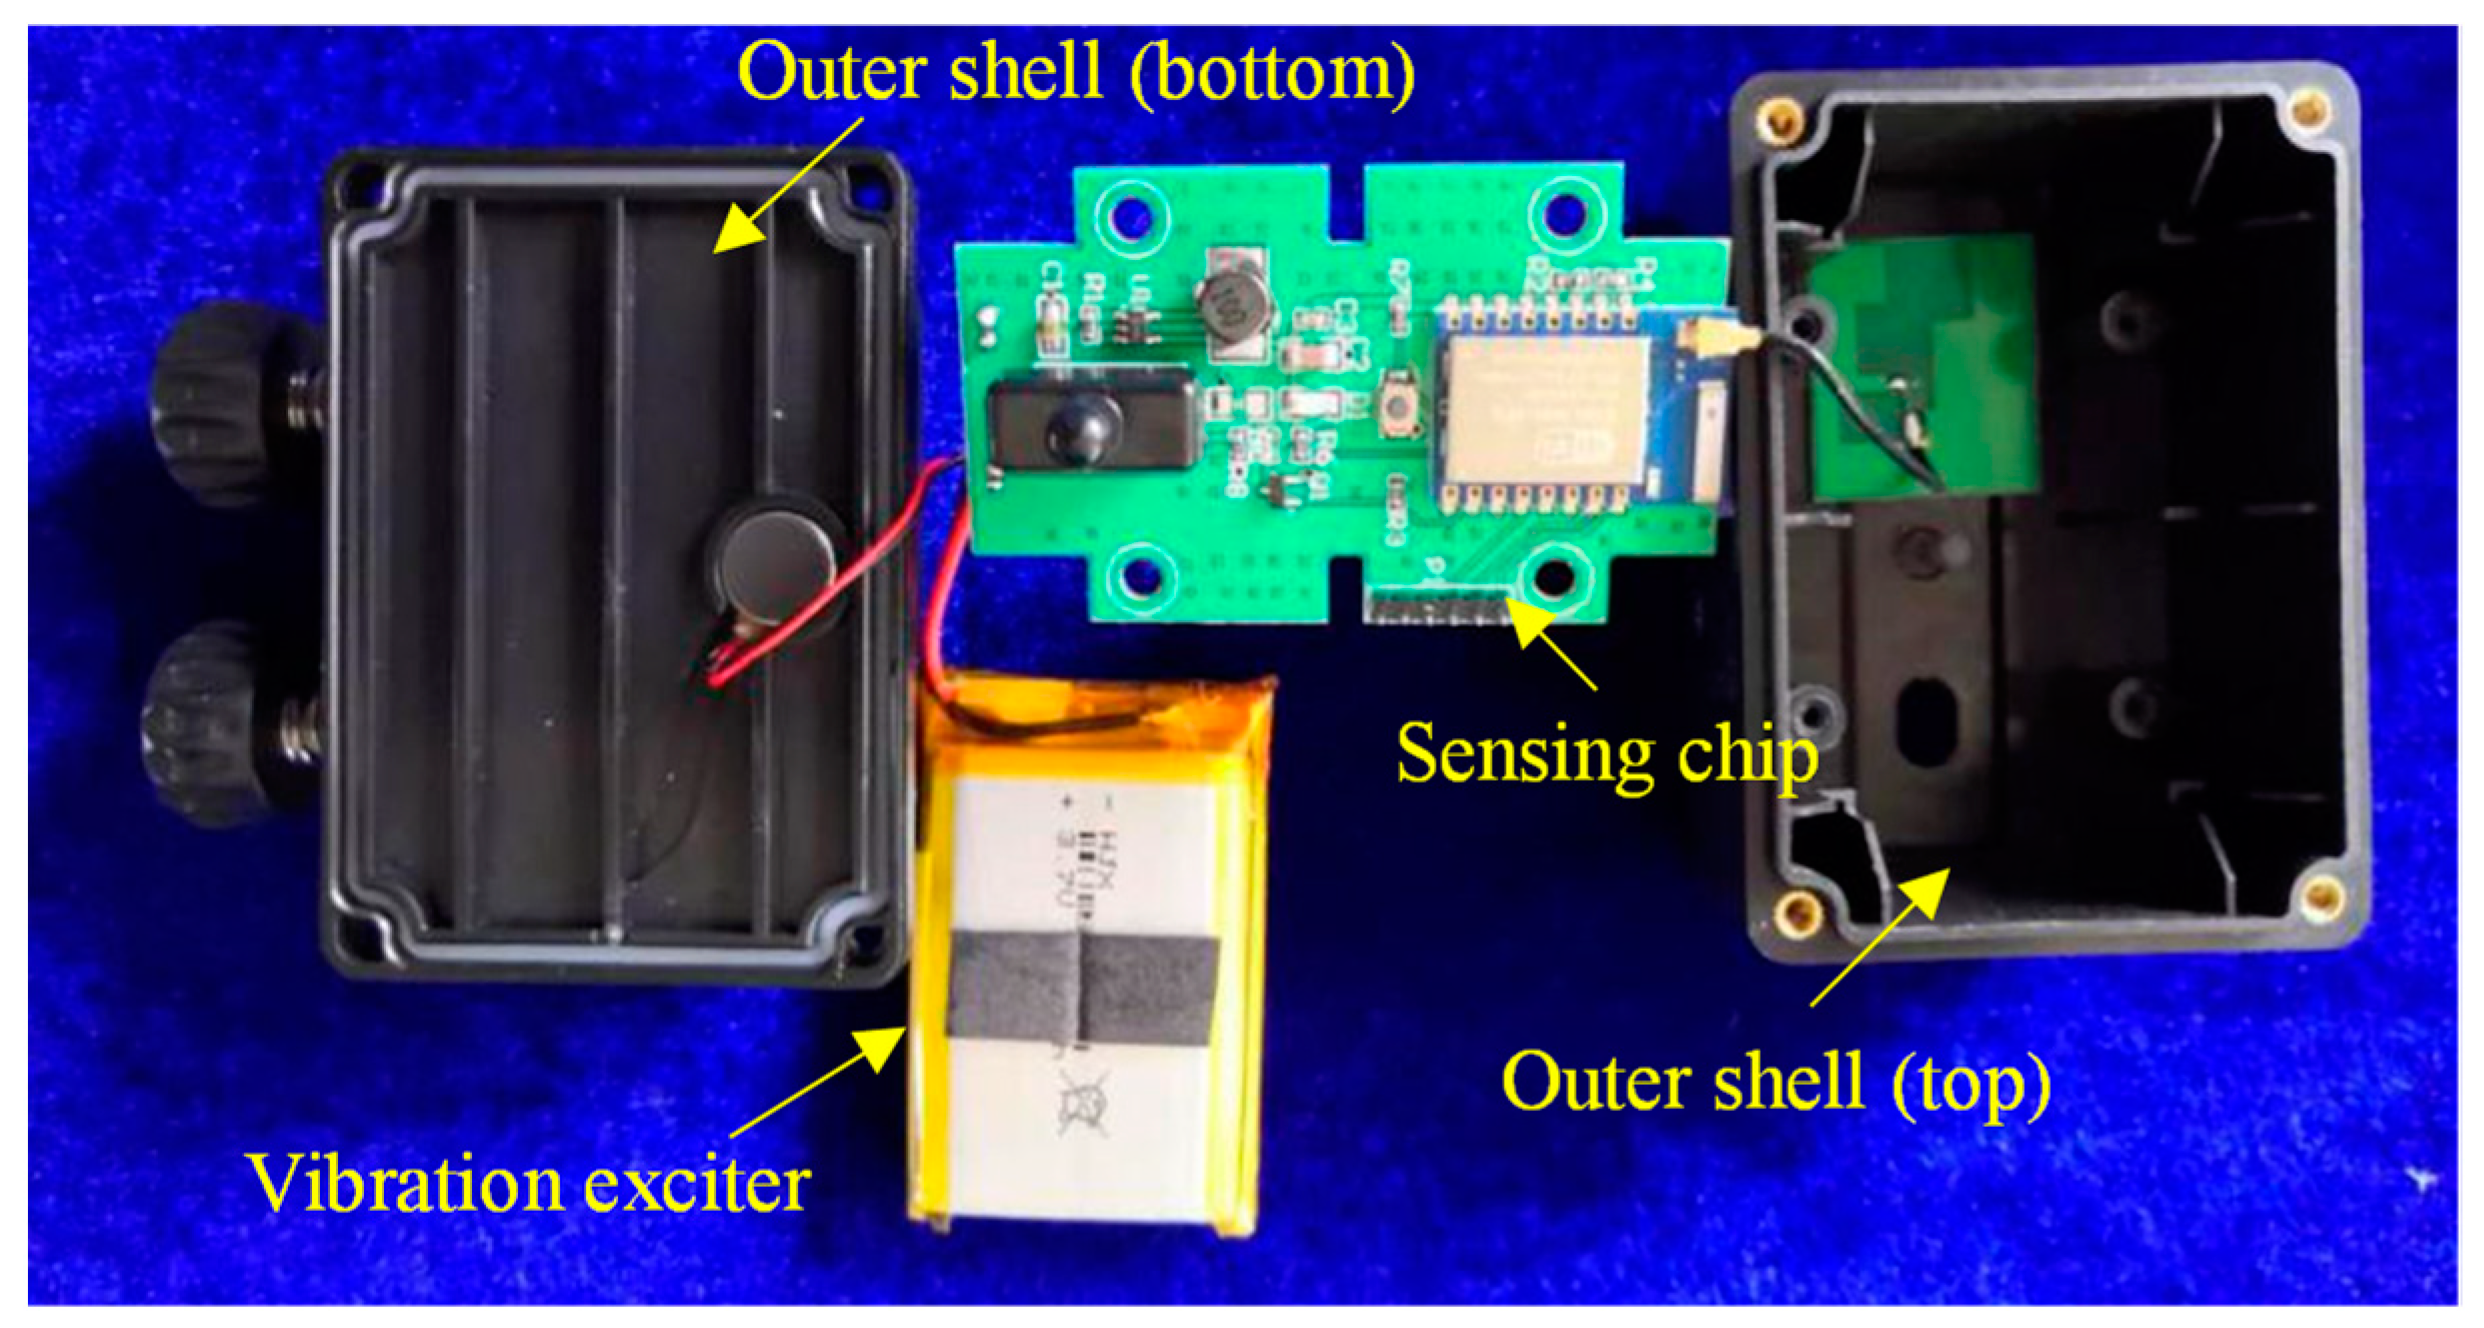
The SSBs are first installed at certain positions by tightening their connecting bolts to the designed bolting torque. Then, a wireless vibration sensor equipped with a vibration exciter is installed at the midspan of the bracing components. In the actual projects, the installed wireless vibration sensors wake up at the set intervals and activate the vibration exciter to produce vibration and measure the acceleration data of SSBs. Thereafter, the measured data are transferred to a remote server via a wireless network.
(b)
Having obtained the measured acceleration data of SSBs, four signal processing methods, i.e., FFT, WP, IMF and HHT, are applied to process the data at different intervals and transform from time domain to frequency domain focusing on various characteristics. Then, four related DWIs are calculated based on the processed frequency-domain data according to the theories outlined in Section 3.
(c)
Experiment or test is carried out to calculate and obtain four initial values of DWIs as the bolting torque equals to design value. Threshold values of four DWIs at the state for slightly damaged and severely damaged are obtained based on the measured acceleration data corresponding to different bolting torques. Finally, the safety sate of SSBs is determined by comparing the calculated results with the threshold value, and the state of slightly or severely damaged can be determined as long as one of four DWIs exceeds the corresponding threshold values.

5. Case Study in an Experiment and an Actual Project

5.1. Experimental Setup

To test the suitability of four pre-alarming indexes for assessing bolt loosening of SSBs, an experimental setup has been established to measure and analyze vibration signal of SSBs under different loosening state of the connecting bolts. As a fixed platform for SSB specimens, a steel frame with four columns and four connecting beams has been designed and fabricated, where two groups of SSB specimens are installed each with a pipe segment. The actual view of the experimental setup is shown in Figure 5. As shown in the figure, the set of SSB comprises a vertical hanger and two orthotropic sway members, and a steel water pipe is installed at the end of the three members connected by a pipe sleeve. Two bolts are used to connect the sway member to the steel frame and the pipe sleeve. To control the loosening state of the connecting bolts, a torque spanner is applied to accurately control the torque value of the connecting bolts.
A wireless acceleration sensor is installed at the midspan position of a sway member to measure and transmit vibration signal to a monitor. There are four modules inside the sensor, i.e., a sensing module, an in-situ data processing module, a wireless communication module and a battery module. A MEMS triaxial accelerometer is used as the sensing module, with measurement range and precision of ±16 g and 0.001 mm/s2, respectively. The in-situ data processing module contains a processing unit with frequency of 32 MHz and a Flash memory with a capacity of 8 MPa. A Zigbee-standard 2.4 GHz RF chip is used as the wireless communication module with data transfer rating up to 250 kps. A lithium battery with a capacity of 500 mA and a charging circuit is implemented as the battery module. As the weight of the sensors is only no higher than 120 g where the weight of the monitored component is no lower than 3500 g/m. Assuming the length of the monitored components is 1000 mm, the weight of the sensors accounts for only 3.4% which can be ignored in the dynamic evaluation of SSBs. To improve construction efficiency and service durability, a bolt-controlled clamp is designed at the bottom of sensors where the monitored component can be pinched tightly by the sensors, which is shown in Figure 5. To enhance the vibration signal, a vibration exciter is installed in the sensor, as shown in Figure 6. The sampling frequency is set as 800 Hz, and the working time domain of the vibrator is set as 60 s with an interval of 60 s when applied in actual projects for saving power.
The experimental procedure is carried out and shown as follows:
(a)
All the bolts of the SSBs are first fastened by a torque spanner to 50 N·m. The acceleration sensor is then powered on to apply external vibration on the SSB specimen and collect acceleration history data. After the acceleration sensor completes ten cycles of the working time domain, the acceleration sensor stops producing vibration and data acquisition.
(b)
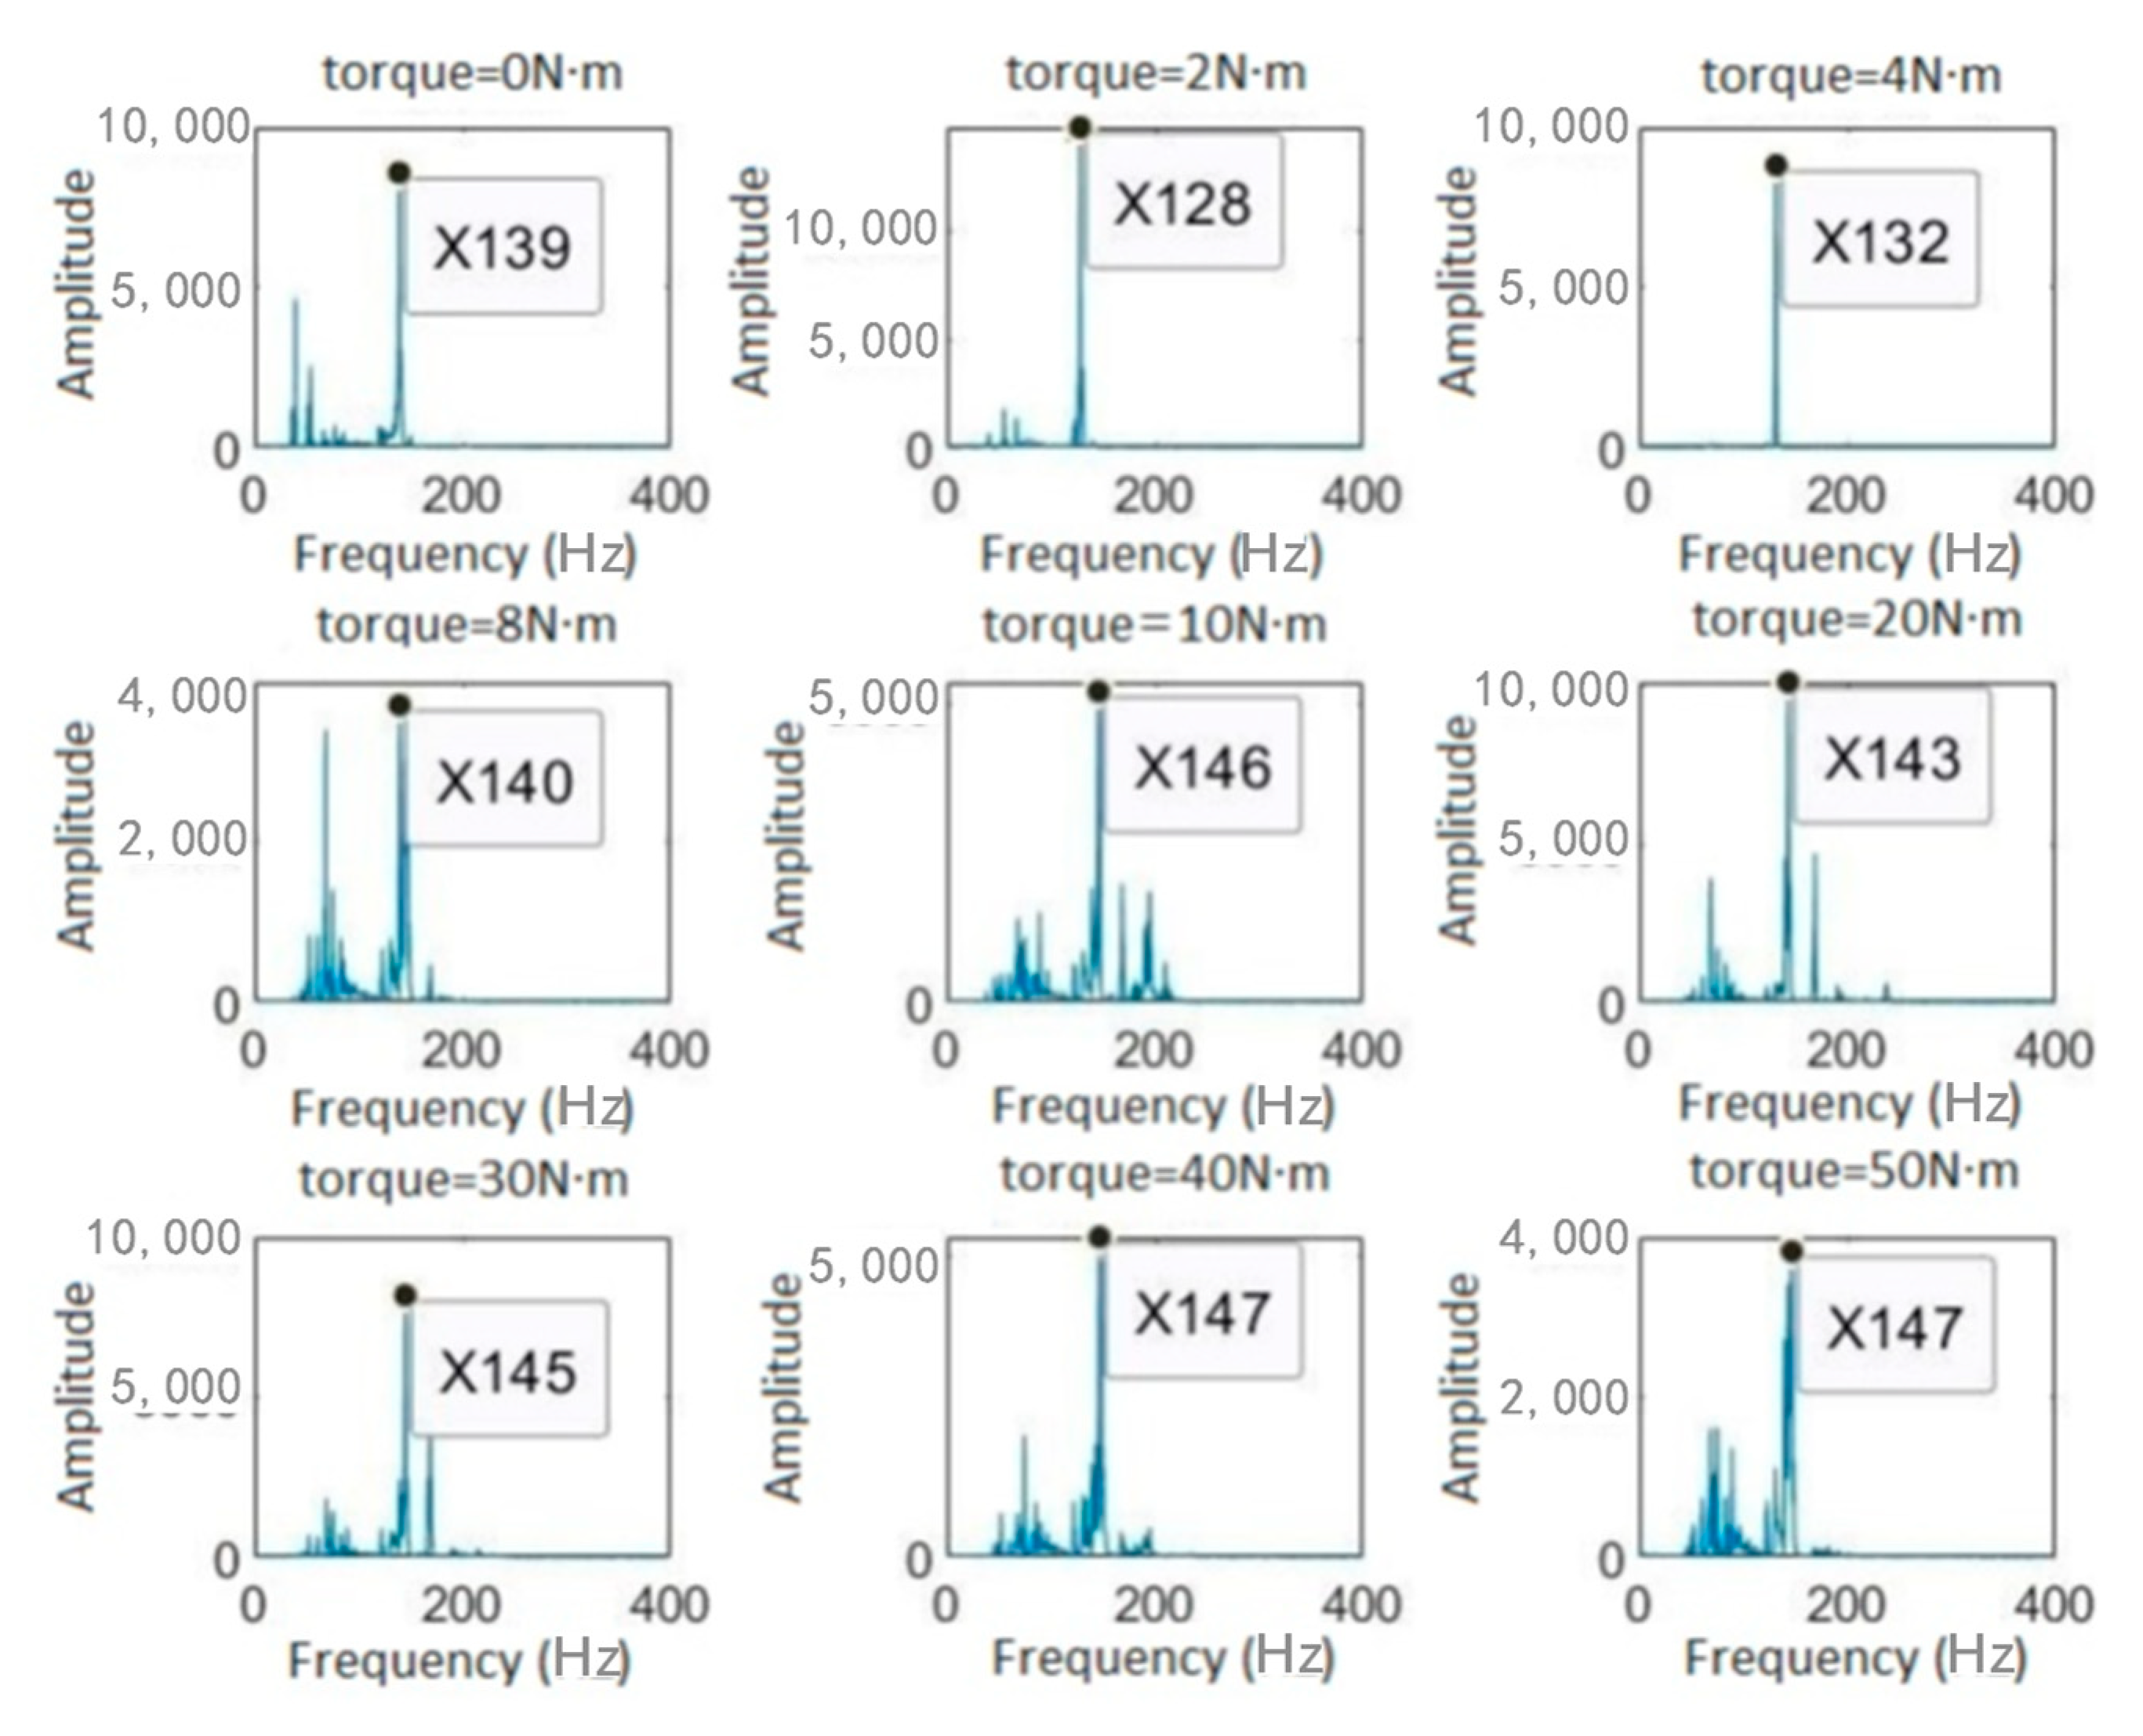
A bolt of the monitored sway member is loosened using the torque spanner into eight different states with varying torque, i.e., 40 N·m, 30 N·m, 20 N·m, 10 N·m, 8 N·m, 5 N·m, 2 N·m and 0. The same vibrating and monitoring procedure is repeated for each torque level.
(c)
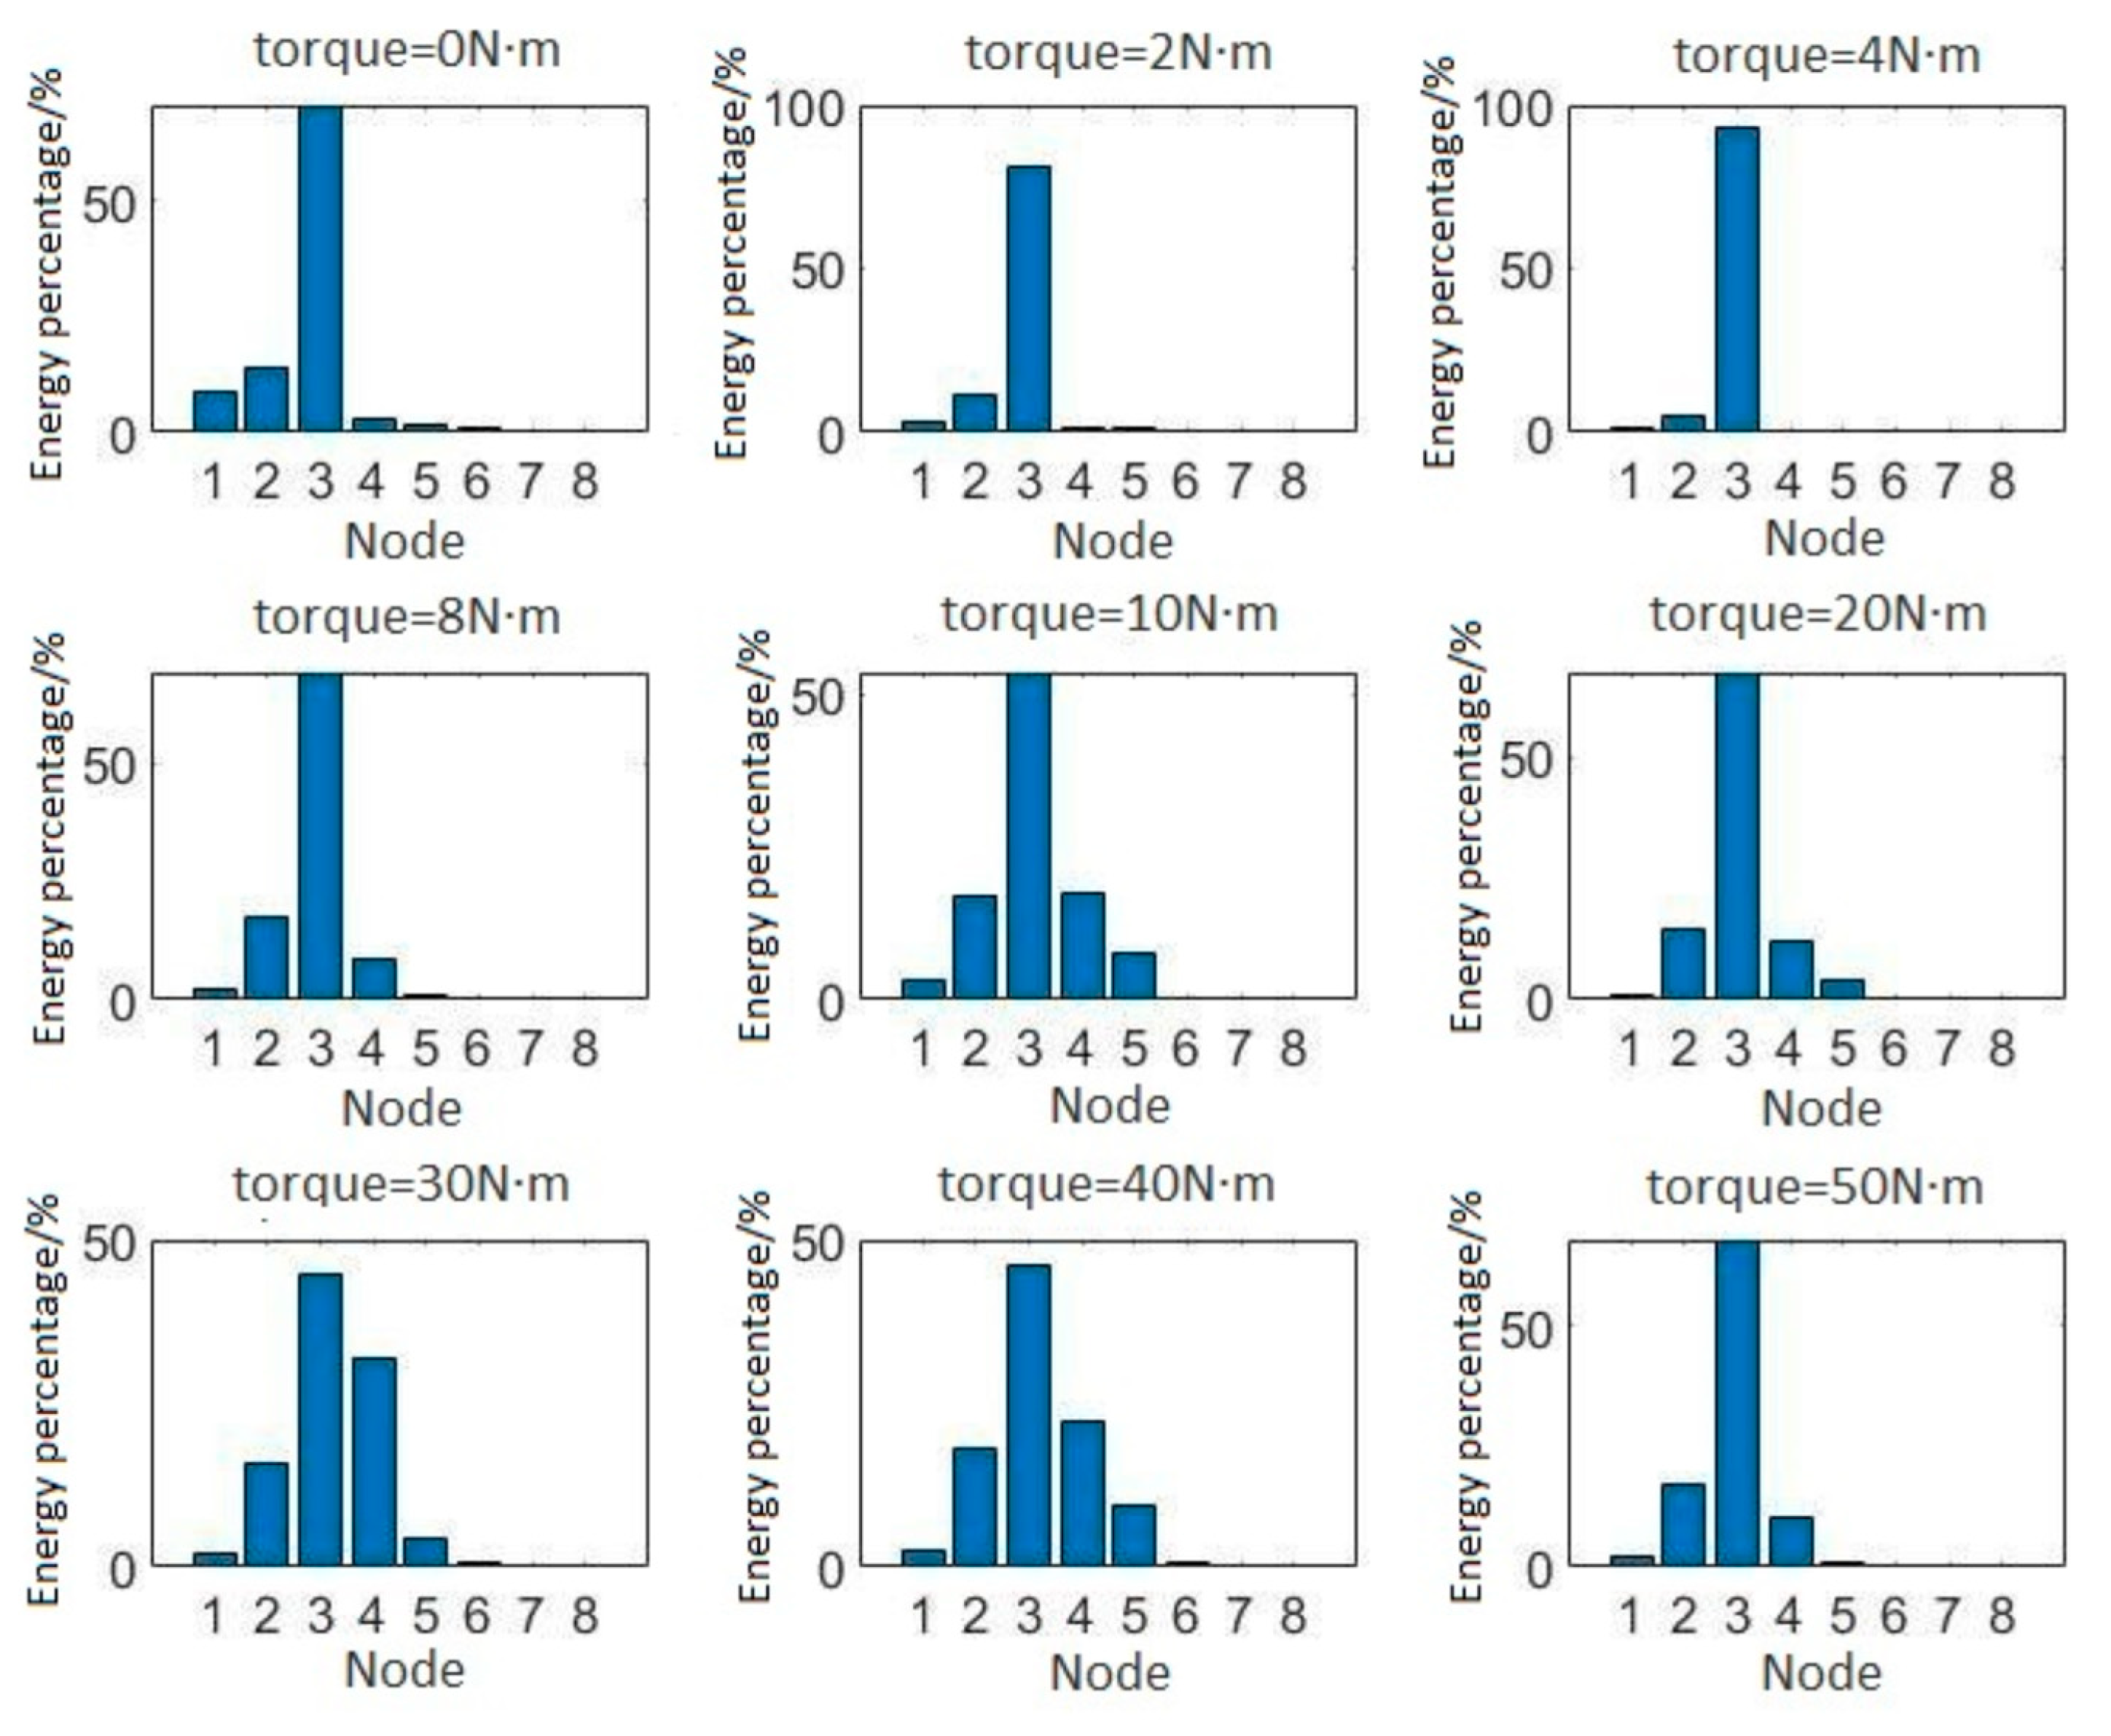
The collected acceleration data is processed to obtain the calculated four Pre-alarming indicators for SSBs, i.e., EI_FFT, EI_WP, EI_IMF and EI_MHS, under the above eight states. The average value of the four Pre-alarming indicators is calculated and obtained by eliminating two largest drift points, by which the sensitivity and accuracy of the four indicators are compared and confirmed.

5.2. Experimental Results

The FFT method is first used to process the collected acceleration data to calculate and obtain acceleration spectra under nine bolting torques. The results of nine acceleration spectra are shown in Figure 7. As there are ten samples of acceleration data under each bolting torque condition, F i is defined as the characteristic frequency from the ith sample of the data. The calculated F i under the nine conditions of bolting torques are presented in Table 1. Having eliminated the maximum and minimum values, F ̄ is defined and calculated by averaging values of the remain series of F i , which is shown in Table 1 as well. As shown in the table, the traditional indicator, i.e., principal frequency, does not vary monotonically with the bolting torque. Defining the characteristic frequency under the bolting torque of 50 N·m as F h , the value of EI_FFT correspond to F ̄ , which is named as W i f , is calculated according to Equation (12). The scatter diagram between W i f and N is shown in Figure 8.
Dmey wavelet is also applied to decompose the collected vibration data by a three-layer wavelet packet, by which the value of the energy corresponding to each frequency is calculated and obtained. The total frequency band is divided equally into eight units, where the maximum frequency and the unit width are defined as 400 Hz and 50 Hz. Figure 9 presents columns of energy-ratio along with unit sequence. As shown in the figure, the energy is mainly distributed from the 3th to the 5th unit, i.e., from 150 Hz to 250 Hz. It is found that the energy during the scope of frequency is sensitive to the bolting torque, and the corresponding energy during the frequency band is therefore calculated according to Equation (13). Defining the value of energy at the bolting torque 50N·m as E h w , the Pre-alarming indicator based on WP under nine different bolting torque, i.e., W i w , is calculated and obtained according to Equation (16). The scatter diagram between N and W i w is shown in Figure 8 as well.
The EMD analysis is applied to process vibration data under 9 different bolting torques to suppress the interference by the zero mean noises, and correlation coefficients between the intrinsic mode function and the simplified correlation time series function is calculated and obtained. To obtain a threshold value, the extreme value of correlation coefficients is then calculated and then divided by 10.0. If the correlation coefficients are greater than the threshold value, the IMF component is retained. Otherwise, the IMF component is discarded. In this section, the first-order IMF component is used to calculate the frequency energy, i.e., W i e , for its sensitivity to bolting torque, and the frequency energy value corresponding to the bolting torque of 50 N·m is defined as E h e , by which the Pre-alarming indicator based on WP, i.e., EI_WP is calculated according to Equation (17). By corresponding the W i e to the bolting torque N, the scatter diagram is shown in Figure 10.
Based on the EMD analysis and correlation threshold processing of the acceleration data, the real intrinsic mode function components are calculated and transformed by Hilbert transform to obtain the Hilbert spectrum. The Hilbert marginal spectrum is calculated by being integrated in time domain. Selecting the calculated results with the characteristic frequency from 100 Hz to 200 Hz, the energy value E i h is calculated according to Equation (19) under 9 different bolting torques. Defining the energy value corresponding to the bolting torque of 50 N·m is defined as E h m , the characteristic energy early warning index W m is calculated and obtain. By correlating the W i m to the bolting torque N, the scatter diagram is shown in Figure 6 as well.
The scatter plots between the bolting torques and four pre-alarming indicators are summarized and shown in Figure 6. It is presented that there is well-defined mapping relationship between the four pre-alarming indicators and bolting torques. As the bolting torque increases from 0 N·m to 2 N·m, four indicators grow constantly and reached the greatest value at the 2 N·m, while the four indicators decrease persistently with the growth of bolting torque from 2 N·m to 50 N·m. Defining the extremely loose state as the bolting torque of 2 N·m, four indicators can be applied to profile the damage relating to bolting looseness.

5.3. Construction of Pre-Alarming System

Related technical code [15] has recommended that the bolting torque of SSBs is no less than 40 N·m, and it has been obtained from the test that the seismic capacity reduces by more than 80% as the bolting torque drops by 50%. To adequately assess safety state of SSBs, SSBs with bolting torque greater than 30 N·m are identified as been in good condition. In addition, SSBs where the bolting torque between 20 N·m and 30 N·m, where the seismic capacity is greater than 80% of requirement, are identified as lightly-damaged state. As the bolting torque is no greater than 20 N·m, the SSBs are considered as severely-damaged state.
The acceleration data of SSBs are first measured and collected by wireless sensors. Thereafter, four indicators are calculated and compared to the yellow-alarming and red-alarming threshold values. If the all the four indicators are within the good state, the monitored SSB is identified as state of normal, which is labeled green. If either one of the four indicators is within the state of lightly-damaged while the other indicators are within the good state, the monitored SSB is identified as state of yellow-alarming. Otherwise, even if either one of the four indicators is within the severely-damaged state, the monitored SSB is identified as state of red-alarming, which indicates that the SSBs specimen require being repaired or reinforced.

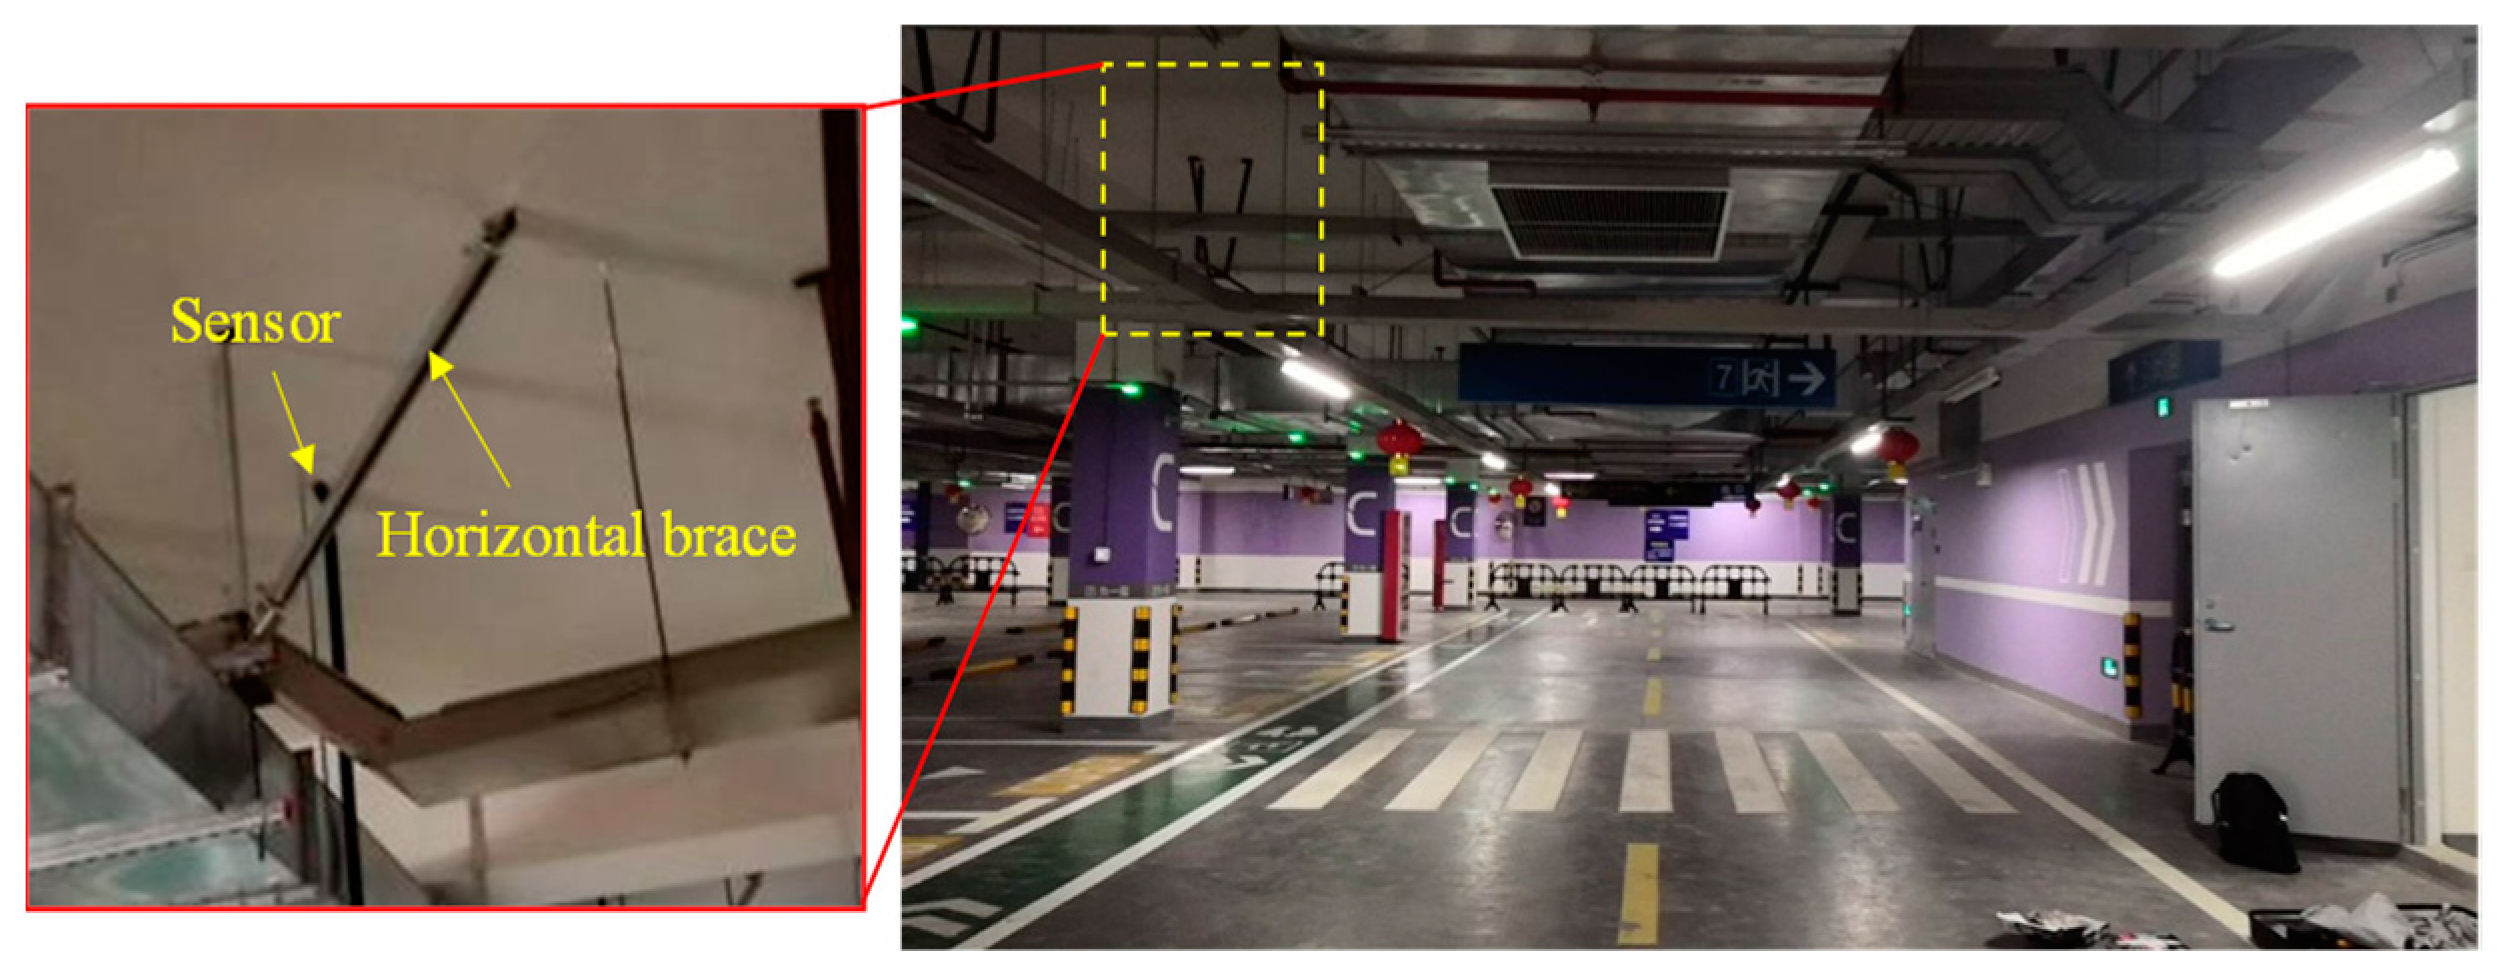
5.4. Application in Actual Project

To verify the effectiveness of the pre-alarming method for SSBs, a vibration-based monitoring system was installed in an actual project. The project is located at the basement of Nanjing International Expo Center in Nanjing, China, as shown in Figure 10. The monitoring system comprises 100 wireless acceleration sensors, 2 wireless gateway devices, 2 pairs of optical machines, 2 switches, 1 server and 1 cloud terminal. In the monitoring system, the pre-alarming threshold value for four indicators is shown in Table 2, which is obtained and confirmed through a pre-test in the actual project before the system is installation.
To reduce the amount of monitoring data, the working time of sensors is set as 60 s per day and the sampling frequency is set to 800 Hz. Having collected 1684 sets of data in each day, all the data is then uploaded to the cloud server to process and calculate four pre-alarming indicators for determination of the state of monitored SSBs. If the monitored SSBs are within the scope of a yellow or even red alarming state, the assessment results are sent to administrators through an APP or a short message.
During the monitoring period which lasted 1 year, 88 out of 100 monitored SSBs are within the green state. In addition, eight and four monitored SSBs were reported as yellow-alarming and red-alarming states, respectively. Through the on-site inspection, the bolting torque of all eight yellow-alarming SSBs was greater than 20 N·m, and four red-alarming SSBs are even found to sway, which are repaired by tightening up the connecting bolts. Two of the shaking SSBs, identified by the sensor codes, are selected to demonstrate the variation of the four indicators before and after the repair, which is shown in Figure 11. As shown in the figure, only one of the four indicators reached the standard for the red-alarming state, and the other the indicators reached at the standard of red-alarming state. After the repair by tightening up the connecting bolts, all the four indicators reduced and are within the normal state.

6. Discussion

It is evident from the implementation in the actual project that the recommended method for assessing bolting looseness of SSBs is effective with mayor accuracy. However, some issues should be given attention that the threshold value for bolting-looseness related damage is critical for the safety assessment of SSBs. As the threshold value is determined by experiment or in-situ testing, the dynamic performance of SSBs is influenced by their structural parameters, i.e., cross-section shape and its dimensions, length of the composed components, and angle of the bracing components. Therefore, the bolting torque of SSBs may influence the DWIs with significant ways for SSBs with different structural parameters. Consequently, numerous experiments or tests are required to cover a wide enough range of SSBs, where the threshold values of DWIs can be established more differentiatedly and accurately.

7. Conclusions

SSBs are applied to sustain seismic actions induced by the supporting piping system. However, the bolting looseness of SSBs can reduce their seismic capacity, which has attracted attention from academic and engineering fields. As most SSBs are covered by decorating plates making it difficult to access, the in-situ monitoring and pre-alarming system is required to carry out real-time identification of seismic performance. To accurately and effectively evaluate bolting looseness of SSBs, a vibration-based monitoring and pre-alarming method is established by using four pre-alarming indicators by integrating FFT, WP, IMF and MHS, respectively. By experimental verification and actual-project application, several conclusions are drawn as follows:
(1)
Compared with traditional frequency-based indicators, four recommended pre-alarming indicators exhibit more preferable sensitivity to the bolting torque of the SSBs. As the bolting torque of SSBs reduces from 50 N·m to 2 N·m, the four indicators increase monotonically and nonlinearly, which has shown satisfactory mapping relations with the bolting looseness. According to the repeating test under similar conditions, the mapping relation between the four indicators and bolting torque is stable and reliable, satisfying the requirements for application in actual projects.
(2)
The corresponding bolting torques for the slightly-damaged and severely-damaged states are recommended as 30 N·m and 20 N·m, respectively, and SSBs can be assessed as safe as all four pre-alarming indicators are smaller than the threshold value of slightly damaged. Through verification in an actual project, the recommended multi-level safety evaluation method can accurately assess actual bolting looseness of SSBs, where the bolting torque of monitored SSBs corresponds well with four pre-alarming indicators.
(3)
Although the recommended method can effectively evaluate the events of bolting looseness, the relationship between the bolting looseness and seismic capacity of the SSB structure is diversified and complicated. In the future, investigations must be conducted to establish pre-alarming indicators that are indirectly related to the seismic capacity of the SSB structure.

Author Contributions

Conceptualization, Y.S. and C.W.; methodology, J.M.; validation, S.W., J.L. and J.M.; formal analysis, J.M.; investigation, J.M.; resources, J.L.; data curation, J.M.; writing—original draft preparation, Y.S.; writing—review and editing, Y.S. and S.W.; supervision, C.W.; project administration, Y.S.; funding acquisition, Y.S. All authors have read and agreed to the published version of the manuscript.

Funding

The research was supported by the Program of National Natural Science Foundation (grant nos. 51978154, 52108108 and 52008202) and the Jiangsu Natural Science Foundation (grant no. BK20211003).

Data Availability Statement

Some or all data, models, or codes that support the findings of this study are available from the corresponding author upon reasonable request.

Conflicts of Interest

The authors declare that there are no conflicts of interest regarding the publication of this paper.

References

  1. Ayers, J.M.; Phillips, R. Northridge Earthquake Hospital Water Damage Study; Ayers & Ezers Associates, Inc.: Los Angeles, CA, USA, 1996. [Google Scholar]
  2. Ju, B.S. Seismic Fragility of Piping System; North Carolina State University: Raleigh, NC, USA, 2012. [Google Scholar]
  3. Mizutani, K.; Kim, H.; Kikuchihara, M.; Nakai, T.; Nishino, M.; Sunouchi, S. The damage of the building equipment under the 2011 Tohoku pacific earthquake. In Proceedings of the 9th International Conference on Urban Earthquake Engineering & 4th Asia Conference on Earthquake Engineering, Tokyo, Japan, 6–8 March 2012; Tokyo Institute of Technology: Tokyo, Japan, 2012. [Google Scholar]
  4. Tian, Y.; Filiatrault, A.; Mosqueda, G. Seismic response of pressurized fire sprinkler pi** systems I: Experimental study. J. Earthq. Eng. 2015, 19, 649–673. [Google Scholar] [CrossRef]
  5. Miranda, E.; Mosqueda, G.; Retamales, R.; Pekcan, G. Performance of nonstructural components during the 27 February 2010 Chile earthquake. Earthq. Spectra 2012, 28, 453–471. [Google Scholar] [CrossRef]
  6. Pickett, M.A. The Effects of the 17 January 1994 Northridge Earthquake on Hospital Lifelines, Technical council on Lifeline Earthquake Engineering Monograph, Lifeline Earthquake Engineering. In Lifeline Earthquake Engineering; ASCE: Reston, VA, USA, 1995. [Google Scholar]
  7. Tian, Y. Experimental Seismic Study of Pressurized Fire Suppression Sprinkler Piping System. Ph.D. Thesis, University at Buffalo, Stale University of New York, New York, NY, USA, 2012. [Google Scholar]
  8. Shang, Q.; Wang, T. Experimental study on seismic performance of flexible pipelines used in base isolated buildings. J. Nat. Disasters 2018, 27, 50–60. [Google Scholar]
  9. Wood, R.L.; Hutchinson, T.C.; Hoehler, M.S.; Kreidl, B. Experimental characterization of trapeze assemblies supporting suspended nonstructural systems. In Proceedings of the Tenth U.S. National Conference on Earthquake Engineering, Anchorage, Alaska, 21–25 July 2014. [Google Scholar]
  10. Filiatrault, A.; Perrone, D.; Brunesi, E.; Beiter, C.; Piccinin, R. Effect of cyclic loading protocols on the experimental seismic performance evaluation of suspended piping restraint installations. Int. J. Press. Vessel. Pip. 2018, 166, 61–71. [Google Scholar] [CrossRef]
  11. Shang, Q.; Qiu, L.; Wang, T.; Li, J. Experimental and analytical study on performance of seismic sway braces for suspended piping systems. J. Build. Eng. 2022, 57, 104826. [Google Scholar] [CrossRef]
  12. He, S.; Qu, Z.; Zhou, H.; Dai, J.; Wang, D. State of the practice review of lesting nonstructural components in seismic areas. China Civ. Eng. J. 2017, 9, 16–27. (In Chinese) [Google Scholar]
  13. He, S.; Qu, Z.; Ye, L. Experiment study on the seismic fragility of water supply pipelines in buildings. China Civ. Eng. J. 2018, 51, 9. (In Chinese) [Google Scholar]
  14. Meng, J. Research on Intelligent Monitoring System of Seismic Support Hanger. Ph.D. Dissertation, Southeast University, Nanjing, China, 2012. (In Chinese). [Google Scholar]
  15. Ministry of Housing and Urban-Rural Development of the People’s Republic of China; National standard of the People’s Republic of China. Code for Seismic Design of Building Electromechanical Engineering; China Architecture and Building Press: Beijing, China, 2015. [Google Scholar]
  16. Deng, Z.; Huang, M.; Wan, N.; Zhang, J. The Current Development of Structural Health Monitoring for Bridges: A Review. Buildings 2023, 13, 1360. [Google Scholar] [CrossRef]
  17. Huang, M.; Zhang, J.; Li, J.; Deng, Z.; Luo, J. Damage identification of steel bridge based on data augmentation and adaptive optimization neural network. Struct. Health Monit. 2024, 14759217241255042. [Google Scholar] [CrossRef]
  18. Huang, M.; Zhang, J.; Hu, J.; Ye, Z.; Deng, Z.; Wan, N. Nonlinear modeling of temperature-induced bearing displacement of long-span single-pier rigid frame bridge based on DCNN-LSTM. Case Stud. Therm. Eng. 2024, 53, 103897. [Google Scholar] [CrossRef]
  19. Qu, W.; Zhang, M.; Zhou, J.; Xiao, L. Using Sub-harmonic Resonance to Detect Bolted Joint Looseness. J. Vib. Meas. Diagn. 2017, 37, 5. (In Chinese) [Google Scholar]
  20. Esmaeel, R.A.; Taheri, F. Application of a simple and cost-effective method for detection of bolt self-loosening in single lap joints. Nondestruct. Test. Eval. 2013, 28, 208–225. [Google Scholar] [CrossRef]
  21. Hartwigsen, C.; Song, Y.; McFarland, D.; Bergman, L.; Vakakis, A. Experimental study of non-linear effects in a typical shear lap joint configuration. J. Sound Vib. 2004, 277, 327–351. [Google Scholar] [CrossRef]
  22. Jaques, J.; Adams, D.E. Using Impact Modulation to Detect Loose Bolts in a Satellite; Springer: New York, NY, USA, 2012. [Google Scholar] [CrossRef]
  23. Loutridis, S. Damage detection in gear systems using empirical mode decomposition. Eng. Struct. 2004, 26, 1833–1841. [Google Scholar] [CrossRef]
  24. Huang, N.E. New method for nonlinear and nonstationary time series analysis: Empirical mode decomposition and Hilbert spectral analysis. Proc. SPIE Int. Soc. Opt. Eng. 2000, 4056, 197–209. [Google Scholar] [CrossRef]
  25. Mincigrucci, L.; Civera, M.; Lenticchia, E.; Ceravolo, R.; Rosano, M.; Russo, S. Comparative Structural Analysis of GFRP, Reinforced Concrete, and Steel Frames under Seismic Loads. Materials 2023, 16, 4908. [Google Scholar] [CrossRef]
  26. Marco, C.; Cecilia, S. Instantaneous Spectral Entropy: An Application for the Online Monitoring of Multi-Storey Frame Structures. Buildings 2022, 12, 310. [Google Scholar] [CrossRef]
  27. Zhang, J.; Huang, M.; Wan, N.; Deng, Z.; He, Z.; Luo, J. Missing measurement data recovery methods in structural health monitoring: The state, challenges and case study. Measurement 2024, 231, 114528. [Google Scholar] [CrossRef]
  28. Qiu, L.; Yuan, S.; Zhang, X.; Wang, Y. A time reversal focusing based impact imaging method and its evaluation on complex composite structures. Smart Mater. Struct. 2011, 20, 105014. [Google Scholar] [CrossRef]
  29. Dutt, A.; Rokhlin, V. Fast Fourier Transforms for Nonequispaced Data. Siam J. Sci. Comput. 1993, 14, 1368–1393. [Google Scholar] [CrossRef]
  30. Ding, Y.L.; Li, A.Q.; Deng, Y. Structural Damage Warning of a Long-Span Cable-Stayed Bridge Using Novelty Detection Technique Based on Wavelet Packet Analysis. Adv. Struct. Eng. 2010, 13, 291–298. [Google Scholar] [CrossRef]
  31. Rai, V.K.; Mohanty, A.R. Bearing fault diagnosis using FFT of intrinsic mode functions in Hilbert–Huang transform. Mech. Syst. Signal Process. 2007, 21, 2607–2615. [Google Scholar] [CrossRef]
  32. Kunwar, A.; Jha, R.; Whelan, M.; Janoyan, K. Damage detection in an experimental bridge model using Hilbert–Huang transform of transient vibrations. Struct. Control. Health Monit. 2013, 20, 1–15. [Google Scholar] [CrossRef]
Figure 1. Components of SSBs.
Buildings 14 02711 g001
Figure 2. Two typical failure modes of SSBs.
Buildings 14 02711 g002
Figure 3. Nonlinear vibration model of SSBs.
Buildings 14 02711 g003
Figure 4. Procedure of bolting looseness assessment.
Buildings 14 02711 g004
Figure 5. Test setup.
Buildings 14 02711 g005
Figure 6. Wireless acceleration sensor.
Buildings 14 02711 g006
Figure 7. Acceleration spectrums under 9 different bolting torques.
Buildings 14 02711 g007
Figure 8. Scatter diagram between N and four Pre-alarming indicators.
Buildings 14 02711 g008
Figure 9. Energy-ratio distribution along nodes.
Buildings 14 02711 g009
Figure 10. Actual view of application project.
Buildings 14 02711 g010
Figure 11. Variation of four indicators before and after repairment of red-alarming SSBs.
Buildings 14 02711 g011
Table 1. Calculated results of F i and W i f .
Bolting Torque N (N·m)02581020304050
F 1 143132.59130.8134.4144.6142.8142.8148.2143.7
F 2 143.6130.8130.8136.1142.8143.3146.4145.0148.2
F 3 142.8130.4131.7140.1145.9146.8143.7144.2148.2
F 4 141.9130.8131.2144.6144.6144.6143.7145145.9
F 5 139.3131.2131.7145141.9141.9144.6146.4145
F 6 139.3130.3131.2143.2143.7146.8147.3146.8147.3
F 7 136.6128.1131.7139.7143.2145146.8146.4146.8
F 8 138.8129.5134.3146.8144.2145146146.8147
F 9 139.3131131.5142145144.7145.6146146.7
F 10 136.6130.5131.8143145.2145.8146.2144.6147.5
F ̄ 140.1130.5131.5141.7144144.7145.3145.8146.8
W i f 4.551110.453.461.871.390.970.630
Table 2. Threshold value of four indicators in the actual project.
Threshold Value W f W w W e W h
Lightly damaged1.510.025.040.0
Severely damaged2.025.040.060.0
Disclaimer/Publisher’s Note: The statements, opinions and data contained in all publications are solely those of the individual author(s) and contributor(s) and not of MDPI and/or the editor(s). MDPI and/or the editor(s) disclaim responsibility for any injury to people or property resulting from any ideas, methods, instructions or products referred to in the content.

