
Research on the Optimization Design of the Atrium Space Form in University Libraries Based on the Coupling of Daylighting and Energy Consumption

Abstract
:1. Introduction
1.1. The Natural Lighting and Air Conditioning Energy Consumption of the Atrium
1.2. Multi-Objective Optimization
2. Methodology
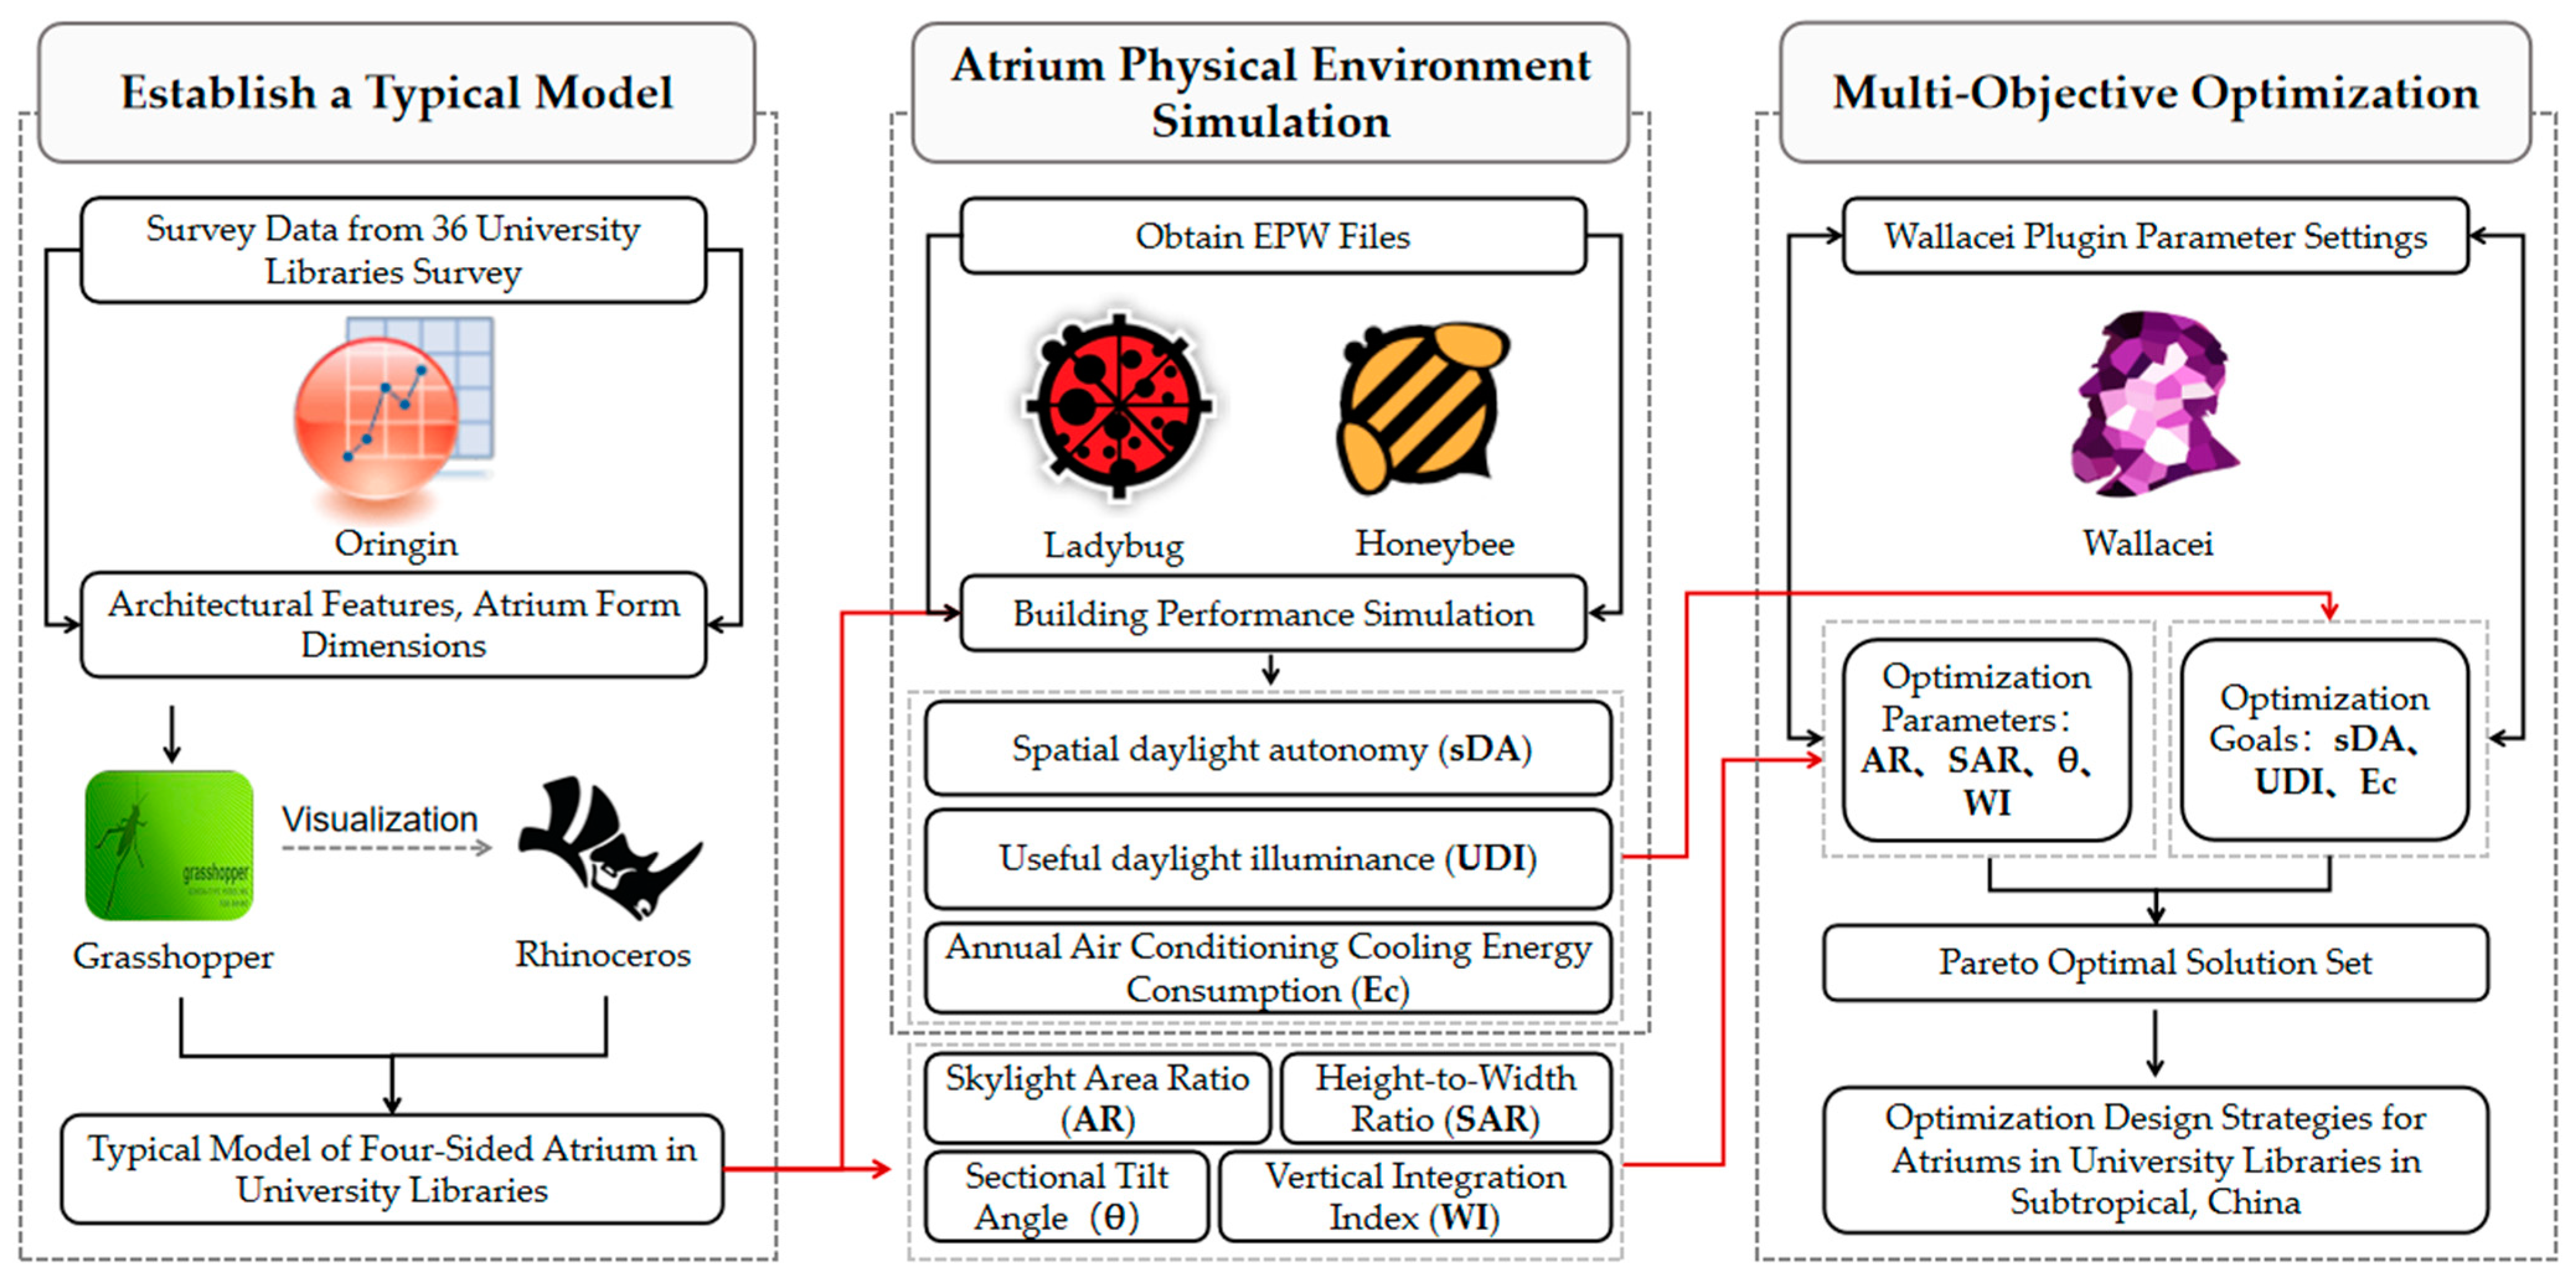
2.1. Technical Route
- (1)
- Establishment of a typical model: We conducted a nationwide field survey of 36 university library atriums and collected and analyzed data to establish a typical parametric atrium model based on this information.
- (2)
- Simulation of the atrium’s physical environment: We performed detailed building performance simulations for the typical atrium model using the Ladybug and Honeybee plugins. The simulation results included the spatial daylight autonomy (sDA), the percentage of useful daylight illuminance (UDI), and the air conditioning energy consumption (EC), providing a quantitative basis for assessing the daylighting quality and energy consumption level of the atrium.
- (3)
- Multi-objective optimization: Furthermore, we used the Wallacei plugin in conjunction with genetic algorithms to conduct multi-objective optimization of the atrium design. In this stage, we set optimization parameters and objectives and generated a set of Pareto optimal solutions through an iterative process. These solutions represent design schemes that balance natural daylighting and air conditioning energy consumption, and the best atrium morphological design schemes were further selected through performance analysis.
2.2. Construct the Typical Analytical Model
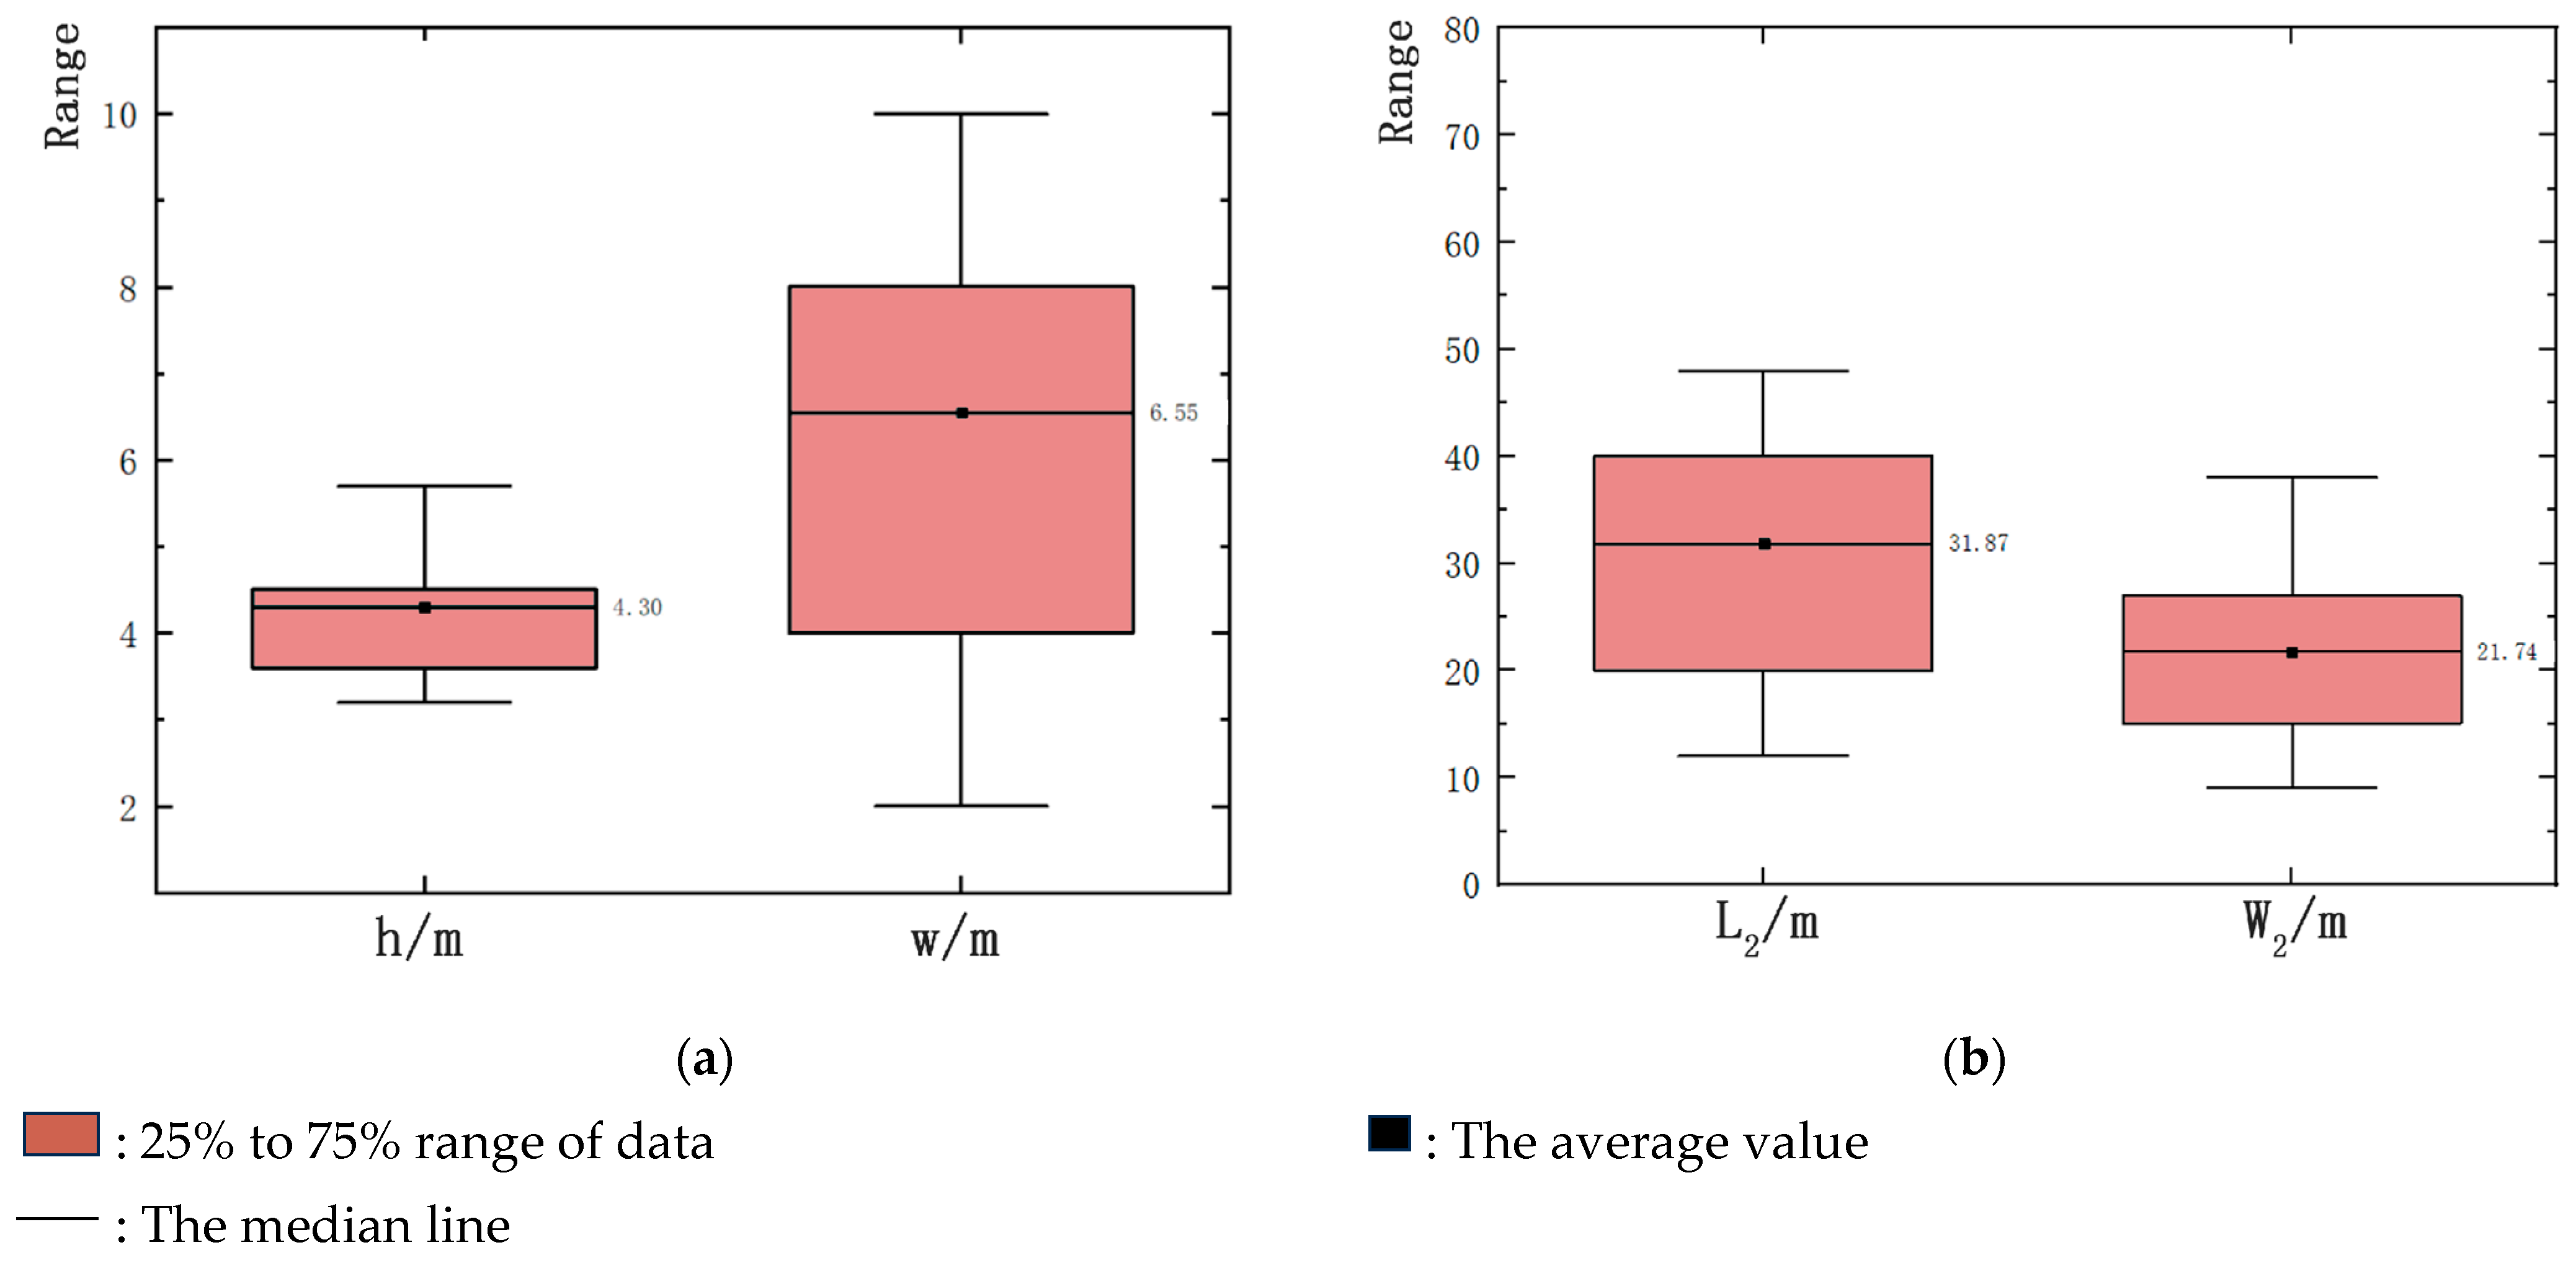
2.2.1. Survey Data Collection
2.2.2. Establish Typical Model
2.3. Research Region
2.4. Daylighting and Energy Consumption Simulation Optimization Analysis
2.4.1. Enclosure Structural Parameter Settings
2.4.2. Morphological Optimization Parameter Settings
2.4.3. Settings of Optimize Performance Indicator
2.4.4. Settings of Personnel and Equipment Parameters
2.5. Settings of Wallacei Plugin
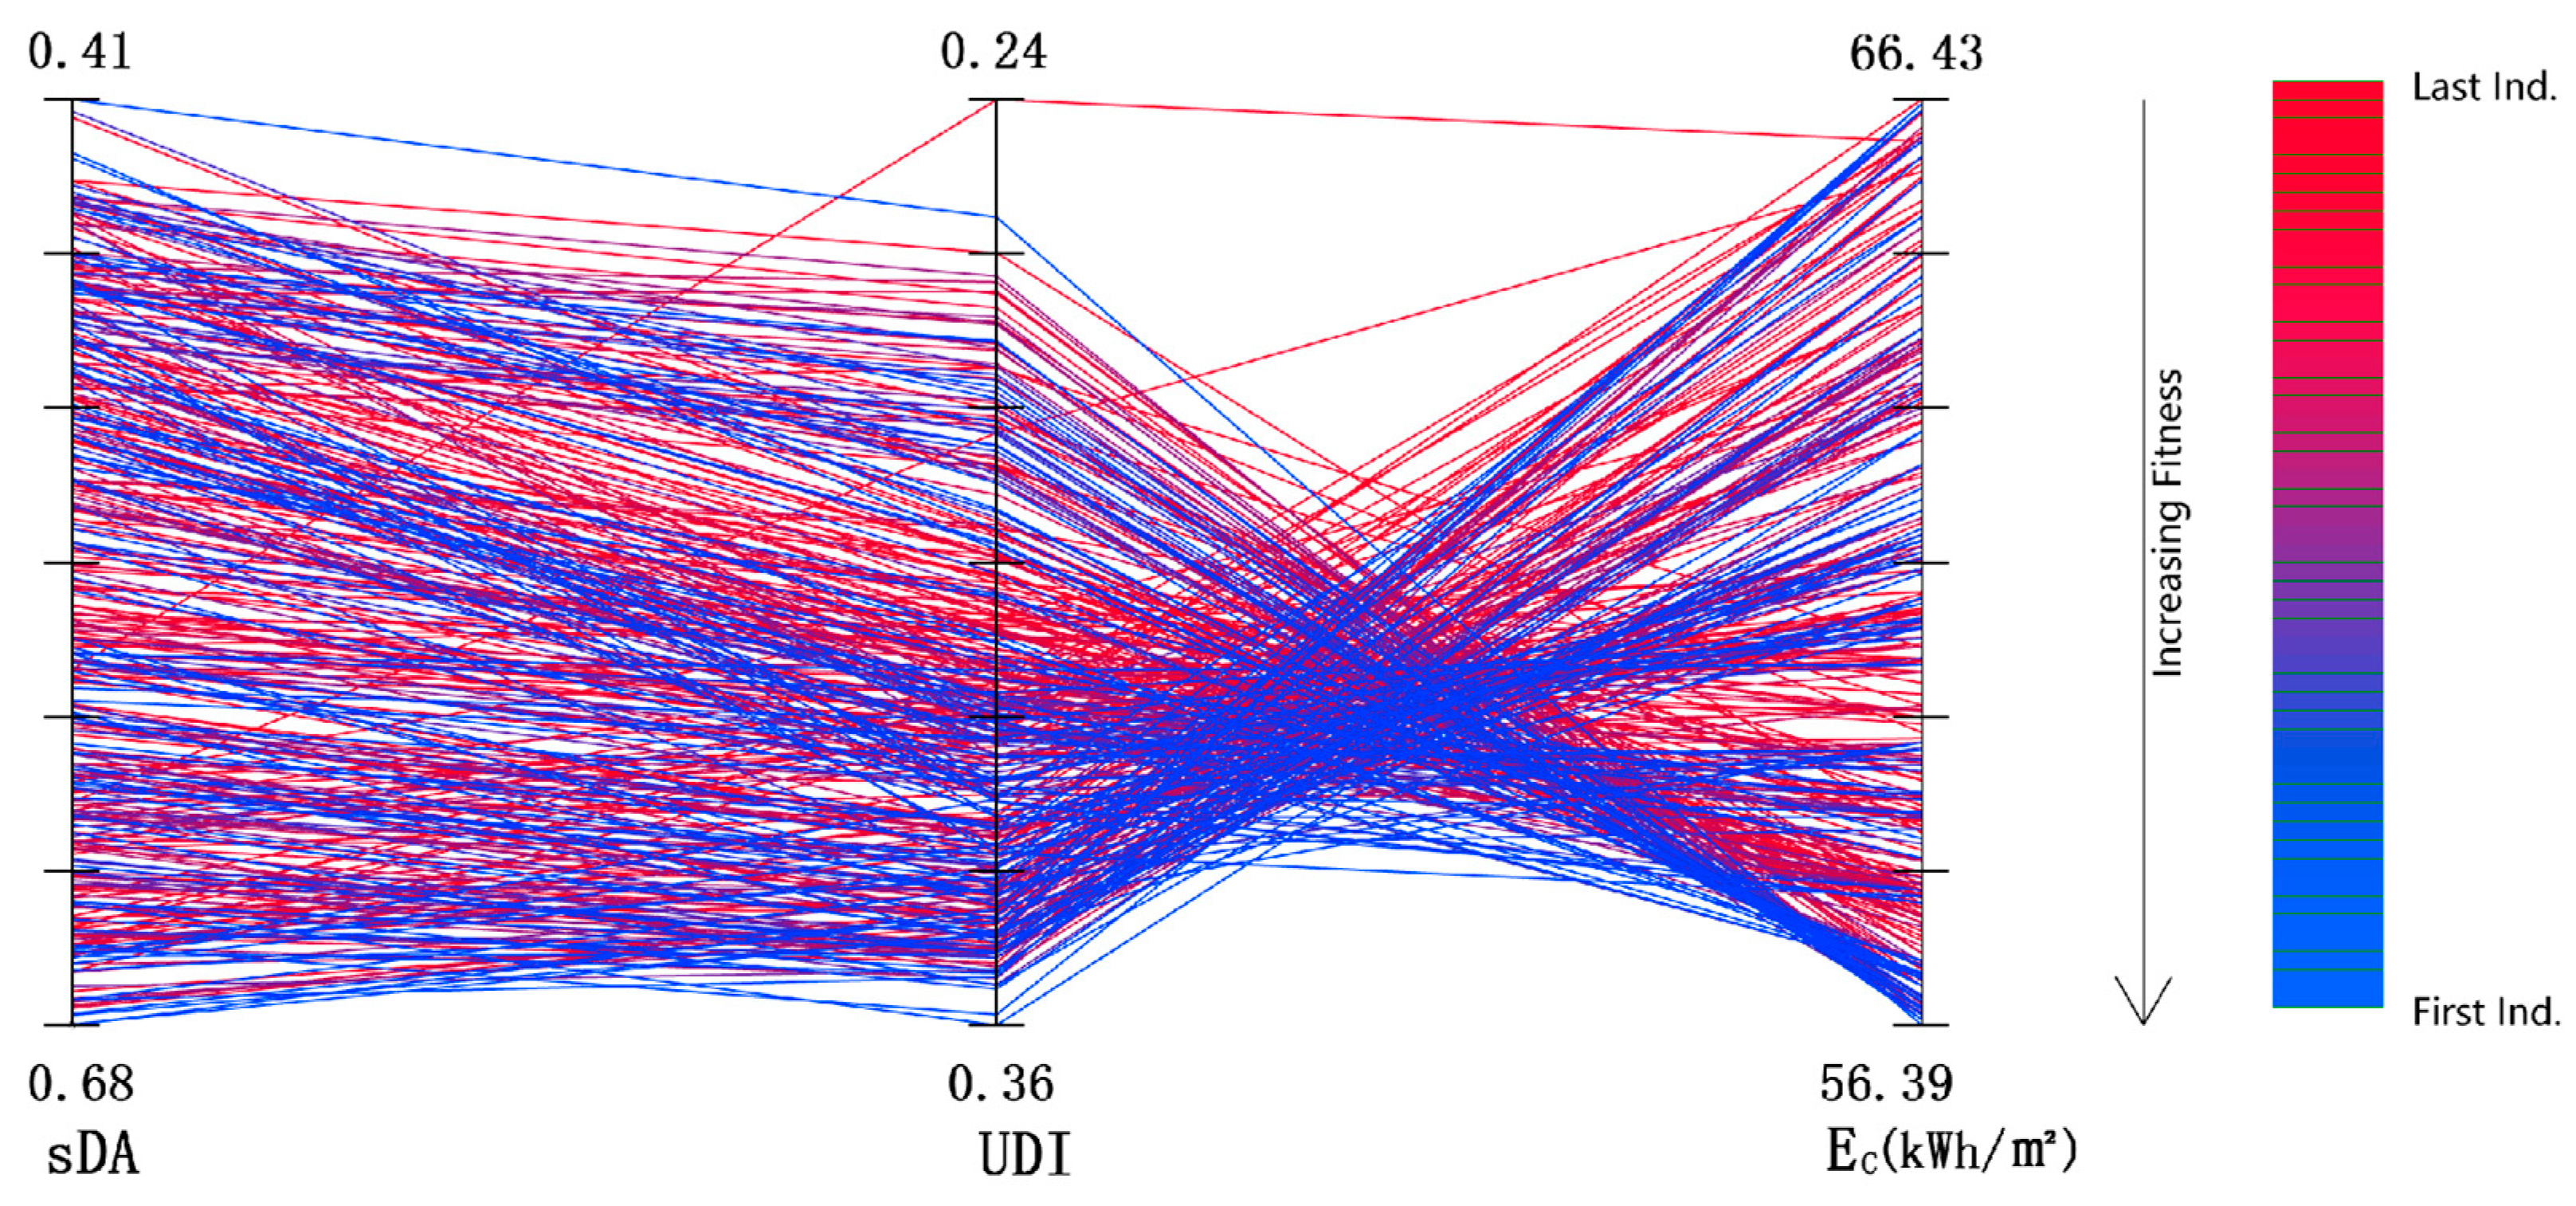
3. Result
4. Discussion
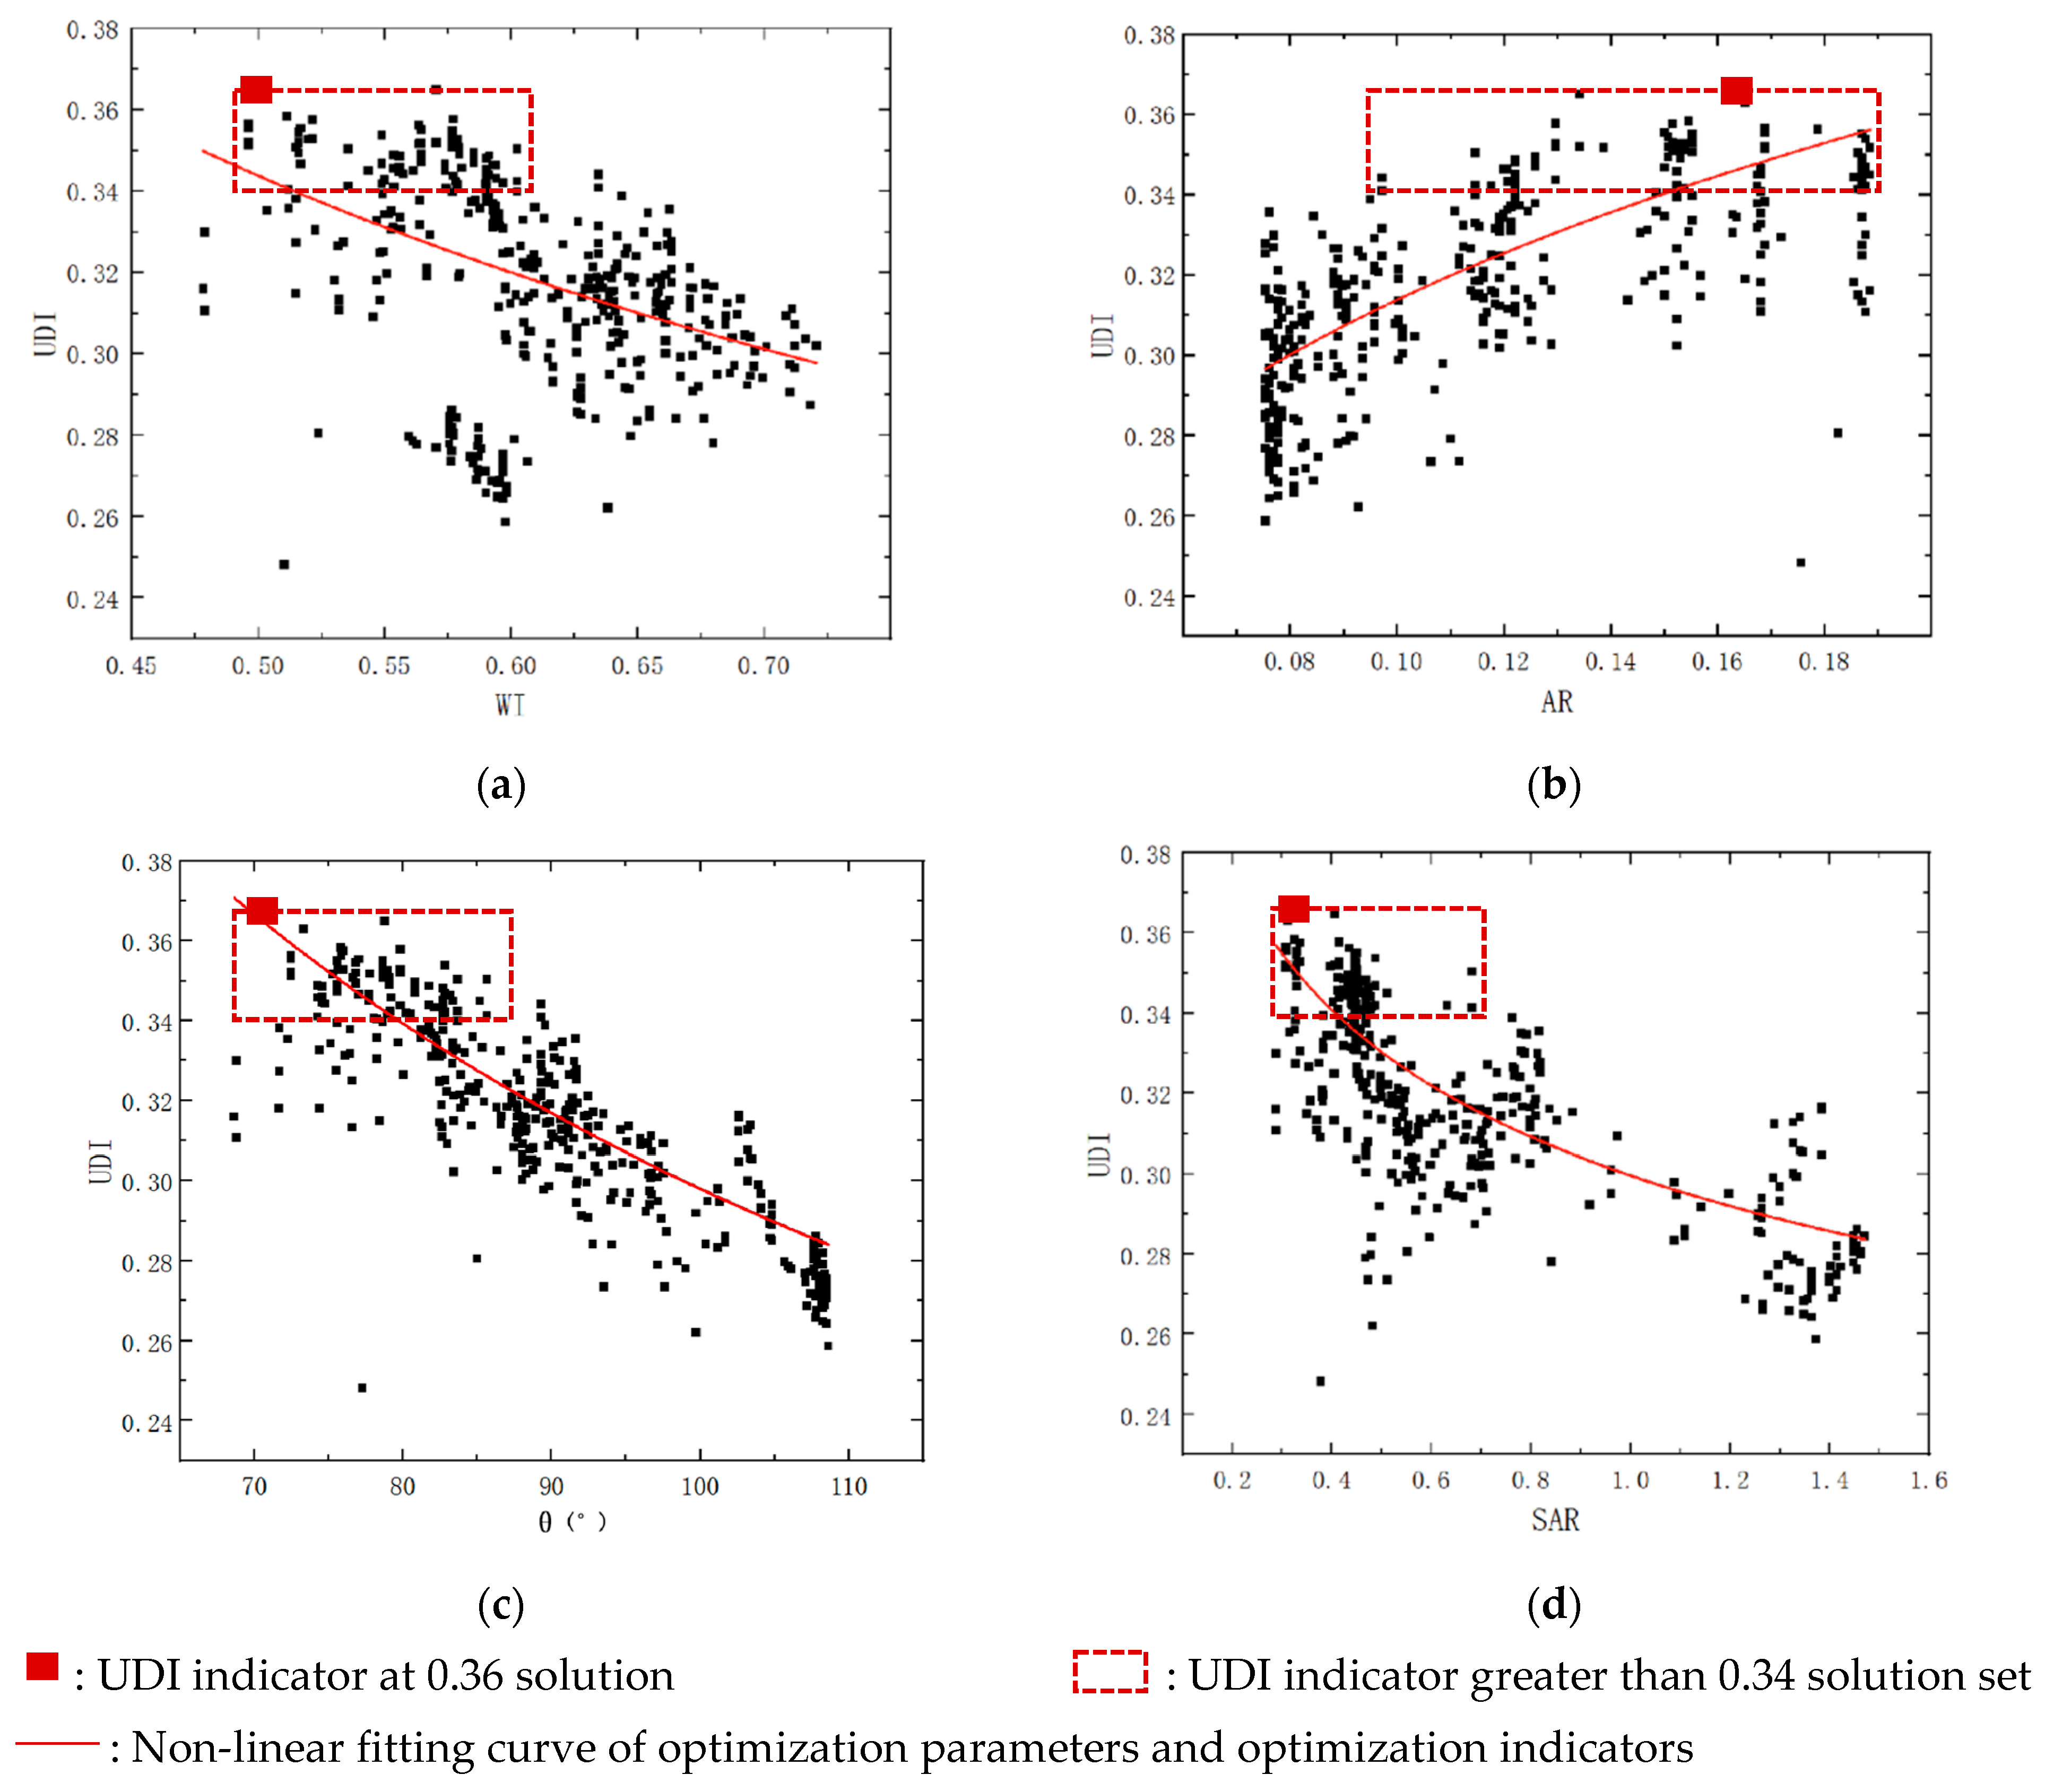
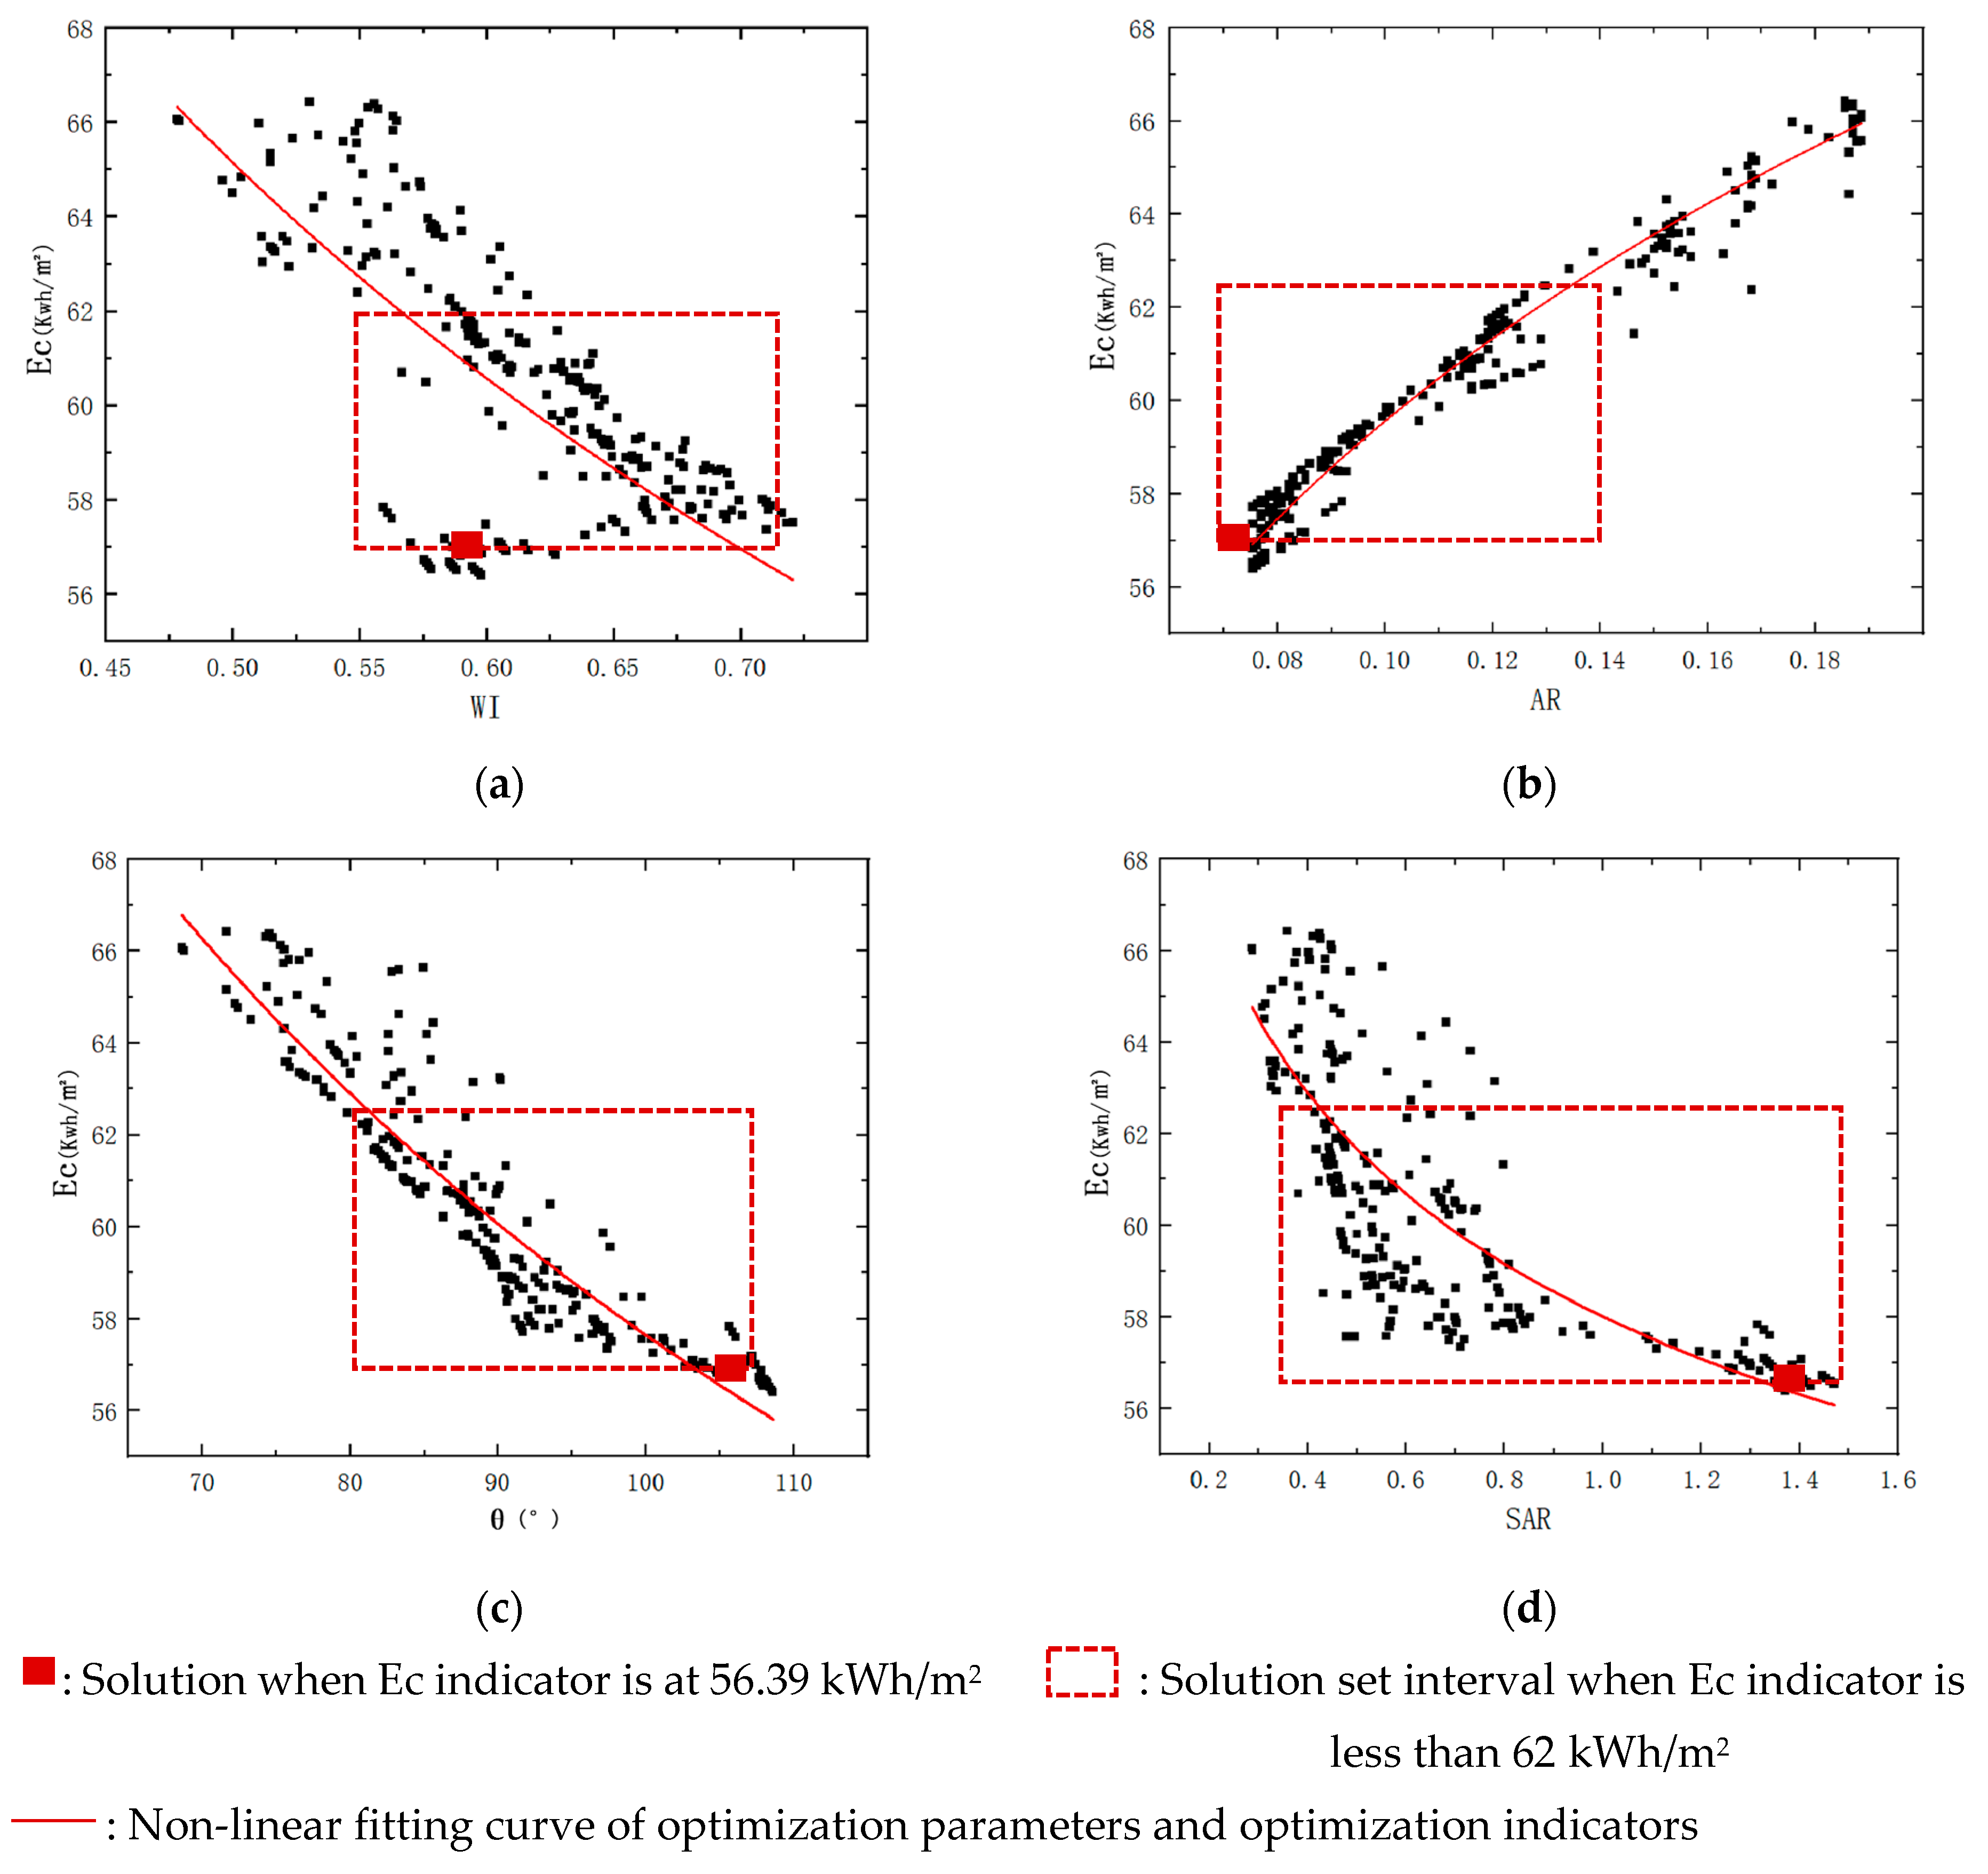
4.1. Analysis of Interrelationship between Optimization Parameters and Performance Indicators
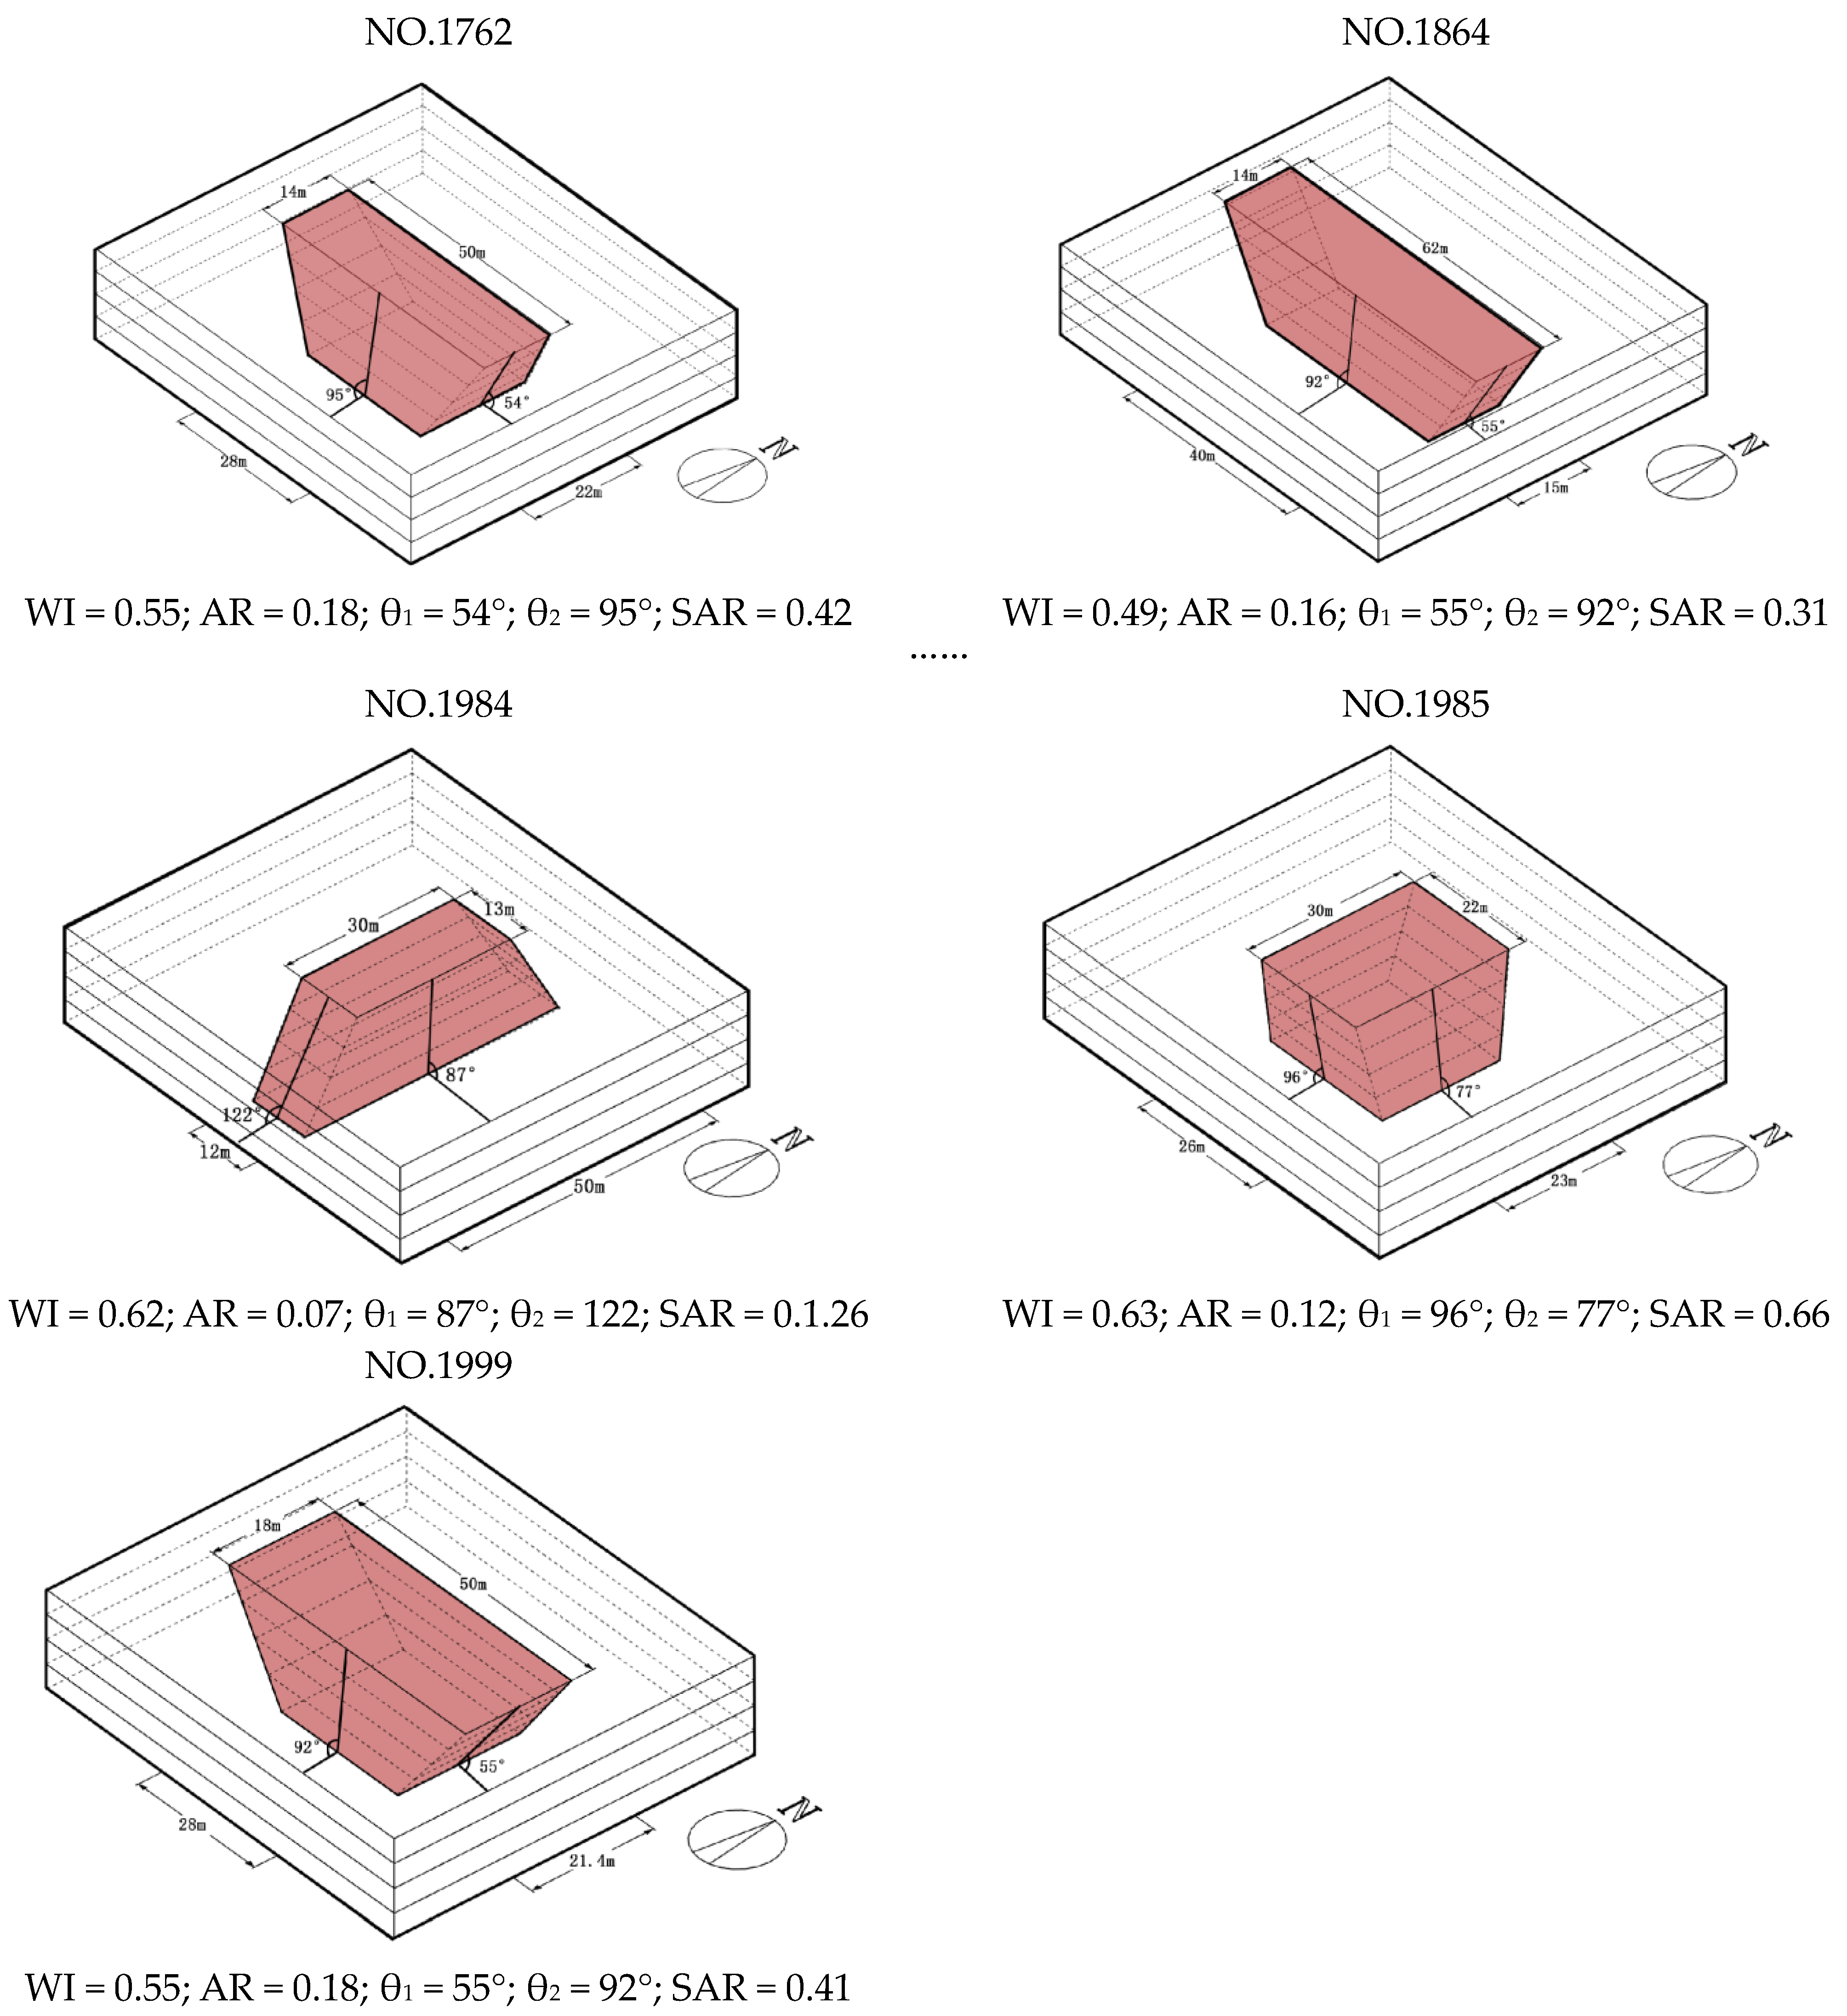
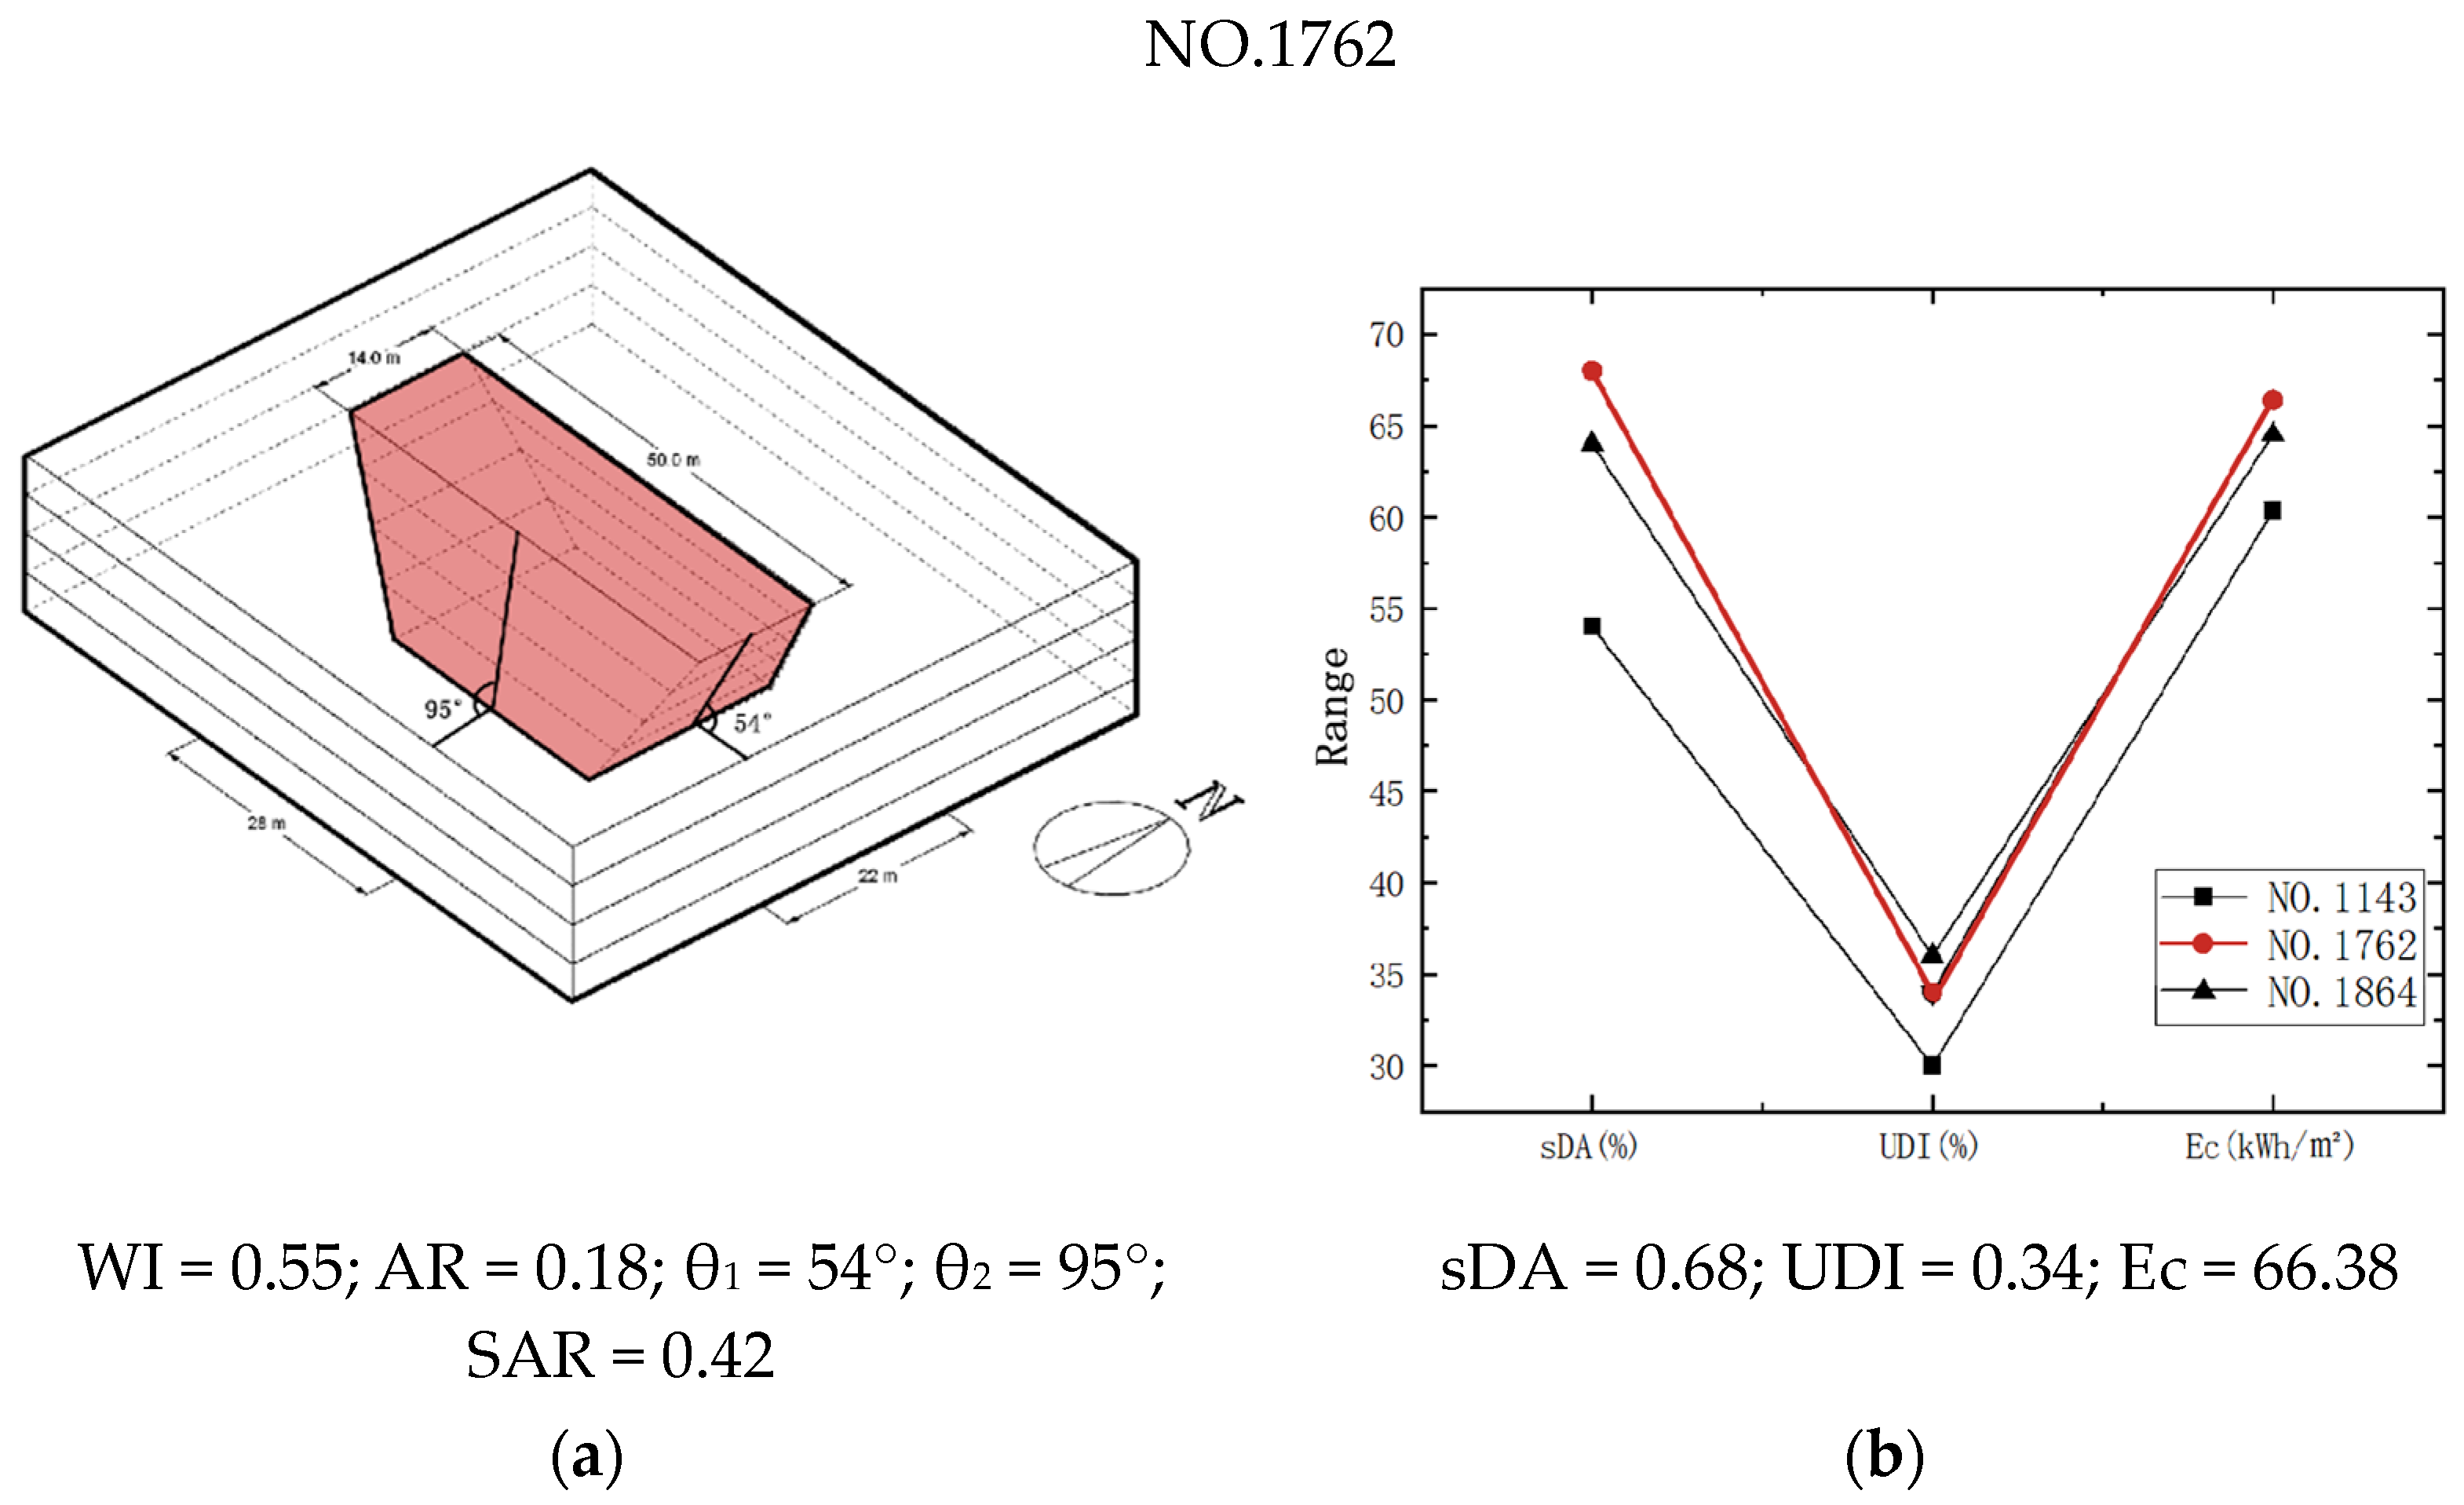
4.2. Selected Optimized Solutions Analysis
5. Conclusions and Future Work
- WI, θ, and SAR show an inverse relationship with sDA, UDI, and EC indicators, while AR shows a direct proportionality with these indicators. When WI = 0.55, AR = 0.07, θ1 = 53°, θ2 = 95°, and SAR = 0.42, sDA reaches its maximum value of 0.68, indicating the optimal natural daylighting effect in the atrium.
- When WI = 0.55, AR = 0.19, θ1 = 53°, θ2 = 95°, and SAR = 0.42, the sDA reaches its maximum value of 0.68, indicating the best natural daylighting effect in the atrium. When WI = 0.49, AR = 0.16, θ1 = 54°, θ2 = 92°, and SAR = 0.36, UDI reaches its maximum value of 0.36, indicating the best effective natural daylighting in the atrium; when WI = 0.59, AR = 0.07, θ1 = 84°, θ2 = 133°, and SAR = 1.37, EC is minimized to 56.39 kWh/m2, indicating the lowest air conditioning energy consumption in the atrium.
- Increasing the length of the atrium’s east–west skylights and reducing the profile aspect ratio (SAR) can significantly enhance natural daylighting in the atrium; when the profile inclination angle is less than 90°, reducing the east–west section inclination angle of the atrium can improve indoor natural daylighting; when the section inclination angle is greater than 90°, increasing the north–south section inclination angle of the atrium can effectively reduce indoor energy consumption.
Author Contributions
Funding
Data Availability Statement
Conflicts of Interest
References
- Lee, J.H. Identifying Spatial Meanings of Atria in Built Environment and How They Work. J. Asian Archit. Build. Eng. 2019, 18, 247–261. [Google Scholar] [CrossRef]
- Chen, G.; Chen, Y.; Tan, X.; Zhao, L.; Cai, Y.; Li, L. Assessing the Urban Heat Island Effect of Different Local Climate Zones in Guangzhou, China. Build. Environ. 2023, 244, 110770. [Google Scholar] [CrossRef]
- Lam, C.K.C.; Gao, Y.; Yang, H.; Chen, T.; Zhang, Y.; Ou, C.; Hang, J. Interactive Effect between Long-Term and Short-Term Thermal History on Outdoor Thermal Comfort: Comparison between Guangzhou, Zhuhai and Melbourne. Sci. Total Environ. 2021, 760, 144141. [Google Scholar] [CrossRef]
- Ji, Y.; Xu, M.; Zhang, T.; He, Y. Intelligent Parametric Optimization of Building Atrium Design: A Case Study for a Sustainable and Comfortable Environment. Sustainability 2023, 15, 4362. [Google Scholar] [CrossRef]
- Yi, R.; Shao, L.; Su, Y.; Riffat, S. Daylighting Performance of Atriums in Subtropical Climate. Int. J. Low-Carbon Technol. 2009, 4, 230–237. [Google Scholar] [CrossRef]
- Wang, Z.; Wang, W.; Zhang, Y.; Song, J.; Zhu, L. Research on Energy-Saving Design Strategies of Libraries in Severe Cold Regions: Taking a University in Xinjiang as an Example. Energy Rep. 2021, 7, 1101–1113. [Google Scholar] [CrossRef]
- Chen, Z.; Cui, Y.; Zheng, H.; Ning, Q. Optimization and Prediction of Energy Consumption, Light and Thermal Comfort in Teaching Building Atriums Using NSGA-II and Machine Learning. J. Build. Eng. 2024, 86, 108687. [Google Scholar] [CrossRef]
- Feng, K.; Lu, W.; Wang, Y. Assessing Environmental Performance in Early Building Design Stage: An Integrated Parametric Design and Machine Learning Method. Sustain. Cities Soc. 2019, 50, 101596. [Google Scholar] [CrossRef]
- Wu, T. Study on Optimization Strategy of Natural Lighting Design in Library Atrium; Shandong Jianzhu University: Jinan, China, 2023. [Google Scholar]
- Wu, P.; Zhou, J.; Li, N. Influences of Atrium Geometry on the Lighting and Thermal Environments in Summer: CFD Simulation Based on-Site Measurements for Validation. Build. Environ. 2021, 197, 107853. [Google Scholar] [CrossRef]
- Guan, Z.; Xu, X.; Xue, Y.; Wang, C. Multi-Objective Optimization Design of Geometric Parameters of Atrium in nZEB Based on Energy Consumption, Carbon Emission and Cost. Sustainability 2022, 15, 147. [Google Scholar] [CrossRef]
- Xue, Y.; Liu, W. A Study on Parametric Design Method for Optimization of Daylight in Commercial Building’s Atrium in Cold Regions. Sustainability 2022, 14, 7667. [Google Scholar] [CrossRef]
- Nie, L.; Ji, X.; Liu, H.; Fang, H.; Liu, X.; Yang, M. Optimization of Thermal and Light in Underground Atrium Commercial Spaces: A Case Study in Xuzhou, China. Int. J. Low-Carbon Technol. 2023, 18, 1227–1250. [Google Scholar] [CrossRef]
- Pang, J.; Fan, Z.; Yang, M.; Liu, J.; Zhang, R.; Wang, W.; Sun, L. Effects of Complex Spatial Atrium Geometric Parameters on the Energy Performance of Hotels in a Cold Climate Zone in China. J. Build. Eng. 2023, 72, 106698. [Google Scholar] [CrossRef]
- Milica, V.; Aleksandr, K. The Influence of Atrium on Energy Performance of Hotel Building. Energy Build. 2017, 156, 140–150. [Google Scholar] [CrossRef]
- Mohsenin, M.; Hu, J. Assessing Daylight Performance in Atrium Buildings by Using Climate Based Daylight Modeling. Sol. Energy 2015, 119, 553–560. [Google Scholar] [CrossRef]
- Rastegari, M.; Pournaseri, S.; Sanaieian, H. Daylight Optimization through Architectural Aspects in an Office Building Atrium in Tehran. J. Build. Eng. 2021, 33, 101718. [Google Scholar] [CrossRef]
- Calcagni, B.; Paroncini, M. Daylight Factor Prediction in Atria Building Designs. Sol. Energy 2004, 76, 669–682. [Google Scholar] [CrossRef]
- Zhang, A.; Bokel, R.; Van Den Dobbelsteen, A.; Sun, Y.; Huang, Q.; Zhang, Q. Optimization of Thermal and Daylight Performance of School Buildings Based on a Multi-Objective Genetic Algorithm in the Cold Climate of China. Energy Build. 2017, 139, 371–384. [Google Scholar] [CrossRef]
- Attia, S.; Gratia, E.; De Herde, A.; Hensen, J.L.M. Simulation-Based Decision Support Tool for Early Stages of Zero-Energy Building Design. Energy Build. 2012, 49, 2–15. [Google Scholar] [CrossRef]
- Tuhus-Dubrow, D.; Krarti, M. Genetic-Algorithm Based Approach to Optimize Building Envelope Design for Residential Buildings. Build. Environ. 2010, 45, 1574–1581. [Google Scholar] [CrossRef]
- Al Mindeel, T.; Spentzou, E.; Eftekhari, M. Energy, Thermal Comfort, and Indoor Air Quality: Multi-Objective Optimization Review. Renew. Sustain. Energy Rev. 2024, 202, 114682. [Google Scholar] [CrossRef]
- Wang, Y.; Yang, W.; Wang, Q. Multi-Objective Parametric Optimization of the Composite External Shading for the Classroom Based on Lighting, Energy Consumption, and Visual Comfort. Energy Build. 2022, 275, 112441. [Google Scholar] [CrossRef]
- Francesca, R.; Ulrich, F.; Elena, L.; Alexandra, T. Energy Retrofit and Conservation of a Historic Building Usingmulti-Objective Optimization and an Analytic Hierarchy Process. Energy Build. 2017, 138, 1–10. [Google Scholar] [CrossRef]
- Chaturvedi, S.; Rajasekar, E.; Natarajan, S. Multi-Objective Building Design Optimization under Operational Uncertainties Using the NSGA II Algorithm. Buildings 2020, 10, 88. [Google Scholar] [CrossRef]
- Xue, Y.; Liu, W. A Study on the Optimization of Atrium Daylight and Energy Performance through Skylight and Shading Design in Commercial Buildings in Cold Zones. Buildings 2023, 13, 228. [Google Scholar] [CrossRef]
- Wu, H.; Deng, F.; Tan, H. Research on Parametric Design Method of Solar Photovoltaic Utilization Potential of Nearly Zero-Energy High-Rise Residential Building Based on Genetic Algorithm. J. Clean. Prod. 2022, 368, 133169. [Google Scholar] [CrossRef]
- Bai, W.; Wu, Y.; He, Y.; Wang, L.; Qiu, Z.; Ye, Y. Optimizing Built Environment in Urban Negative Spaces Using Parametric Methods—Research on a High-Density City in China. Buildings 2024, 14, 1081. [Google Scholar] [CrossRef]
- Li, J.; Wang, Y.; Xia, Y.; Song, Y.; Xie, H. Optimization of Urban Block Form by Adding New Volumes for Capacity Improvement and Solar Performance Using A Multi-Objective Genetic Algorithm: A Case Study of Nanjing. Buildings 2022, 12, 1710. [Google Scholar] [CrossRef]
- Liu, K.; Xu, X.; Huang, W.; Zhang, R.; Kong, L.; Wang, X. A Multi-Objective Optimization Framework for Designing Urban Block Forms Considering Daylight, Energy Consumption, and Photovoltaic Energy Potential. Build. Environ. 2023, 242, 110585. [Google Scholar] [CrossRef]
- Li, R.; Luo, L.; Li, X.; Wu, J.; Jiang, F.; Wang, W. Multi-Objective Optimization for Generative Morphological Design Using Energy and Comfort Models with a Practical Design of New Rural Community in China. Energy Build. 2024, 313, 114282. [Google Scholar] [CrossRef]
- Chen, Z.; Cui, Y.; Zheng, H.; Wei, R.; Zhao, S. A Case Study on Multi-Objective Optimization Design of College Teaching Building Atrium in Cold Regions Based on Passive Concept. Buildings 2023, 13, 2391. [Google Scholar] [CrossRef]
- Pilechiha, P.; Mahdavinejad, M.; Pour Rahimian, F.; Carnemolla, P.; Seyedzadeh, S. Multi-Objective Optimisation Framework for Designing Office Windows: Quality of View, Daylight and Energy Efficiency. Appl. Energy 2020, 261, 114356. [Google Scholar] [CrossRef]
- Zhai, Y.; Wang, Y.; Huang, Y.; Meng, X. A Multi-Objective Optimization Methodology for Window Design Considering Energy Consumption, Thermal Environment and Visual Performance. Renew. Energy 2019, 134, 1190–1199. [Google Scholar] [CrossRef]
- GB 50176-2016; Code for Thermal Design of Civil Buildings; Ministry of Housing and Urban-Rural Development of the People’s Republic of China China Construction Industry Press: Beijing, China, 2016.
- JGJ/T 449-2018; Standard for Green Performance Calculation of Civil Buildings. Ministry of Housing and Urban-Rural Development of the People’s Republic of China China Construction Industry Pres: Beijing, China, 2017.
- Zhang, Y.; Yang, Y.; Zhang, L.; Zhao, C.; Yan, J.; Liu, M.; Zhao, L. Seasonal Variation in Leaf Area Index and Its Impact on the Shading Effects of Vertical Green Facades in Subtropical Areas. Build. Environ. 2022, 225, 109629. [Google Scholar] [CrossRef]
- GB 55015-2021; General Specification for Building Energy Efficiency and Renewable Energy Utilization; Ministry of Housing and Urban-Rural Development of the People’s Republic of China China Construction Industry Pres: Beijing, China, 2022.
- De Luca, F.; Simson, R.; Voll, H.; Kurnitski, J. Daylighting and Energy Performance Design for Single Floor Commercial Hall Buildings. MEQ 2018, 29, 722–739. [Google Scholar] [CrossRef]
- Berardi, U.; Wang, T. Daylighting in an Atrium-Type High Performance House. Build. Environ. 2014, 76, 92–104. [Google Scholar] [CrossRef]
- Inanici, M.; Hashemloo, A. An Investigation of the Daylighting Simulation Techniques and Sky Modeling Practices for Occupant Centric Evaluations. Build. Environ. 2017, 113, 220–231. [Google Scholar] [CrossRef]
- JGJ 38-2015; Library Building Design Code. Ministry of Housing and Urban-Rural Development of the People’s Republic of China China Construction Industry Press: Beijing, China, 2016.
- GB 21455-2019; Room Air Conditioner Energy Efficiency Limits and Energy Efficiency Grade. Ministry of Housing and Urban-Rural Development of the People’s Republic of China: Beijing, China, 2019.


| Name of Research Campus | h/m | w/m | L2/m | W2/m | Atrium Location Diagram |
|---|---|---|---|---|---|
| South China Agricultural University | 4.5 | 8 | 48, 24 | 24, 16 |  |
| South China Normal University (Shipai Campus) | 4.5 | 8 | 16 | 16 |  |
| Jinan University | 4.5 | 4 | 48 | 32 |  |
| South China University of Technology | 5.4 | 4 | 36, 18 | 9, 9 |  |
| Guangdong University of Technology | 3.9 | 8 | 24 | 32 |  |
| Guangzhou University | 4.2 | 8 | 40 | 21 |  |
| South China Normal University (University Town Campus) | 3.6 | 8 | 24 | 18 |  |
| Guangzhou University of Chinese Medicine | 4.8 | 8 | 12 | 9 |  |
| Xinghai Conservatory of Music | 3.9 | 2 | 20 | 20 |  |
| South China University of Technology (Wushan Campus) | 4.5 | 6 | 26 | 15 |  |
| Guangdong Pharmaceutical University | 4.2 | 8 | 40 | 16 |  |
| South University of Science and Technology of China | 5.4 | 8 | 46 | 10 |  |
| Southern Medical University | 5.4 | 8 | 16 | 12 |  |
| Shantou University | 4.2 | 8 | 36 | 28 |  |
| Guangzhou Medical University | 4.8 | 6 | 18 | 18 |  |
| Guangdong University of Foreign Studies (University Town Campus) | 4.2 | 2 | 40 | 30 |  |
| University of Foreign Studies (North Campus) | 4.2 | 6 | 24 | 24 |  |
| South China University of Technology (University Town Campus) | 4.5 | 8 | 73 | 34 |  |
| Chengdu University | 4.2 | 8 | 32 | 32 |  |
| Dongguan Vocational and Technical College | 3.6 | 4 | 35 | 20 |  |
| Guangdong University of Finance and Economics | 3.2 | 8 | 38 | 38 |  |
| Guangdong Academy of Fine Arts | 4.2 | 4 | 27 | 13 |  |
| Dalian University of Technology | 4.8 | 10 | 38 | 24 |  |
| Tsinghua University (Li Wenzheng Hall) | 3.6 | 8 | 25 | 20 |  |
| University (Law School) | 3.6 | 8 | 16 | 16 |  |
| Shenzhen University | 4.2 | 2 | 20 | 20 |  |
| Tianjin University | 5.4 | 8 | 74 | 74 |  |
| Wuhan University of Technology | 3.6 | 8 | 36 | 27 |  |
| The Chinese University of Hong Kong | 3.4 | 4 | 16 | 10 |  |
| Central University of Finance and Economics | 4.5 | 8 | 40 | 24 |  |
| Communication University of China | 4 | 6 | 14 | 10 |  |
| Nankai University | 4.8 | 8 | 28 | 10 | 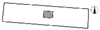 |
| North China University of Technology | 3.6 | 8 | 40 | 16 |  |
| Zhejiang College of Tongji University | 3.6 | 8 | 27 | 20 |  |
| Anshun Polytechnic | 5.7 | 8 | 24 | 24 |  |
| College of Science and Technology, Xinjiang University | 5.2 | 8 | 20 | 20 |  |
| Model Parameters | Notes | |
|---|---|---|
| Plan Dimensions | 78 m × 68 m | Fixed Parameters |
| Floor-to-ceiling Height (h) | 4.5 m | |
| Number of Floors (c) | 4 floors | |
| Skylight Form | Flat-top skylight | |
| Open Space Distance (w) | 6 m | |
| Atrium Plan Dimensions | W2·L2 = 600 m2 | Variable Parameters (W1, W2, L1, L2) |
| Skylight Plan Dimensions | 0 < W1·L1 ≤ 20%S |
| Enclosure Structure | Set Value | |
|---|---|---|
| Thermal Transmittance [W/(m2·K)] | Roof (Coating 10 mm + Waterproof Cement 15 mm + XPS 100 mm + EPS 30 mm + Reinforced Concrete 200 mm) | 0.40 |
| Interior Walls | Adiabatic | |
| Exterior Walls | Adiabatic | |
| Floor | Adiabatic | |
| Skylight (6 mm HLT low-e + 12 mm Air + 6 mm Glass) | 1.92 | |
| Material Reflectance | Ceiling | 0.75 |
| Interior Walls | 0.60 | |
| Floor | 0.30 |
| Skylight Glass Parameters (6 mm HLT low-e + 12 mm Air + 6 mm Glass) | |||
|---|---|---|---|
| Solar Heat Gain Coefficient | Shading Coefficient | Visible Light Transmittance Ratio | Thermal Transmittance [W/(m2·K)] |
| 0.26 | 0.30 | 0.72 | 1.92 |
| Parameter | Setting |
|---|---|
| Occupant density (m2/person) | 5 |
| Room summer set temperature (°C) | 26 |
| Power consumption (W/m2·K) | 10 |
| Fresh air volume [m3/(h·person)] | 30 |
| COP | 4.5 |
| Test grid size (m) | 2 m × 2 m |
| Illuminance sensor height (m) | 0.75 |
| Generation Size | Generation Count | Crossover Probability | Mutation Probability | Random Seed |
|---|---|---|---|---|
| 50 | 40 | 0.9 | 0.05 | 1 |
| Abbreviation | Explanation |
|---|---|
| sDA | The spatial daylight autonomy |
| UDI | The percentage of useful daylight illuminance |
| EC | The air conditioning energy consumption |
| h | Floor-to-ceiling height |
| c | Number of floors |
| L2 | East–west atriums length |
| W2 | North–south atriums length |
| w | Open space distance |
| H | Floor-to-ceiling height |
| L1 | East–west skylight length |
| W1 | North–south skylight length |
| S | The base area |
| a | The north–south length of the building |
| b | The east–west length of the building |
| AR | The skylight area ratio |
| SAR | Height-to-width ratio |
| θ1 | The east–west section inclination angle of the atrium |
| θ2 | The north–south section inclination angle of the atrium |
| θ | Section inclination angle |
| WI | The well index |
| CFD | Computational fluid dynamics |
Disclaimer/Publisher’s Note: The statements, opinions and data contained in all publications are solely those of the individual author(s) and contributor(s) and not of MDPI and/or the editor(s). MDPI and/or the editor(s) disclaim responsibility for any injury to people or property resulting from any ideas, methods, instructions or products referred to in the content. |
© 2024 by the authors. Licensee MDPI, Basel, Switzerland. This article is an open access article distributed under the terms and conditions of the Creative Commons Attribution (CC BY) license (https://creativecommons.org/licenses/by/4.0/).
Share and Cite
Bai, W.; Guo, W.; He, Y.; Wu, Y.; Liang, S.; Zhang, S. Research on the Optimization Design of the Atrium Space Form in University Libraries Based on the Coupling of Daylighting and Energy Consumption. Buildings 2024, 14, 2715. https://doi.org/10.3390/buildings14092715
Bai W, Guo W, He Y, Wu Y, Liang S, Zhang S. Research on the Optimization Design of the Atrium Space Form in University Libraries Based on the Coupling of Daylighting and Energy Consumption. Buildings. 2024; 14(9):2715. https://doi.org/10.3390/buildings14092715
Chicago/Turabian StyleBai, Wenqi, Weihong Guo, Yiwei He, Yudi Wu, Sheng Liang, and Shen Zhang. 2024. "Research on the Optimization Design of the Atrium Space Form in University Libraries Based on the Coupling of Daylighting and Energy Consumption" Buildings 14, no. 9: 2715. https://doi.org/10.3390/buildings14092715