Article

Experimental Study on the Bending Behavior of Precast Concrete Segmental Bridges with Continuous Rebars at Joints

1
College of Architecture & Civil Engineering, Xihua University, Chengdu 610039, China
2
College of Civil Engineering, Tongji University, Shanghai 200092, China
*
Author to whom correspondence should be addressed.
Buildings 2024, 14(9), 2938; https://doi.org/10.3390/buildings14092938
Submission received: 31 August 2024 / Revised: 14 September 2024 / Accepted: 15 September 2024 / Published: 17 September 2024
(This article belongs to the Section Building Structures)

Abstract

:
Longitudinal ordinary rebars are discontinuous at the joints of precast concrete segmental bridges (PCSBs), which can open under tensile stresses induced by bending moments. This will lead to durability issues with the joints. To improve the bending properties of PCSBs, a novel joint type featuring continuous rebars was proposed in the present study. Three specimens were subjected to testing to examine the bending behavior of PCSBs using this new joint design compared to traditional joints. The crack propagation, structural deformation, joint opening width, strain in rebars, failure mode, stiffness, and flexural capacity were comprehensively investigated. The test results reveal that the continuous rebars effectively transferred bending normal stress between joints, ensuring full development of cracks in each beam segment. Effective control of joint opening width was also observed. Compared to traditional joints, the new joints exhibited a 29% to 33% increase in cracking load and a 32% increase in ultimate load. Failure in the continuous rebar joints was characterized by partial anchorage failure of the rebars along with localized concrete crushing in the top compression zone. Based on the test results, a computational method was proposed for calculating the cracking strength and flexural capacity of the new joints.

1. Introduction

Precast concrete segmental bridges (PCSBs) present numerous advantages, including consistent quality, rapid construction, precise engineering control, cost-effectiveness, durability, and environmental benefits [1,2,3]. The use of precast segments significantly boosts structural resilience by facilitating swift replacement of damaged segments, thereby ensuring rapid functional restoration of segmental structures post damage [4]. Adopting precast segmental construction also promotes the use of advanced materials, such as ultra-high-performance concrete and fiber-reinforced concrete, which are often exclusively feasible in prefabrication workshops or factories [5,6]. Nonetheless, despite the favorable attributes of PCSBs, these bridges exhibit certain disadvantages compared to monolithic bridges. These include the absence of continuous bond reinforcement across joints, which can impact the bearing capacity and overall stiffness of segmental bridges [7,8,9]. Moreover, prestressing tendons within these joints are susceptible to corrosion, leading to structural deterioration that can ultimately result in the collapse of the entire segmental bridge. As such, research on precast segmental bridge systems has garnered considerable interest [10,11].
Li [12] presented the simplified failure modes of dry and epoxied joints subjected to combined shear and bending, and deduced the formulas for evaluating the resistance of joints when failure occurred in a joint section with loads applied in the immediate vicinity of the joints. Yuan’s experimental results [13] revealed that the ratio of the internal tendon number to the external tendon number had a significant effect on the load-carrying capacity, ductility, and failure modes of beams under a bending load. Saibabu [14] reported that the first joint opening load of a dry-jointed specimen was 27% less than an epoxy-jointed specimen. Chai’s findings [15] indicated that significant structural deterioration was correlated with factors such as prestressing loss, lower concrete strength, reduced reinforcement ratio, younger concrete age at loading, increased number of shear keys, fewer segments, higher deflection, and larger external loads. Jiang’s study [16] revealed that partially and fully segmental beams with hybrid tendons exhibited greater flexural strength compared to beams with fully external tendons. Moreover, Jiang noted that the flexural strength increased with an increase in the number of joints in the beams. Takebayashi [17] observed that structural articulation occurred after joint opening, rendering classical beam theory inapplicable. Aparicio [18] demonstrated that the actual ultimate loads of segmental bridges with multiple dry shear keys were dependent on the compressive strain and the depth of the neutral axis. Woodward [19] reported that the prestressed tendons between joints were susceptible to corrosion damage that caused deterioration leading to collapse of an entire segmental bridge.
According to the aforementioned research results, the flexural strength of dry-jointed specimens was less than that of epoxied joints [14]. In addition, the failure modes of epoxied joints were different from dry joints. Failure in dry joints typically occurs at the joint interface due to joint opening, whereas for epoxied joints, failure cracks tend to propagate vertically in the concrete adjacent to the segment interfaces [20]. To improve the overall flexural performance of PCSBs, extensive research has focused on developing new types of joints or exploring new materials [6,21,22,23,24,25]. Le [26,27] concluded that the stresses in the unbonded carbon fiber-reinforced polymer (CFRP) tendons at ultimate loading conditions of the PCSBs only ranged from about 66% to 72% of the nominal breaking tensile strength under four-point loading. Ye [23] observed that segmental ultra-high-performance concrete (UHPC) beams exhibited better ductility and deformation capacity than the monolithic beams. Zhang [24] designed a prestressed bolted hybrid joint, and concluded that the flexural capacity of the hybrid joint was significantly improved, being 46.8–60.3% higher than that of a traditional prestressed joint. Afefy [20] proposed a steel assembly joint, and reported that the ultimate capacity of the strengthened beam approached over 96% of the ultimate capacity of the monolithic beams.
To summarize, the structural behavior of segmental girders differs significantly from monolithic girders due to the discontinuity of ordinary rebars and concrete at joint cross-sections. Joint openings facilitate environmental exposure to prestressing tendons, resulting in durability issues that can adversely impact segmental beam performance [20]. To enhance bearing capacity, joint ductility, and load transmission, a new joint type incorporating ordinary rebars across joints was proposed in the present study. Large-scale experiments had been conducted to explore the effect of continuous rebars on the bending behavior of PCSBs. The crack propagation, critical loading thresholds, and failure mechanisms specific to the new joint were comprehensively investigated. Parameters such as strain variations in ordinary reinforcements, deformation characteristics (including load-displacement curves and load–deflection relationships), joint opening widths, flexural capacities, and failure modes were systematically compared with the traditional joints. The influences of the continuous rebars on the flexural capacity of the joints were also explored, and the failure mechanism was revealed. Finally, the bending resistance calculation method of the new joints was derived. The research results are beneficial for designers to better understand the failure mechanism of the PCSBs with continuous rebars at joints, and to effectively design the cracking strength and flexural bearing capacity of the joint based on the strength calculation method provided in the present study.

2. Experimental Program

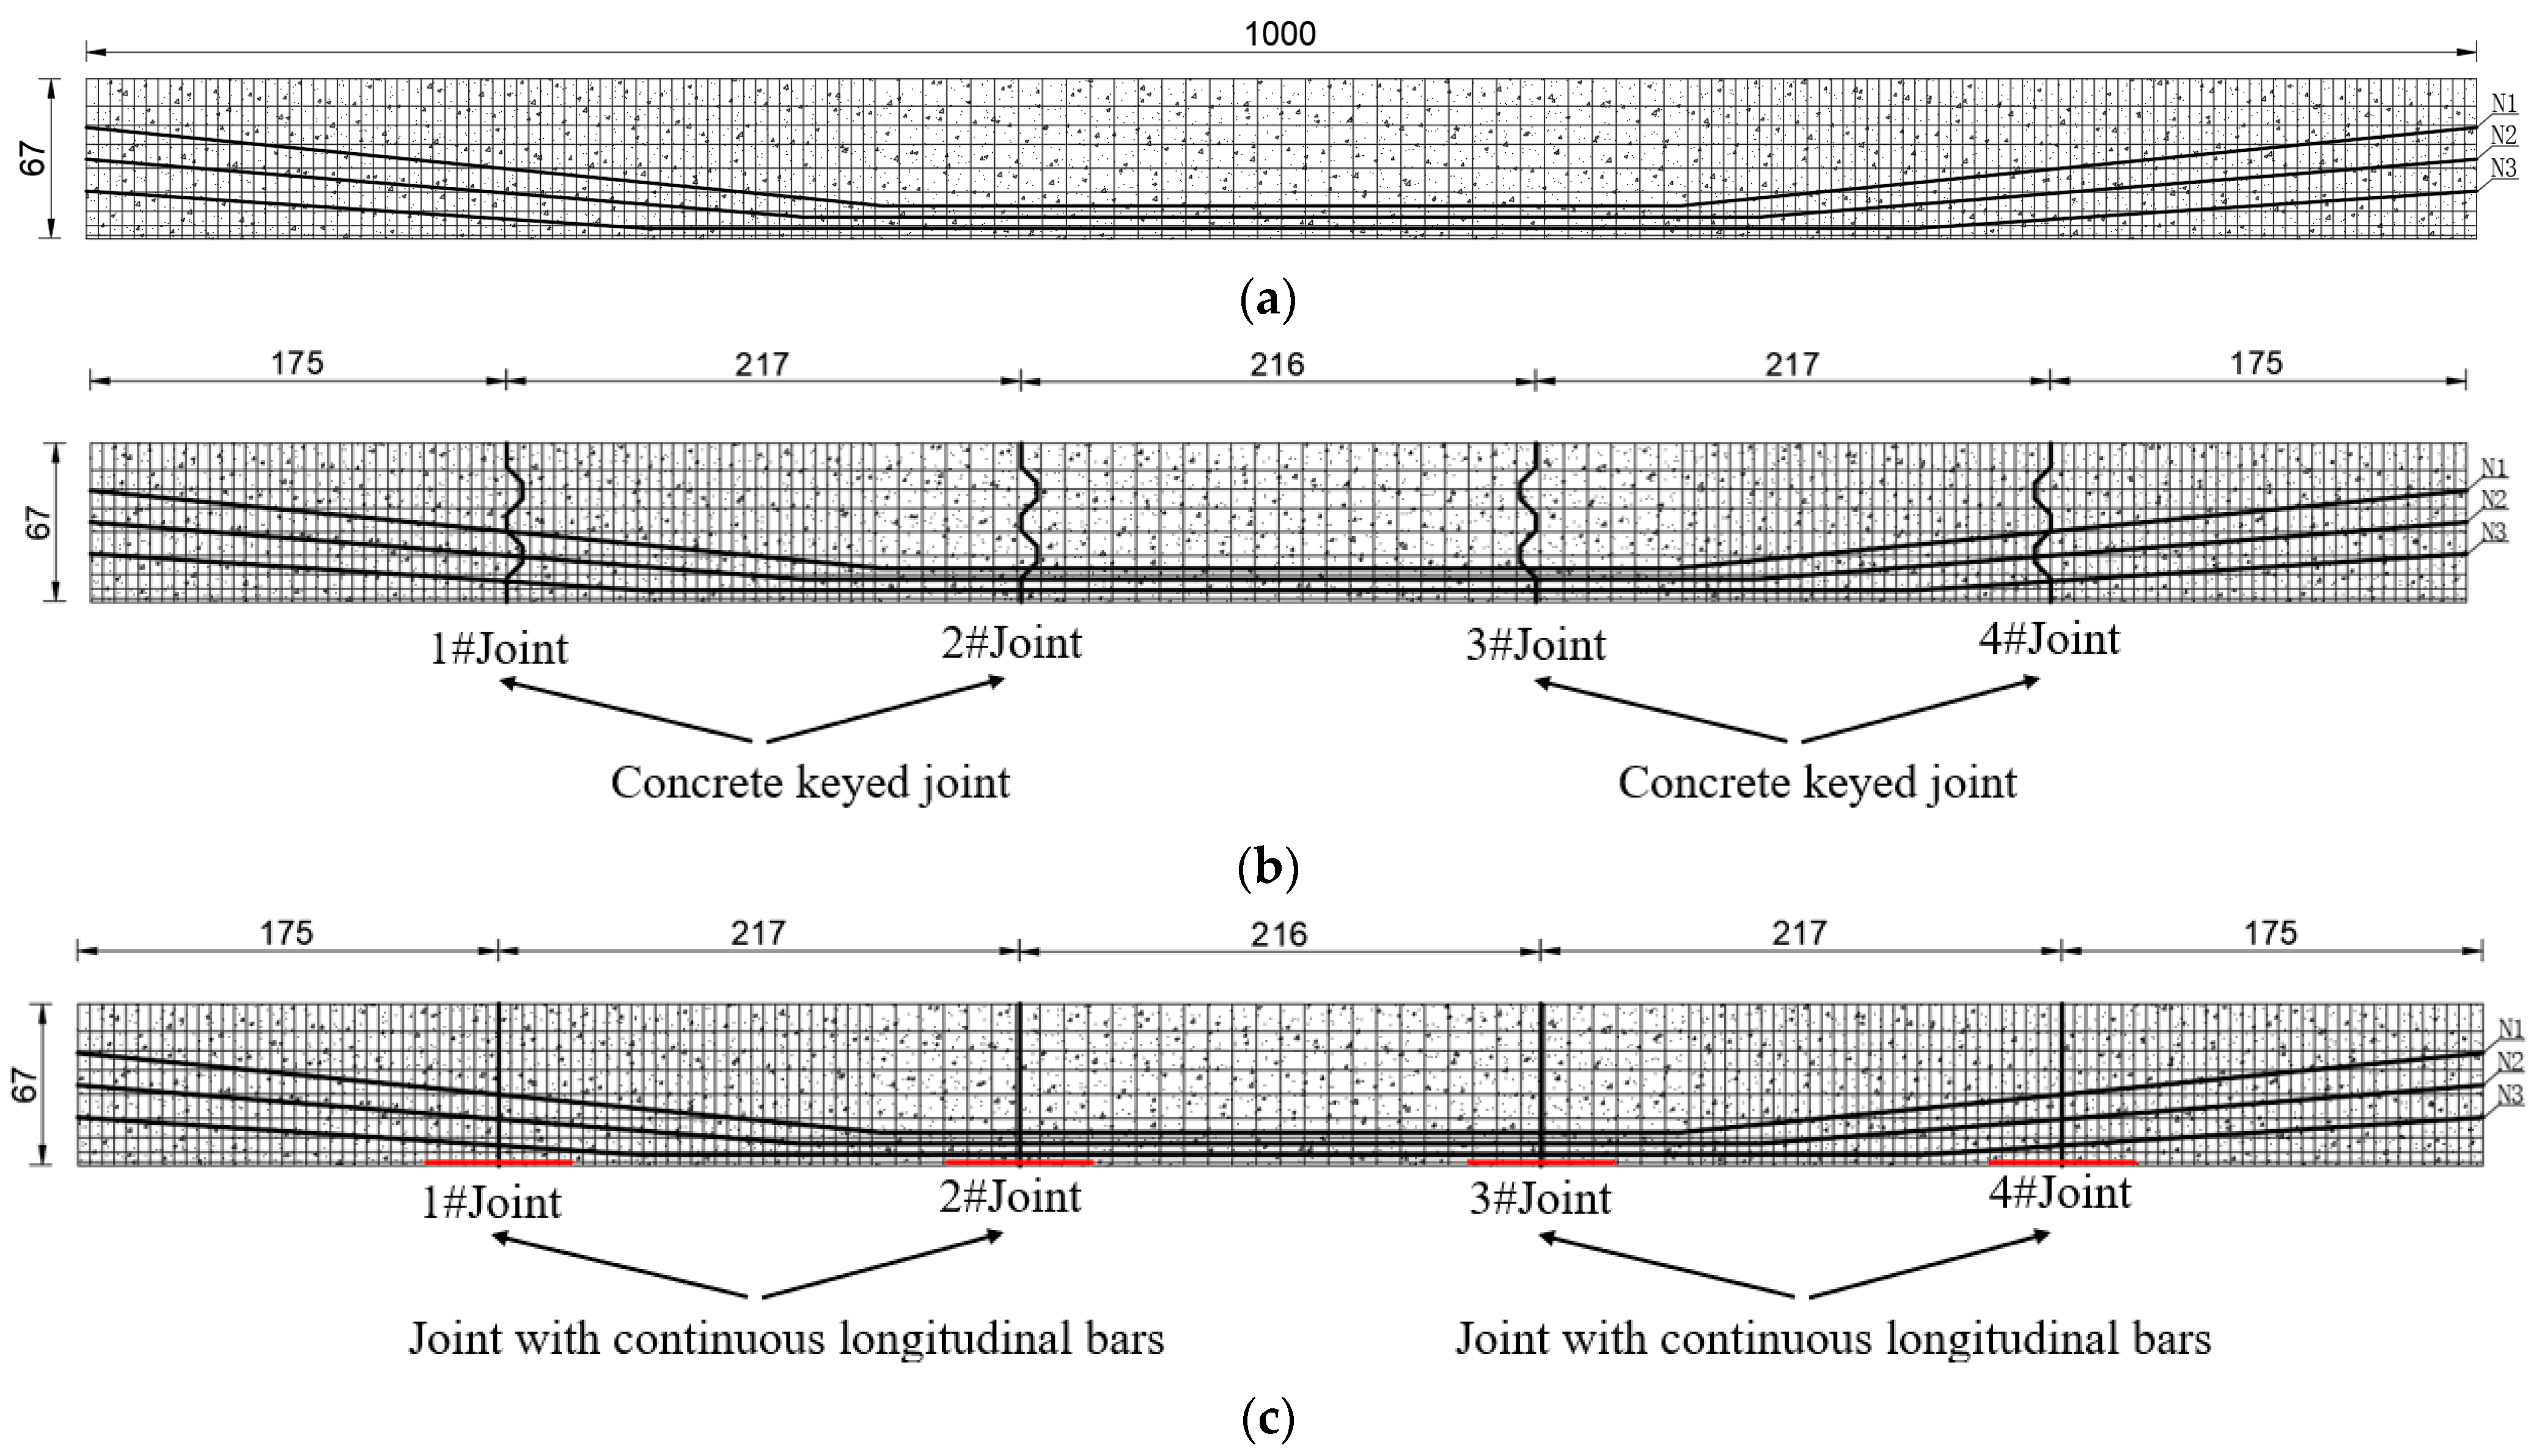
2.1. Description of Test Specimens

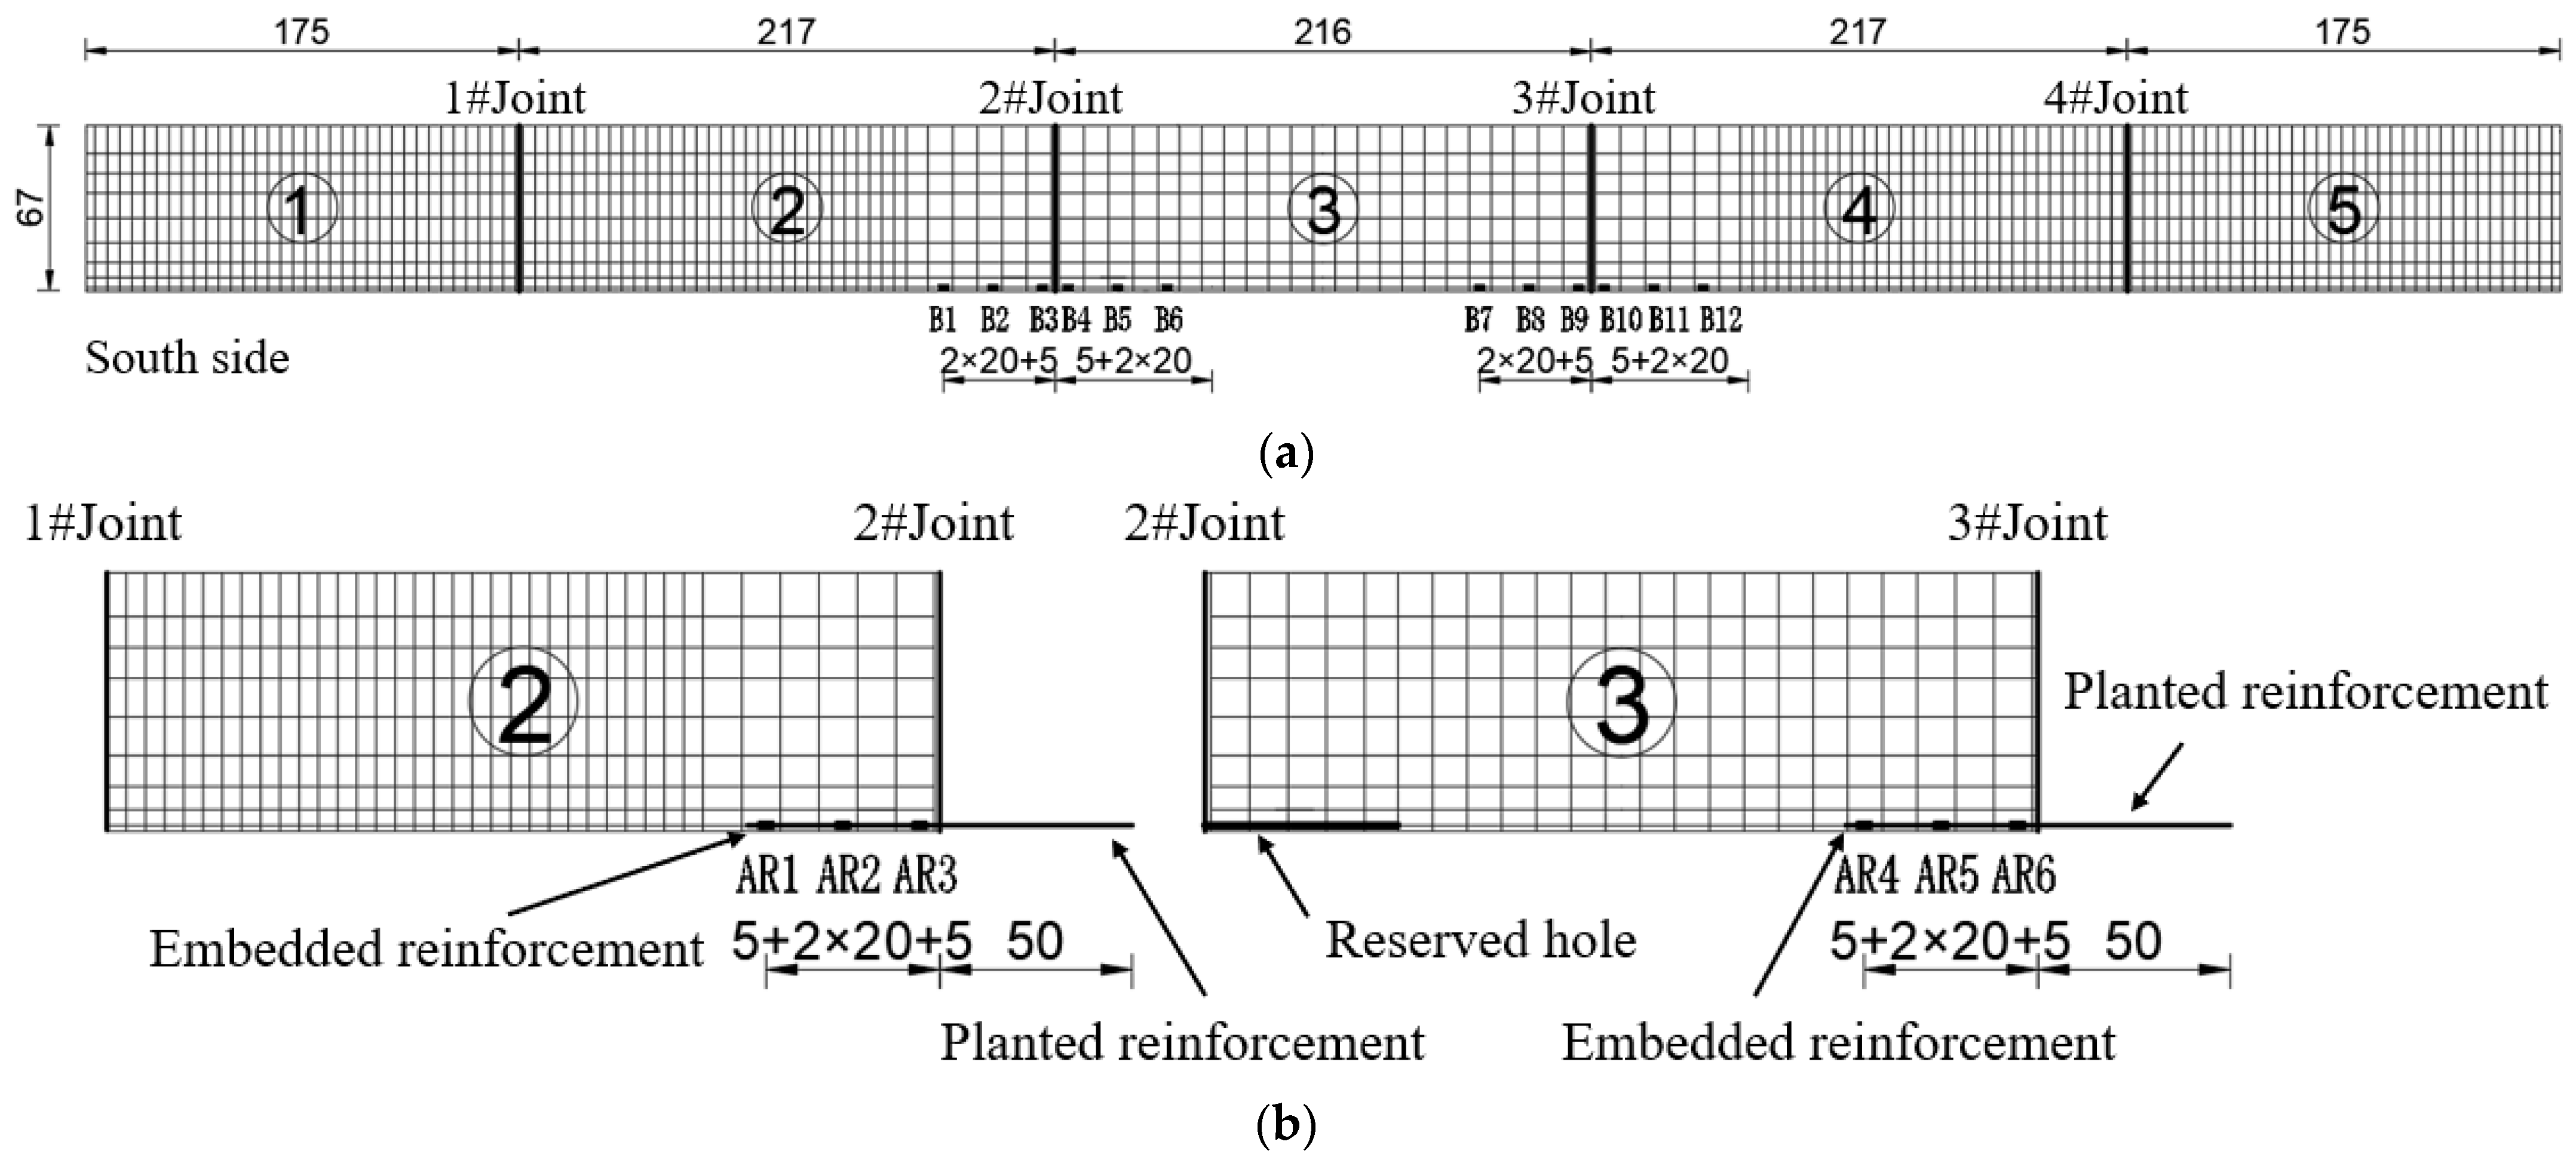
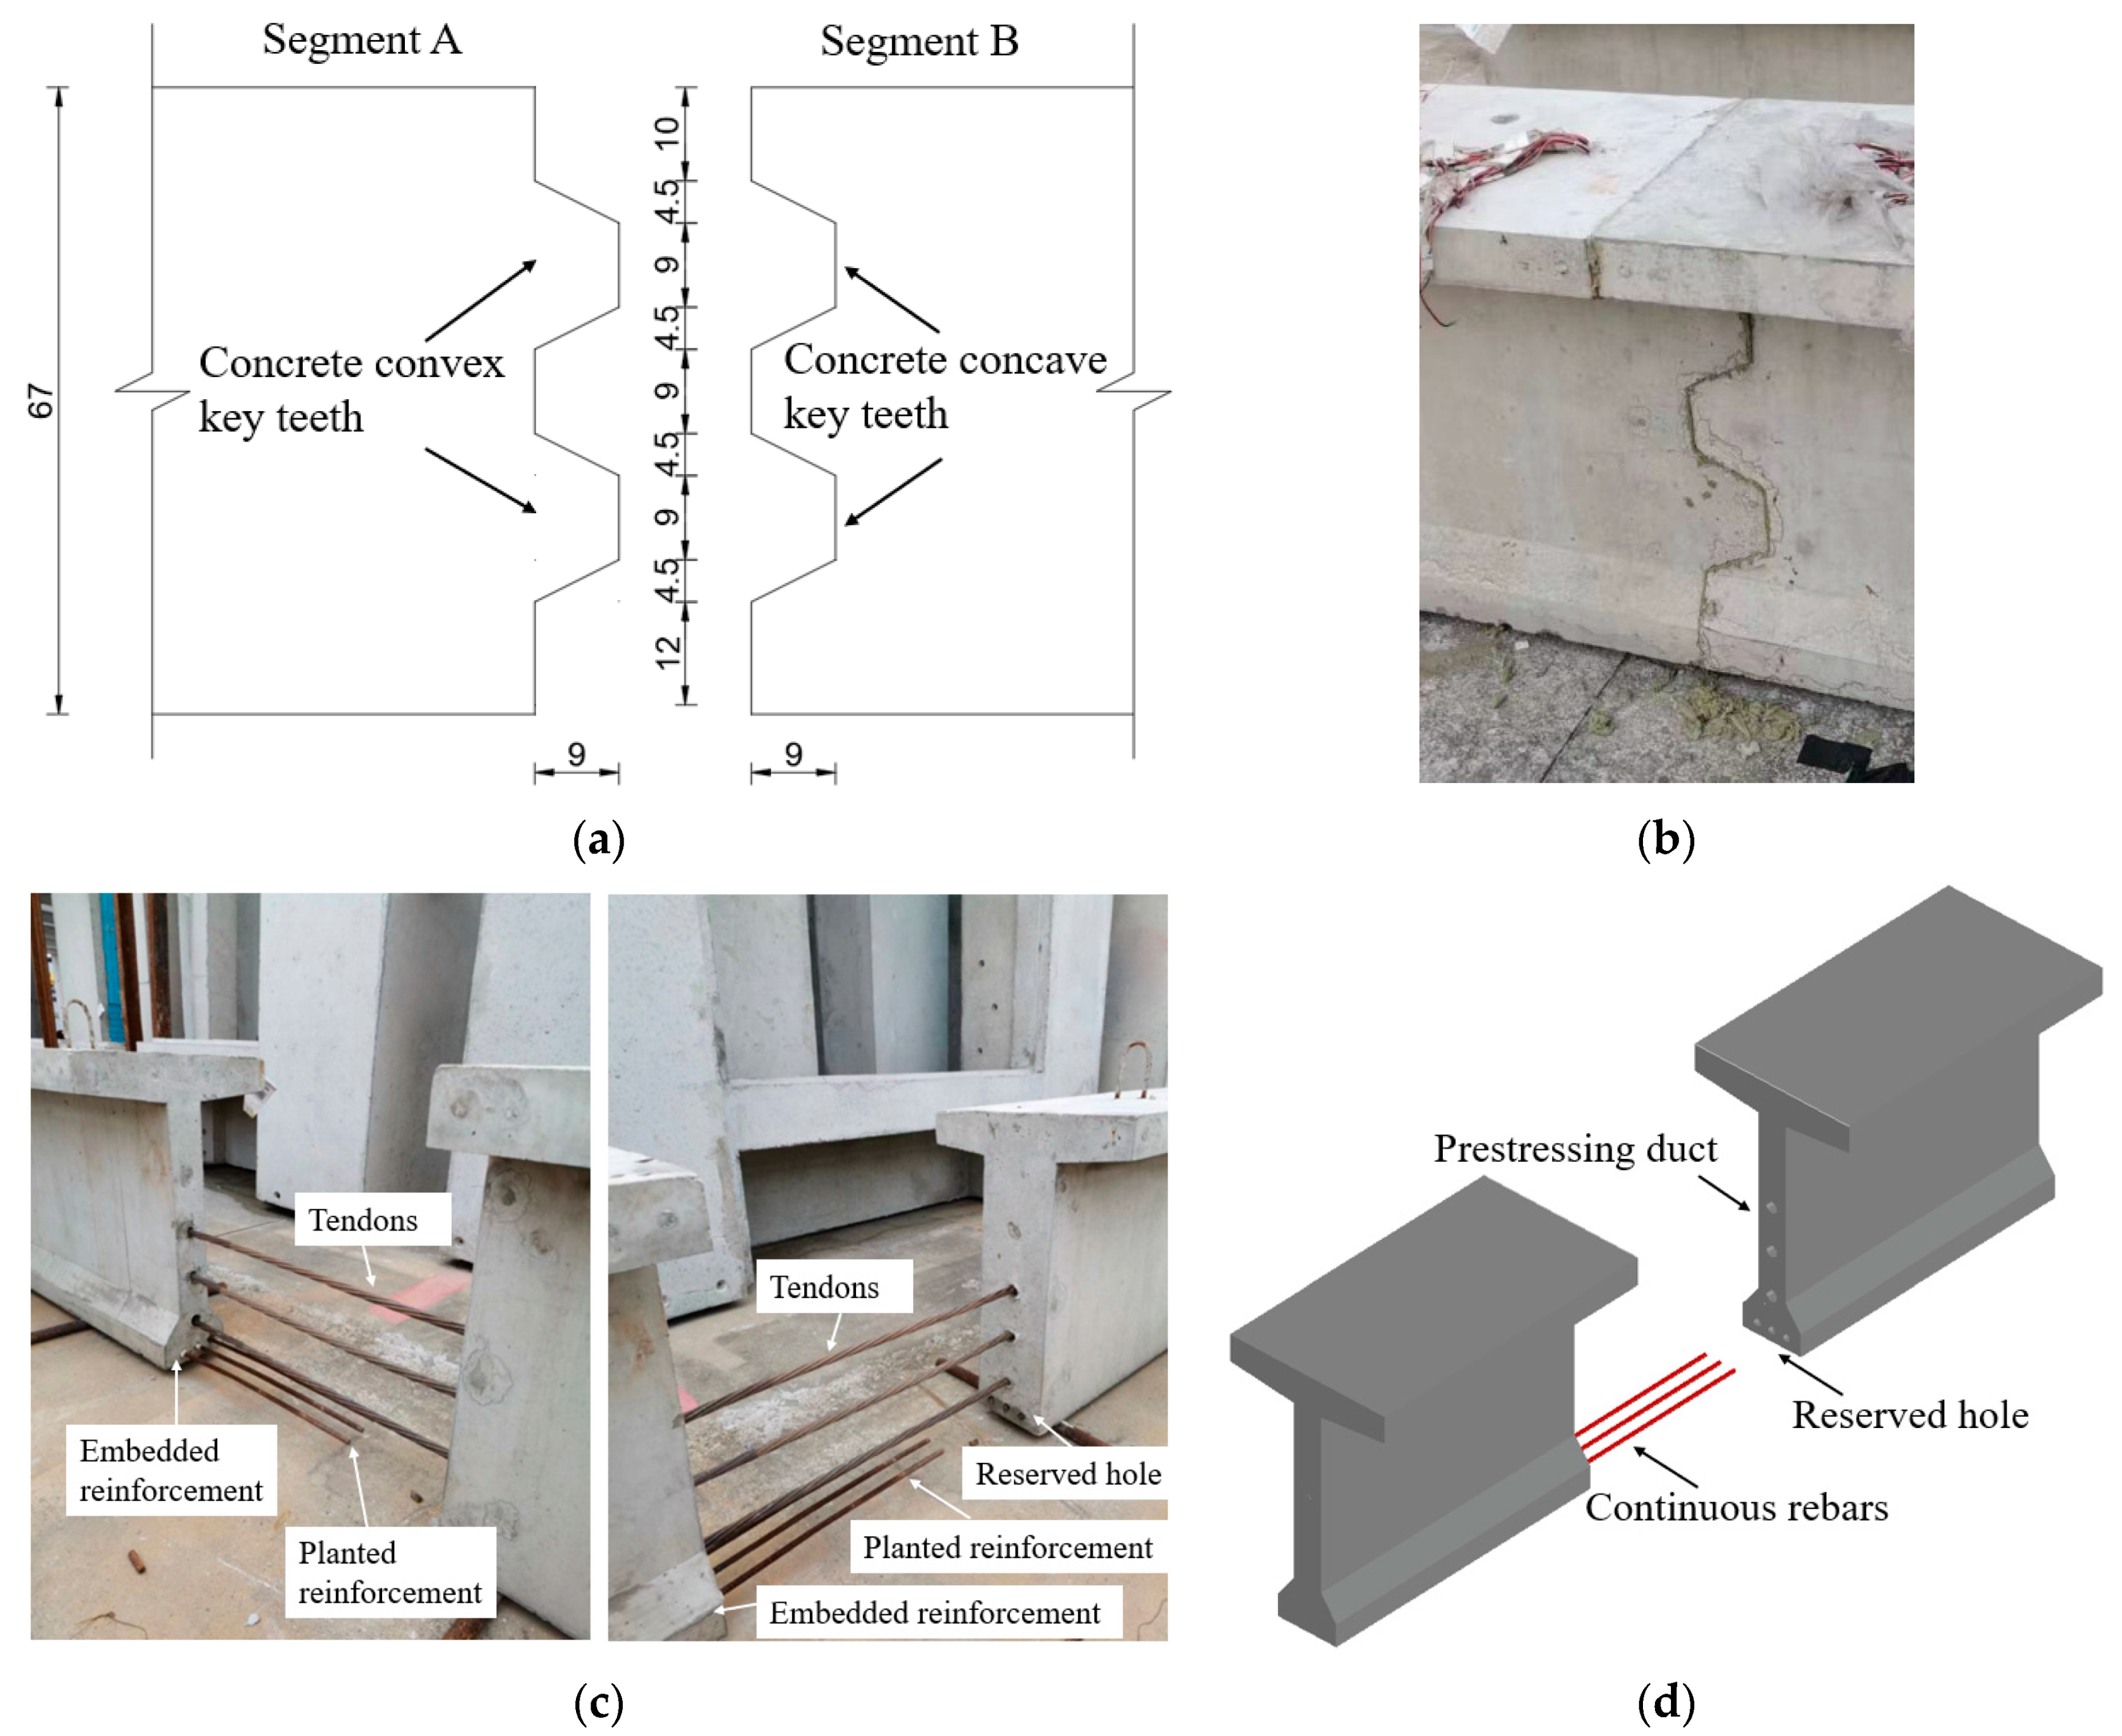
2.1.1. Section Design

The test beams were 10 m long and 0.67 m high, and consisted of 5 segments assembled by internally bonded prestressing tendons. Segments 1#–5# utilized T-shaped section, and the section sizes of the test beams are shown in Figure 1.

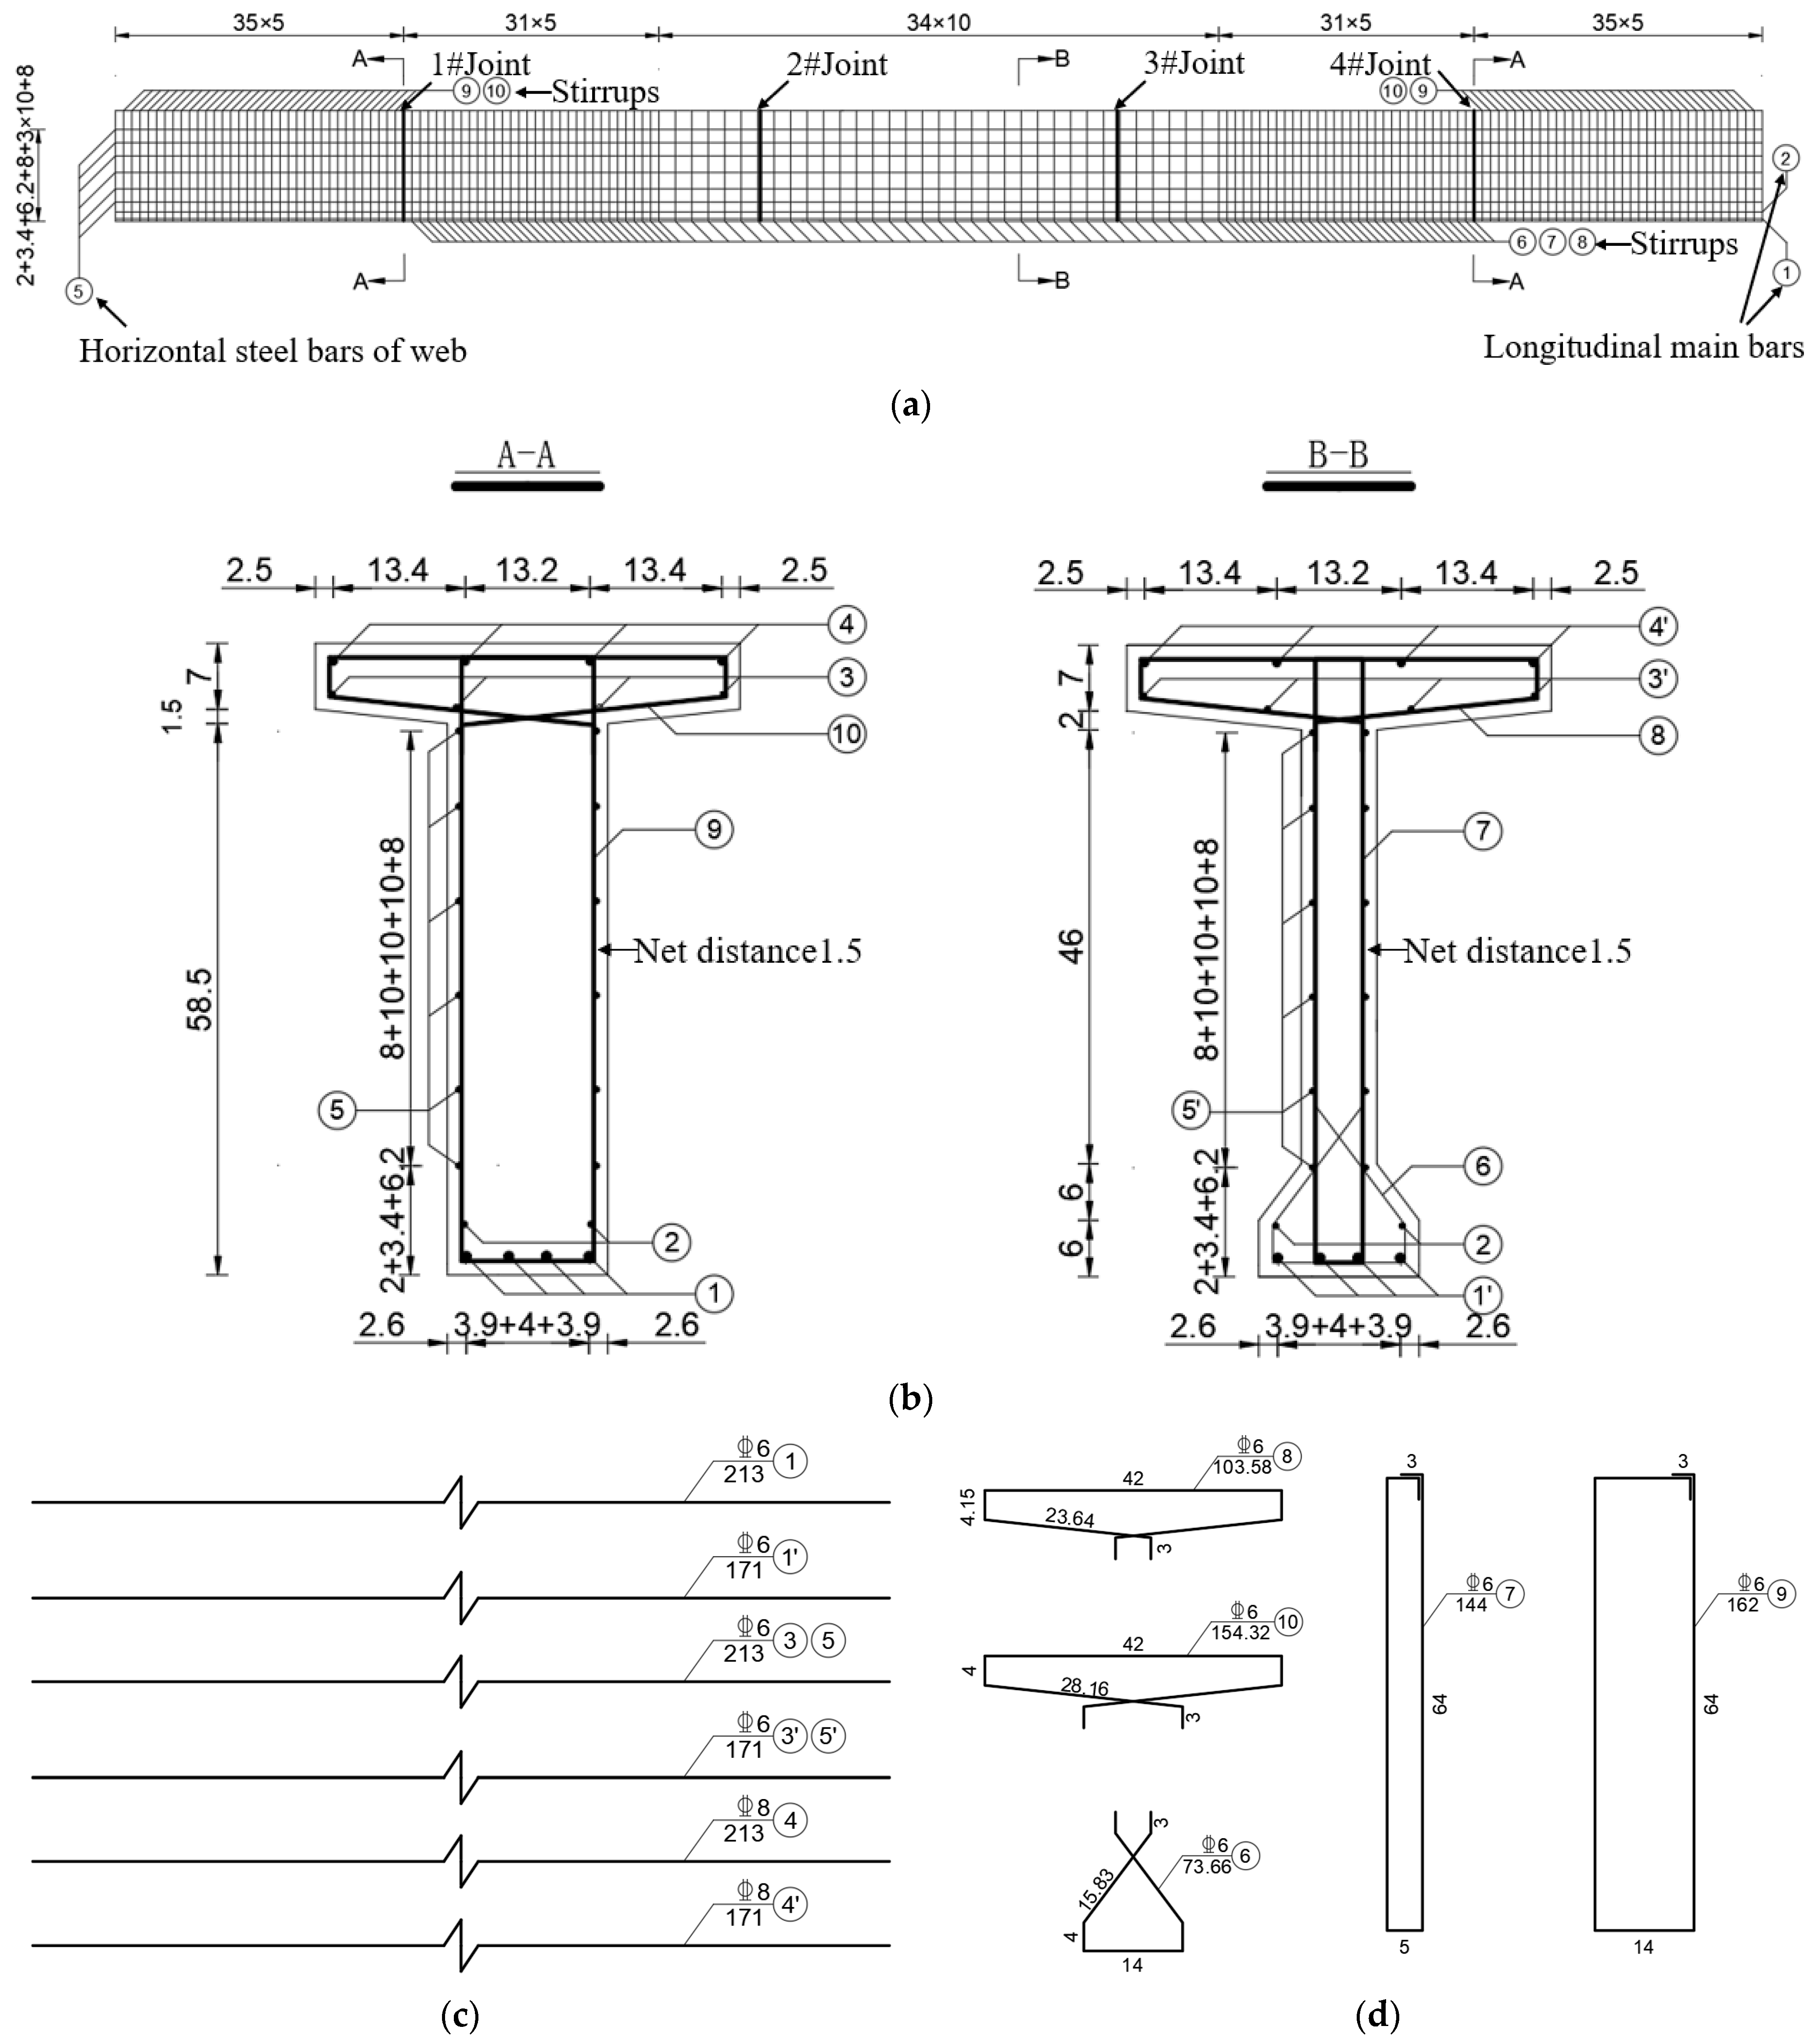
2.1.2. Reinforcement Design

HRB400 steel bars were employed for longitudinal main bars, stirrups, and horizontal steel bars in the web. Double-leg stirrups were used, spaced at 100 mm in the pure bending section to resist bending forces. To prevent shear damage in the shear span area, stirrups were spaced at 50 mm in this region. Horizontal steel bars within the web were arranged on both sides across the web height, with a spacing of 100 mm between them. The reinforcement types are shown in Figure 2.

2.1.3. Parameter Design

The experiment focused on the influence of joint types on the bending mechanical properties of segmental beams. A total of 3 pure bending beams (PB beams) were designed, including a monolithic beam (beam PB1) and segmental beams (beam PB2 and beam PB3). Beam PB2 was a segmental beam with concrete keyed joints, while beam PB3 was a segmental beam with continuous longitudinal rebars in the joints. Figure 3 shows schematic diagrams of beams PB1–PB3, and Table 1 shows the specimen parameters. All test beams were standardized with identical dimensions, reinforcement configurations, and internally bonded prestressing tendons throughout.

2.2. Materials

The material characteristic tests, depicted in Figure 4, involved test beams constructed entirely from C40 commercial concrete. The concrete strength test results are detailed in Table 2. Joint adhesives utilized commercial epoxy resin, with mechanical properties specified in Table 3. Ordinary steel bars consisted of HRB400 rebar, with mechanical properties detailed in Table 4. Prestressed reinforcements utilized a Φ S 15.2 tendon, with mechanical performance parameters shown in Table 4. During tensioning of the prestressed reinforcements, pressure sensors placed at the beam ends measured effective prestress values, as outlined in Table 5. The test beams were equipped with internally bonded tendons, ensuring stable prestress values without bond slip throughout the loading process.

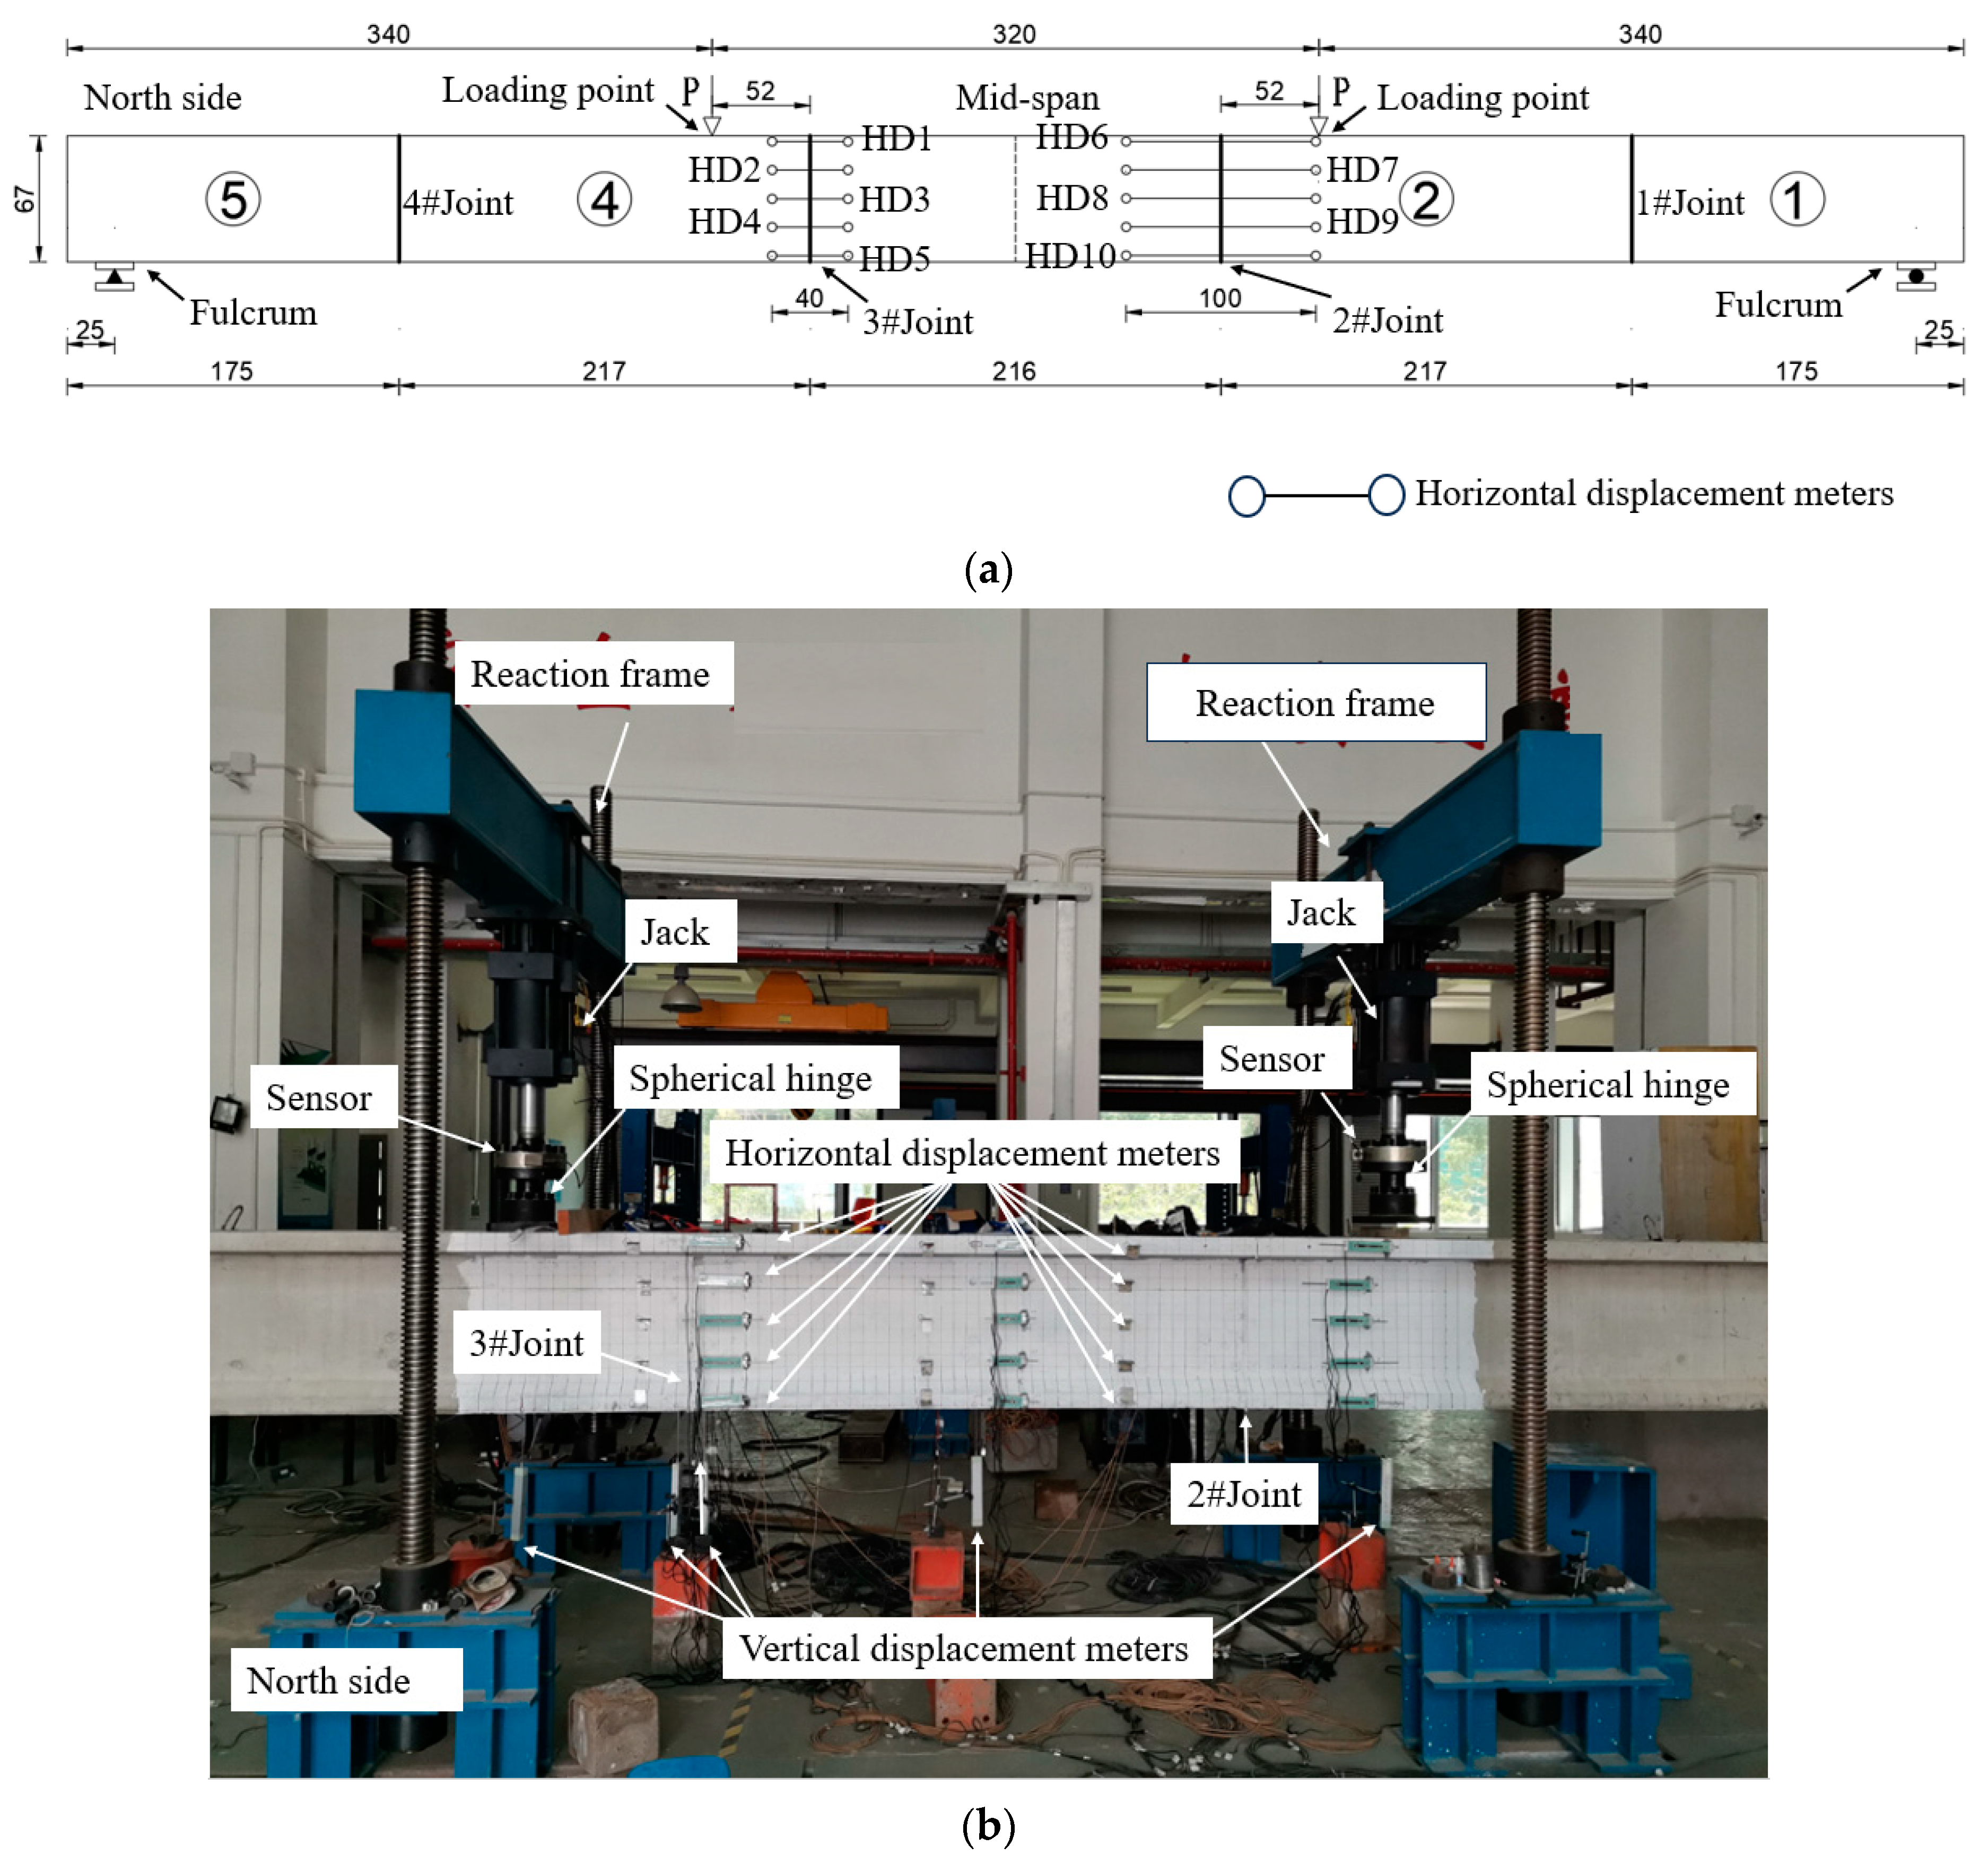
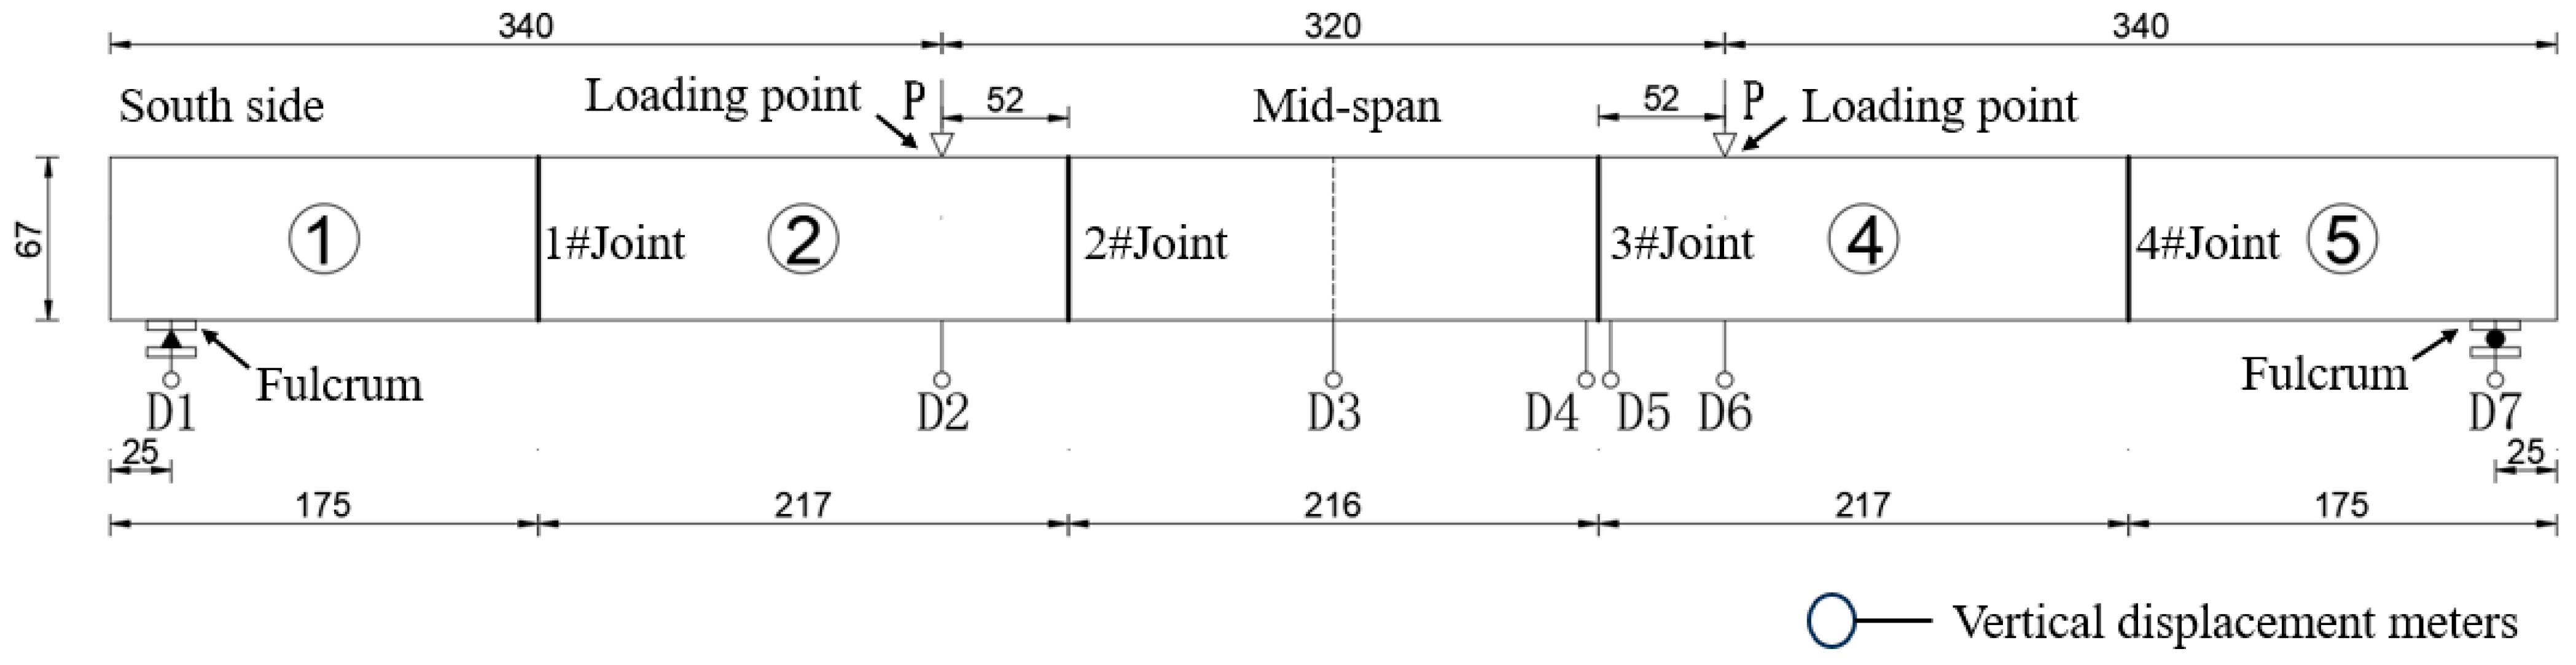
2.3. Testing Procedure

Four-point symmetric loading was adopted in the test, and a loading diagram is shown in Figure 5. A monotonic loading method was adopted for the experiment. After each level of loading was completed, the load was maintained for a period of time until the loading force stabilized. The loading force and measurement data of each sensor were recorded in stages. At the same time, the experimental phenomena during the loading process were observed, and the development status of cracks was marked. Before the concrete cracked, it was loaded at 10 kN for each stage, until the specimen approached cracking. After the specimen cracked, it was loaded at 5 kN for each stage, until the rebars yielded. Finally, load was applied under displacement control until the structural integrity of the beam was compromised.

2.4. Measuring Point Layout

2.4.1. Joint Opening Width Measurement

To measure the opening width of the joint after cracking, five displacement transducers were arranged at joint 3# and joint 4#, as shown in Figure 6.

2.4.2. Deflection Measuring Point

In order to measure the deflection distribution of the main beam and the relative sliding displacement of the joints on both sides, displacement meters were arranged at the fulcrum of the main beam, the quarter point, the middle span, and the joint. Vertical displacement measuring points were arranged, as shown in Figure 7.

2.4.3. Reinforcement Strain Measuring Point

The reinforcement strain gauges of beams PB1–PB3 were all arranged in the longitudinal main rebars of the bottom plate, with a total of 12 measuring points. The numbering and arrangement of each measuring point are shown in Figure 8a. Additionally, beam PB3 was also equipped with 3 measuring points at the continuous rebars, as shown in Figure 8b.

2.5. Test Specimen Production

The long-line matched method was adopted for the segmental beam, where segments 1#, 3#, and 5# were initially poured and cured, followed by matching pouring of segments 2# and 4#. The dimensions and shape of a concrete key joint (CK joint) were designed according to AASHTO specifications [28], as shown in Figure 9c,d. Continuous rebars within the joint were achieved by inserting rebars; holes were pre-reserved on one side of the joint, and steel bars were embedded on the opposite side. During construction, the reserved holes were filled with adhesive for rebar placement, completing the assembly of segments by inserting the embedded steel bars into these holes. The continuous rebars utilized C12 ordinary steel bars, with both embedded and planted reinforcement lengths of 50 cm (>15 times the diameter of the bars). The reserved hole diameter was 16 mm, as illustrated in Figure 9c,d. Upon completion of joint splicing for each test beam, a temporary pre-pressure of 0.3 MPa was applied until the epoxy adhesive solidified. Subsequently, tension was applied gradually to achieve the designed tensile stress.

3. Test Process Analysis

The bending test results of monolithic beams and traditional concrete segmental beams were found to be similar to those of Li [12] and Turmo [8]. The test processes of beams PB1 and PB2 are not described herein, as the focus was on the mechanical behavior of PB3 (continuous longitudinal rebars in the joints) during bending stress.
When the loading force was 70 kN, vertical bending cracks appeared along the bottom edge of the midspan. The maximum width of the cracks was 0.054 mm, and the length of the cracks was about 20 mm. In the subsequent loading process (when the loading force was 70–85 kN), a number of vertical bending cracks appeared successively along the bottom edge of the midspan and near the loading point, forming incipient cracks. At this time, no cracks were found at joints 2# and 3#, as shown in Figure 10.
When the loading force was 90 kN, vertical bending cracks appeared along the bottom edge of the main beam at the position of 3 cm away from joint 2#. The cracks were about 8 cm long and 0.152 mm wide. The crack propagated through the continuous rebars and extended into the mortar layer of the joint surface, continuing along the joint towards the top plate. At this stage, the joint in segment 3# remained closed, with no visible cracks observed, as shown in Figure 11.
At a load of 100 kN, vertical bending cracks which were approximately 7 cm long and 0.129 mm wide appeared in the mortar layer of the joint in segment 3#. The crack progressed rapidly, and by a loading force of 105 kN, its extension length matched that observed at other positions (loading point, midspan), as depicted in Figure 12. By this point, the crack widths at joints 2# and 3# had exceeded to 0.2 mm.
During the subsequent loading process, a large number of new cracks appeared successively on the floor of the midspan and at the loading point. At the same time, incipient cracks continued to develop, and the rate and width of the crack extension to the top plate at joints 2# and 3# were comparable to other locations of the specimen (mid-span and loading point). When the loads were 150 kN and 170 kN, horizontal cracks along the direction of the continuous rebars appeared successively at joints 2# and 3#, as shown in Figure 13. The appearance of the cracks directly led to local anchorage failure of the continuous rebars, resulting in some rebars reaching yield. This weakened the cracking resistance of the joint, serving as a catalyst for joint opening.
When the horizontal cracks near the continuous rebars appeared, there was a significant decrease in the specimen’s stiffness. However, these cracks did not result in complete anchorage failure of the continuous rebars. The specimen quickly underwent internal stress redistribution and continued to support the load, causing fluctuations in the corresponding load–displacement curve. During the subsequent loading process, the horizontal cracks near the continuous rebars gradually expanded and developed, weakening the bending stiffness of the joints, inducing openings at joints 2# and 3#, causing the neutral axis of the joint surface to move upwards, reducing the concrete area in the compression zone. Ultimately, this caused the top edge of the joint to collapse, resulting in structural damage, as shown in Figure 14.

4. Main Results and Comparison

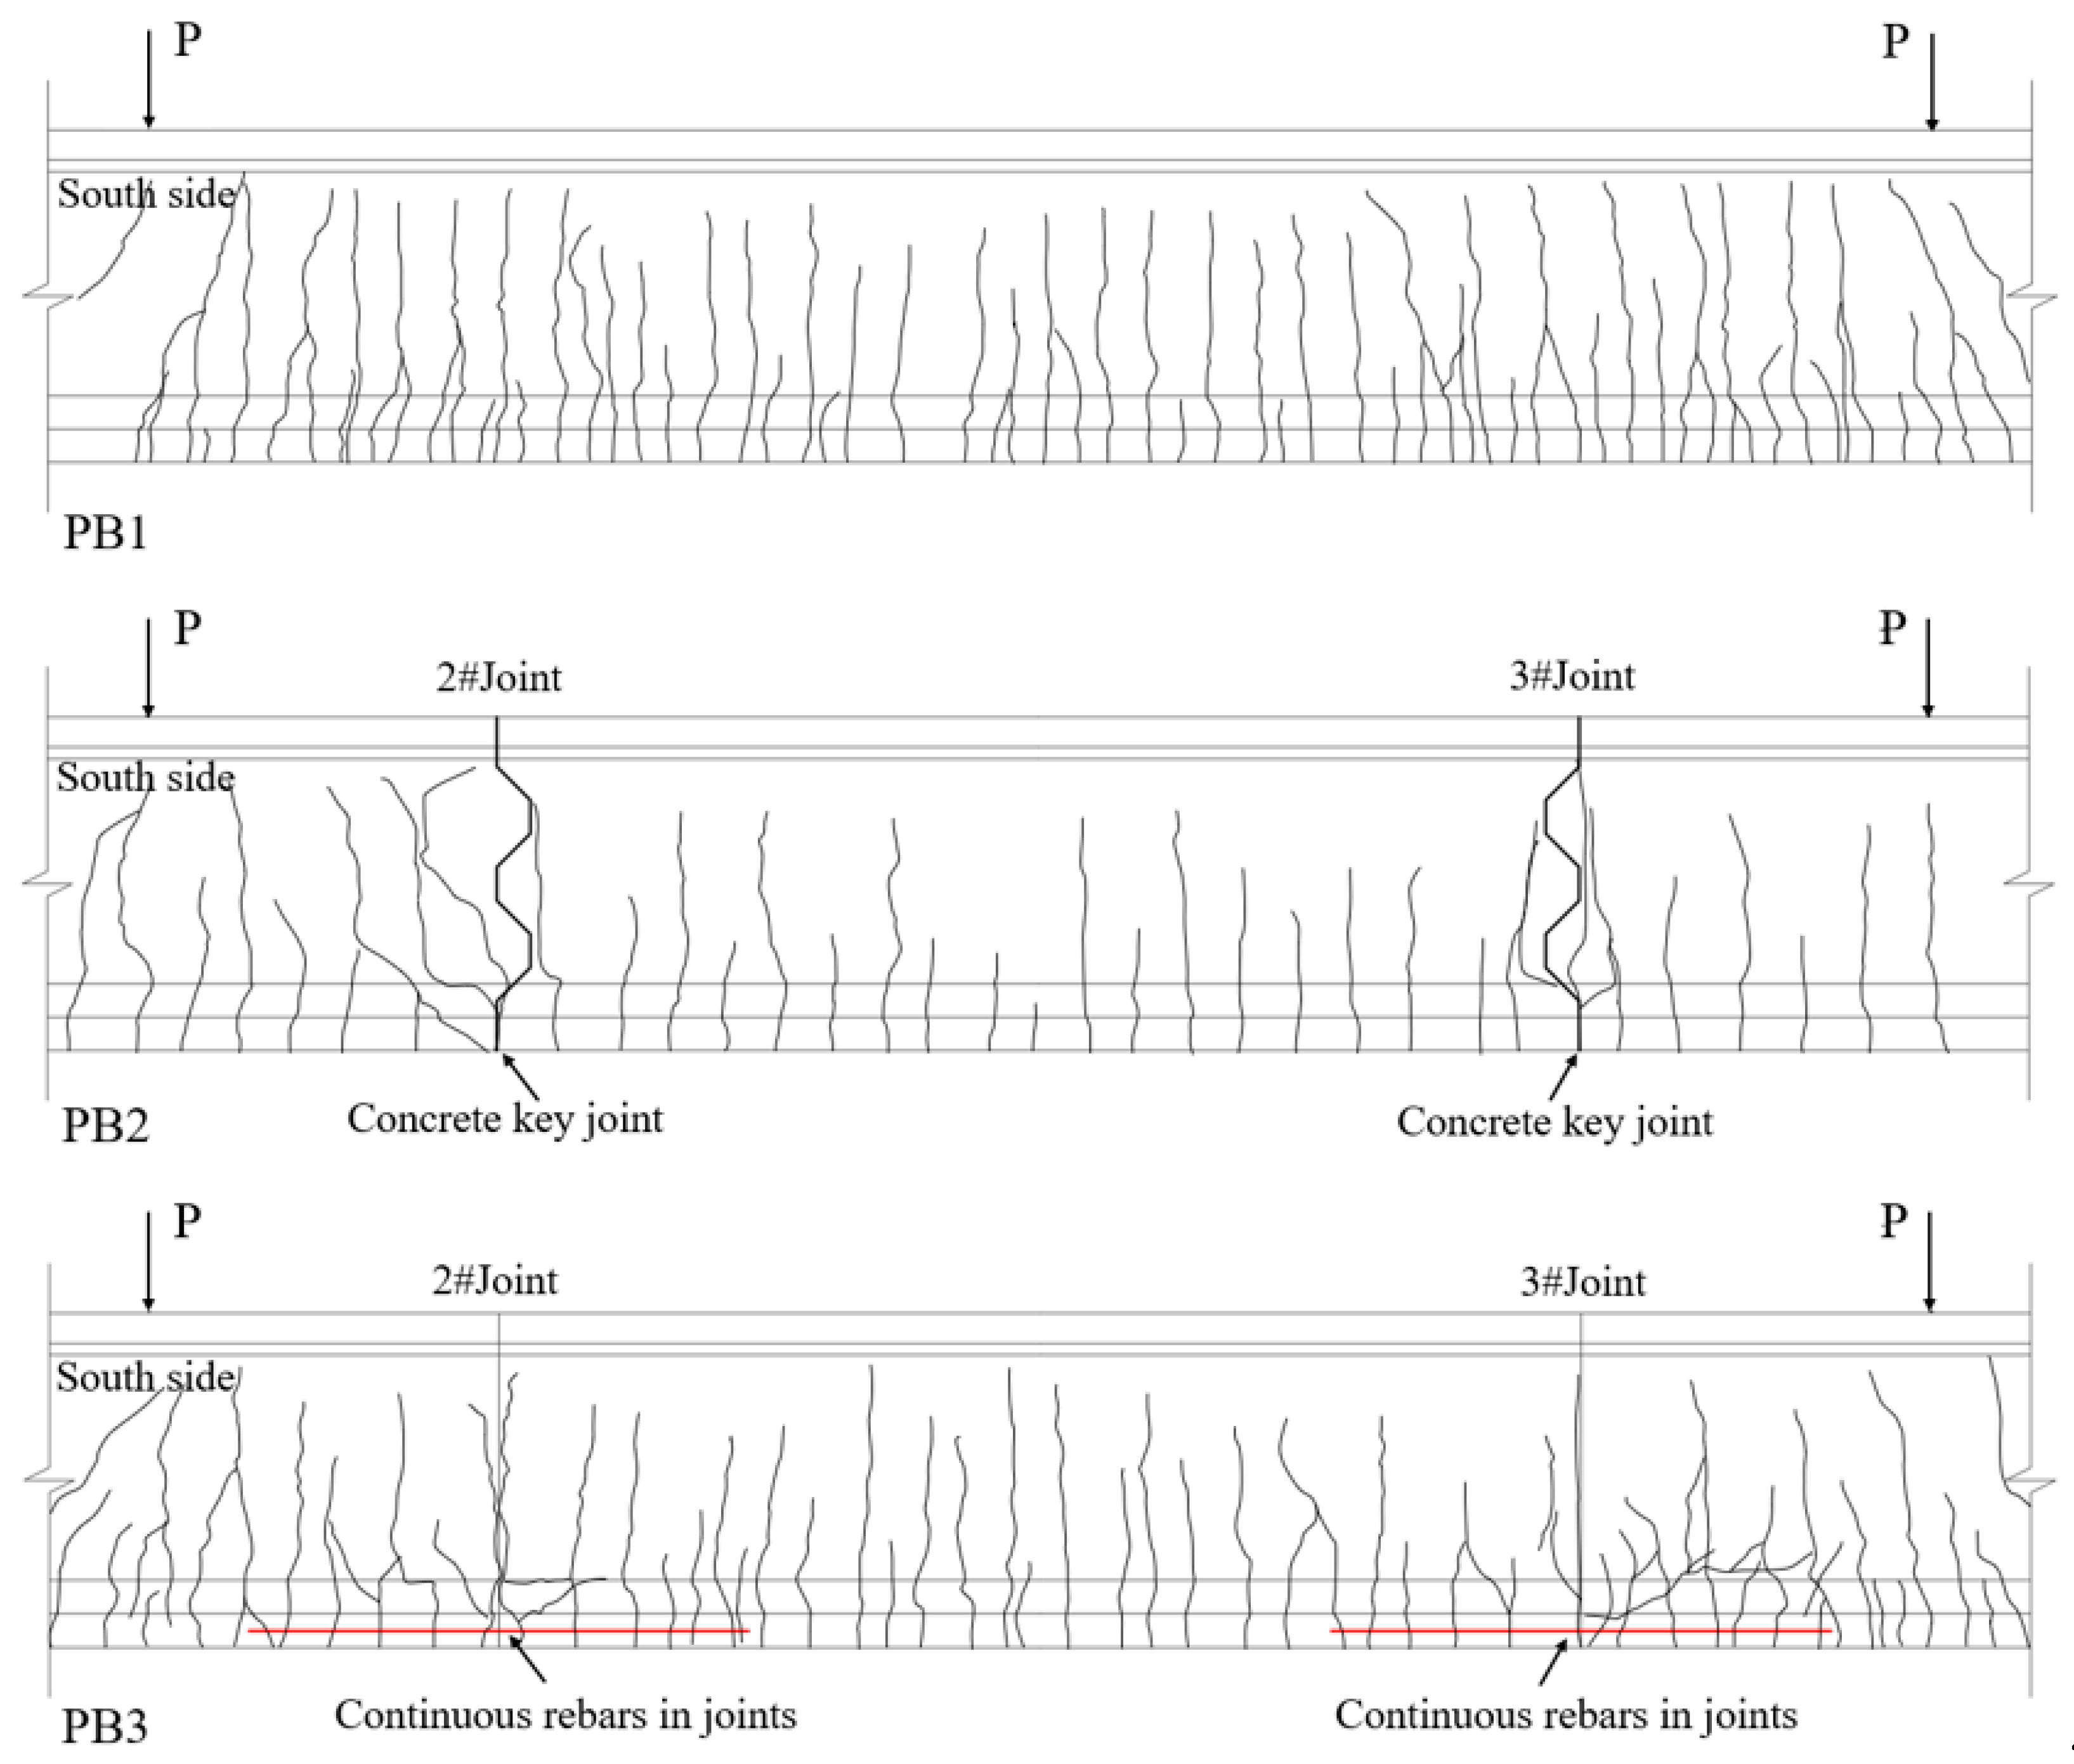
4.1. Crack Propagation
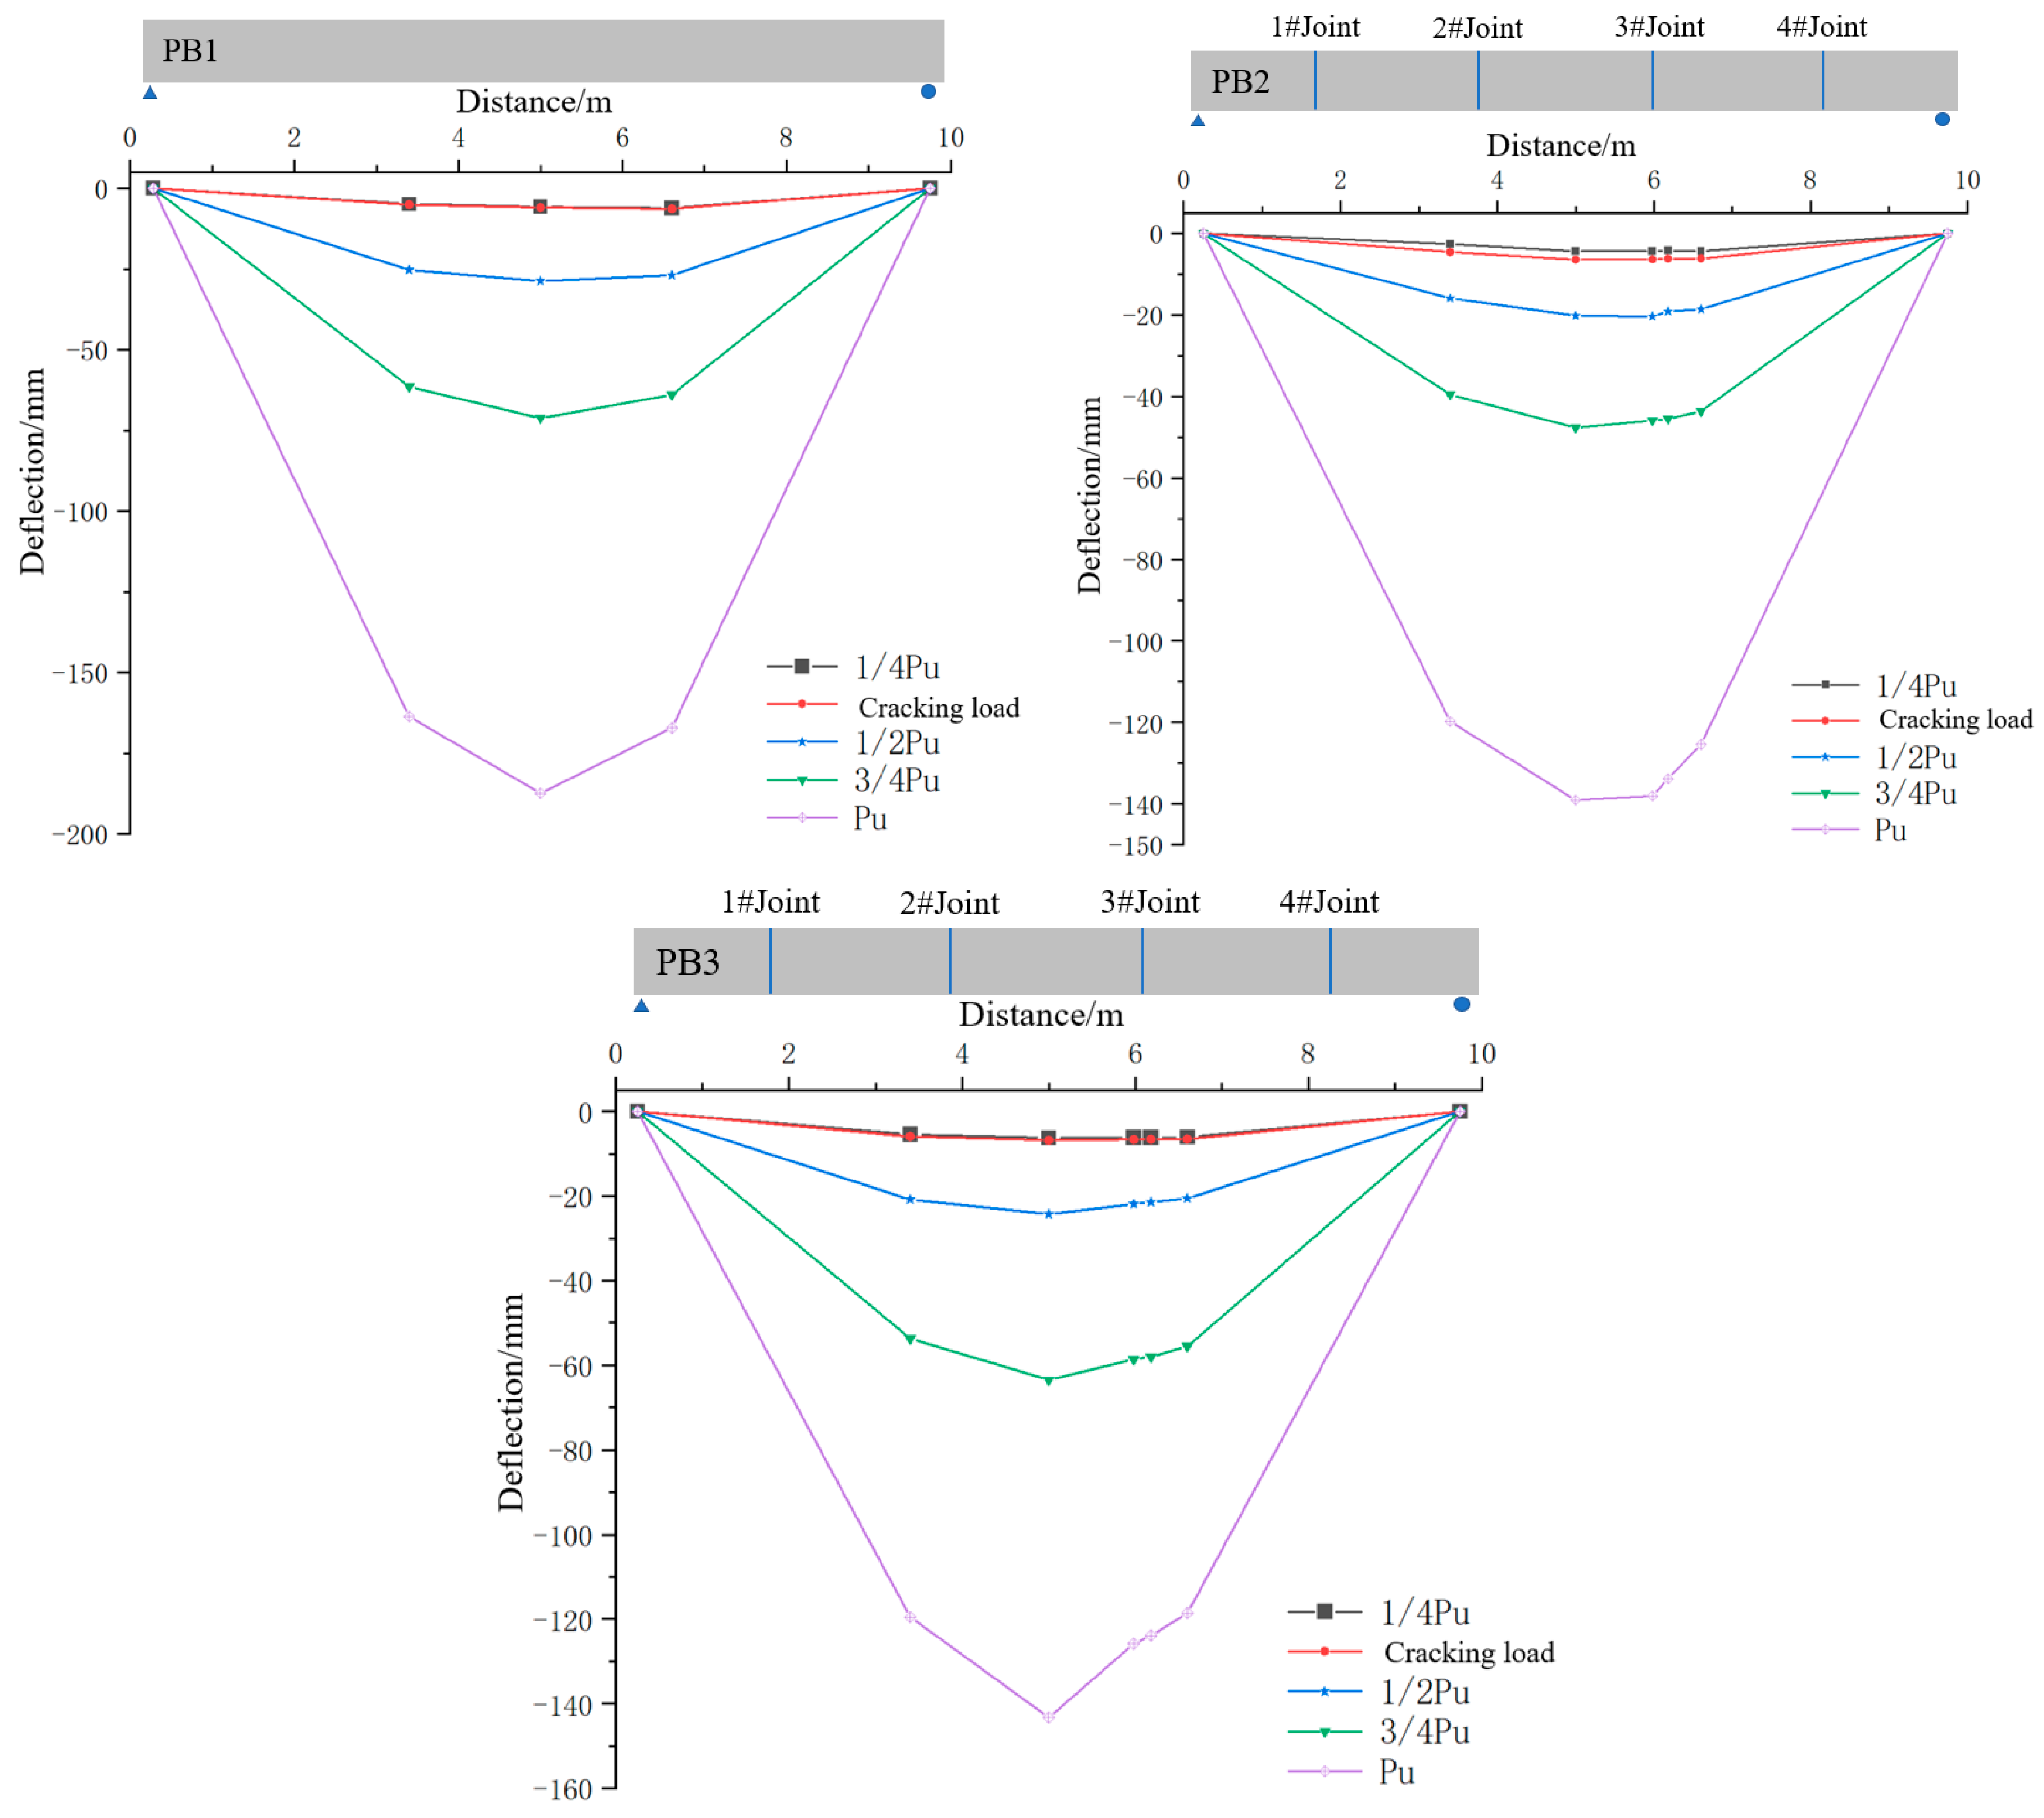
Owing to the effective transmission of normal stresses by longitudinal steel bars, the bending cracks in the pure bending section of beam PB1 were fully developed. Nonetheless, beam PB2 lacked the limitation of ordinary steel bars on the crack width at the joint position, resulting in the development of structural cracks mainly concentrated at the joint, forming a weak part in the structural bending resistance. In comparison to beam PB2, the inclusion of continuous longitudinal rebars at the joints of beam PB3 addressed bending deficiencies, enhanced the cracking load capacity of the joints, and effectively transferred normal stresses between sections across the joints. This structural improvement resulted in crack propagation patterns more akin to those observed in beam PB1. The crack patterns are depicted in Figure 15.

4.2. Deformation

Before cracking, each specimen exhibited significant stiffness, with beams PB2 and PB3, similar to beam PB1, experiencing uniform deformation. As vertical loading increased, all specimens developed varying degrees of cracks, leading to gradual stiffness reduction. Beam PB2, characterized by weak bending stiffness at joint positions due to discontinuous longitudinal rebars, exhibited pronounced joint deflection development. At ultimate bearing capacity, the deflection at joint 3# nearly matched mid-span deflection, causing a turning point in the deflection curve. Conversely, beam PB3 showed deformation curves similar to PB1 due to continuous rebars reinforcing joint bending stiffness. Figure 16 illustrates the vertical deflection distributions along the length of beams PB1–PB3 under different load conditions.

4.3. Joint Opening Width

Figure 17 shows that the opening width of the joint varied along the beam height. The joint section of beam PB3 was more consistent with the assumption of the plain section due to the effective transfer of the normal stress on the joint section by the continuous rebars in joints. Compared with beam PB2, the continuous rebars in joints can effectively limit the opening width of the joint.

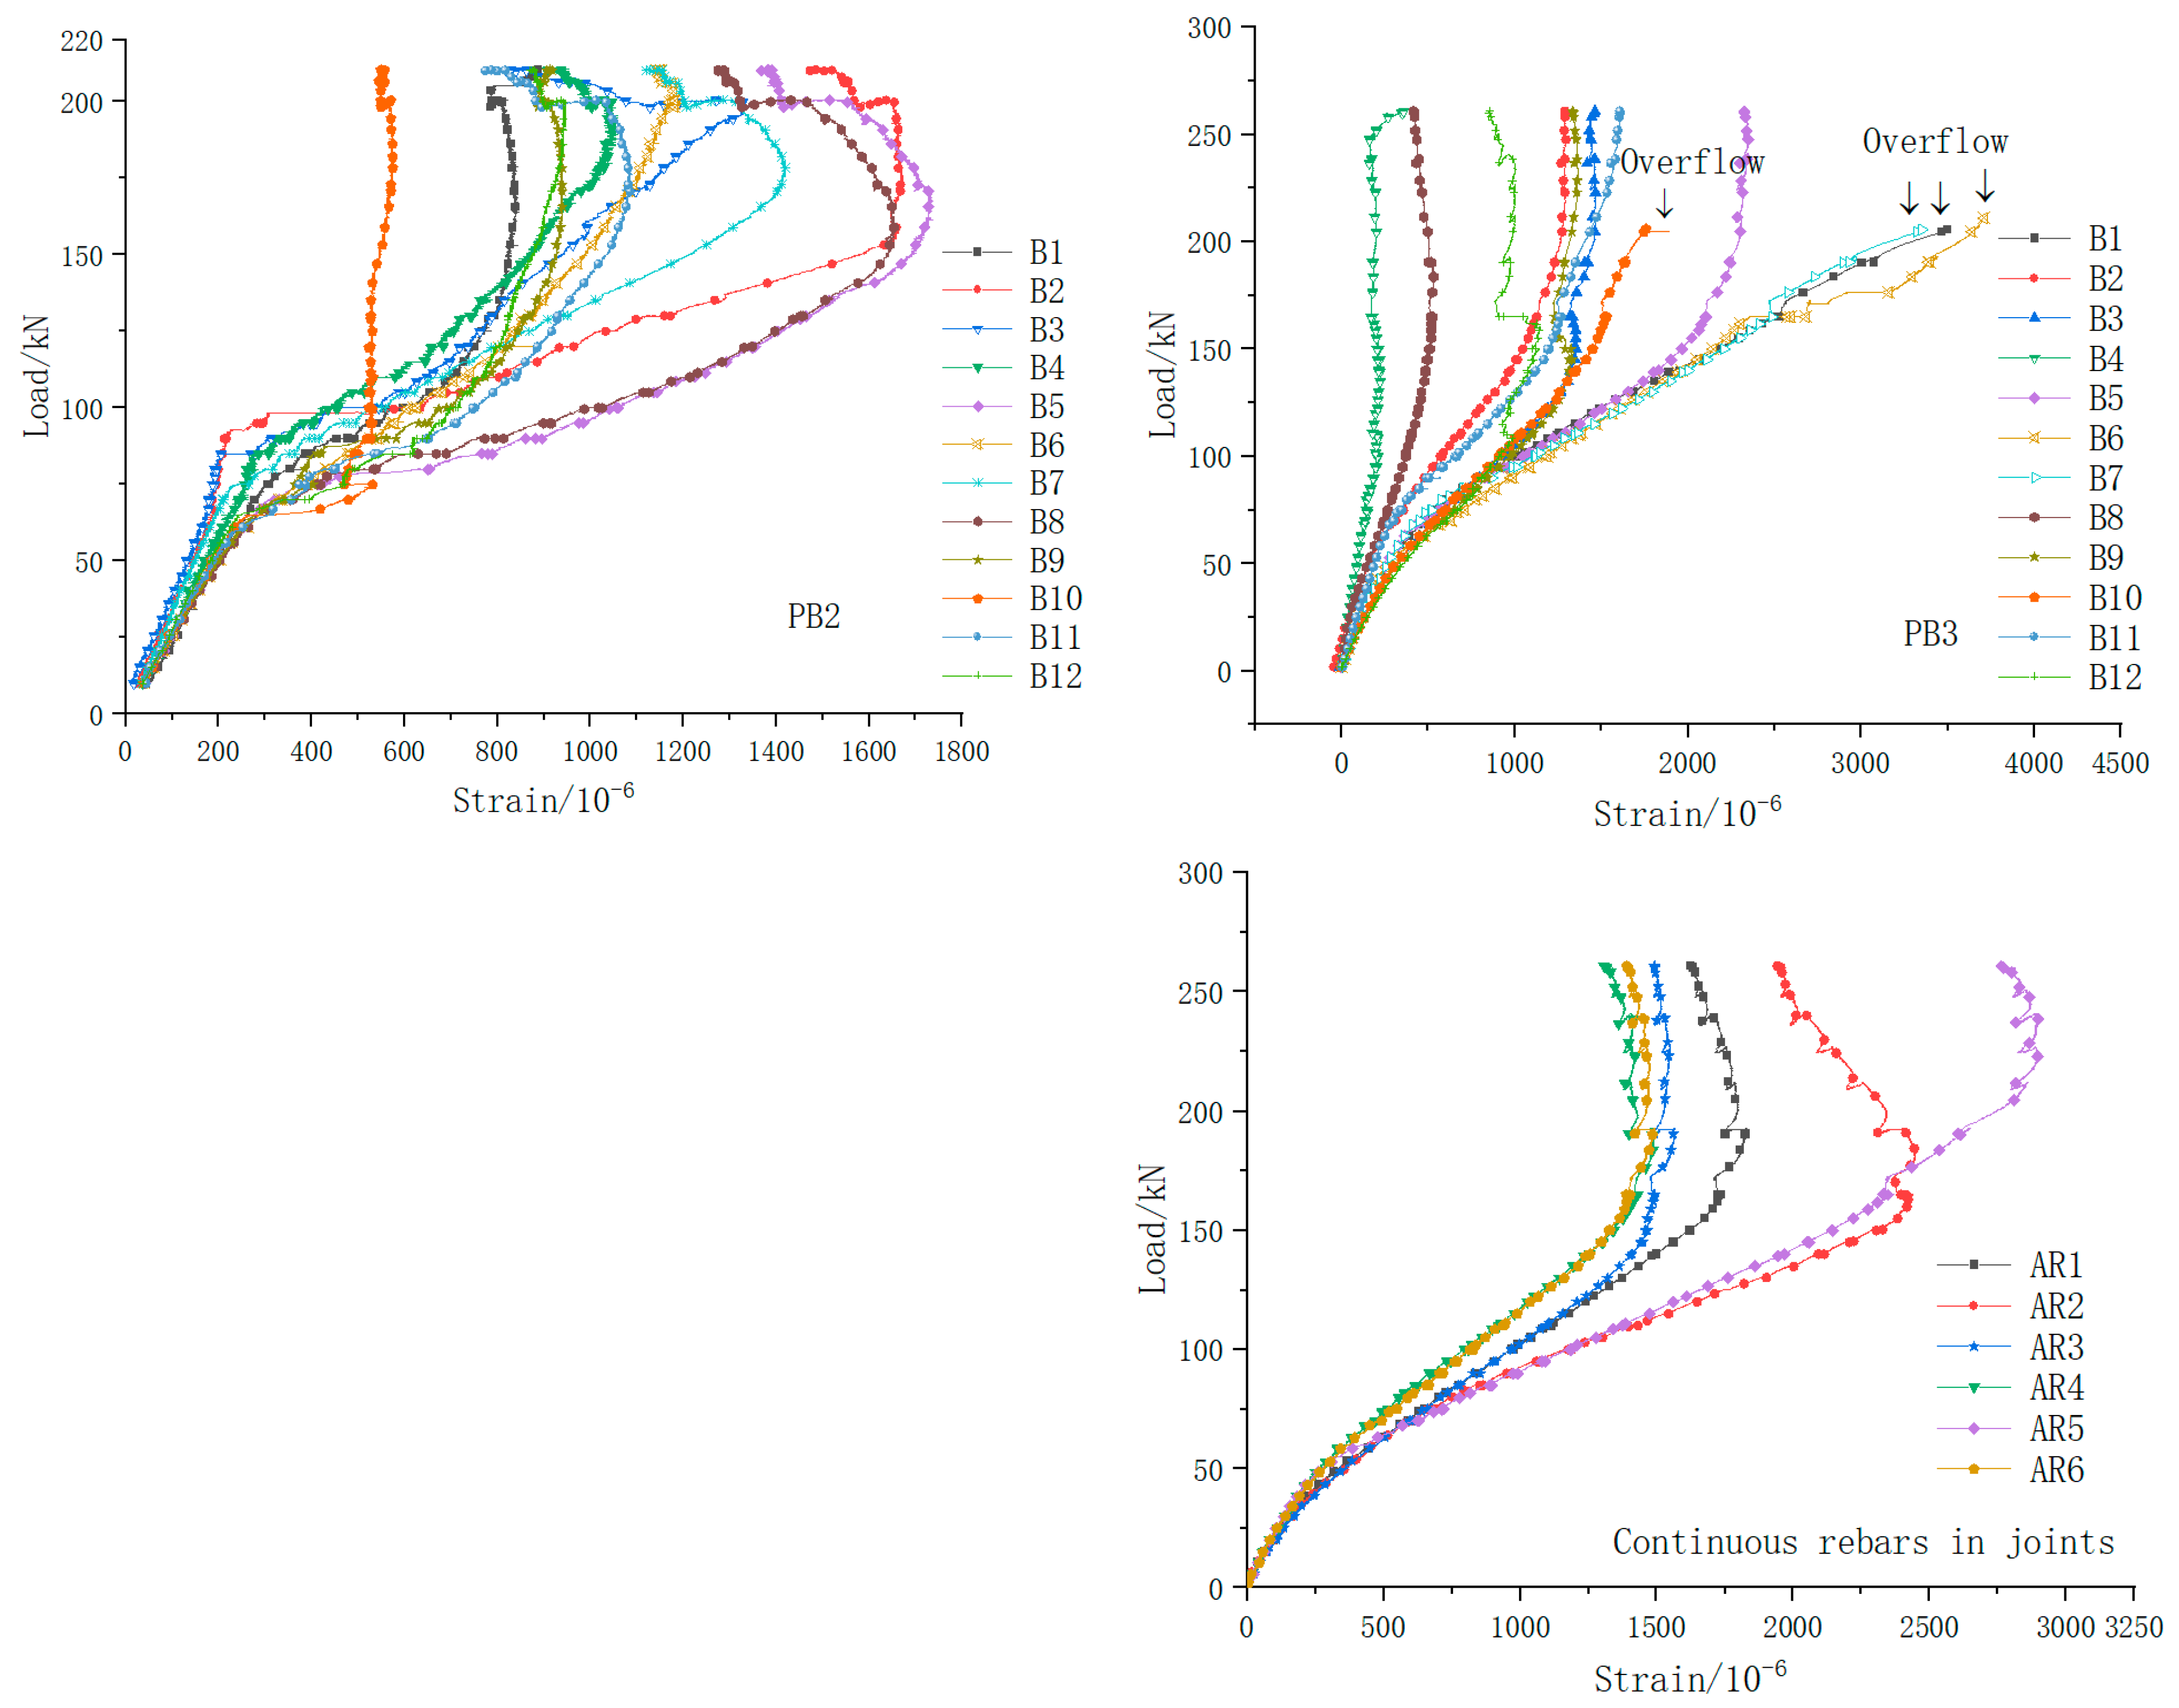
4.4. Strains in Rebars
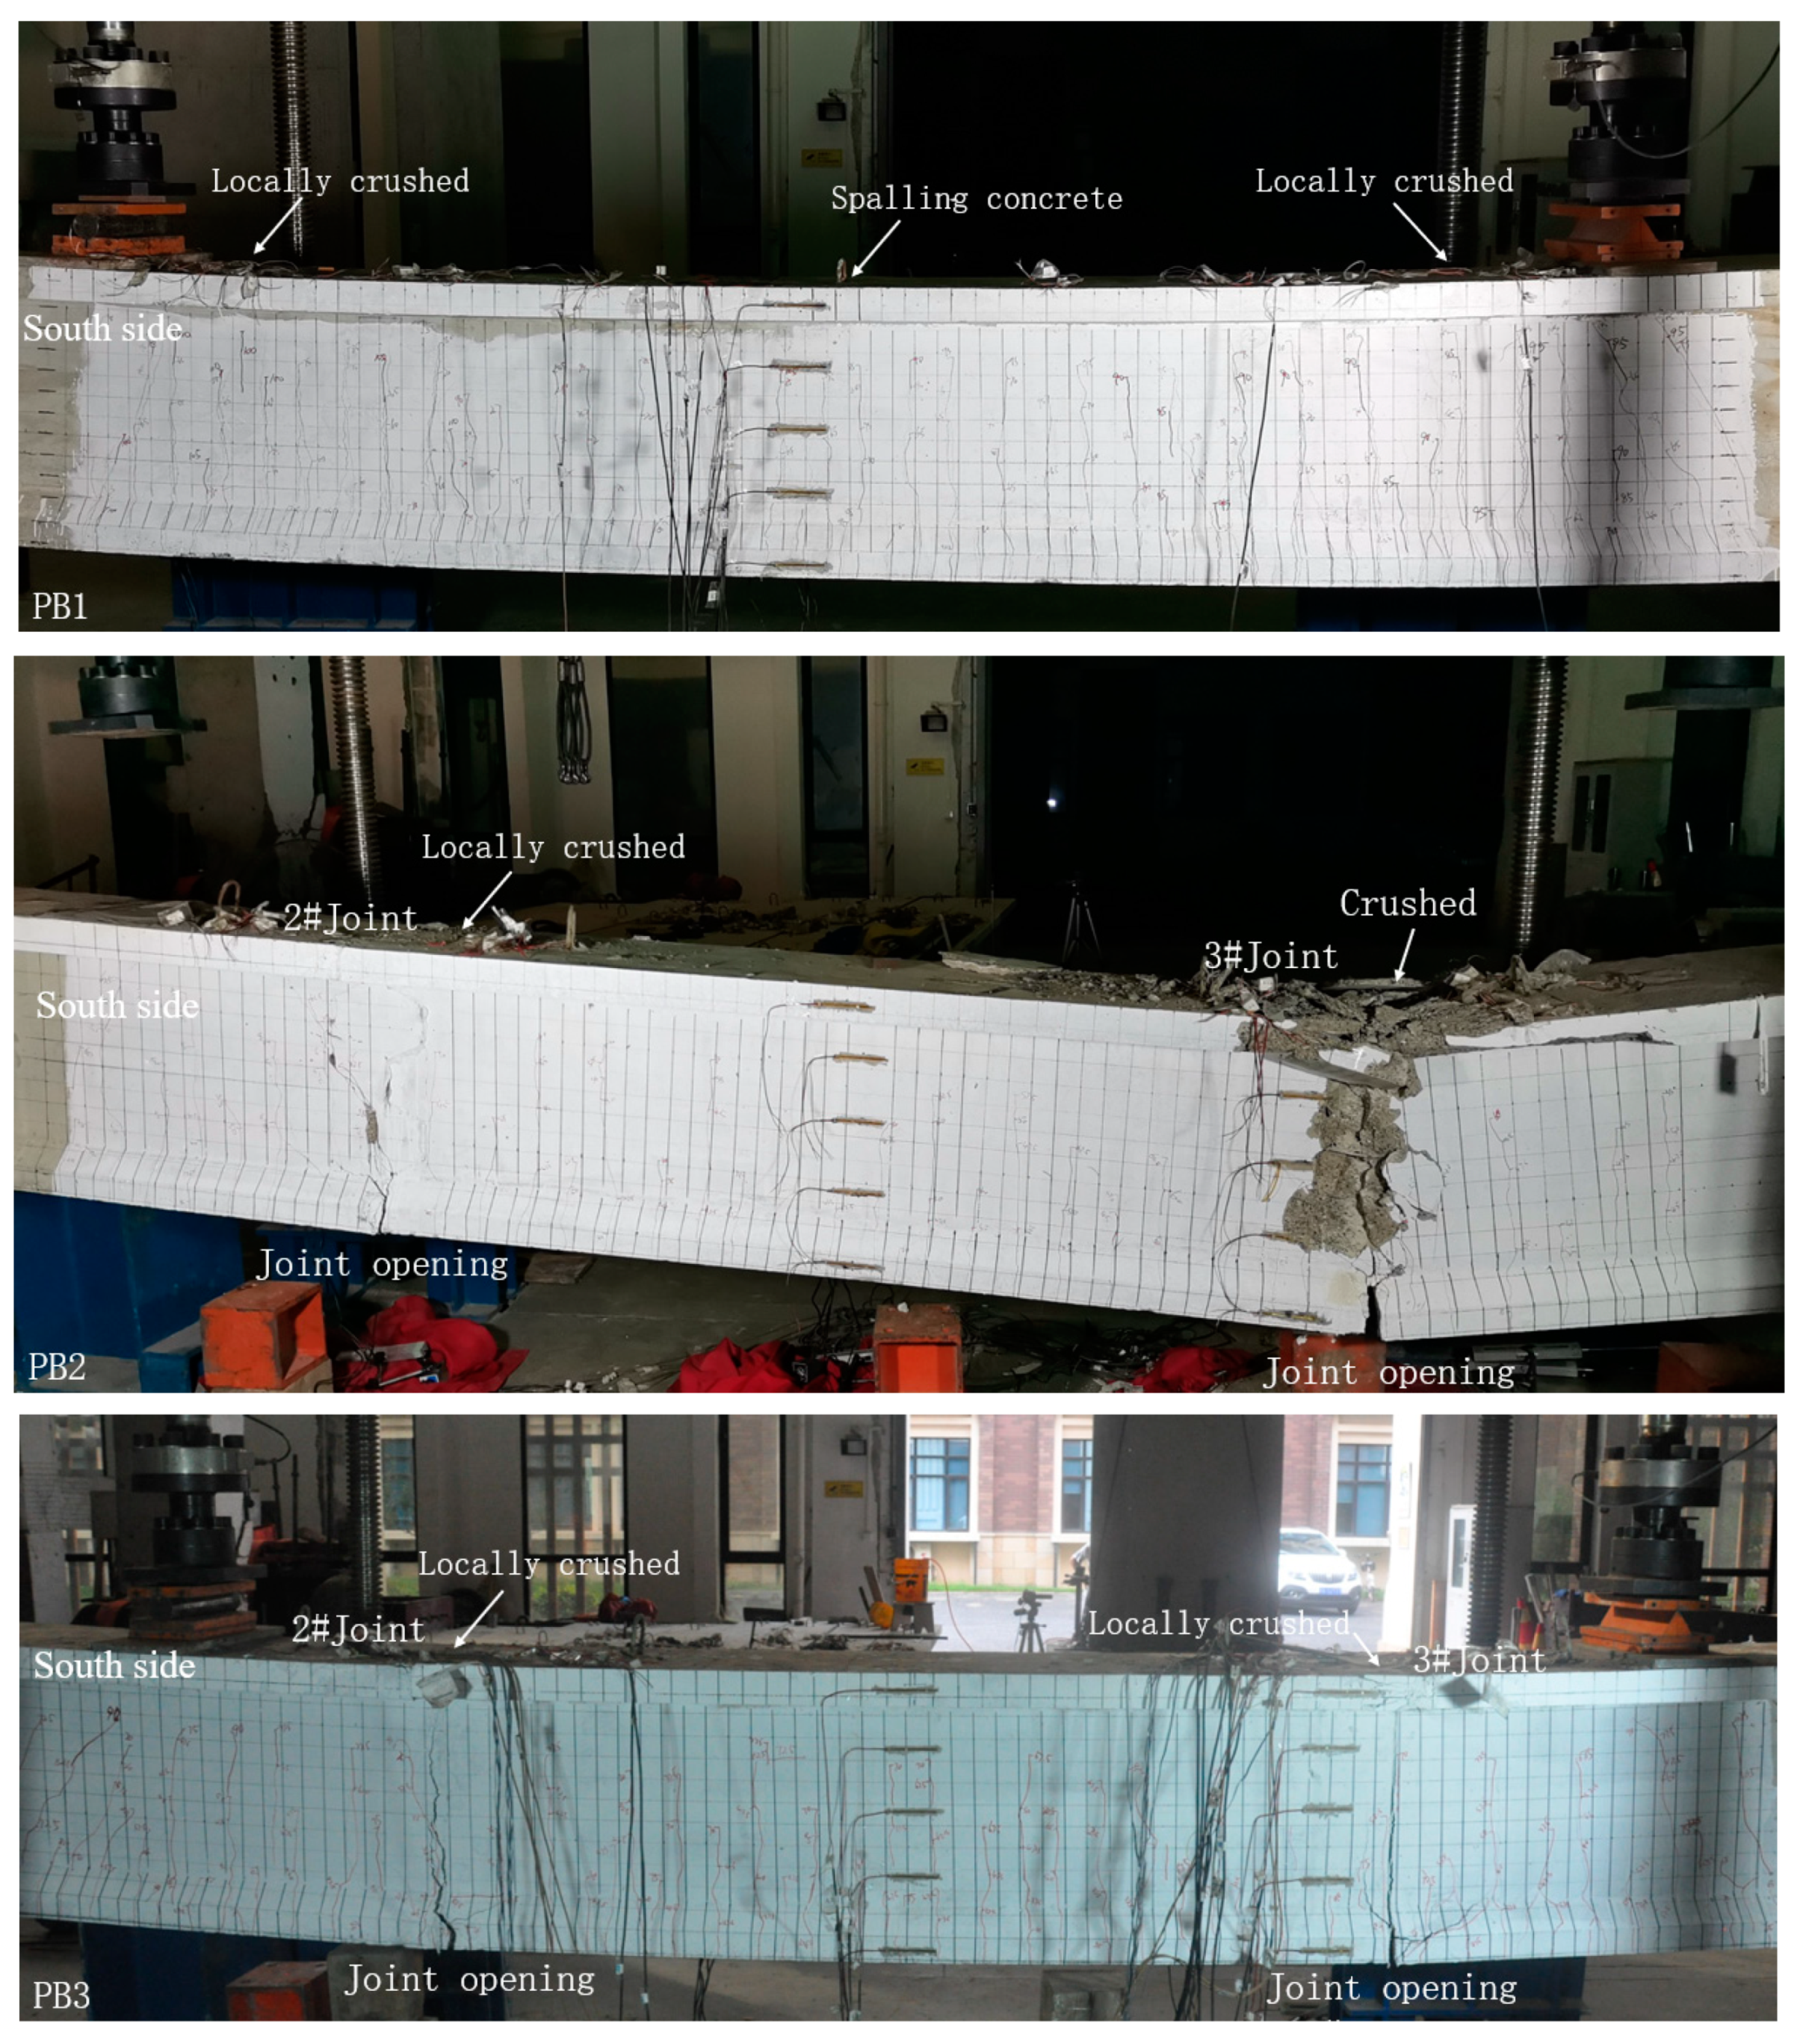
The load–strain relationship of ordinary steel bars of each test beam is shown in Figure 18. Prior to joint opening, beam PB2 exhibited evenly distributed and developing bending cracks on the bottom plate, with strain in longitudinal rebars increasing proportionally with loading force. After joint opening, crack widths decreased and strain in ordinary steel bars reduced. At ultimate bearing capacity, the longitudinal rebars on the bottom plate of beam PB2 did not yield. In contrast, due to the continuity of ordinary steel bars at joint positions, beam PB3 showed multiple sections of longitudinal rebars on the bottom plate reaching yield strain, along with continuous steel bars at the joints reaching yield strain at ultimate bearing capacity. This demonstrates that continuous steel bars effectively transmitted normal stress across joint surfaces between segments, significantly enhancing the bending resistance of segmental beams.

4.5. Failure Modes

When beam PB1 sustained damage, cracks fully developed in the pure bending section. The concrete in the compression area near the top edge exhibited local bulging, collapsing, and peeling phenomena. These manifestations were accompanied by a significant decrease in the applied loading force. The failure mode is shown in Figure 19.
During the loading process of beam PB2, the crack development of the specimen mainly concentrated on the joint, and gradually formed a main crack extending through the root of the convex tooth key to the top plate. As the loading force increased, the opening width of the joint continued to widen, causing the neutral axis of the section to rise steadily. Simultaneously, the concrete area in the compression zone near the top edge of the joint gradually diminished. Upon reaching the point of structural damage, the prestressing tendons at the joint 3# position were pulled off, and the concrete at the top edge of the joint was crushed.
Before horizontal cracks emerged around the continuous rebars in beam PB3, crack development was not primarily concentrated at the joint position, unlike in the concrete keyed segmental beam (PB2). Similar to monolithic beams, vertical bending cracks fully developed across the pure bending section. After horizontal cracks appeared around the continuous rebars, local anchorage of these rebars failed, leading to gradual deterioration in joint bending stiffness. As such, the joint opened, the neutral axis shifted upwards, and the concrete at the top edge of the joint collapsed.

4.6. Stiffness and Capacity

The main test results are shown in Table 6. Compared with beam PB2, the joint cracking loads of beam PB3 increased by 28.57% (Joint 2#) and 33.33% (Joint 3#). In addition, the ultimate bearing capacity increased by 32.18% based on the beneficial contribution of continuous rebars to the joint bending resistance of the segmental beam.
The plastic deformation capacity of beam PB3 was similar to that of beam PB1, and was greater than that of beam PB2. Before continuous rebars’ anchorage failure, the load-displacement curves of beams PB3 and PB1 almost coincided, and their stiffness levels were similar. After continuous reinforcement anchorage failure, the stiffness of beam PB3 decreased obviously. The load–displacement curves are shown in Figure 20.

5. Calculation Method

5.1. Cracking Strength of Joints

Calculating the crack resistance is critical in the design of concrete elements. Based on the mechanics of materials, the cracking moment of the epoxied joint section can be represented as
M c r = ( σ p + f e t ) W o
where f e t is the flexural tensile strength of the epoxied joint, σ p is the stress at the cracked edge caused by the effective prestress in the tendons, and W o is the elastic section modulus in bending.

5.2. Flexural Capacity of Joints

After the joint is cracked, the bending normal stress originally borne by the epoxied joint is transferred to the continuous rebar. The sectional model of joints is shown in Figure 21.
Similarly, the flexural capacity of joints can be represented as
F = T p 2 + T s 2 = ε s 2 A s E s + ( ε s 2 E s + f e ) A p s
where T s 2 is the force in the continuous rebars, T p 2 is the force in the prestressing tendons, E s is the elasticity modulus of rebars, ε s 2 is the strain of continuous rebars, f e is the effective stress in the prestressing tendons, A s is the cross-sectional area of the ordinary steel bars, and A p s is the cross-sectional area of the prestressing tendons.

6. Conclusions

PCSBs are being constructed in great numbers worldwide. The joints between segments are the weak parts where the longitudinal steel bars are interrupted at the joints that can affect the overall performance of PCSBs. In the present study, to tackle these issues, a type joint with continuous rebars was proposed to restrain the joints between segments on the tension side. To study the mechanical properties of the new joint, experiments were carried out to compare the monolithic beam and the traditional segmental beam, and the conclusions were obtained as follows.
(1)
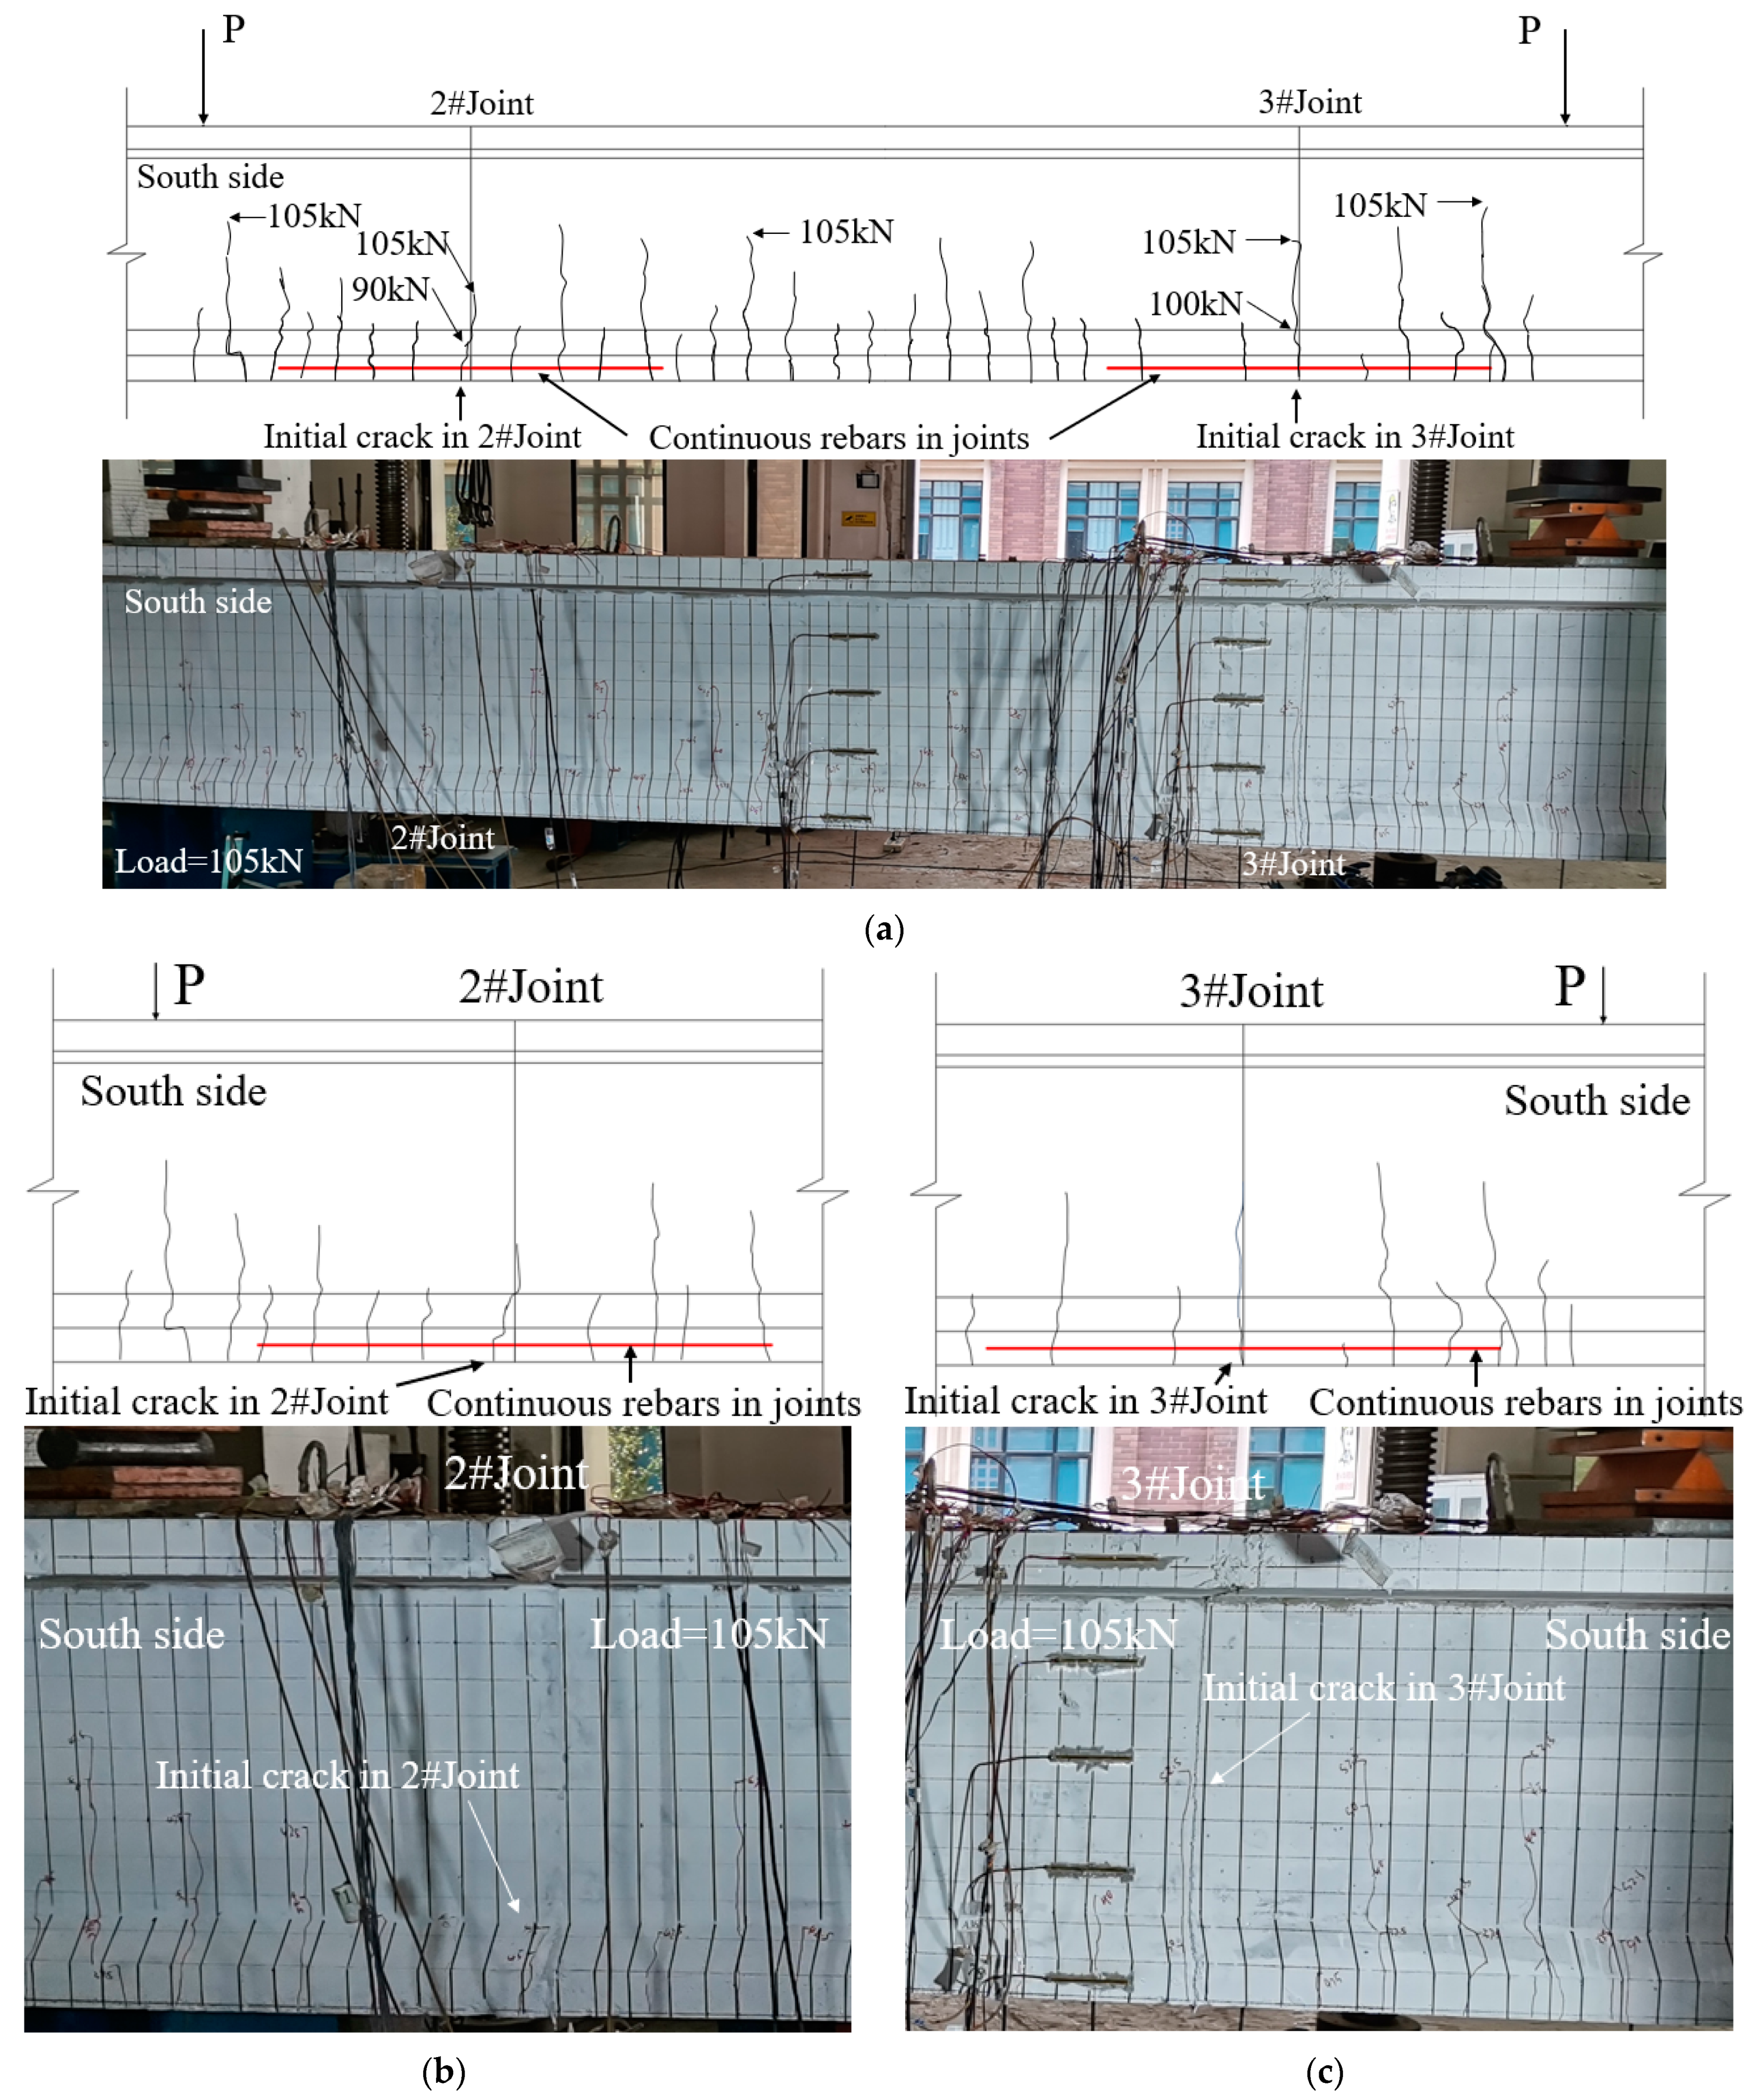
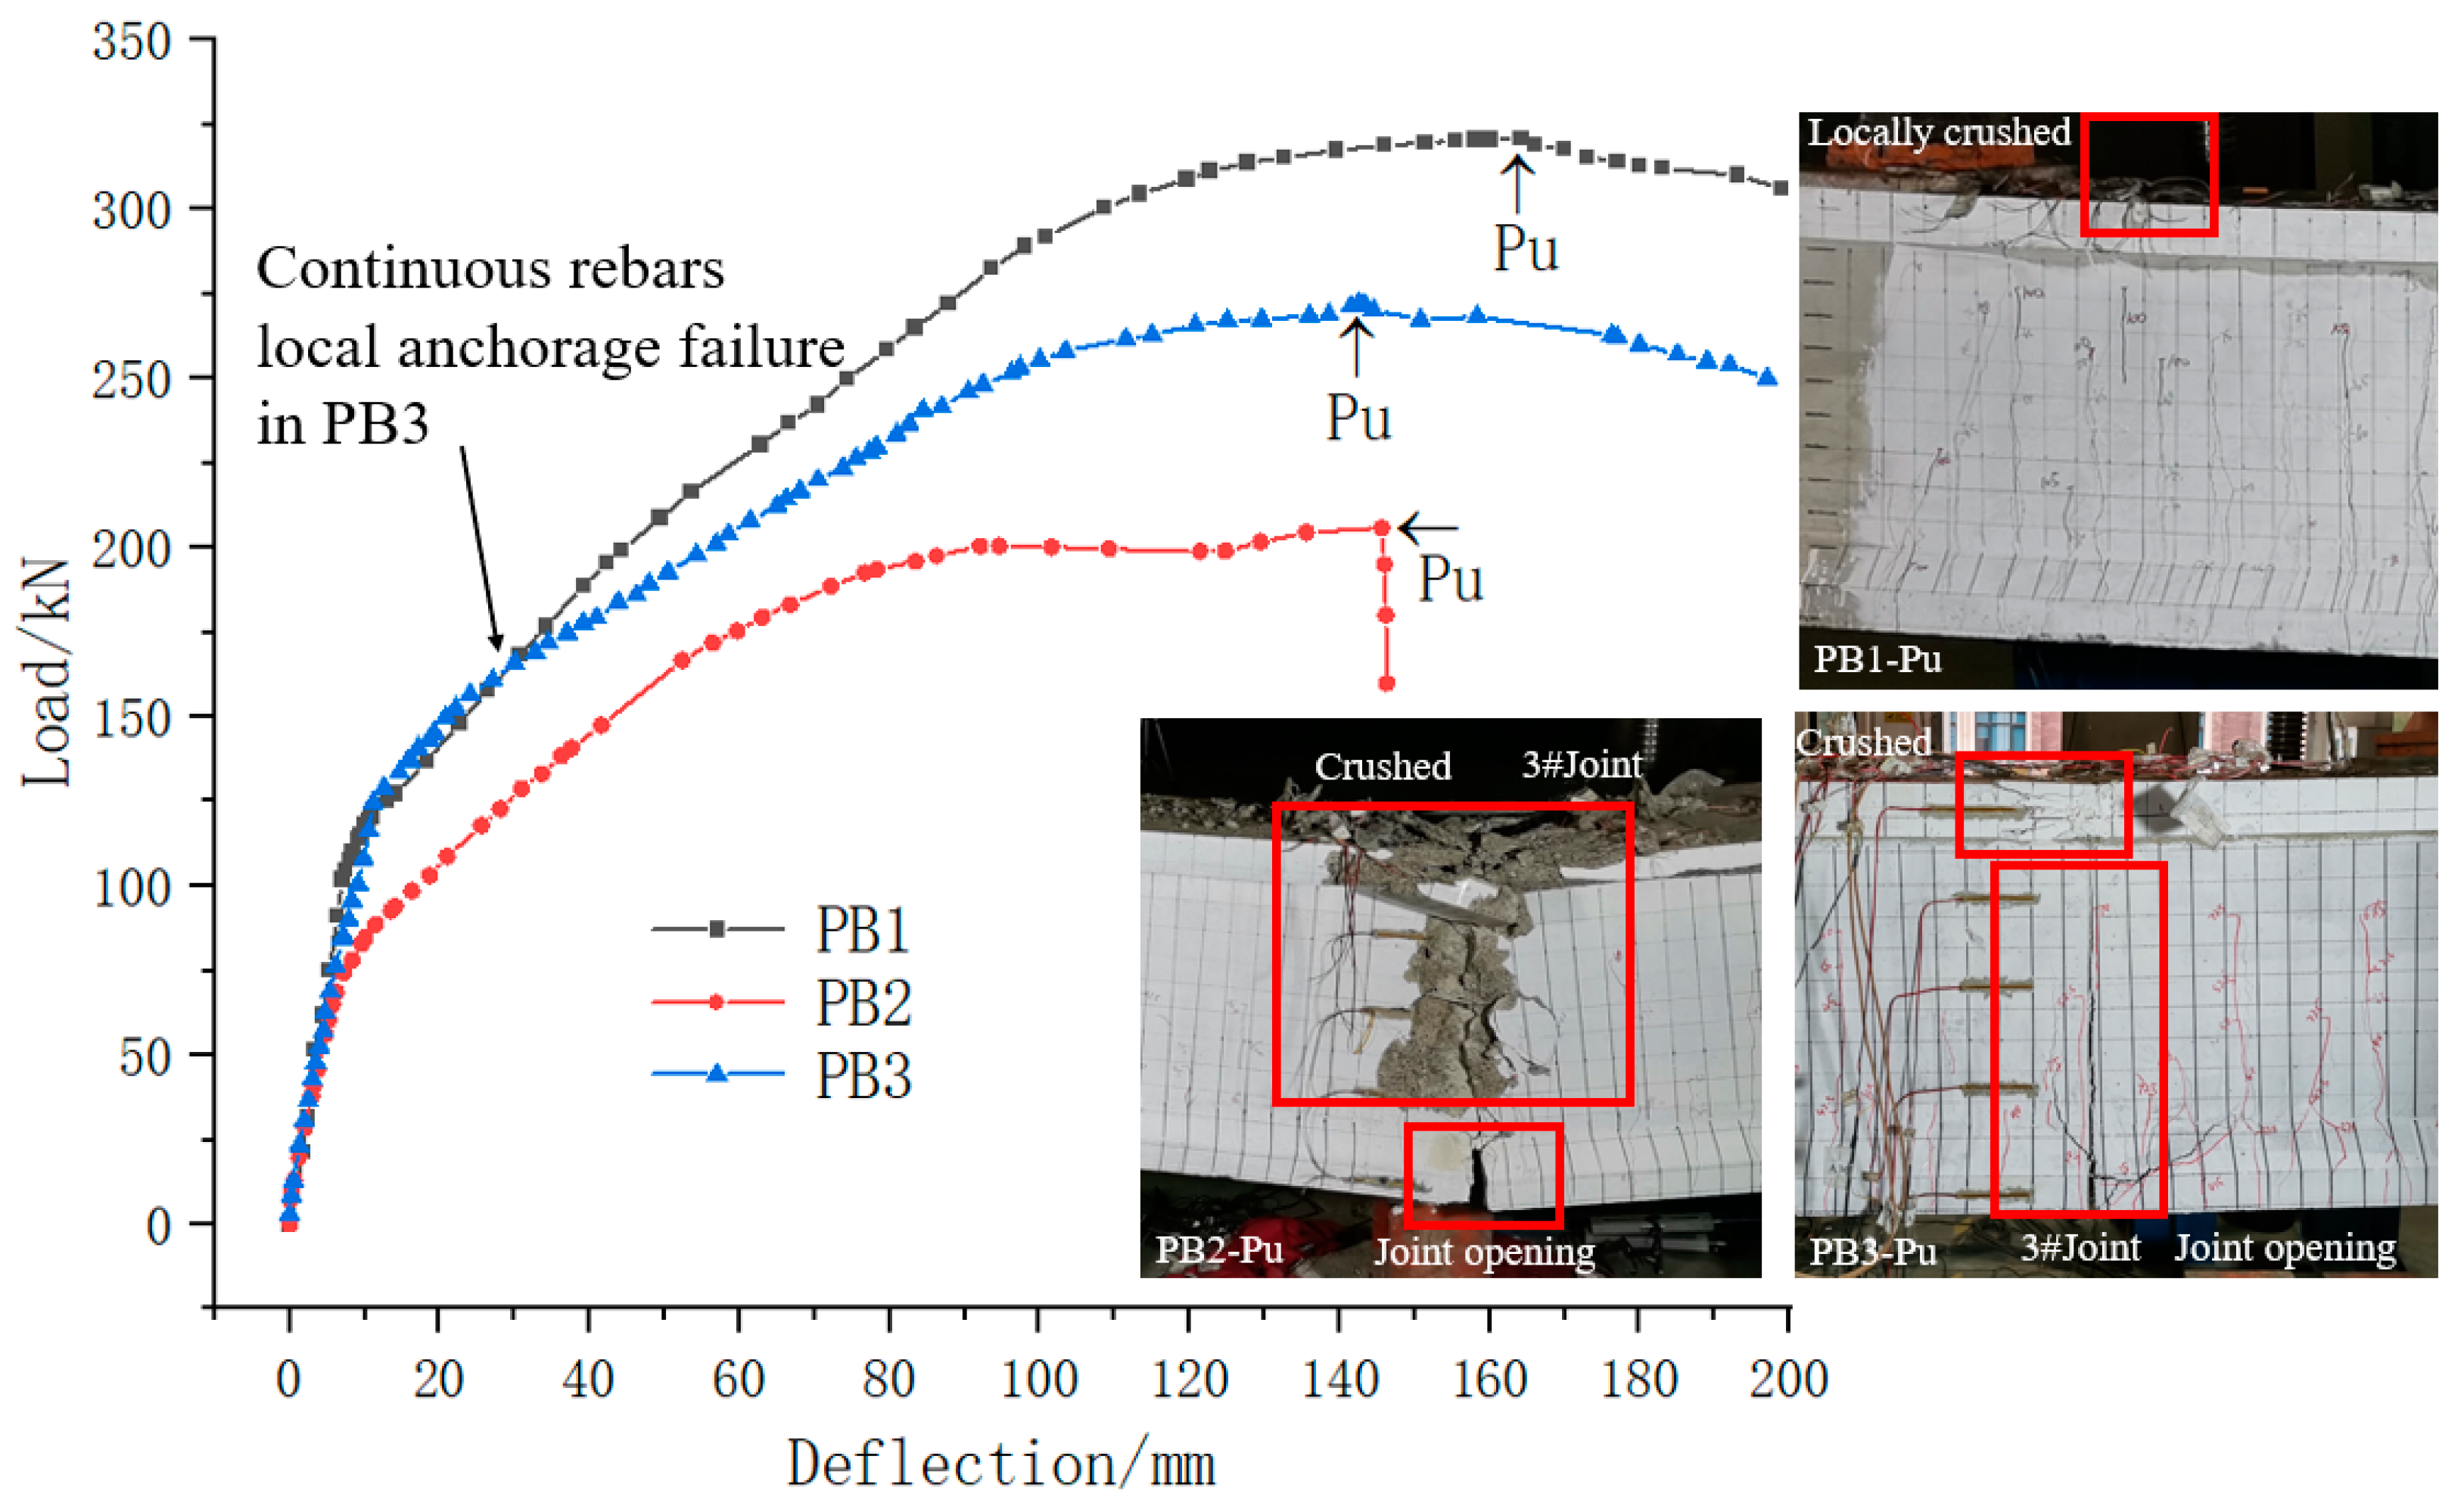
Prior to the appearance of horizontal cracks near the continuous rebars, the load–displacement curve of beam PB3 closely mirrored that of beam PB1. During this stage, the mechanical behaviors of beam PB3, including stiffness, crack development, and cracking load, closely resembled those of beam PB1. Additionally, crack lengths and widths at the mid-span, loading points, and joints in beam PB3 developed synchronously and harmoniously. Unlike beam PB2, there was no concentration of cracks specifically at the joints during this phase.
(2)
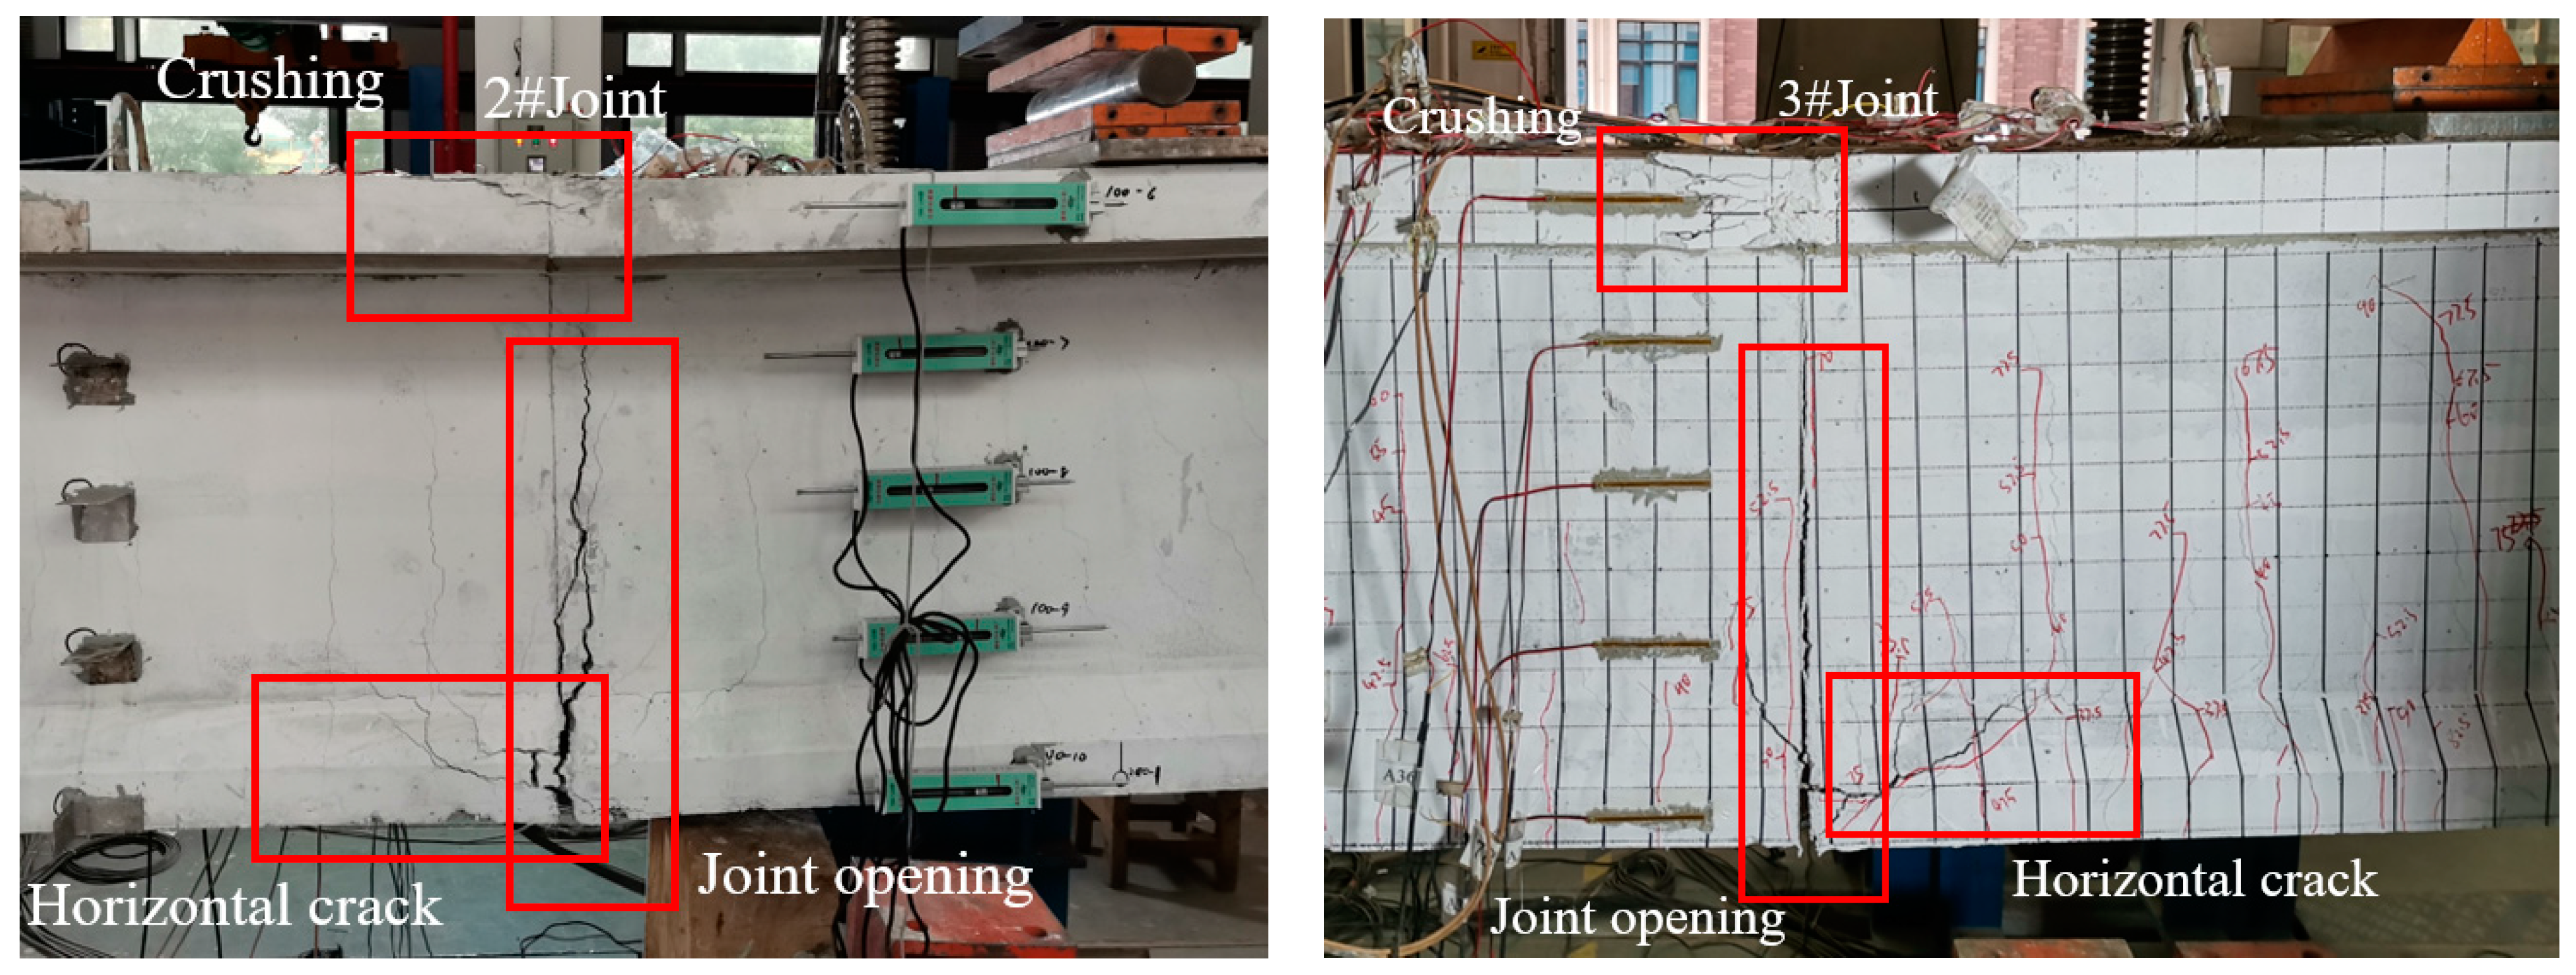
After horizontal cracks appear near the continuous rebars, local anchorage failure of the continuous rebars occurs, leading to a significant decrease in structural stiffness and fluctuation in the load–displacement curve. Subsequently, the joints rapidly redistributed internal forces until the continuous rebars yielded and the concrete crushed along the top edge. During this stage, the flexural stiffness of the joints decreased, cracks concentrated at the joints, and the joints gradually opened. However, in comparison with beam PB2, the continuous rebars continued to effectively limit the widths of joint openings.
(3)
Compared with traditional segmental beams, the continuous rebars at joints could greatly improve the stiffness and bending strength (cracking load and ultimate load) of the segmental beams, while also delaying the cracking time of joints, improving the durability of joints, and prolonging the service life of segmental beams.
(4)
The continuous rebars at joints effectively transmitted normal stresses between segments. During specimen failure, both the ordinary longitudinal rebars in the segments and the continuous rebars at the joints reached the yield strain. Further, the continuous rebars effectively constrained the opening width of the joint.
(5)
The continuous rebars at the joints significantly enhanced the ductility of segmental beams, ensuring full crack development within the segmental sections. The deflection at the peak load in the structures occurs typically at the mid-span, contrasting with the concentrated rotation and deflection observed at individual joints in traditional segmental beams. The deflection/deformation curves followed similar patterns to those of monolithic beams, indicating the improved structural behavior and performance.
(6)
Continuous rebars at the joints significantly enhanced the flexural stiffness, strength, and ductility of segmental beams. This structural configurations combine the advantages of precast segmental construction while effectively transferring normal bending stress across each section of the entire beam. It is recommended that the PCSBs should adopt the continuous longitudinal rebars across the joint.

Author Contributions

Conceptualization, Y.Z. and D.X.; methodology, Y.Z. and D.X.; investigation, Y.Z.; resources, Y.Z.; data curation, Y.Z.; writing—original draft preparation, Y.Z.; writing—review and editing, Y.Z. and D.X.; funding acquisition, D.X. and Y.Z. All authors have read and agreed to the published version of the manuscript.

Funding

The research presented was sponsored by the National Natural Science Foundation of China (grant no. 52078363).

Institutional Review Board Statement

Not applicable.

Data Availability Statement

Some or all data, models, or code that support the findings of this study are available from the corresponding author upon reasonable request.

Conflicts of Interest

The authors declare no conflicts of interest.

References

  1. Yan, W.-T.; Han, B.; Xie, H.-B.; Li, P.-F.; Zhu, L. Research on numerical model for flexural behaviors analysis of precast concrete segmental box girders. Eng. Struct. 2020, 219, 110733. [Google Scholar] [CrossRef]
  2. Tran, D.T.; Pham, T.M.; Hao, H.; Chen, W.S. Numerical study on bending response of precast segmental concrete beams externally prestressed with FRP tendons. Eng. Struct. 2021, 241, 112423. [Google Scholar] [CrossRef]
  3. Guo, W.Q.; Feng, K.; Zhou, Y.L.; Yang, W.Q.; Lu, X.Y.; Xiao, M.Q.; He, C. Full-scale test and numerical modeling on deformation and damage behavior of segmental joints under ultimate compression-bending load. Eng. Struct. 2023, 279, 115648. [Google Scholar] [CrossRef]
  4. Tran, D.T.; Pham, T.M.; Hao, H.; San Ha, N.; Vo, N.H.; Chen, W. Precast segmental beams made of fibre-reinforced geopolymer concrete and FRP tendons against impact loads. Eng. Struct. 2023, 295, 116862. [Google Scholar] [CrossRef]
  5. Hu, Y.; Qiu, J.; Li, Z.; Yao, Y.; Liu, J.; Wang, J. Shear strength prediction method of the UHPC keyed dry joint considering the bridging effect of steel fibers. Eng. Struct. 2022, 255, 113937. [Google Scholar] [CrossRef]
  6. Liu, T.; Wang, Z.; Guo, J.; Wang, J. Shear strength of dry joints in precast UHPC segmental bridges: Experimental and theoretical research. J. Bridge Eng. 2019, 24, 04018100. [Google Scholar] [CrossRef]
  7. Zhou, X.; Mickleborough, N.; Li, Z. Shear strength of joints in precast concrete segmental bridges. ACI Struct. J. 2005, 102, 3–11. [Google Scholar]
  8. Turmo, J.; Ramos, G.; Aparicio, A.C. FEM study on the structural behaviour of segmental concrete bridges with unbonded prestressing and dry joints: Simply supported bridges. Eng. Struct. 2005, 27, 1652–1661. [Google Scholar] [CrossRef]
  9. Sørensen, J.H.; Hoang, L.C.; Poulsen, P.N. Keyed shear connections with looped U-bars subjected to normal and shear forces Part I: Experimental investigation. Struct. Concr. 2021, 22, 2418–2431. [Google Scholar] [CrossRef]
  10. Hao, H.; Bi, K.; Chen, W.; Pham, T.M.; Li, J. Towards next generation design of sustainable, durable, multi-hazard resistant, resilient, and smart civil engineering structures. Eng. Struct. 2023, 277, 115477. [Google Scholar] [CrossRef]
  11. Ahmed, G.H.; Aziz, O.Q. Shear strength of joints in precast posttensioned segmental bridges during 1959–2019, Review and analysis. Structures 2019, 20, 527–542. [Google Scholar] [CrossRef]
  12. Li, G.P.; Yang, D.H.; Lei, Y. Combined shear and bending behavior of joints in precast concrete segmental beams with external tendons. J. Bridge Eng. 2013, 18, 1042–1052. [Google Scholar] [CrossRef]
  13. Yuan, A.; Dai, H.; Sun, D.; Cai, J. Behaviors of segmental concrete box beams with internal tendons and external tendons under bending. Eng. Struct. 2013, 48, 623–634. [Google Scholar] [CrossRef]
  14. Saibabu, S.; Srinivas, V.; Sasmal, S.; Lakshmanan, N.; Iyer, N.R. Performance evaluation of dry and epoxy jointed segmental prestressed box girders under monotonic and cyclic loading. Constr. Build. Mater. 2013, 38, 931–940. [Google Scholar] [CrossRef]
  15. Chai, S.; Guo, T.; Chen, Z.; Yang, J. Monitoring and simulation of long-term performance of precast concrete segmental box girders with dry joints. J. Bridge Eng. 2019, 24, 04019043. [Google Scholar] [CrossRef]
  16. Jiang, H.; Cao, Q.; Liu, A.; Wang, T.; Qiu, Y. Flexural behavior of precast concrete segmental beams with hybrid tendons and dry joints. Constr. Build. Mater. 2016, 110, 1–7. [Google Scholar] [CrossRef]
  17. Takebayashi, T.; Deeprasertwong, K.; Leung, Y.W. A full scale destructive test of precast concrete segmental box girder bridge with external tendons and dry joints. Proc. Inst. Civ. Eng. -Struct. Build. 1994, 104, 297–315. [Google Scholar] [CrossRef]
  18. Aparicio, A.C.; Ramos, G.; Casas, J.R. Testing of externally prestressed concrete beams. Eng. Struct. 2002, 24, 73–84. [Google Scholar] [CrossRef]
  19. Woodward, R.J. Collapse of a segmental post-tensioned concrete bridge. Transp. Res. Rec. 1989, 1211, 38–59. [Google Scholar]
  20. Afefy, H.M.; Abdel-Aziz, M.A.; Kassem, N.M.; Mahmoud, M.H. Improving flexural performance of post-tensioned pre-cast pre-stressed RC segmental T-beams. Structures 2020, 24, 304–316. [Google Scholar] [CrossRef]
  21. Voo, Y.L.; Foster, S.J.; Voo, C.C. Ultrahigh-performance concrete segmental bridge technology: Toward sustainable bridge construction. J. Bridge Eng. 2015, 20, B5014001. [Google Scholar] [CrossRef]
  22. Pan, R.; Cheng, L.; He, W.; Zhou, X.; Shen, X. Direct shear performance of UHPC Multi-Keyed epoxy joint. Structures 2022, 44, 1898–1909. [Google Scholar] [CrossRef]
  23. Ye, M.; Li, L.F.; Yoo, D.Y.; Li, H.H.; Shao, X.D.; Zhou, C. Mechanistic understanding of precast UHPC segmental beams with external tendons and epoxy joints subject to combined bending and shear. Eng. Struct. 2023, 280, 115698. [Google Scholar] [CrossRef]
  24. Zhang, Y.; Zhu, P.; Shi, J. Flexural behavior of precast UHPC beam with prestressed bolted hybrid joint. Eng. Struct. 2020, 206, 110100. [Google Scholar] [CrossRef]
  25. Ye, M.; Li, L.; Yoo, D.-Y.; Wang, L.; Li, H.; Shao, X. Shear behavior of precast ultrahigh-performance concrete (UHPC) segmental beams with external tendons and dry joints. Arch. Civ. Mech. Eng. 2023, 23, 143. [Google Scholar] [CrossRef]
  26. Le, T.D.; Pham, T.M.; Hao, H.; Hao, Y. Flexural behaviour of precast segmental concrete beams internally prestressed with unbonded CFRP tendons under four-point loading. Eng. Struct. 2018, 168, 371–383. [Google Scholar] [CrossRef]
  27. Le, T.D.; Pham, T.M.; Hao, H.; Yuan, C. Performance of precast segmental concrete beams posttensioned with carbon fiber-reinforced polymer (CFRP) tendons. Compos. Struct. 2019, 208, 56–69. [Google Scholar] [CrossRef]
  28. AASHTO. Guide Specifications for Design and Construction of Segmental Concrete Bridges; American Association of State Highway and Transportation Officials (AASHTO): Washington, DC, USA, 1999. [Google Scholar]
Figure 1. Section sizes of the test beams (unit: cm).
Buildings 14 02938 g001
Figure 2. Schematic diagrams of the reinforcement (unit: cm): (a) vertical view; (b) sectional view; (c) longitudinal reinforcement; (d) stirrups.
Buildings 14 02938 g002
Figure 3. Schematic diagrams of the test beams and joints (unit: cm): (a) beam PB1; (b) beam PB2; (c) beam PB3.
Buildings 14 02938 g003
Figure 4. Material characteristic tests: (a) compressive test of the concrete; (b) axial tensile test of the reinforcement and prestressing tendon.
Buildings 14 02938 g004
Figure 5. Loading diagrams (unit: cm): (a) loading layout; (b) distributions of bending moment and shear force.
Buildings 14 02938 g005
Figure 6. Test layout (unit: cm): (a) horizontal displacement meter layout diagram; (b) test set up.
Buildings 14 02938 g006
Figure 7. Layout of vertical displacement transducers (unit: cm).
Buildings 14 02938 g007
Figure 8. Layout of reinforcement strain measuring points (unit: cm): (a) longitudinal main rebars measuring points of beams PB1–PB3; (b) continuous rebars measuring points of PB3.
Buildings 14 02938 g008
Figure 9. Schematic diagrams of the test specimens and joints (unit: cm): (a) concrete key size and shape; (b) concrete key joint; (c) the embedded steel bars and reserved hole; (d) continuous rebars in the joint.
Buildings 14 02938 g009
Figure 10. Crack propagations before joint cracking: (a) pure bend section; (b) joint 2#; (c) joint 3#.
Buildings 14 02938 g010
Figure 11. Crack development as joint 2# cracked; (a) pure bend section; (b) joint 2#; (c) joint 3#.
Buildings 14 02938 g011
Figure 12. Crack development as joint 3# cracked: (a) pure bend section; (b) joint 2#; (c) joint 3#.
Buildings 14 02938 g012
Figure 13. Horizontal cracks at the joint.
Buildings 14 02938 g013
Figure 14. Joint failure modes.
Buildings 14 02938 g014
Figure 15. Crack patterns.
Buildings 14 02938 g015
Figure 16. Test specimen deflection development.
Buildings 14 02938 g016
Figure 17. The distributed joint widths along the beam height: (a) PB2-2#Joint; (b) PB2-3#Joint; (c) PB3-2#Joint; (d) PB3-3#Joint.
Buildings 14 02938 g017
Figure 18. Strain distributions in the rebars.
Buildings 14 02938 g018
Figure 19. Failure modes of specimens PB1–PB3.
Buildings 14 02938 g019
Figure 20. Load–displacement curves of beams PB1–PB3.
Buildings 14 02938 g020
Figure 21. Diagram for the flexural capacity of joints.
Buildings 14 02938 g021
Table 1. Specimen parameters.
SP IDStirrup Ratio/%Longitudinal Reinforcement Ratio/%Prestressing TendonStructure TypeJoint TypeNumber of Segments
PB10.7061.320Φ15.2 × 3Monolithic beamNo jointNo segment
PB20.7061.320Φ15.2 × 3Segmental beamTraditional joint
(No rebars at joint)
Five
PB30.7061.320Φ15.2 × 3Segmental beamContinuous rebars at jointFive
Table 2. The test strengths of the concrete.
Test SpecimenPB1PB2PB4
Test strength (MPa)454844
Table 3. Mechanical parameters of the epoxy glue.
Density
(g/cm3)
Compressive Strength
(MPa)
Elasticity Modulus
(GPa)
Shear Strength
(MPa)
Tensile Bending Strength
(MPa)
Percentage of Contraction
(%)
Adhesive Time
(min)
Distortion Temperature
(°C)
1.780.56.5305.20.160–10063
Table 4. Test values of the ordinary rebars and prestressed reinforcement.
Specification/mmØ6Ø8Ø10 Φ S 15.2 Ø12 (Continuous Rebars)
Yield strength (MPa)452.45446.03459.871661.64454.09
Ultimate strength (MPa)620.07618.90657.201842.00632.87
Elasticity modulus (MPa)2.00 × 1052.00 × 1052.00 × 1051.95 × 1052.00 × 105
Table 5. The effective prestresses of the prestressed reinforcement.
Test SpecimenPB1PB2PB4
Effective prestress (MPa)702728714
Table 6. Test results.
SpecimenCracking Load/kN
(Non-Joint Position)
Cracking Load
(2#Joint) (kN)
Cracking Load
(3#Joint) (kN)
Ultimate Load
Pu (kN)
P u ( P B 2 ) / P u ( P B 1 )
P u ( P B 3 ) / P u ( P B 1 )
PB185//320.921
PB2707075205.760.64
PB37090100271.980.85
P P B 3 P P B 2 P P B 2 029%33%32%/
Disclaimer/Publisher’s Note: The statements, opinions and data contained in all publications are solely those of the individual author(s) and contributor(s) and not of MDPI and/or the editor(s). MDPI and/or the editor(s) disclaim responsibility for any injury to people or property resulting from any ideas, methods, instructions or products referred to in the content.

