Article

Study of Semi-Adiabatic Temperature Rise Test of Mineral Admixture Concrete

1
School of Civil Engineering, Shandong University, Jinan 250061, China
2
Power China Municipal Construction Group Co., Ltd., Tianjin 300384, China
*
Author to whom correspondence should be addressed.
Buildings 2024, 14(9), 2941; https://doi.org/10.3390/buildings14092941
Submission received: 1 August 2024 / Revised: 5 September 2024 / Accepted: 6 September 2024 / Published: 17 September 2024

Abstract

:
The concrete used in the main structures of subway stations has a high degree of constraint. Consequently, temperature changes and shrinkage during construction frequently lead to significant constraint stress, which can result in structural cracking. Therefore, cement with low hydration heat is commonly used in engineering to reduce the temperature of concrete during its age. Aiming at the problem of hydration and heat release caused by concrete construction, based on the principles of concrete hydration heat release and a numerical analysis method, an optimized semi-adiabatic temperature rise test method has been introduced to investigate concrete temperature rise characteristics with different mineral admixtures. The following conclusions were obtained: The effect of reducing the heat of hydration is related to the content and material properties of different mineral admixtures, but not the type of mineral admixture to be incorporated. The temperature rise performance of four common mineral admixtures is as follows: ① total cooling capacity: limestone powder > slag, fly ash > metakaolin; ② early heat generation rate: metakaolin > slag > fly ash > limestone powder; ③ heat reduction rate in the middle and late periods: metakaolin > limestone powder > fly ash > slag.

1. Introduction

With China’s economy rapidly advancing, the construction of urban rail transit is developing at a high speed, and subway stations are also developing in larger, more efficient, and international directions [1]. As a vital component of urban rail construction process, the environmental pollution and safety hazards of subway stations that occur in the construction process require great attention. The concrete used in the main structures of subway stations has a high degree of constraint; thus, the temperature effect [2] and shrinkage effect [3] during construction frequently lead to significant constraint stress, which can result in structural cracking. It is commonly believed that early confining stress in concrete mainly arises from two sources: temperature stress due to temperature variations and shrinkage stress resulting from the concrete’s contraction [4]. The temperature confining stress is composed of the following two parts: one is the self-constraint stress which arises from the temperature difference between the inside and the surface of the structure, and the other is the external constraint stress caused by the constraints of the adjacent members and the base during cooling and shrinkage. In addition, most of the main structures of subway stations are located underground, and cracks in the station structures during the age period will cause water seepage in the structure because groundwater generally contains chloride ions. Such water seepage problems not only affect the durability and use of the station structure, but also further expand the structural cracking and reduce the structural strength [5]. Therefore, in view of the temperature cracking problem of the primary structure concrete of subway stations, it is particularly important to carry out relevant research to prevent seepage cracks in the structure of subway stations. According to relevant statistics [6,7,8], the temperature effect, shrinkage effect, and uneven settlement of concrete in the primary structure of subway station are the main causes of cracks in the concrete structure, and 80% of the cracks in the engineering structure are caused by this. Unlike the external load action mode with clear force transmission and clear analysis, the shrinkage and temperature action of concrete structures during the lifetime are uncertain and have various relationships with materials, structural forms, curing conditions, environmental factors, etc. In addition, various thermodynamic and mechanical properties of concrete constantly change with age [9].
As for the relevant theories of concrete cracking, the research methods are mainly divided into those based on fracture mechanics and those based on damage mechanics, which represent macro- and micro-perspectives, respectively. For fracture mechanics, Beyazit B et al. [10] used a non-local fracture simulation tool and adopted the overlapping lattice method to optimize the fracture model, enabling the method to accurately estimate the fracture propagation direction and width. Pasquale Gallo et al. [11] proposed a new brittle fracture formula based on extended strain energy density from macroscopic scale to atomic scale. The results showed that the cracking behavior of ideal brittle substances is independent of the research scale, and it was concluded that the fracture nature of materials is controlled by the fracture of atomic bonds. China’s concrete fracture mechanics started in the late 1970s, and the first academic conference on Rock Concrete Fracture and Strength was held in 1981, which promoted the development and research of concrete in the area of fracture mechanics [12]. Zhang Xiufang et al. [13] conducted relevant tests to study the connection between crack length and fracture energy characteristics of concrete. Xu Shi-shin et al. [14] proposed a new wedge-type compact tensile fracture test for reducing the size effect of the phenomenon that additional bending moments are easy to produce in the conventional wedge-splitting test of concrete.
For damage mechanics, Hillerborg et al. [15] in Sweden established a virtual crack model that can reflect the softening characteristics of concrete after crack failure. Bazant et al. [16] successively proposed fracture models with similar concepts as “virtual fracture”, such as “fracture zone”, “separation fracture”, and “distributed fracture”, all of which can be used for finite element calculation. Jun et al. [17] developed a constitutive model for concrete using damage theory from the viewpoint of composite materials and analyzed its damage and fracture behavior through numerical simulations. Wang Licheng et al. [18] regarded concrete as a three-phase complex composed of mortar, aggregate, and the interfacial transition zone (ITZ) between them, and theoretically analyzed its heat conduction characteristics from a microscopic perspective and made corresponding predictions. Jia Fujie [19] established a finite element analysis calculation model of semi-adiabatic temperature rise test for concrete temperature field calculation, and verified and modified the model in engineering, which provided a reliable basis for the semi-adiabatic temperature rise test of concrete. Yun H. D. et al. [20] studied the prediction method of heat of hydration of fly ash concrete. The authors proposed a new prediction model by combining adiabatic temperature rise test with regression analysis. The results show that the model can accurately predict the hydration heat release process of fly ash concrete under different mix ratios. Liang T. et al. [21] discussed the effect of hydration temperature rise inhibitors on concrete temperature rise and its mechanism. Through experimental research, the authors found that the addition of hydration temperature rise inhibitors can effectively reduce the hydration temperature rise of concrete and significantly slow down the temperature rise rate. Quan J. et al. [22] studied the adiabatic temperature rise characteristics of fly ash concrete with medium content and its modeling method. The authors experimentally measured the adiabatic temperature rise rate of concrete under different fly ash contents, and proposed a temperature rise rate prediction model based on experimental data.
However, in large-scale subway station projects, the difference in temperature between the interior and exterior of the concrete has become more pronounced, and the temperature effect of concrete is often the key factor affecting concrete cracking. In such projects, cement with low hydration heat is generally used to reduce the heat of hydration released by concrete during its age. Therefore, to solve the problem of concrete cracking caused by temperature effect in subway stations, this paper carries out the simulation of a semi-adiabatic temperature rise test based on the principle of concrete hydration and heat release and a numerical analysis method, and proposes an optimized semi-adiabatic temperature rise test method. Compared with the adiabatic temperature rise test method, this method is more in line with engineering practice, which is helpful to explore the temperature rise characteristics of concrete with different mineral admixtures and provides a reliable basis for the selection and mix ratio of concrete admixtures in practical engineering.

2. Semi-Adiabatic Temperature Rise Test and Finite Element Analysis Method of Concrete

2.1. Semi-Adiabatic Temperature Rise Test of Concrete

The adiabatic temperature rise test can accurately measure the adiabatic temperature rise characteristics of concrete, usually using an adiabatic temperature rise test chamber. However, because of relatively expensive adiabatic temperature rise test equipment, many institutions and construction units do not have conditions for testing, so a more convenient and inexpensive semi-adiabatic temperature rise test is increasingly being used. Jia Fujie [19] also verified the accuracy of semi-adiabatic temperature rise tests, indicating that it can reasonably predict the temperature rise characteristics of concrete. In simple terms, the semi-adiabatic temperature rise test monitors the temperature change of the concrete test block by creating a stable temperature change environment for the concrete in the mold, to deduce the adiabatic temperature rise characteristics of the concrete more accurately. The semi-adiabatic temperature rise test device generally consists of two parts: a concrete mold and an incubator. The insulation material is generally polyurethane, and the concrete mold is generally a cube mold. The incubator was composed of insulation material around a concrete mold, as shown in Figure 1.

2.2. Finite Element Analysis Method for Hydration Heat Release of Concrete

To optimize the semi-adiabatic temperature rise test and solve the adiabatic temperature rise model of concrete by the method of numerical simulation, it is essential to perform a finite element analysis of the concrete’s heat release process scientifically and reasonably. Therefore, it is necessary to master the principle of hydration and heat release of concrete clearly, choose an appropriate hydration and heat release model, and realize it in ABAQUS for finite element analysis. In this study, the HETVAL subroutine of ABAQUS was used for thermogenic analysis. The heat release temperature field analysis of concrete hydration is comparable to placing a heat source inside the concrete, where the heat output changes as it ages. Since ABAQUS lacks a direct function for simulating a time-varying heat source, the HETVAL subroutine must be used to implement this functionality and integrate it into the calculation of the concrete temperature field. Due to the complexity of the hydration heat release curve, engineering often relies on simplified empirical fitting expressions. In this research, the composite exponential model selected earlier is applied to determine the temperature field. To realize concrete hydration heat release in the HETVAL subroutine, the most important thing is to establish the heat release rate, represented by FLUX(1), for the heat source in the subroutine. This rate is determined from Equation (1), and the specific formula is as follows:
FLUX ( 1 ) = q v = a b Q 0 24 t 24 b 1 e a t 24 b
where qv is the heat release rate of the heat source, Q0 is the greatest level of heat release from concrete hydration, and a and b are the parameters of the exothermic model.
In the subroutine, the Fortran language is used to write the aforementioned formula, resulting in the assignment of the value qv to FLUX(1) and storing it in the state variable denoted as statev, facilitating its accessibility for post-processing purposes, such as output generation and viewing. In the heat transfer analysis model, the HETVAL subroutine acts as the heat source. This heat source changes with time, so the time t in qv is defined as the age of the concrete, and time (2) represents the total time at the end of the increment. According to the finite element analysis method of concrete hydration and heat release, the temperature field of different concrete structures in the age can be determined.

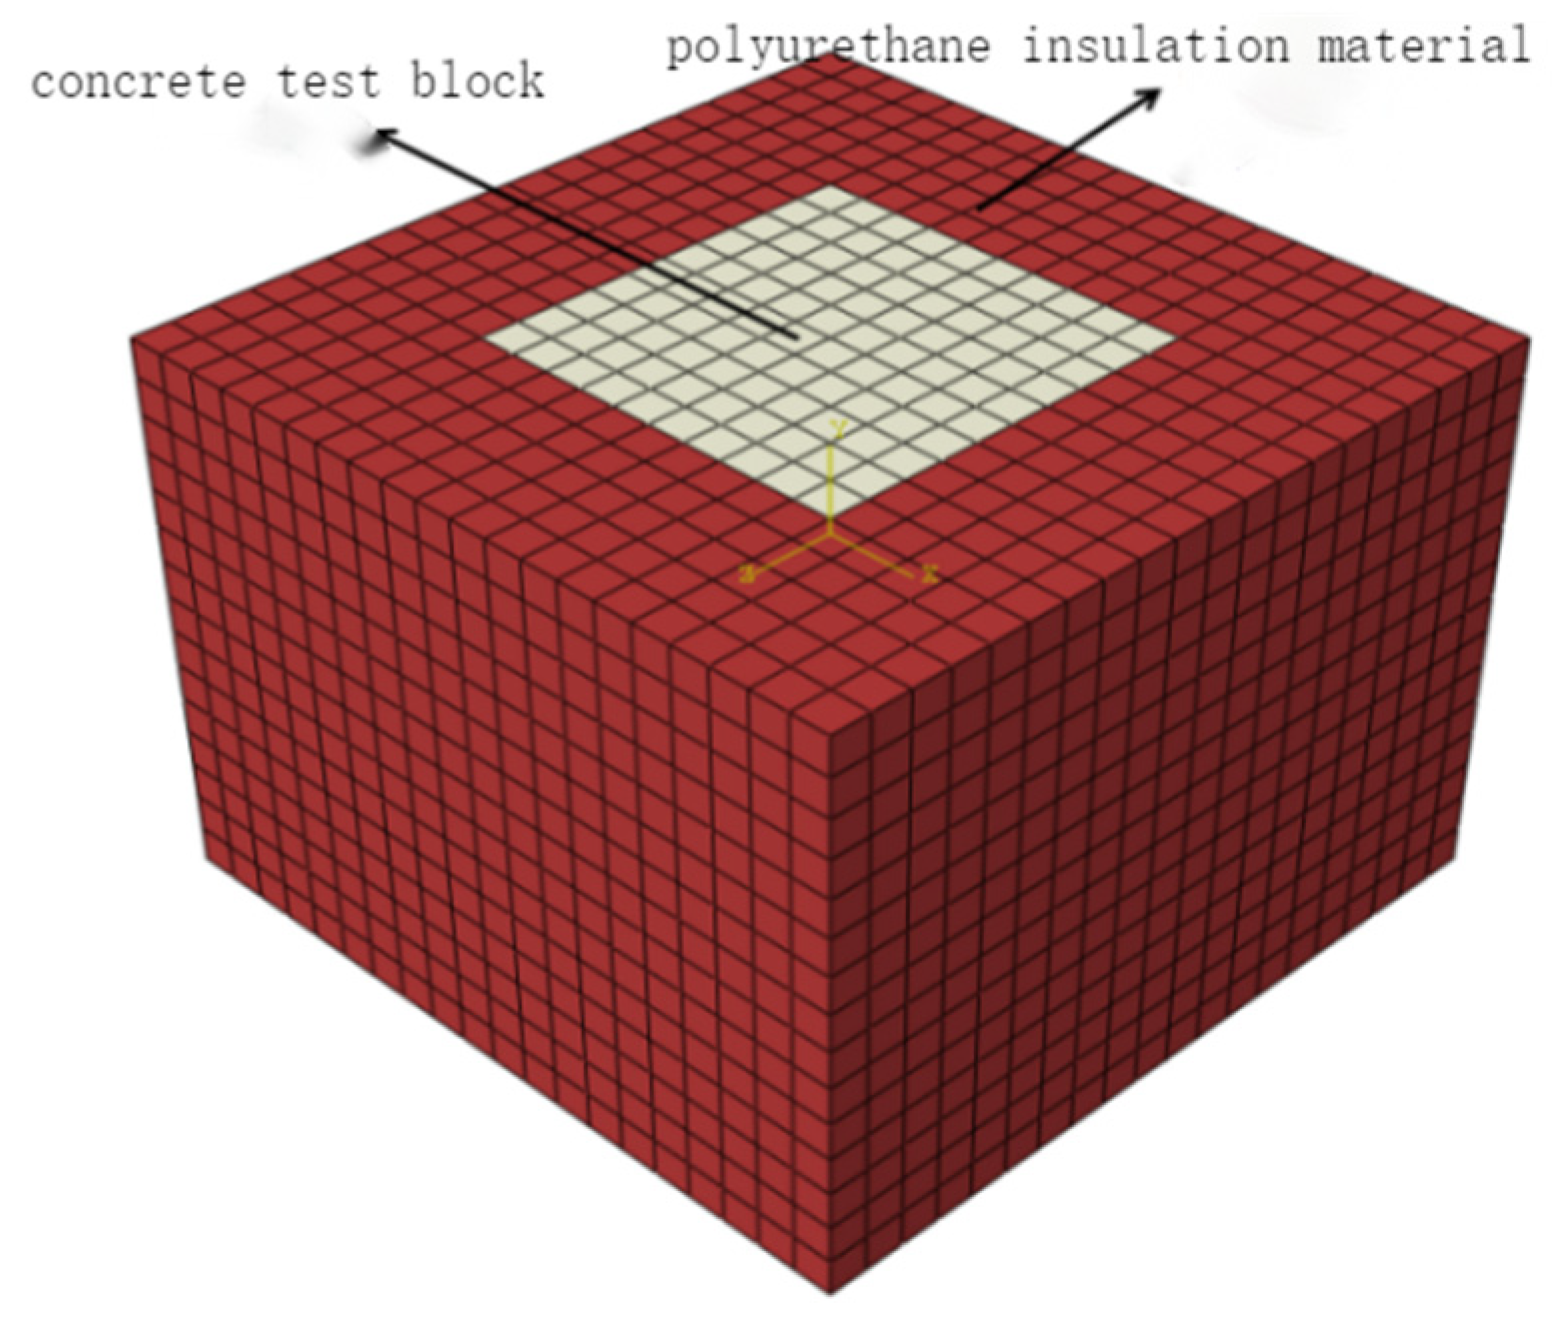
2.3. Finite Element Analysis Model of Semi-Adiabatic Temperature Rise Test Device

The model was built in ABAQUS according to the test device shown in Figure 1. A three-dimensional model of the test device is shown in Figure 2. The model consists of a concrete test block with polyurethane insulation that encloses it. The concrete test block is in the shape of a cube with a side length of 20 mm, and the concrete test block is completely wrapped by an incubator composed of insulation layer.
In ABAQUS, there are three modes of heat transfer in this experiment: (1) Heat conduction, which takes place within the concrete test block, inside the insulation material, and at the interface between the concrete and insulation, is modeled by specifying the thermal conductivity in the attribute module. (2) Heat convection happens at the surface of the insulation layer, where it contacts the external air, managed by specifying the heat dissipation coefficient in the contact module. (3) Thermal radiation takes place during the heat exchange between the entire semi-adiabatic temperature rise device and the surrounding environment. This is controlled by setting the emissivity parameter in the contact module, along with defining the values for absolute zero and the Stefan–Boltzmann constant. The Stefan–Boltzmann constant is used in the Stefan–Boltzmann law, which states that the total amount of energy radiated per unit area of a blackbody surface (called the radiance or energy flux density of the object) is proportional to the fourth power of the thermodynamic temperature of the blackbody itself, where the proportionality coefficient is this constant.
To optimize the test via numerical simulation, the heat release model parameters of ordinary Portland cement No. 525 with high hydrothermal generation were selected according to Table 1 (to better compare the differences in curves), and various properties of the polyurethane insulation material were initially selected. The insulation materials commonly used in projects are polystyrene foam board, extruded plastic board, polyurethane foam board, etc., and the thickness is generally between 5 and 10 cm. This is consistent with the parameter settings for the finite element simulation in this article. The calculation parameters for the test model are listed in Table 1.
Based on the above calculation parameters, the semi-adiabatic temperature increase test model was numerically simulated, and a temperature cloud image of the semi-adiabatic temperature increase test device was obtained, as shown in Figure 3. The figure shows that the temperature of the concrete test block under the action of the heat source is much higher than that of the insulation material, and the heat does not penetrate the insulation layer. This is because the heat inside the concrete after being wrapped by thermal insulation material can only be dissipated through the heat conduction between the insulation material and the thermal insulation material. At the same time, the heat absorption and insulation ability of the insulation material is strong, resulting in the temperature of the concrete test block being generally higher than that of the insulation material. The insulation material can provide a stable temperature change environment for the concrete test block.

3. Optimal Design of Semi-Adiabatic Temperature Rise Test Device

3.1. Influence of Insulation Layer Thickness on Semi-Adiabatic Temperature Rise Test

In the traditional semi-adiabatic temperature rise test, there is no clear regulation on the insulation layer thickness, so the use of thicker insulation materials during the test may result in material waste. Therefore, numerical simulation was used to model and analyze the test devices with different insulation thicknesses to select the best thickness of insulation material. As shown in Figure 4, the temperature cloud maps with and without an insulation layer (thickness 10 cm) at the age of 3 d, respectively, are shown. It is evident that without an insulation layer, the concrete test block loses heat rapidly and approaches room temperature by day 3. However, after adding an insulation layer, the temperature of the concrete test block dissipates slowly under the action of insulation layer. When the age is 3 d, the temperature of the concrete in the core area is 48 °C.
Furthermore, test setups with 20 cm and 30 cm thick insulation layers were numerically simulated. Figure 5 shows the core temperature curve of concrete under different thicknesses of the insulation layer, which shows that the core temperature significantly differs between concrete that has an insulation layer and concrete that does not. The highest temperature of the concrete without an insulation layer is only 35 °C, while the highest temperature after insulation layer is 56 °C. However, with the insulation layer thickness increasing from 10 cm to 30 cm, the temperature change trend of the test block is the same, and the size difference is not significant: thicker insulation layers do not always provide better effectiveness, and it will be more economical to choose a smaller thickness of the insulation layer based on a certain thickness. Therefore, a 10 cm thick insulation layer was selected for the semi-adiabatic temperature rise test in this study.

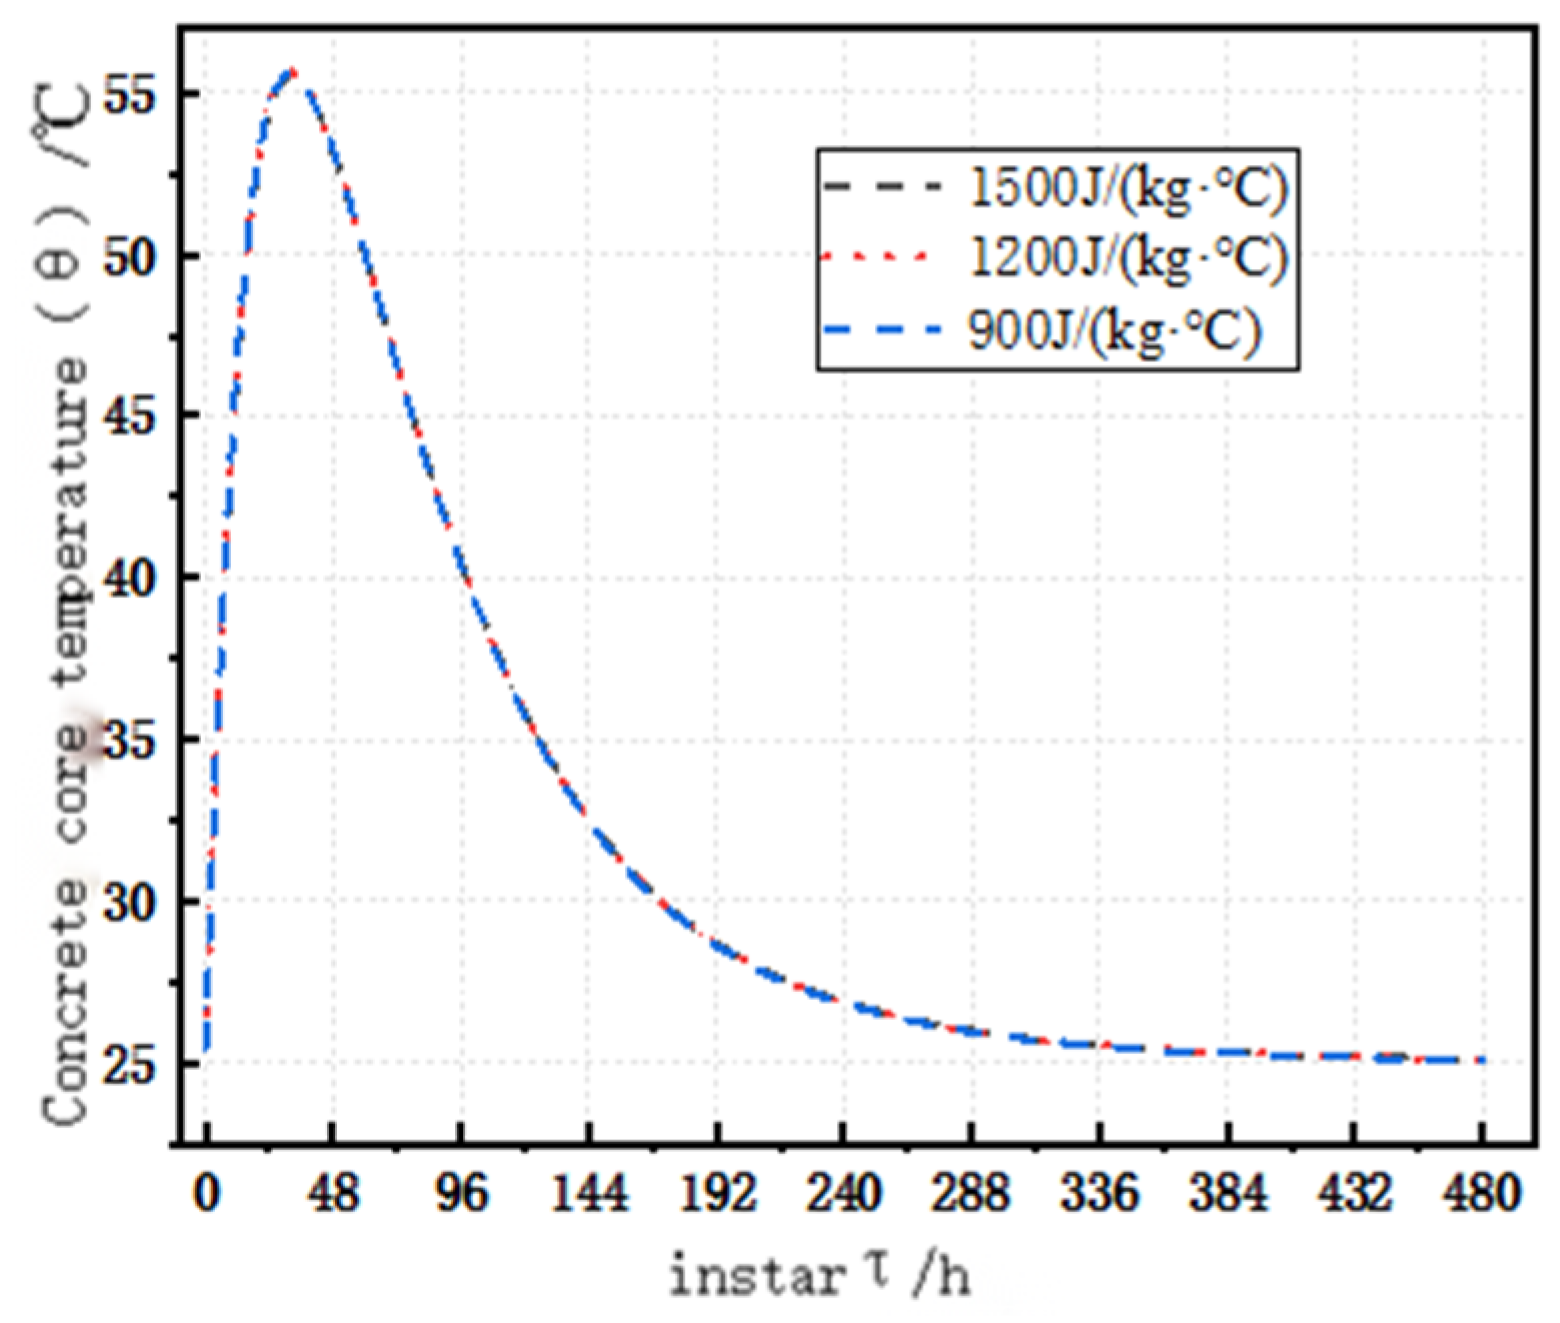
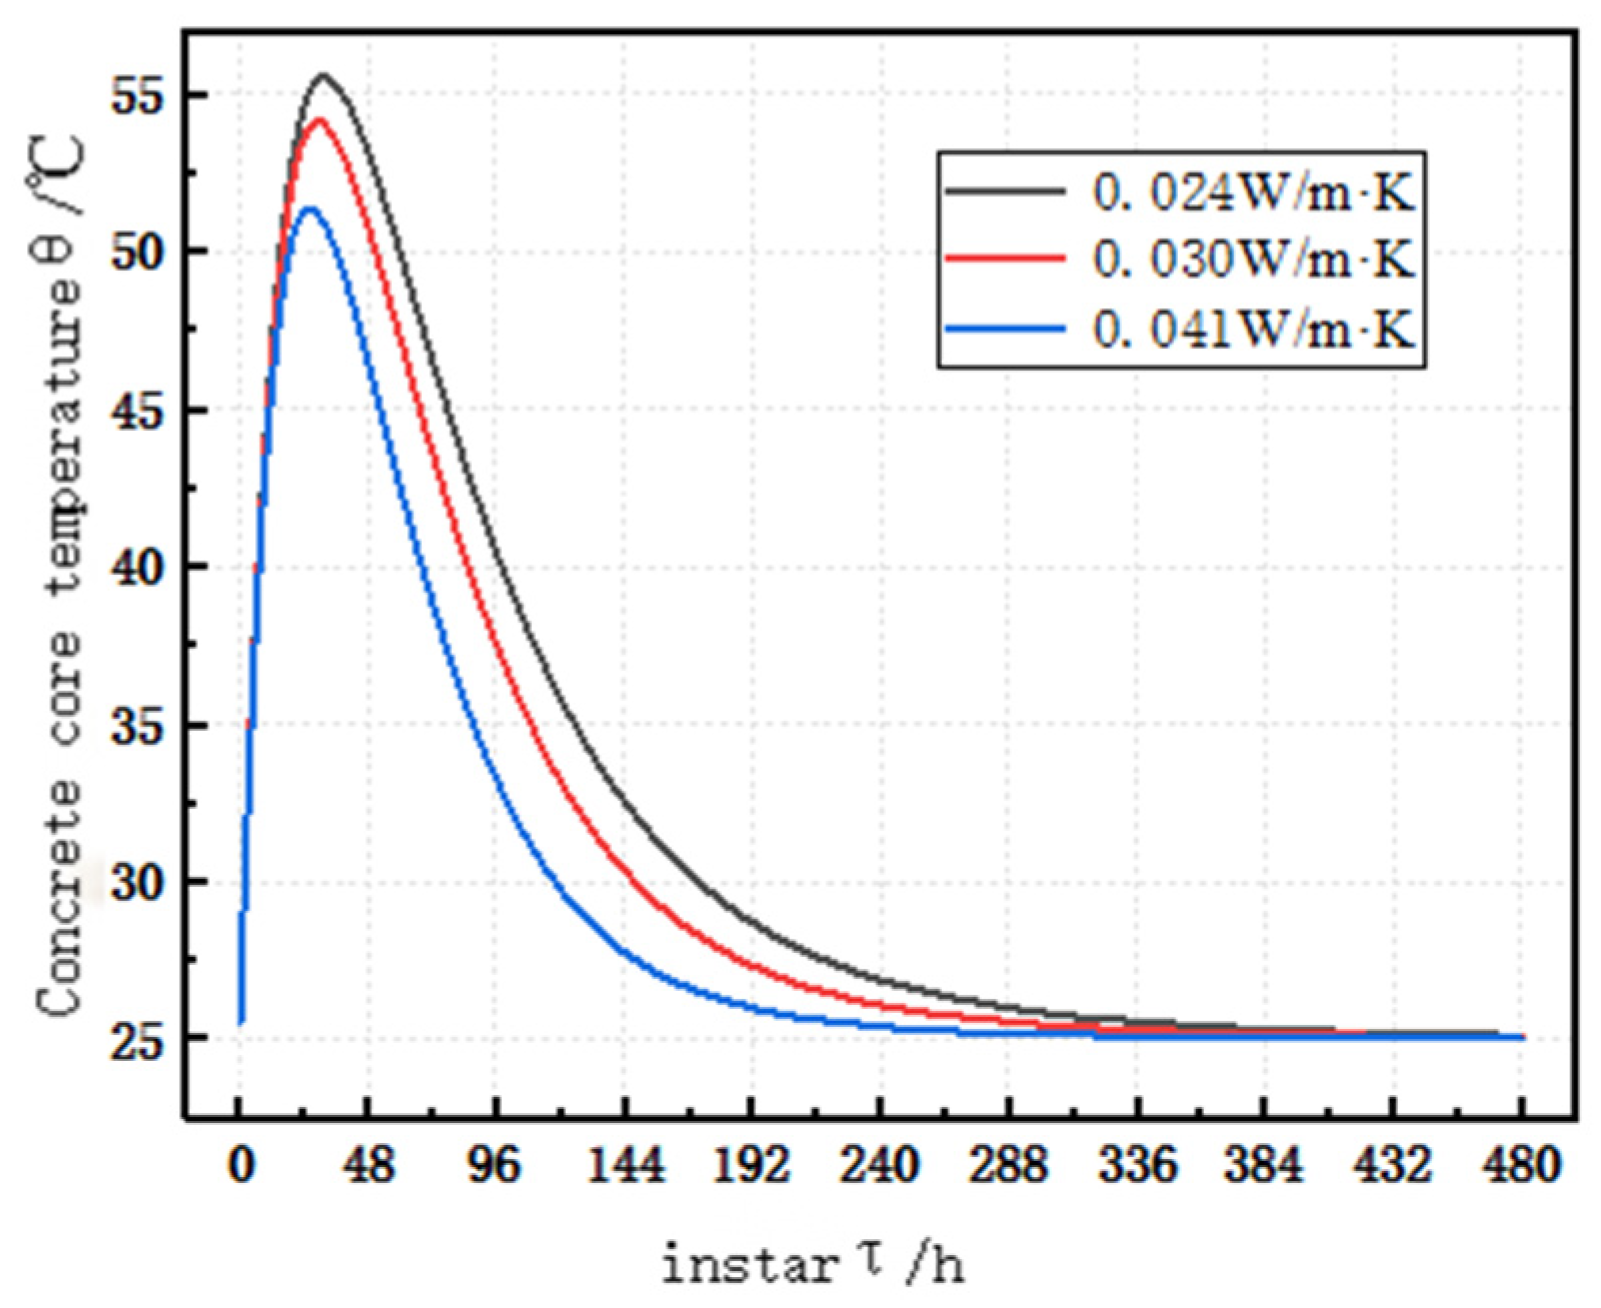
3.2. Influence of Thermodynamic Parameters of Thermal Insulation Materials on Semi-Adiabatic Temperature Rise Test

At present, there are many kinds of insulation materials that can be applied, and the more commonly used ones are rigid foam polyurethane insulation board, extruded polystyrene board, rubber and plastic insulation board, etc. These insulation materials have good insulation effects, but their thermal properties are different. To study the effect of the specific heat capacity of insulation material on the semi-adiabatic temperature rise test, the specific heat capacity of the insulation layer was set as 1500 J/(kg·°C), 1200 J/(kg·°C), and 900 J/(kg·°C), respectively, in the model, and finite element analysis was performed to obtain the core temperature curves of concrete test blocks under various specific heat capacities of insulation layers, as shown in Figure 6. The figure indicates that the insulation material’s specific heat capacity has minimal impact on the semi-adiabatic temperature rise test results, with the three temperature change curves almost coinciding. This is because in the semi-adiabatic temperature rise test device, the main function of the incubator is to insulate the entry of heat from the outside, and the specific heat capacity affects the heat storage capacity of the material, which minimally affects the temperature variation of the test block.
Similarly, to study the influence of thermal conductivity of thermal insulation materials on the semi-adiabatic temperature rise test, the thermal conductivity of thermal insulation layer was set as 0.024 W/m·K, 0.030 W/m·K, and 0.041 W/m·K, respectively, in the model, and finite element analysis was performed to obtain the core temperature curves of concrete test blocks under thermal insulation layers with different thermal conductivities, as shown in Figure 7. The figure shows that the thermal conductivities of various insulation materials are different, and the core temperature of the concrete test blocks is very different: the greater the thermal conductivity of the insulation material, the lower the core temperature of the concrete, and the shorter the time to reach the highest temperature. This is because the thermal conductivity of the thermal insulation material is directly related to its thermal insulation capacity; the smaller the thermal conductivity, the stronger the thermal insulation capacity, and the higher the temperature of the concrete test block, the more it can reflect the temperature change characteristics of concrete. It can be concluded that when the thermal conductivity of the insulation layer is less than 0.041 W/m·K, materials with good thermal insulation ability (low thermal conductivity) should be selected as much as possible.

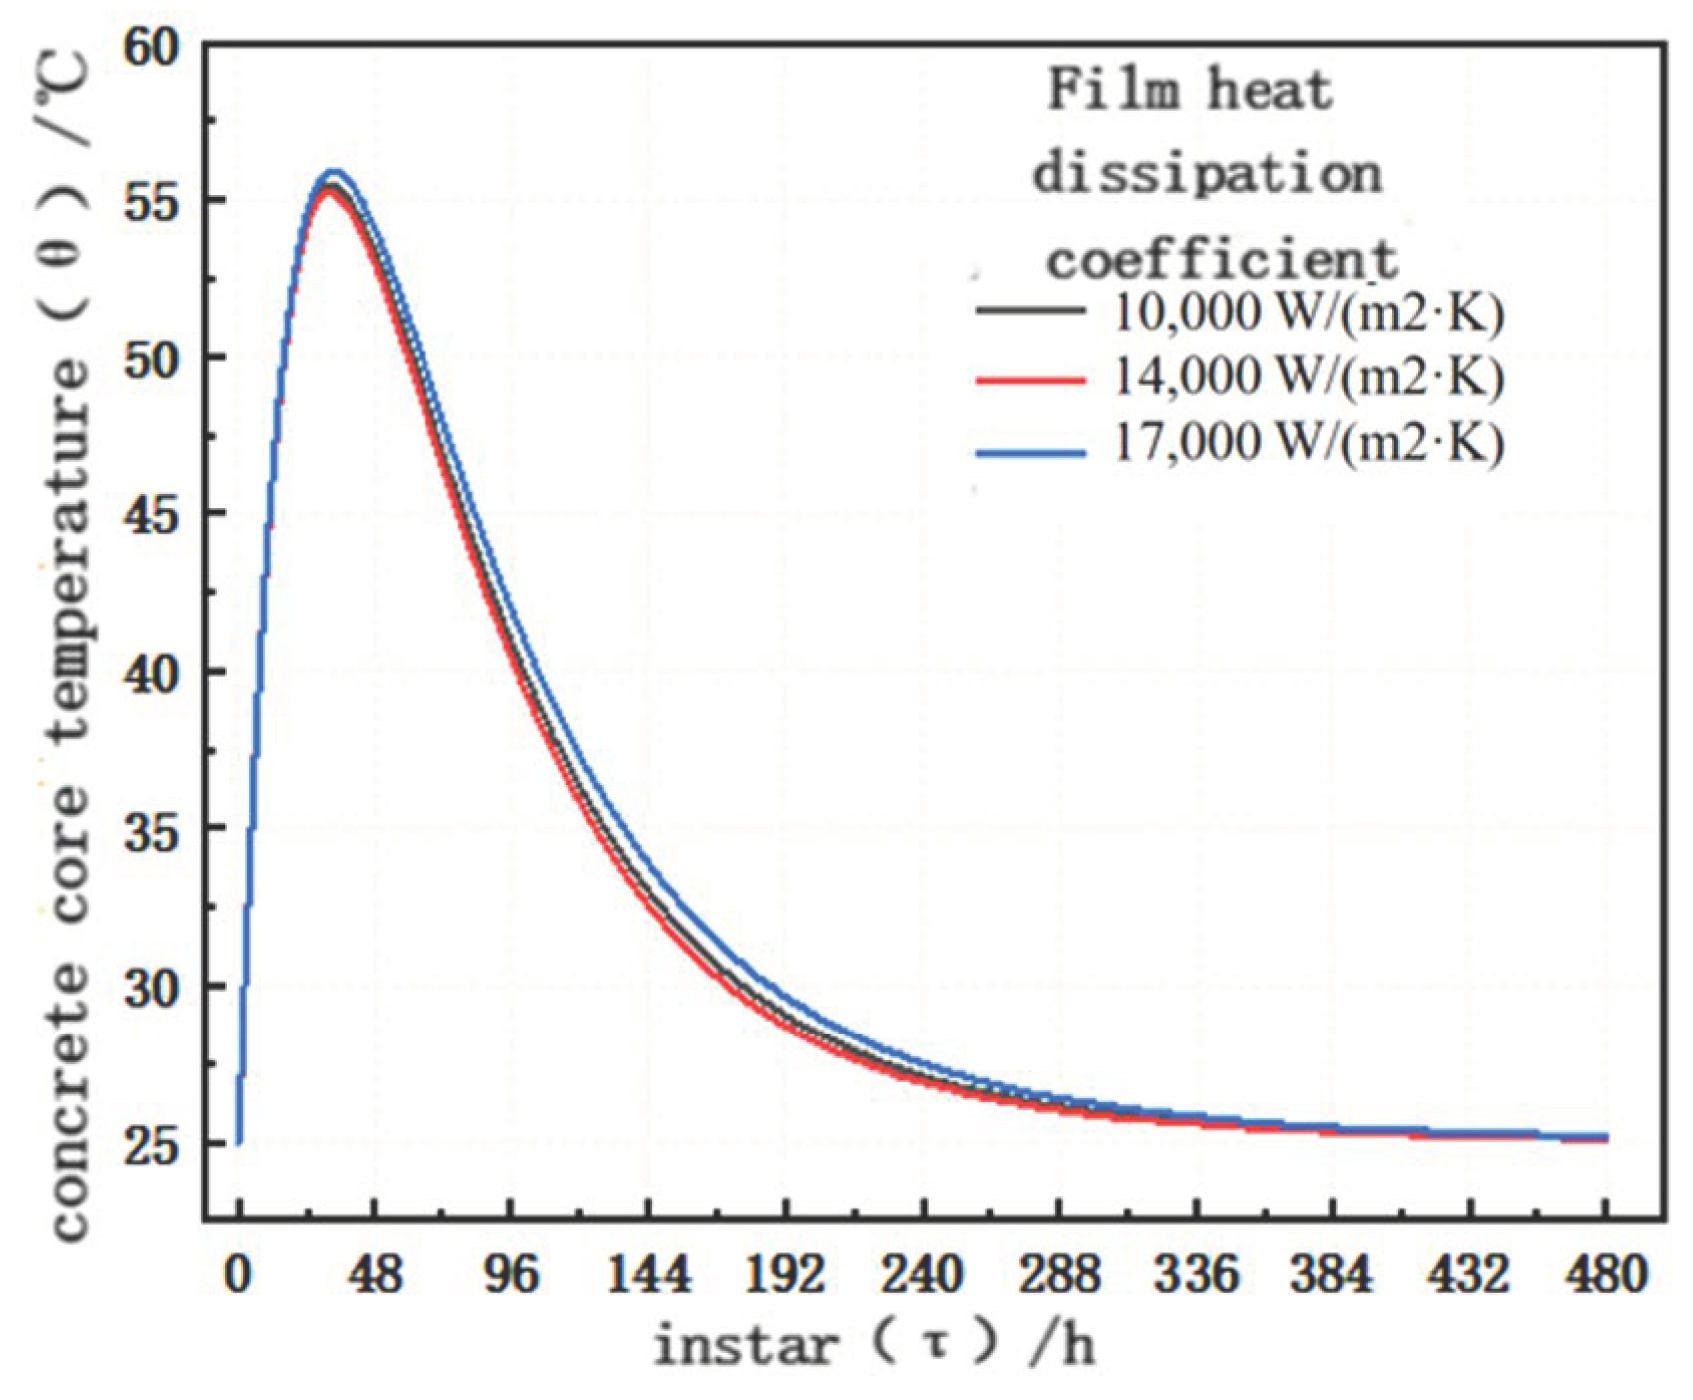
3.3. Influence of the External Environment of the Insulation Layer on the Semi-Adiabatic Temperature Rise Test

In the semi-adiabatic temperature rise test device, the surface of the insulation layer directly contacts the external environment, so the roughness of the surface of the insulation material and the ambient wind speed may affect the heat loss rate between the device and the outside world. To investigate how the external environment of the thermal insulation layer affects the semi-adiabatic temperature rise test, the heat loss coefficient of the film layer on the thermal insulation surface was set as 10,000 W/(m2·K), 14,000 W/(m2·K), and 17,000 W/(m2·K) in the finite element analysis to simulate the test under different external environments. Figure 8 shows the core temperature curves of concrete subjected to different external insulation conditions. When the heat dissipation coefficient of the coating is set between 10,000 and 17,000 W/(m2·K), the heat dissipation coefficient of various insulation layers has minimal impact on the core temperature of the concrete test block, with the three curves nearly overlapping. This is because the heat insulation effect of the insulation material makes the external environment have less influence on the temperature change of the internal concrete test block, the specific heat capacity of the insulation material is large, and the change in external heat dissipation conditions has less influence on it. Therefore, the semi-adiabatic temperature rise test in this study did not carry out additional treatment on the surface of the insulation material, and the test site was arranged in the general concrete test site.
In summary, the optimal design of the semi-adiabatic temperature rise test in this study is as follows: the test object is set as a concrete cube with a side length of 20 cm, a cube incubator is used to completely wrap the internal concrete test block, the insulation material is selected as a polyurethane insulation board with a thickness of 10 cm, the surface of the incubator is not treated, and the test is carried out on a conventional concrete test ground.

4. Semi-Adiabatic Temperature Rise Test Scheme and Data Analysis

In practical engineering, the most common anti-crack and anti-seepage measures are to use cement with low hydration heat to reduce the temperature of concrete. The main purpose of incorporating mineral admixtures into concrete is to reduce the heat of hydration generated during the construction of bulk concrete, thereby reducing the problem of structural cracking. At the same time, combined with the actual situation of the project, a variety of prevention and control measures are comprehensively used in the three stages of construction design, structural maintenance, and structural forming, so as to realize the complementary advantages of multiple measures, which can reduce the occurrence of concrete cracks in the subway station with the greatest benefit, ensure the safety and quality of the structure, and reduce the construction cost. In recent years, with the continuous research on low-hydration thermal mineral admixtures, increasingly more mineral admixtures have been applied in mass concrete, among which the more common ones are fly ash, slag, limestone powder, metakaolin, etc. [24,25,26], which can not only reduce the hydration heat of concrete, but also improve various other properties of concrete. In this study, an optimized semi-adiabatic temperature rise test was carried out on several mineral admixture concretes, and the test data were processed and analyzed to summarize the temperature variation performance of different mineral admixture concretes. The models of hydration and heat release of concrete with different mineral admixtures were obtained using the finite element analysis method. The materials with the best temperature drop effect were obtained.

4.1. Semi-Adiabatic Temperature Rise Test Scheme

4.1.1. Test Device

According to the above numerical simulation optimization design of the semi-adiabatic temperature rise test, the semi-adiabatic test device mainly included two parts: a concrete mold and an incubator. The temperature in the incubator was kept at room temperature. The external concrete mold box was a cube with a side length of 31 cm, and it was composed of 10 cm thick polyurethane composite insulation board. The internal concrete mold box was a cube with a side length of 21 cm, composed of 1 cm thick polypropylene material sheet, and the internal space of the box was 20 cm × 20 cm × 20 cm. In this test, an embedded temperature sensor with an accuracy of ±0.25 °C was installed at the core of the concrete test block to measure the core temperature of the concrete test block. An automatic comprehensive testing system was employed to continuously monitor the temperature changes in the concrete, with measurements taken every 20 min, allowing for automatic storage of temperature data from the concrete test block. The test device and monitoring instrument are shown in Figure 9.

4.1.2. Mix Ratio of Concrete Test Block

In mass concrete projects, mineral admixtures typically replace 20–70% of the cement [27]. Therefore, this test replaced 40% of the cement with different mineral admixtures to analyze their impact on the temperature rise properties of concrete. The standard C40 concrete mix ratio was used for the test block. Fly ash is a commonly used mineral admixture in engineering to lower the heat of hydration [28]. Therefore, this test used fly ash, and the other three materials (slag, limestone powder, metakaolin) were arranged and combined to divide the concrete test blocks into double-doped, triple-doped, and four-doped mineral admixtures, and semi-adiabatic temperature rise tests were conducted. The materials were labeled as follows: F (fly ash), S (slag), L (limestone powder), and K (metakaolin)—the numbers after the letters represent the percentage of the replaced cement. For example, F20S20L0K0 indicates the concrete test block mixed with 20% fly ash and 20% slag, and the specific combination of other test blocks is shown in Table 2.

4.1.3. Test Process

The semi-adiabatic temperature rise test was divided into the following six steps. (1) Assembly of the customized polyurethane insulation board insulation box and polypropylene concrete mold. (2) The test materials were accurately measured according to the mix ratios of the different concrete test blocks and were fully mixed according to the test standards. (3) The mixed concrete was added to a polypropylene concrete mold and fully vibrated. (4) A temperature sensor was embedded in the core of the concrete test block at its reserved position. (5) The concrete test block was placed together with the mold in the preset incubator and sealed. (6) The real-time monitoring system was accessed to extract temperature data every 20 min, monitor the concrete test block for about seven days, and finally obtain the semi-adiabatic temperature rise curve of the concrete test block during the age. Part of the test site pictures are shown in Figure 10.

4.2. Analysis of Test Data

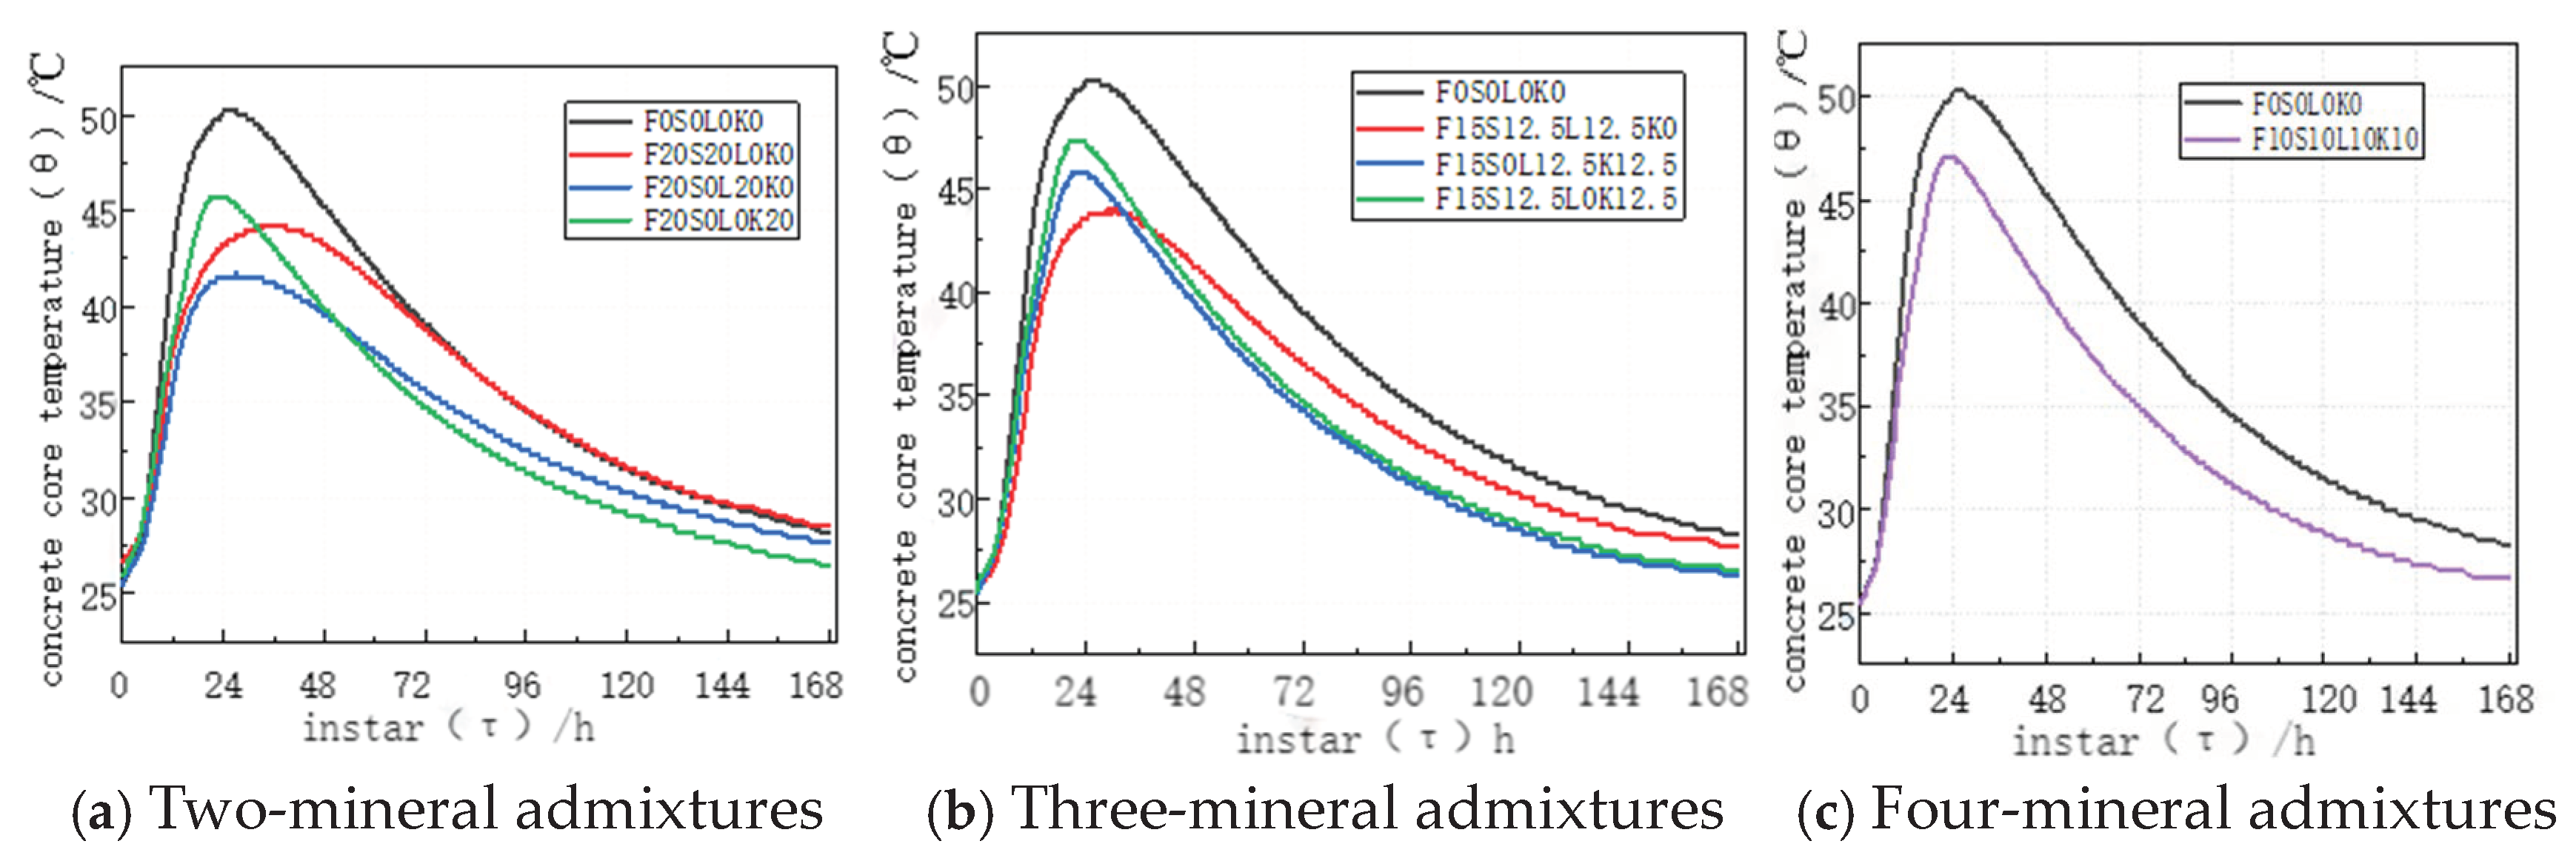
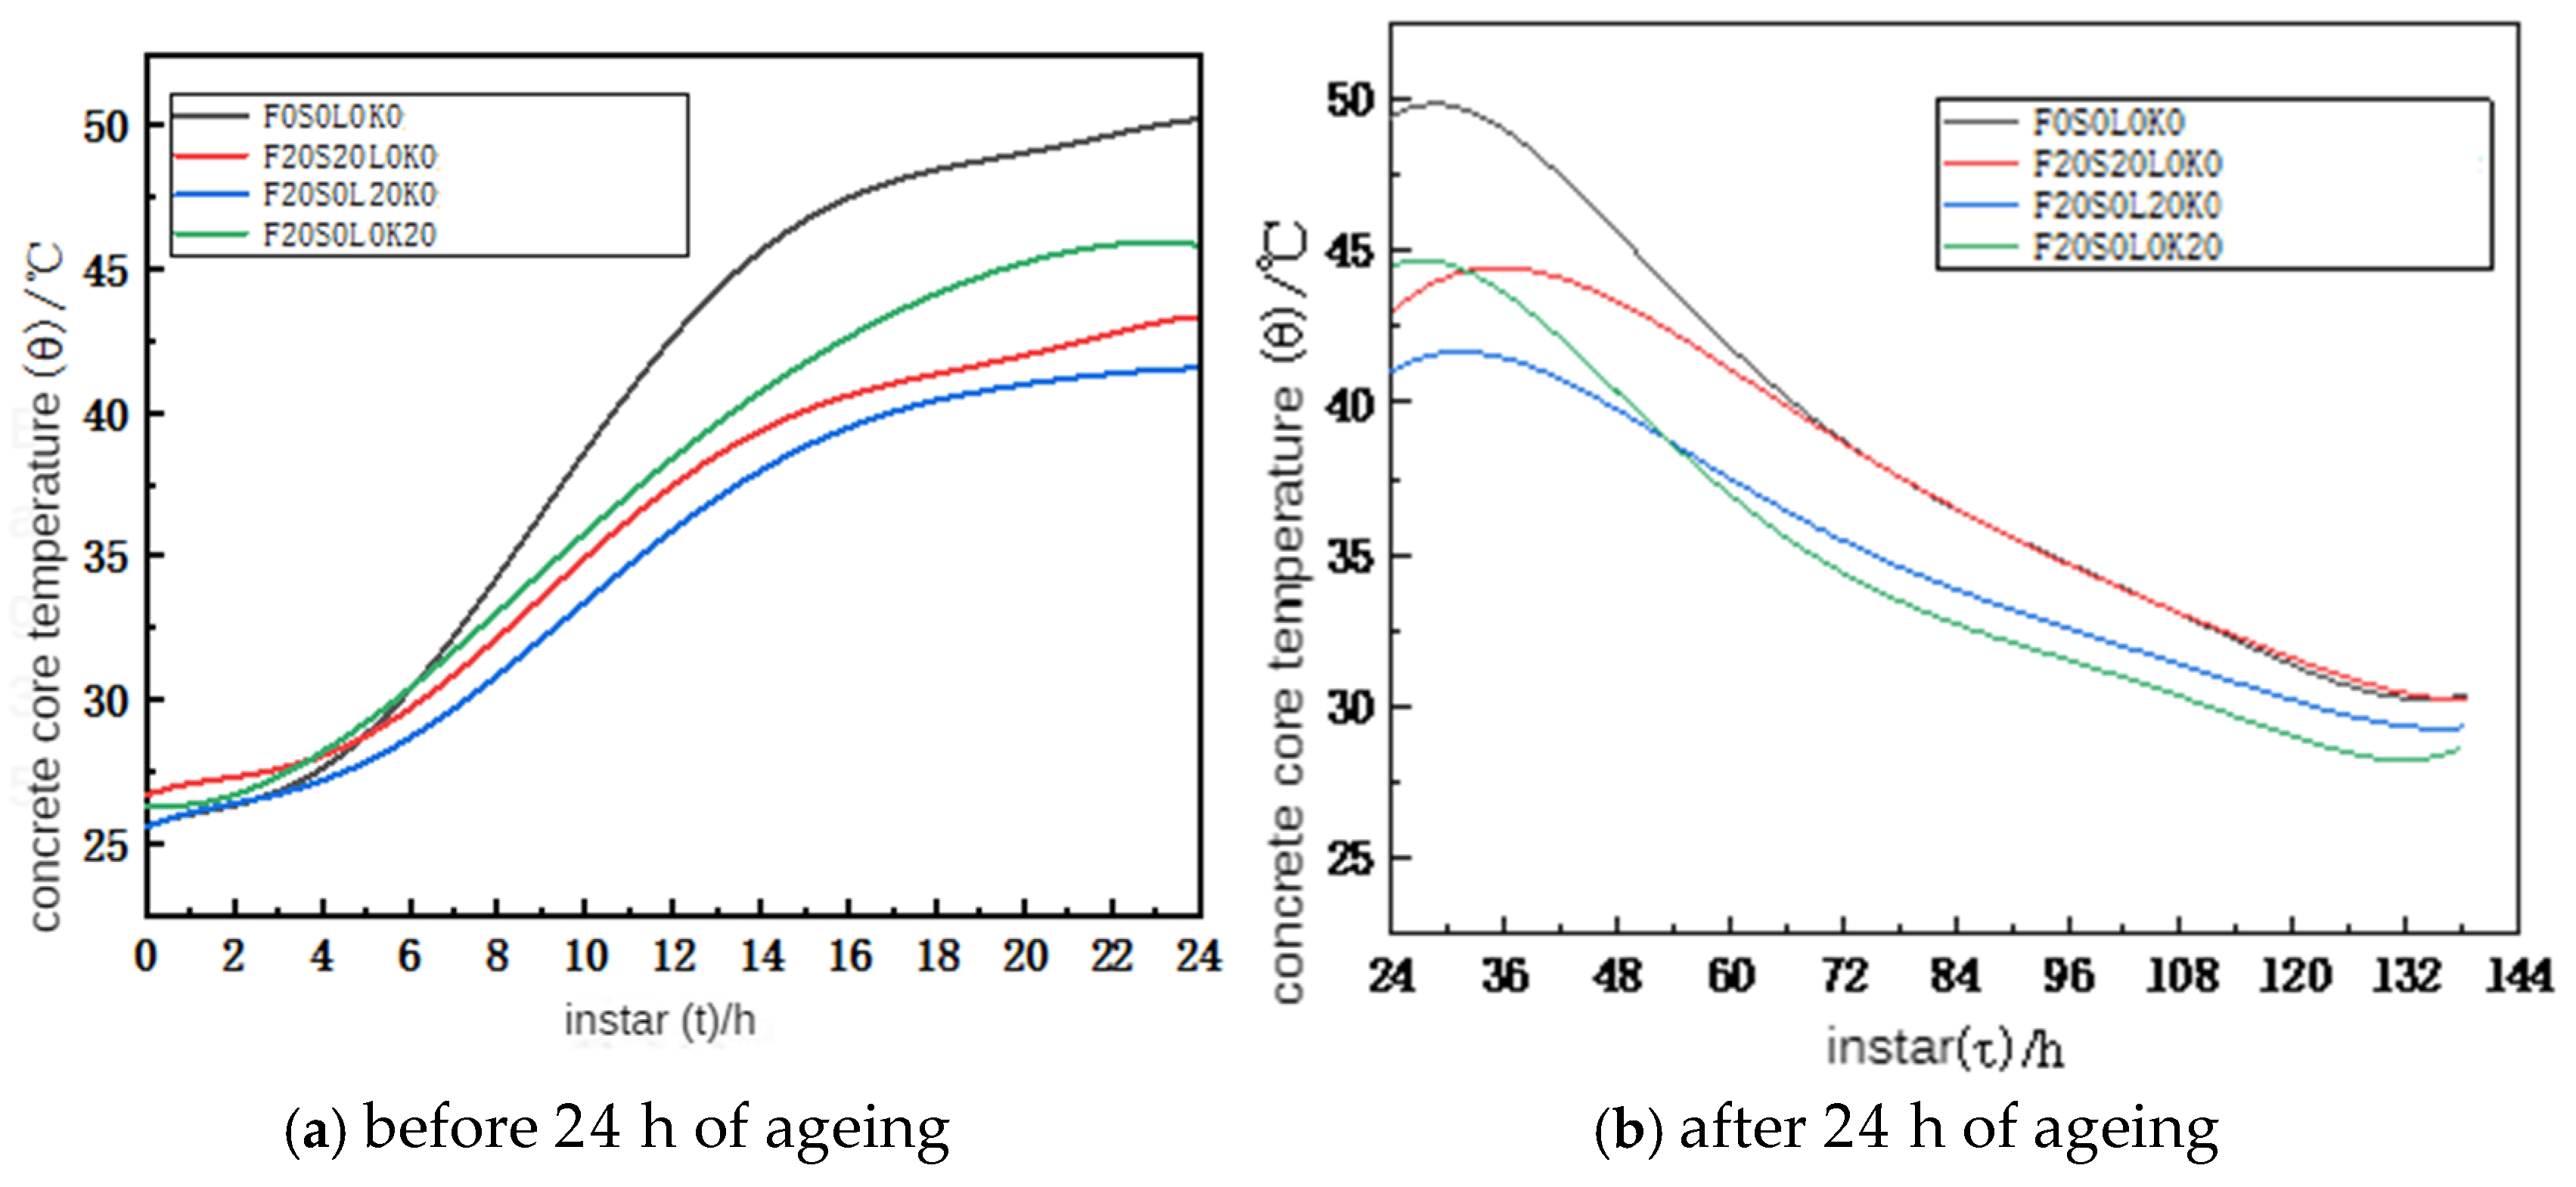
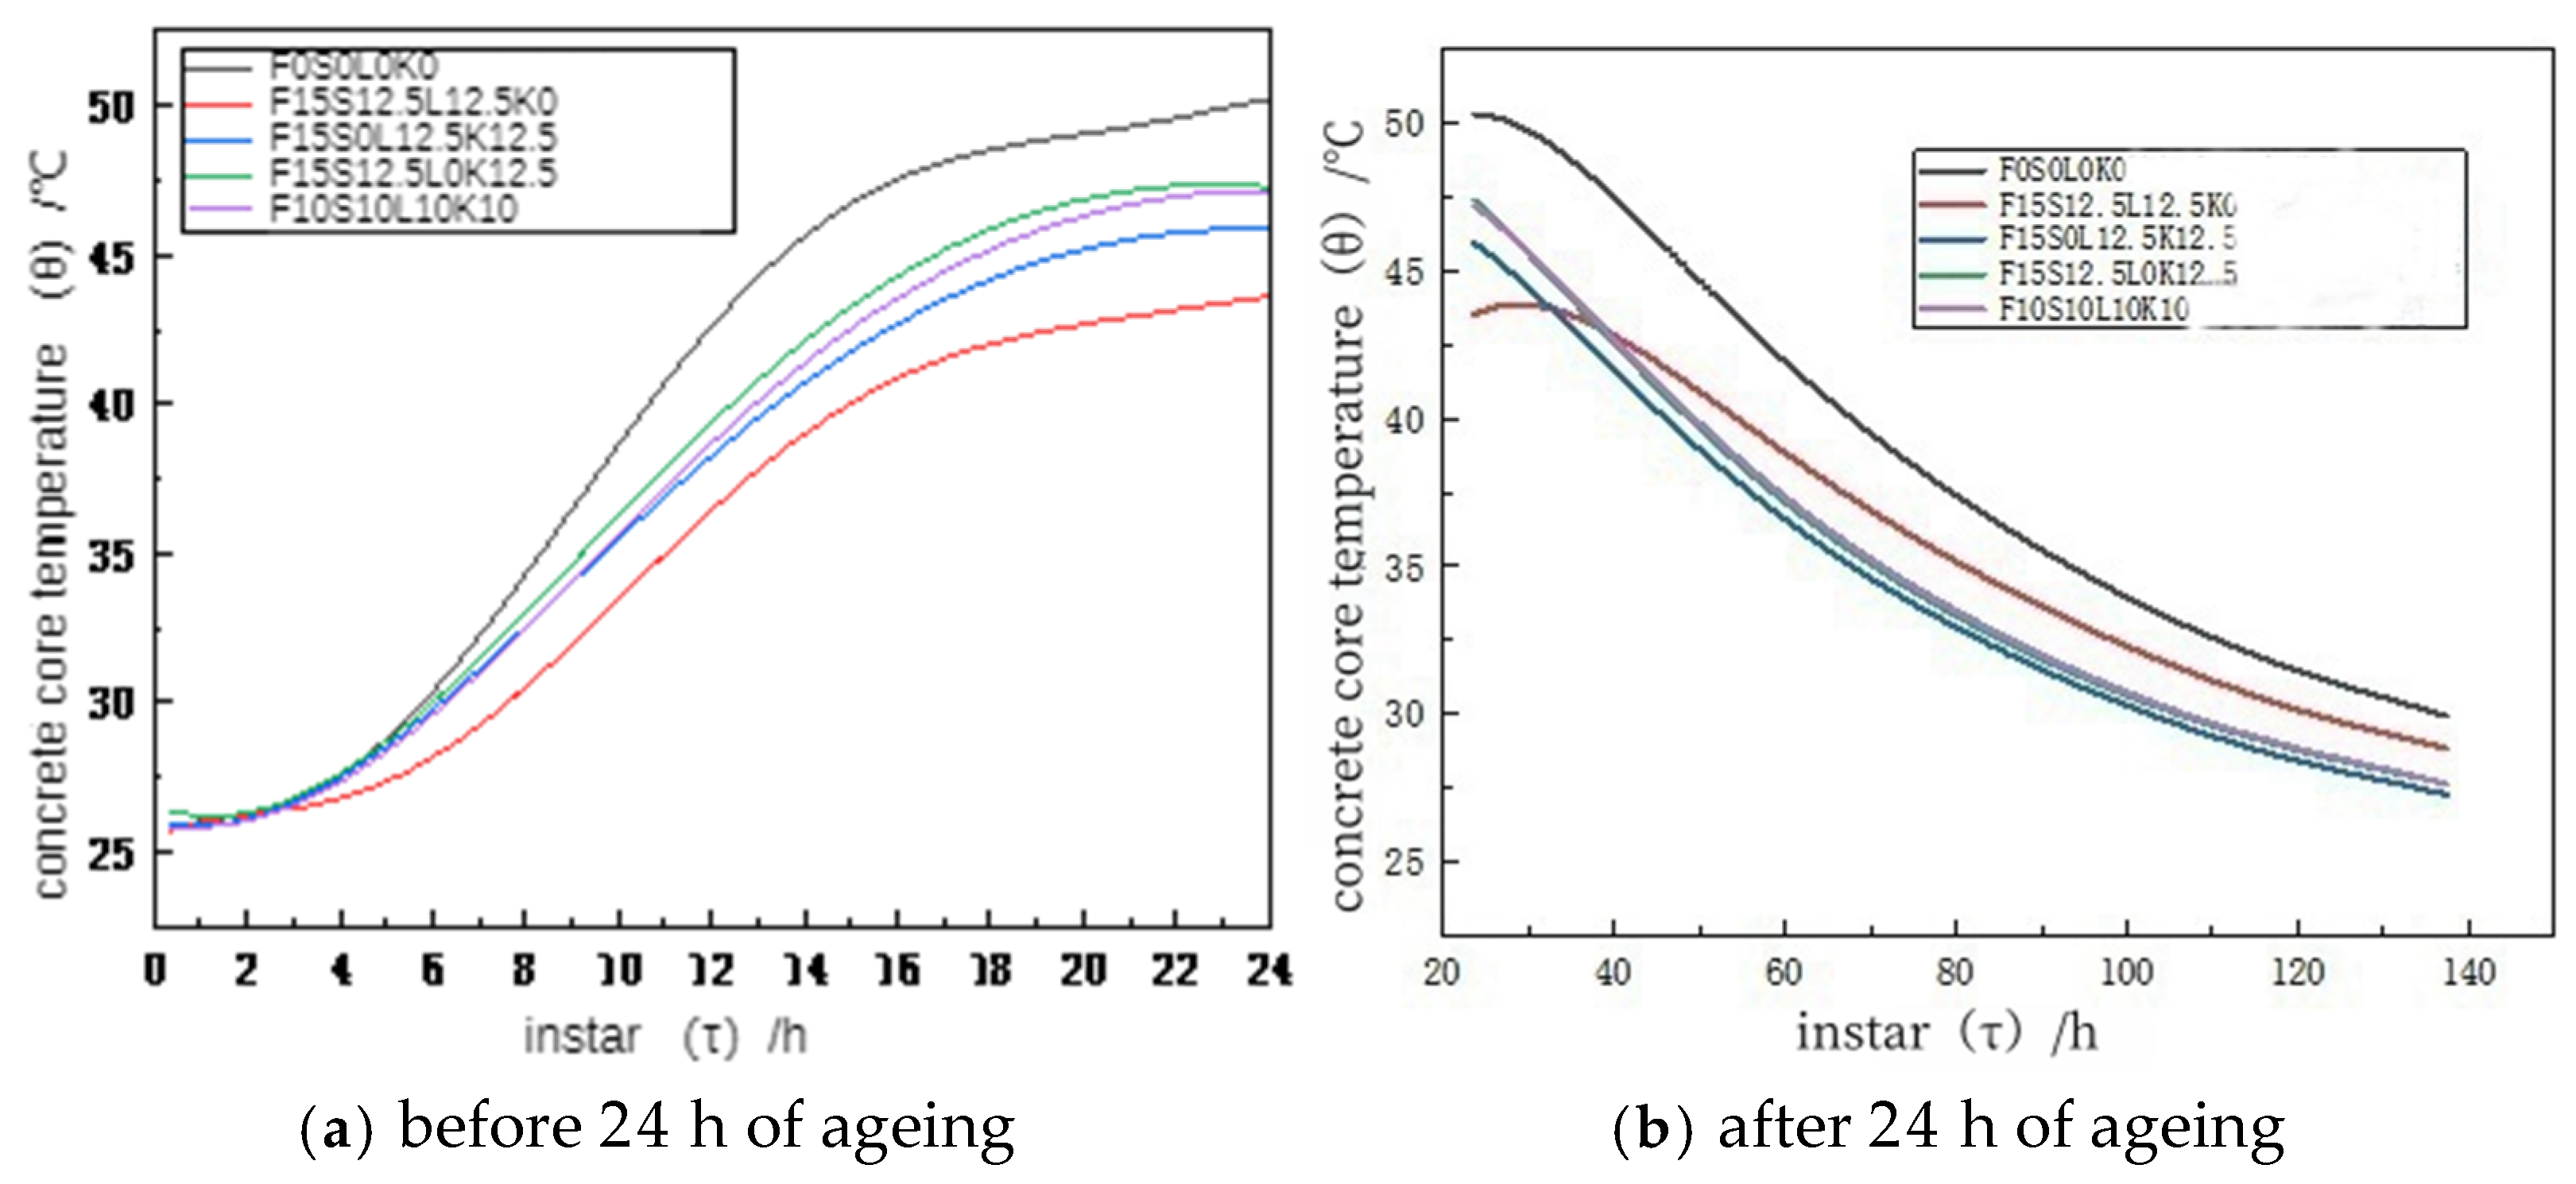
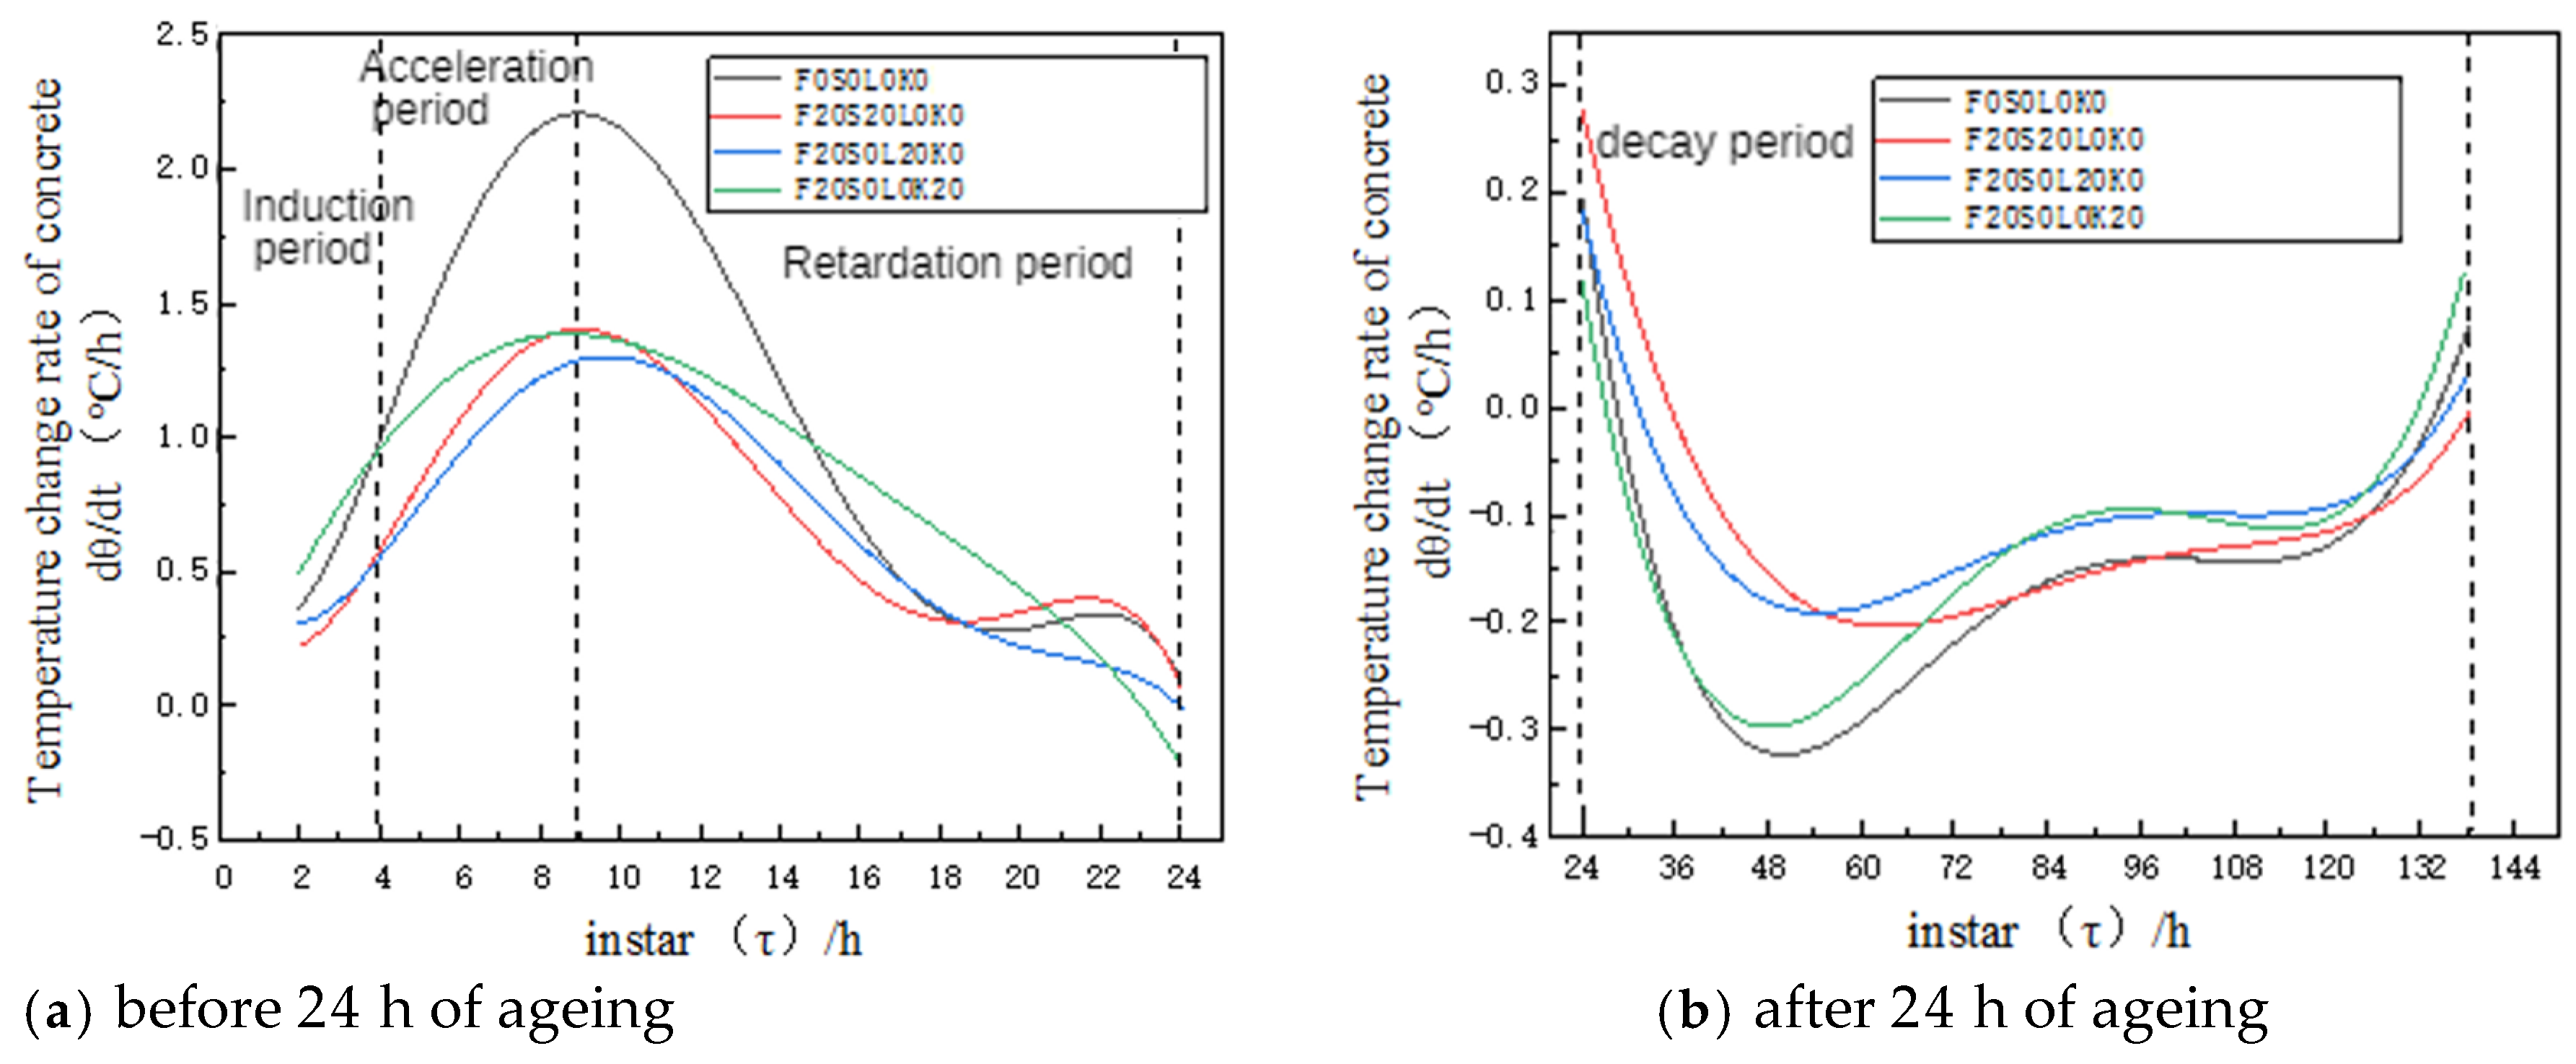
4.2.1. Temperature Change Data Analysis

After processing the test data, the rate of temperature rise curve of the concrete test block mixed with two types of mineral admixtures and a typical concrete test specimen was obtained, as shown in Figure 11. The following can be seen from Figure 11a: (1) after adding two types of mineral admixtures, the maximum temperature of the concrete core is significantly reduced, which suggests that various combinations of two mineral admixtures can effectively lower the temperature of concrete as it ages. (2) Different double-doped mineral admixture combinations impact the temperature of concrete in distinct ways, in which F20S0L20K0 has the slowest temperature rise in the early stage and reaches the highest temperature of 41.75 °C, but the temperature drop is slower in the cooling stage. In the early stage, the temperature rise of F20S20L0K0 responds more rapidly, and the highest temperature is 44.75 °C, but the temperature drop is the slowest in the cooling stage. The temperature rise of F20S0L0K20 is the fastest in the early stage, and the highest temperature reached is 46.25 °C, but the temperature drop is the fastest in the cooling stage. The concrete test block with double fly ash and limestone powder exhibits the best cooling effect. Figure 11b illustrates that incorporating three mineral admixtures can also help lower the temperature of concrete during its age. The temperature rise of F15S12.5L12.5K0 is slow in the early stage, the maximum temperature is 44 °C, and the temperature drop is slow in the cooling stage. The temperature of F15S0L12.5K12.5 increased rapidly in the early stage, the highest temperature reached was 46 °C, and the temperature decreased rapidly in the cooling stage. The temperature curve of F15S12.5L0K12.5 is like that of F15S0L12.5K12.5. The temperature of F15S12.5L12.5K12.5 is higher than that of F15S0L12.5K12.5. The temperature of F15S12.5L12.5K12.5 is higher than that of F15S0L12.5K12.5.
In summary, the cooling effect of the concrete with three kinds of three-doped mineral admixtures is worse than that of the concrete with three kinds of double-doped mineral admixtures, and F15S12.5L12.5K0 exhibits the best cooling effect. Figure 11c shows that four-doped mineral admixtures also have a certain effect on reducing the temperature of concrete. The maximum temperature that F10S10L10K10 can achieve is 44.75 °C, and its effect is between that of double-doped and triple-doped mineral admixtures. This shows that the content and performance of different mineral admixtures affect the temperature change of concrete, which has little relationship with the type of mineral admixtures.

4.2.2. Temperature Fitting Curve Analysis

Fitting analysis of the temperature curves obtained from these experiments was performed. In this study, polynomial fitting was used to fit the warming and cooling sections of the temperature curve, so that the R2 of the fitting curve reached 0.99. To ensure the fitting degree of the fitting curve, as shown in Figure 12, the temperature fitting curve of concrete mixed with two types of mineral admixtures was quite different, but its heating stage was mainly around 24 h. In the heating stage, F0S0L0K0 had the fastest temperature rise and the highest temperature, the concrete test block mixed with limestone powder had the slowest temperature rise and the lowest temperature reach, and the concrete test block mixed with slag and metakaolin was in the middle. In the cooling section, F0S0L0K0 had the fastest cooling rate, the concrete test block mixed with metakaolin had the second highest cooling rate, and the concrete test block mixed with slag and limestone powder had the slowest cooling rate, which shows that the performance of limestone powder was the best and that of metakaolin was the worst for reducing the heat of hydration and the speed of the hydration reaction.
Similarly, the rate of temperature increase curves of the concrete test block with three and four mineral admixtures were fitted, as shown in Figure 13. The temperature-fitting curves of concrete mixed with more than three types of mineral admixtures are not significantly different from those mixed with two types of mineral admixtures. In contrast, the quantity and variation trend of these temperature fitting curves are similar, which indicates that the temperature rise performance of the concrete test specimens tends to be the same when the types of mineral admixtures are increased. The temperature fitting curve with the best temperature control effect was F15S12.5L12.5K0, which further indicates that the cooling performance of limestone powder and slag is better than that of metakaolin.
For the cement hydration reaction, the temperature change rate usually goes through five periods: initial, induction, acceleration, deceleration, and decay [29]. To further analyze the temperature variation characteristics of the multi-doped mineral admixture concrete, the temperature fitting curve equation above was applied to obtain the rate of temperature increase curve of the double-doped mineral admixture concrete test block, as shown in Figure 14. The temperature change of concrete has obviously experienced the induction period, acceleration period, deceleration period and decay period, which is consistent with Jia Fujie’s conclusion [19], and the initial period cannot be reflected in the figure because it is in the process of concrete preparation. The rate of temperature increase for F0S0L0K0 in the acceleration period is much higher than that of other mineral admixture concrete, with a maximum temperature rise rate of 2.2 °C/h. However, the rate of temperature increase for F0S0L0K0 in the deceleration period decreases rapidly and is generally lower than that of other concrete in the decay period. This indicates that ordinary Portland cement has a large heat release and a severe hydration reaction, and adding mineral admixtures helps to reduce the amount of hydration heat released and the rate of the hydration reaction, which contributes to better control over the temperature of concrete. Among them, F20S20L0K0 and F20S0L20K0 have the smallest temperature change rate and the smallest temperature change range, and the maximum temperature rise rate is 1.25 °C/h. Therefore, to reduce the temperature of mass concrete, slag and limestone powder, two mineral admixtures, are preferred to be used with fly ash.
Similarly, the rate of temperature increase curve of the concrete test block with more than three mineral admixtures was obtained by derivation, as shown in Figure 15. Compared with the curve of F0S0L0K0, the temperature rise rate curves of several multi-mineral admixture concrete test blocks show little difference, among which the temperature rise rate of F15S12.5L12.5K0 is small, and the change range is small, which is the same as the above conclusion. Therefore, in the concrete mixed with more than three kinds of mineral admixture, the temperature rise rate of F15S12.5L12.5K0 is small. Therefore, the three mineral admixtures, namely, fly ash, limestone powder, and slag, are preferred.
In summary, F20S0L20K0 exhibits the best performance in reducing the temperature of concrete. To better compare and analyze the temperature rise performance of concrete with different mineral admixtures, it was analyzed from the following three dimensions: (1) the highest temperature that the concrete test block can reach; (2) the age when the concrete test block reaches the highest temperature; (3) the temperature of the concrete test block at the age of 5 d. These three can reflect the total cooling capacity, preheating rate, and mid–late cooling rate of the concrete, respectively.
As shown in Table 3, F20S0L20K0 had the lowest maximum temperature and maximum temperature rise rate. Compared with the other test blocks, limestone powder was added to F20S0L20K0, indicating that limestone powder had the most obvious cooling effect and the smallest total heat release. F20S0L0K20 takes the shortest time to reach the highest temperature. Compared to the other test blocks, metakaolin was added to F20S0L0K20, which indicated that metakaolin had the fastest heat generation rate in the early stage. F20S20L0K0 had the highest temperature on the fifth day. Compared with other test blocks, slag was added to F20S20L0K0, indicating that the hydration reaction rate of slag was slower, and the heat generation rate was the fastest in the later stage. Through an analogy analysis of the temperature variation data of three and four blends, the following rules can be obtained: (1) total cooling capacity: limestone powder > fly ash > slag > metakaolin; (2) early heat generation rate: metakaolin > slag > fly ash > limestone powder; (3) heat reduction rate in the middle and late period: metakaolin > limestone powder > fly ash > slag. Replacing the same proportion of cement does not have a better effect than adding more types of mineral admixtures, and the most suitable ingredients must be found according to the characteristics of each mineral admixture.

5. Conclusions

To study the temperature rise characteristics of concrete with different mineral admixtures, a semi-adiabatic temperature rise test was conducted based on the principles of concrete hydration and heat release. A numerical simulation method and an optimized semi-adiabatic temperature rise test method were proposed. The following conclusions are drawn from the analysis of the test data:
(1)
The optimal design of the semi-adiabatic temperature rise test was as follows. The test object was set as a concrete cube block with a side length of 20 cm, a cube incubator was used to completely wrap the internal concrete test block, the optimal thickness of insulation material is 10 cm, the insulation material is a polyurethane insulation material with good thermal insulation ability (low thermal conductivity), the change in external heat dissipation conditions has less influence on temperate rise so the surface of the incubator was not treated, and the test was carried out on a conventional concrete test ground.
(2)
For mineral admixture concrete, the reduction in hydration heat is independent on the type of mineral admixture added. The decrease in hydration heat is related to the content of different mineral admixtures and material properties. An optimized semi-adiabatic temperature rise test was conducted, and the temperature rise performance of four common mineral admixtures was compared as follows: (1) total cooling capacity: limestone powder > slag, fly ash > metakaolin; (2) early heat generation rate: metakaolin > slag > fly ash > limestone powder; (3) heat reduction rate in the middle and late periods: metakaolin > limestone powder > fly ash > slag. Instead of the same content of cement, the concrete mixed with fly ash and limestone powder exhibited the best cooling performance, and it is recommended for use in engineering.
In addition, there are still shortcomings in this paper, which can be improved from the following two points:
(1)
Many experiments are needed to fit the data of the semi-adiabatic temperature rise curve to provide reliable theoretical support for the project.
(2)
Try to make a simple semi-adiabatic temperature rise test model that can simulate the on-site structure to avoid the influence of size on the test.
(3)
The finite element simulation part of this paper is to provide reasonable parameter settings for the experimental part, since the content of the simulation part is not consistent with the experimental part. This is an inadequacy of this article. Therefore, the experimental content can be simulated for further validation.

Author Contributions

Conceptualization, K.W.; methodology, K.W., C.W. and J.X.; software, Z.L. and J.X.; validation, Z.L. and T.Y.; formal analysis, K.W. and Z.L.; investigation, Z.D., C.W. and T.Y.; resources, C.W. and T.Y.; data curation, Z.D. and J.X.; writing—original draft preparation, K.W.; writing—review and editing, Z.L.; visualization, K.W.; supervision, K.W.; project administration, K.W.; funding acquisition, K.W. All authors have read and agreed to the published version of the manuscript.

Funding

This research received no external funding.

Data Availability Statement

Some or all data, models, or codes that support the findings of this study are available from the corresponding author upon reasonable request.

Conflicts of Interest

Authors C.W. and T.Y. were employed by the company Power China Municipal Construction Group Co., Ltd. The remaining authors declare that the research was conducted in the absence of any commercial or financial relationships that could be construed as a potential conflict of interest.

References

  1. Action Plan for Green Urban rail Development of Urban rail Transit in China. China Metros 2022, 8, 20–35.
  2. Yuan, G.L.; Huang, F.Y.; Shen, H.; Gao, P.F. Research on temperature field and thermal stress of hydration heat in massive concrete of construction period. Concrete 2005, 2, 86–88. [Google Scholar]
  3. Qin, W.Z. Shrinkage and cracking of concrete and its evaluation and prevention. Concrete 2001, 7, 3–7. [Google Scholar]
  4. Lin, Z.H.; Qin, W.Z.; Zhang, S.H.; Zhang, T. Development of stress and evaluation of cracking sensitivity of concrete at early ages. Archite Technol. 2003, 1, 34–35. [Google Scholar]
  5. Zhou, Z.P. Water leakage control in the main structure of a metro station. Mod. Tunn. Technol. 2012, 49, 164–170. [Google Scholar]
  6. Duan, Z.; Ma, C.L.; Wang, L.L. Causes and prevention of cracks in cast-in-place mass concrete. Concrete 2003, 5, 48–58. [Google Scholar]
  7. Zhu, Y.T.; Zhan, S.L. Study on reasons and prevention measures of cracking in concrete tructure. J. Mater. Sci. Eng. 2003, 5, 727–730. [Google Scholar]
  8. Jiang, X.P.; Wang, S.L.; Duan, S.X.; Sun, Y. Mechanism analysis of temperature crack appear of super mass concrete and new methods of anti-rack. Concrete 2007, 12, 98–102. [Google Scholar]
  9. Chen, Y.; Zhang, Q.S. Review of study on cement concrete cracking resistance at early ages. J. Build. Mater. 2004, 4, 411–417. [Google Scholar]
  10. Aydin, B.B.; Tuncay, K.; Binici, B. Overlapping Lattice Modeling for concrete fracture simulations using sequentially linear analysis. Struct. Concrete 2018, 19, 568–581. [Google Scholar] [CrossRef]
  11. Gallo, P.; Hagiwara, Y.; Shimada, T.; Kitamura, T. Strain energy density approach for brittle fracture from nano to macroscale and breakdown of continuum theory. Theor. Appl. Fract. Mech. 2019, 103, 102300. [Google Scholar] [CrossRef]
  12. Xu, S.L.; Dong, L.X.; Wang, B.W.; Li, Q.H. Development of concrete fracture mechanics in China during the past three decades. J. Hydraul. Eng. 2014, 45, 1–9. [Google Scholar]
  13. Zhang, X.F.; Xu, S.L. Determination of fracture energy of three-point bending concrete beamusing relationship between load and crack-mouth opening displacemen. J. Hydraul. Eng. 2008, 6, 714–719. [Google Scholar]
  14. Xu, S.L.; Bu, D.; Zhang, X.F. A study on double-K fracture parameters by using wedge-splitting test on compact tension specimens of various sizes. China Civ. Eng. J. 2008, 2, 70–76. [Google Scholar]
  15. Guo, Q.J. Experimental Investigation on the Influence of Coarse Aggregate for Mortar Crack Propagation. Master’s Thesis, Dalian University of Technology, Liaoning, China, 2016. [Google Scholar]
  16. Bažant, Z.P.; Oh, B.H. Crack band theory for fracture of concrete. Mater. Constr. 1983, 16, 155–177. [Google Scholar] [CrossRef]
  17. Zhan, J.; Liu, Q.; Wang, L. Conditions promoting crack growth in concrete along the aggregate/matrix interface or into the aggregate. J. Tsinghua Univ. Sci. Technol. 2004, 3, 387–390. [Google Scholar]
  18. Wang, L.C.; Wu, D.; Bao, J.W.; Liang, Y.J. Mesoscale numerical simulation analysis for temperature distribution in early-age concrete. J. Hydraul. Eng. 2017, 48, 1015–1022. [Google Scholar]
  19. Jia, F.J. Research on Concrete Half-Adiabatic Test and Finite Element Calculation. Master’s Thesis, China Building Materials Academy, Beijing, China, 2011. [Google Scholar]
  20. Yun, H.D.; Park, W.S.; Jang, Y.I.; Kim, S.W. Prediction of the heat of hydration of fly ash concrete by adiabatic temperature rise test and regression analysis. Mag. Concrete Res. 2024, in press. [CrossRef]
  21. Liang, T.; Luo, P.; Mao, Z.; Huang, X.; Deng, M.; Tang, M. Effect of Hydration Temperature Rise Inhibitor on the Temperature Rise of Concrete and Its Mechanism. Materials 2023, 16, 2992. [Google Scholar] [CrossRef]
  22. Quan, J.J.; Fu, S.J.; Yang, R.D.; Chen, J.; Zhang, K.F. Characteristics and Modelling of Adiabatic Temperature Rise Rate of Medium-volumed Fly-Ash Concrete. J. Sci. Res. Inst. 2023, 40, 134. [Google Scholar]
  23. Wu, K.; Dou, Z.Y.; Liu, Z.H.; Xu, J.X. Study on Hydration Heat Release Model and Its Influence Coefficient of Addition Concrete. Appl. Sci. 2024, 14, 2276. [Google Scholar] [CrossRef]
  24. Han, H.W. The influence of mineral admixtures on the hydration heat of cementitious materials. Low Temp. Archit. Technol. 2020, 42, 37–40. [Google Scholar]
  25. Zeng, J.J.; Wang, S.N.; Xiong, J.B.; Liu, H.X. Influence of metakaolin on hydration performance of low heat Portland cement. Concrete 2020, 5, 69–72. [Google Scholar]
  26. Liu, S.H.; Yan, P.Y. Hydration properties of limestone powder in complex binding material. J. Chin. Ceram. Soc. 2008, 10, 1401–1405. [Google Scholar]
  27. DL/T5055-2007; Technical Specification of Fly Ash for Use in Hydraulic Concrete. National Development and Reform Commission: Beijing, China, 2007.
  28. Zhang, Y. Study on the Volume Stability of Limestone Powder-Slag-Fly Ash Concrete and Hydration Heat of Composite Cementitious Materials. Master’s Thesis, China University of Mining and Technology, Xuzhou, China, 2018. [Google Scholar]
  29. Chen, Z.J.; Lei, D.; Hong, M. Study on temperature distribution and cracking of early-age concrete in semi-adiabatic state. Henan Sci. 2019, 40, 390–395. [Google Scholar]
Figure 1. Semi-adiabatic temperature rise test device.
Buildings 14 02941 g001
Figure 2. Three-dimensional model of temperature rise test. Reprint with permission [23]; 2024, Applied Sciences.
Buildings 14 02941 g002
Figure 3. Temperature cloud image of the semi-adiabatic temperature rise test device. Reprint with permission [23]; 2024, Applied Sciences.
Buildings 14 02941 g003
Figure 4. Temperature cloud image of semi-adiabatic temperature rise test device.
Buildings 14 02941 g004
Figure 5. Core temperature curve of concrete test blocks with different insulation thicknesses.
Buildings 14 02941 g005
Figure 6. Core temperature curves of concrete test blocks with insulation layers with different specific heat capacities.
Buildings 14 02941 g006
Figure 7. Core temperature curves of concrete test blocks under different thermal conductivity insulation layers.
Buildings 14 02941 g007
Figure 8. Core temperature curve of concrete test block under different external environments of insulation layers.
Buildings 14 02941 g008
Figure 9. Semi-adiabatic temperature rise test device and monitoring instrument [23].
Buildings 14 02941 g009
Figure 10. Field trial flow chat. (a) Embedded temperature Sensor. (b) Insulation material used to seal concrete. (c) Access to real-time temperature monitoring system.
Buildings 14 02941 g010
Figure 11. Temperature curves of concrete test blocks with different mineral admixtures.
Buildings 14 02941 g011
Figure 12. Temperature fitting curve of concrete test block with two types of mineral admixtures.
Buildings 14 02941 g012
Figure 13. Temperature fitting curve of concrete test block mixed with three or four mineral admixtures.
Buildings 14 02941 g013
Figure 14. Temperature rise rate curve of concrete test block with two types of mineral admixtures.
Buildings 14 02941 g014
Figure 15. Temperature rise rate curve of concrete test block with three or four kinds of mineral admixtures.
Buildings 14 02941 g015
Table 1. Calculation parameters of semi-adiabatic temperature rise test model.
ArgumentValue
Thermal conductivity of concrete1.78
Coefficient of thermal expansion of concrete1.0 × 10−5
Specific heat of concrete (J/(kg·°C))960
Concrete mass density (kg/m2)2400
Heat release model parameter Q0 (kJ/kg)3500
Influence coefficient of hydration heat release model a0.36
Influence coefficient of hydration heat release model b0.74
Thermal conductivity of thermal insulation material (W/m·K)0.024
Specific heat of insulation material (J/(kg·°C))1200
Insulation material density (kg/m2)36
Film heat dissipation coefficient17,000
Emissivity0.77
Absolute zero degree Celsius (°C)−273.15
Stefan–Boltzmann constant5.669 × 10−14
Mold entry temperature (°C)25.5
Table 2. Mix ratio of multi-mineral admixture concrete [23].
IDCement(kg)Fly ash
(kg)
Slag (kg)Limestone powder
(kg)
Metakaolin (kg)Sand (kg)
F0S0L0K0420.00.00.00.00.0745.0
F20S20L0K0252.084.184.10.00.0745.0
F20S0L20K0252.084.10.084.10.0745.0
F20S0L0K20252.084.10.00.084.1745.0
F15S12.5L12.5K0252.063.052.552.50.0745.0
F15S12.5L0K12.5252.063.052.50.052.5745.0
F15S0L12.5K12.5252.063.00.052.552.5745.0
F10S10L10K10252.042.042.042.042.0745.0
IDStone (kg)Water (kg)Admixture (kg)Volume (m3)
F0S0L0K01117.0168.02.50.008
F20S20L0K01117.0168.02.50.008
F20S0L20K01117.0168.02.50.008
F20S0L0K201117.0168.02.50.008
F15S12.5L12.5K01117.0168.02.50.008
F15S12.5L0K12.51117.0168.02.50.008
F15S0L12.5K12.51117.0168.02.50.008
F10S10L10K101117.0168.02.50.008
Table 3. Temperature rise performance of concrete with different mineral admixtures.
Specimen
Number
Maximum Temperature
(°C)
Age at Which the Maximum Temperature Is Reached (h)Temperature at Age 5 d
(°C)
Maximum Temperature Rise Rate
(°C/h)
F0S0L0K050.2524.0031.502.25
F20S20L0K044.2538.0031.251.35
F20S0L20K041.7527.0030.251.25
F20S0L0K2045.7522.0029.001.36
F15S12.5L12.5K0F43.0030.0030.001.40
15S0L12.5K12.5F145.7522.0028.751.45
5S12.5L0K12.5F1047.2521.0028.501.60
S10L10K1047.0023.0028.001.50
Disclaimer/Publisher’s Note: The statements, opinions and data contained in all publications are solely those of the individual author(s) and contributor(s) and not of MDPI and/or the editor(s). MDPI and/or the editor(s) disclaim responsibility for any injury to people or property resulting from any ideas, methods, instructions or products referred to in the content.

