Article

Research on Safety Risk Evaluation System for Seepage in Ship Lock Foundation Pit Engineering

1
College of Water Conservancy and Hydropower Engineering, Hohai University, Nanjing 210098, China
2
Nanjing Hydraulic Research Institute, Nanjing 210024, China
3
Guangxi Datengxia Water Conservancy Hub Development Co., Ltd., Nanning 530000, China
*
Author to whom correspondence should be addressed.
Buildings 2024, 14(9), 2972; https://doi.org/10.3390/buildings14092972
Submission received: 21 August 2024 / Revised: 12 September 2024 / Accepted: 13 September 2024 / Published: 20 September 2024
(This article belongs to the Section Building Structures)

Abstract

:
Ship lock project currently demonstrates a distinct cyclical pattern, accumulating latent hazards that pose a significant threat to project safety. Seepage safety (the condition in which the seepage risk is reduced to an acceptable level) serves as a crucial indicator in the safety risk assessment index system for ship lock project construction, thus necessitating an in-depth analysis of the risk factors impacting seepage safety. Utilizing a ship lock project in China as a case study, this study employs the finite element method (FEM) to analyze the seepage field of the ship lock foundation pit basin and proposes a comprehensive set of methods for risk evaluation and warning models pertaining to seepage safety risks in ship lock engineering. This study reveals that the obstruction of dewatering wells and imperfections in the diaphragm wall are the primary factors contributing to seepage damage. The investigation conducted a quantitative analysis of the impact of these two factors on the seepage field of the ship lock pit, considering pore pressure, water head, gradient, and flow velocity. A comprehensive set of evaluation indicators for seepage safety was formulated, drawing on the principles of multi-objective optimization, and a method for delineating the safe range of ship lock pit excavation under seepage action was proposed. Subsequently, an integrated seepage safety risk assessment system for ship lock pit excavation engineering was established. These research findings offer a scientific foundation for the management of seepage safety in ship lock pit excavation engineering and provide valuable references and guidance for the development of anti-seepage systems.

1. Introduction

Inland water transportation, as a crucial element of the national integrated transportation system and comprehensive utilization of water resources, offers numerous advantages, such as high transport capacity, minimal land usage, low energy consumption, limited environmental impact, and cost-effectiveness. It plays a pivotal role in driving economic and social development [1]. Ship locks serve as essential navigation structures for overcoming river water level differences and are vital for ensuring the smooth operation of inland water transportation [2,3,4,5]. However, the construction process of ship lock engineering involves intricate procedures and frequent vertical cross-over operations, significantly increasing operational safety risks. Among these risks, seepage presents the most prominent challenge. Seepage failure can result in soil instability or ground collapse, posing a threat to the safety of nearby structures and significantly impacting the overall construction of the project. Research indicates that seepage failure incidents constitute a significant proportion of deep foundation pit construction [6,7], with base leakage, sudden surge, and lateral soil erosion being the primary forms of seepage failure. Additionally, seepage failure may precipitate subsequent engineering quality issues in construction structures [8,9]. An appropriate anti-seepage system is typically necessary to mitigate the risk of seepage failure.
Effectively managing the seepage process within excavated foundation pits presents a significant technical challenge in the construction of ship locks. The foundational work of French hydraulic engineer Darcy, who derived the Darcy flow law through experimental research, has been instrumental in advancing seepage studies [10]. Terzaghi [11] and Rendulic [12] integrated the Darcy flow law into the three-dimensional consolidation theory, elucidating the principles governing pore water pressure distribution during seepage. Analytical methods [13,14,15,16] and discrete element techniques [17,18,19] are extensively employed to investigate basin seepage issues; researchers such as Wei [20], Hu [21], Yu [22], and Yuan [23] have utilized these approaches to address seepage challenges associated with ship lock foundations. However, it is evident that these methodologies primarily focus on specific case studies without addressing widespread issues related to seepage damage or establishing a comprehensive safety evaluation framework for seepage conditions. In contrast, the finite element method offers several advantages: it accurately captures complex constitutive relationships among rock and soil materials, excels in modeling intricate boundary conditions, and benefits from established methodologies and computational procedures. Notably, Tony [24], Bi [25], Wu [26], and others [27,28,29] have developed high-fidelity numerical models of ship lock foundation pits to analyze their respective seepage problems.
Conversely, the construction of the anti-seepage system represents a critical component in ensuring the seepage safety of ship lock projects. An analysis of seepage failure incidents at ship locks both domestically and internationally reveals that most failures stem from deficiencies within the anti-seepage system. Consequently, it is imperative to perform comprehensive qualitative and quantitative analyses on the uncertain indicators associated with this system to safeguard the seepage integrity of ship lock projects [30,31,32]. However, there exists a lack of stringent definitions and evaluative criteria for assessing the seepage safety of ship lock foundations, alongside an absence of relevant codes or standards for guidance. Risk evaluation models developed through empirical modeling [33] and machine learning techniques [34] typically necessitate extensive datasets; they cannot often be distilled into specific indicators. Multi-objective optimization is a methodology for addressing mathematical problems characterized by multiple potentially conflicting objective functions, thereby requiring trade-offs to achieve optimal solutions [35,36]. The primary aim of multi-objective optimization algorithms is to identify a set of equilibrium solutions—known as Pareto optimal solutions [37]—derived from balancing and reconciling various sub-objectives. Therefore, once the factors influencing seepage safety are identified, a comprehensive index reflecting these influences can be established using multi-objective optimization methods.
This study focuses on a ship lock project and employs the finite element method to analyze the seepage field of the ship lock basin. It investigates the impact of defects in the anti-seepage system on the seepage characteristics of the ship lock project, and it performs a sensitivity analysis of seepage parameters such as water head and slope. Drawing from the calculation results and principles of multi-objective optimization, it proposes a set of methods for evaluating seepage safety risks in ship lock projects, offering a scientific foundation for ship lock design and construction.

2. Seepage Calculation of Ship Lock Foundation Pit Engineering

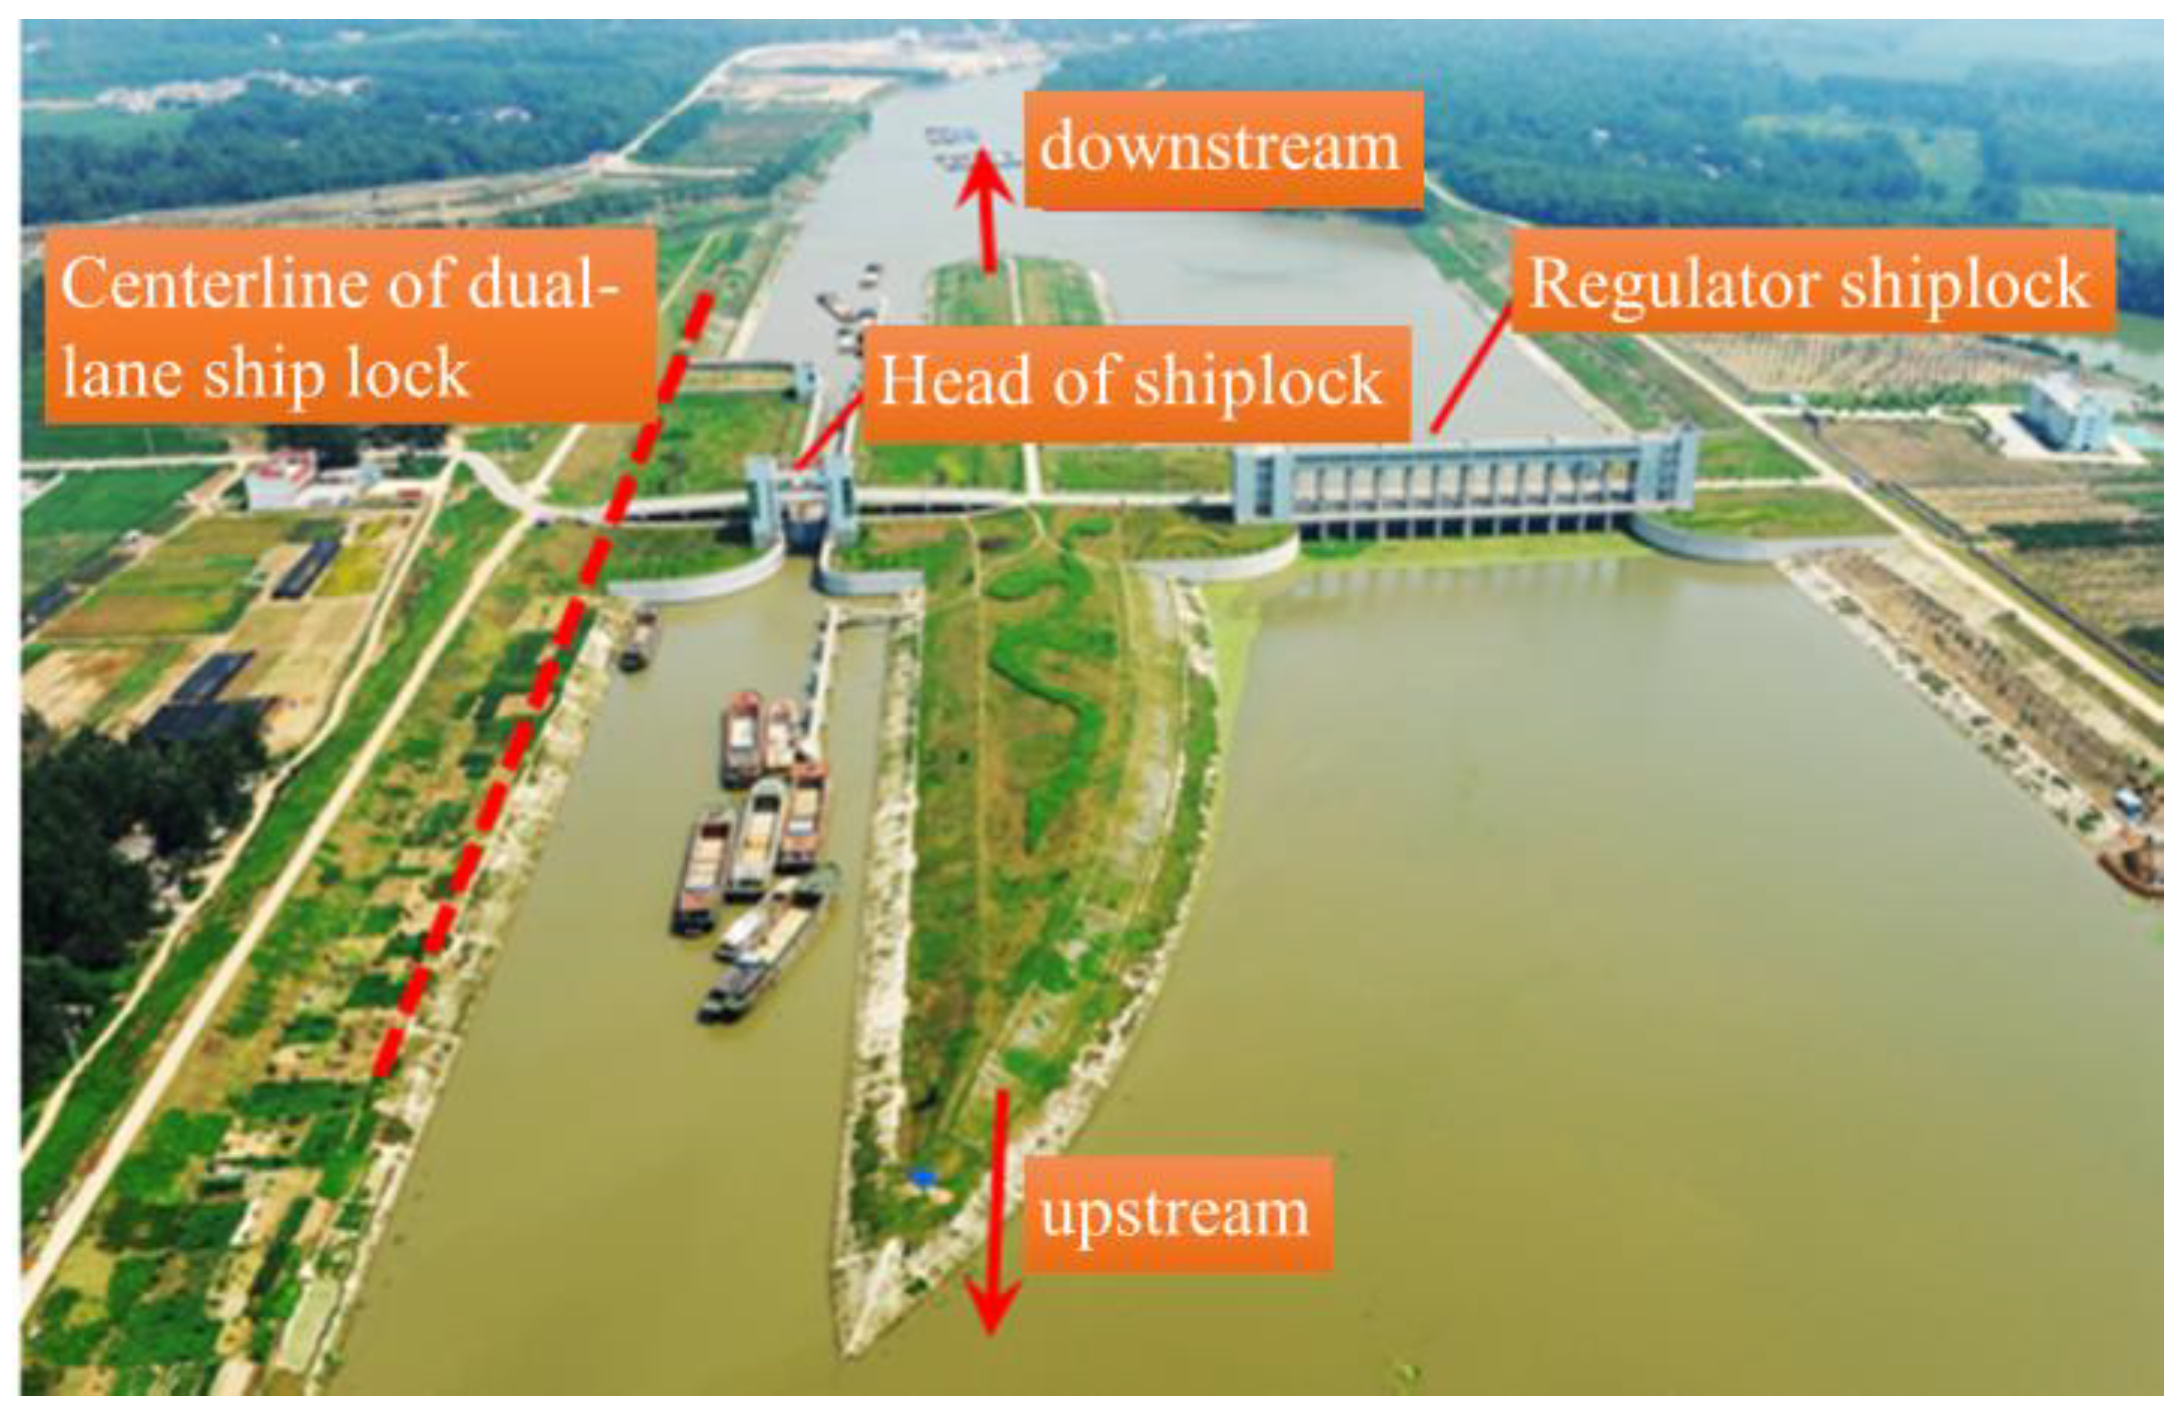
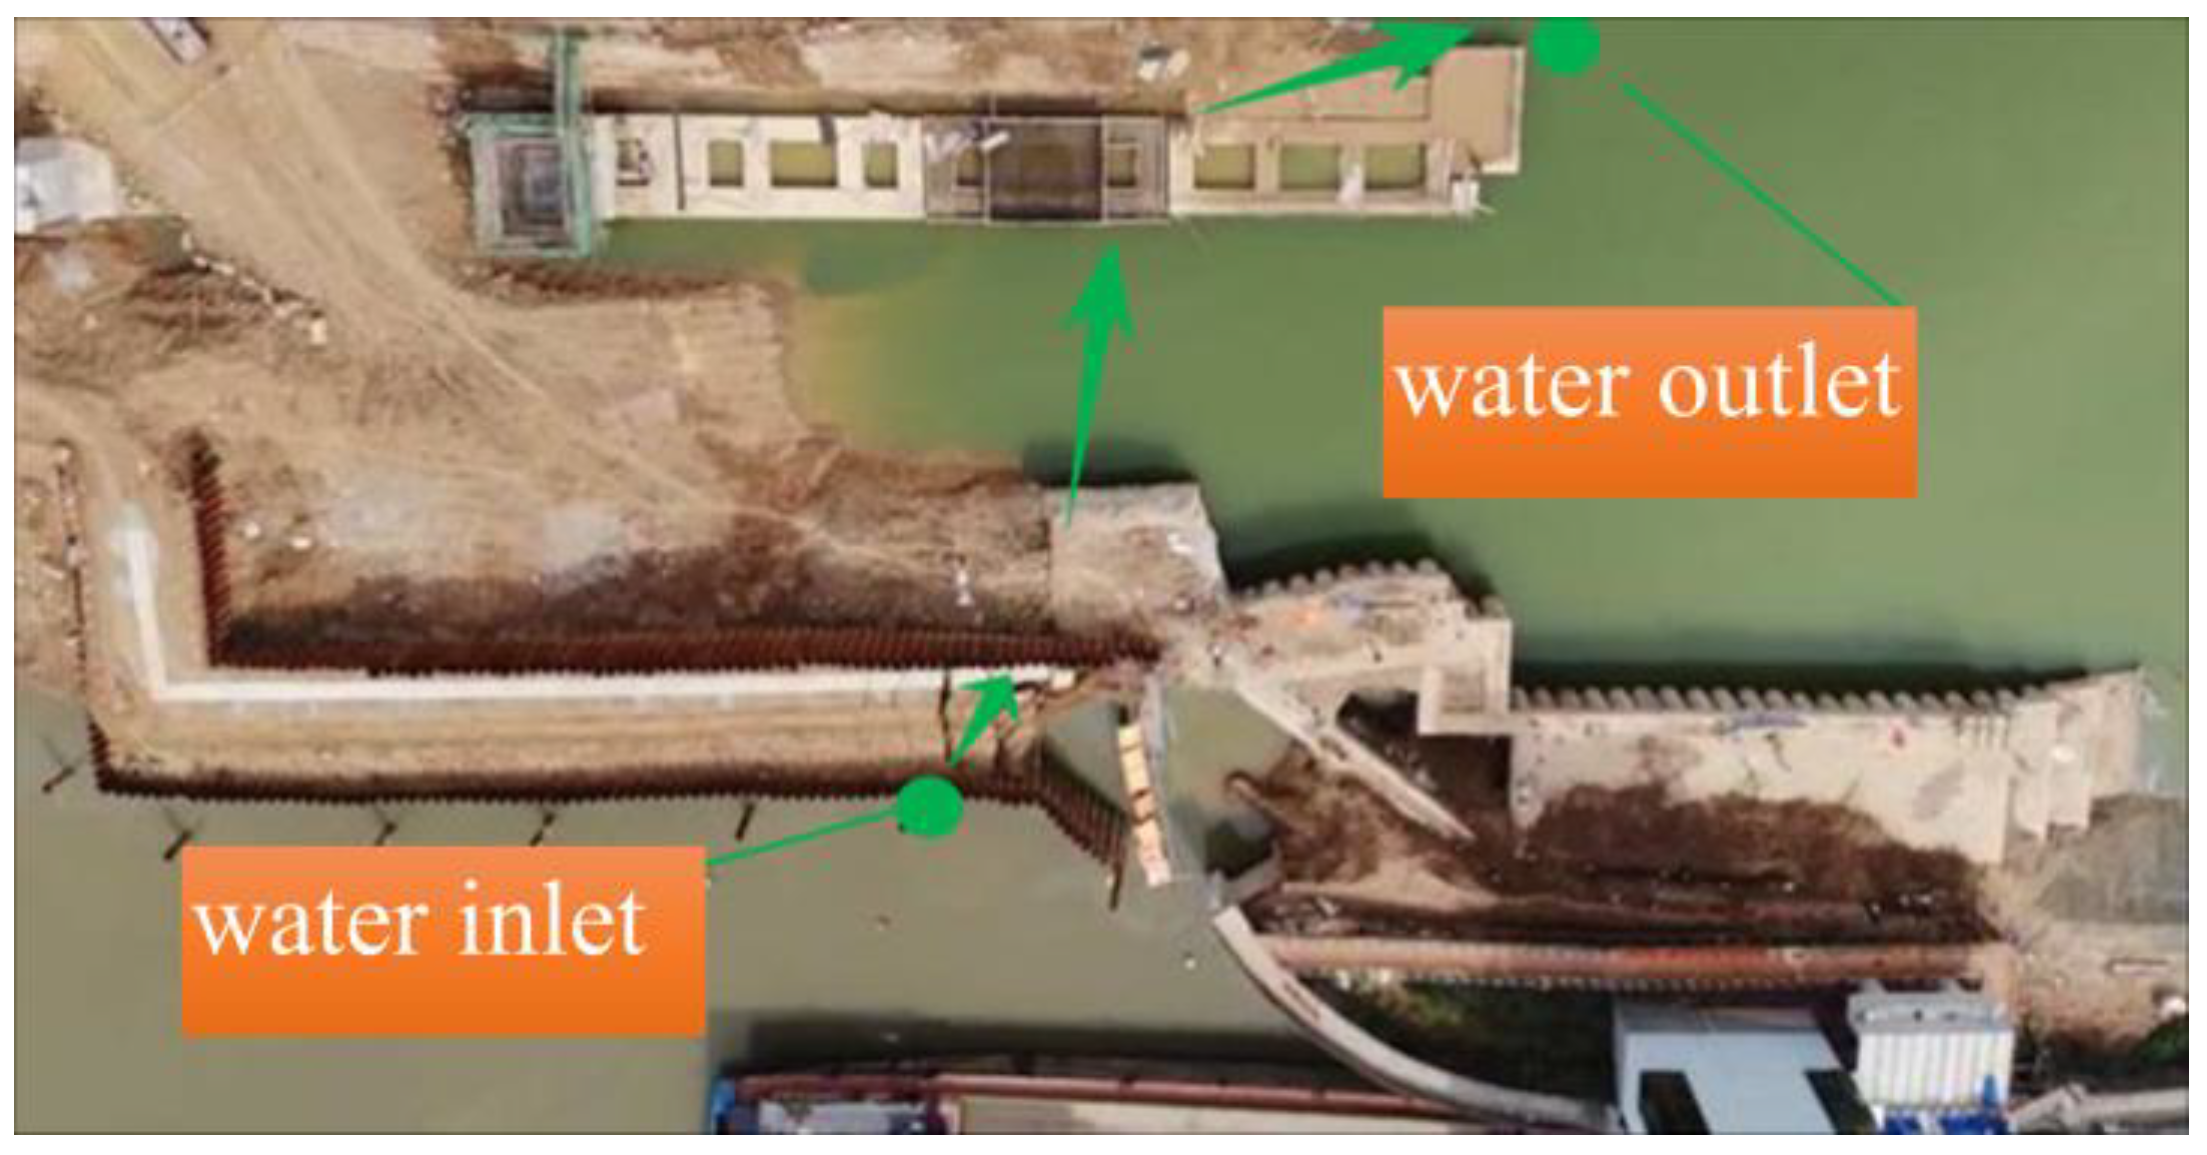
2.1. Project Overview and FEM Model
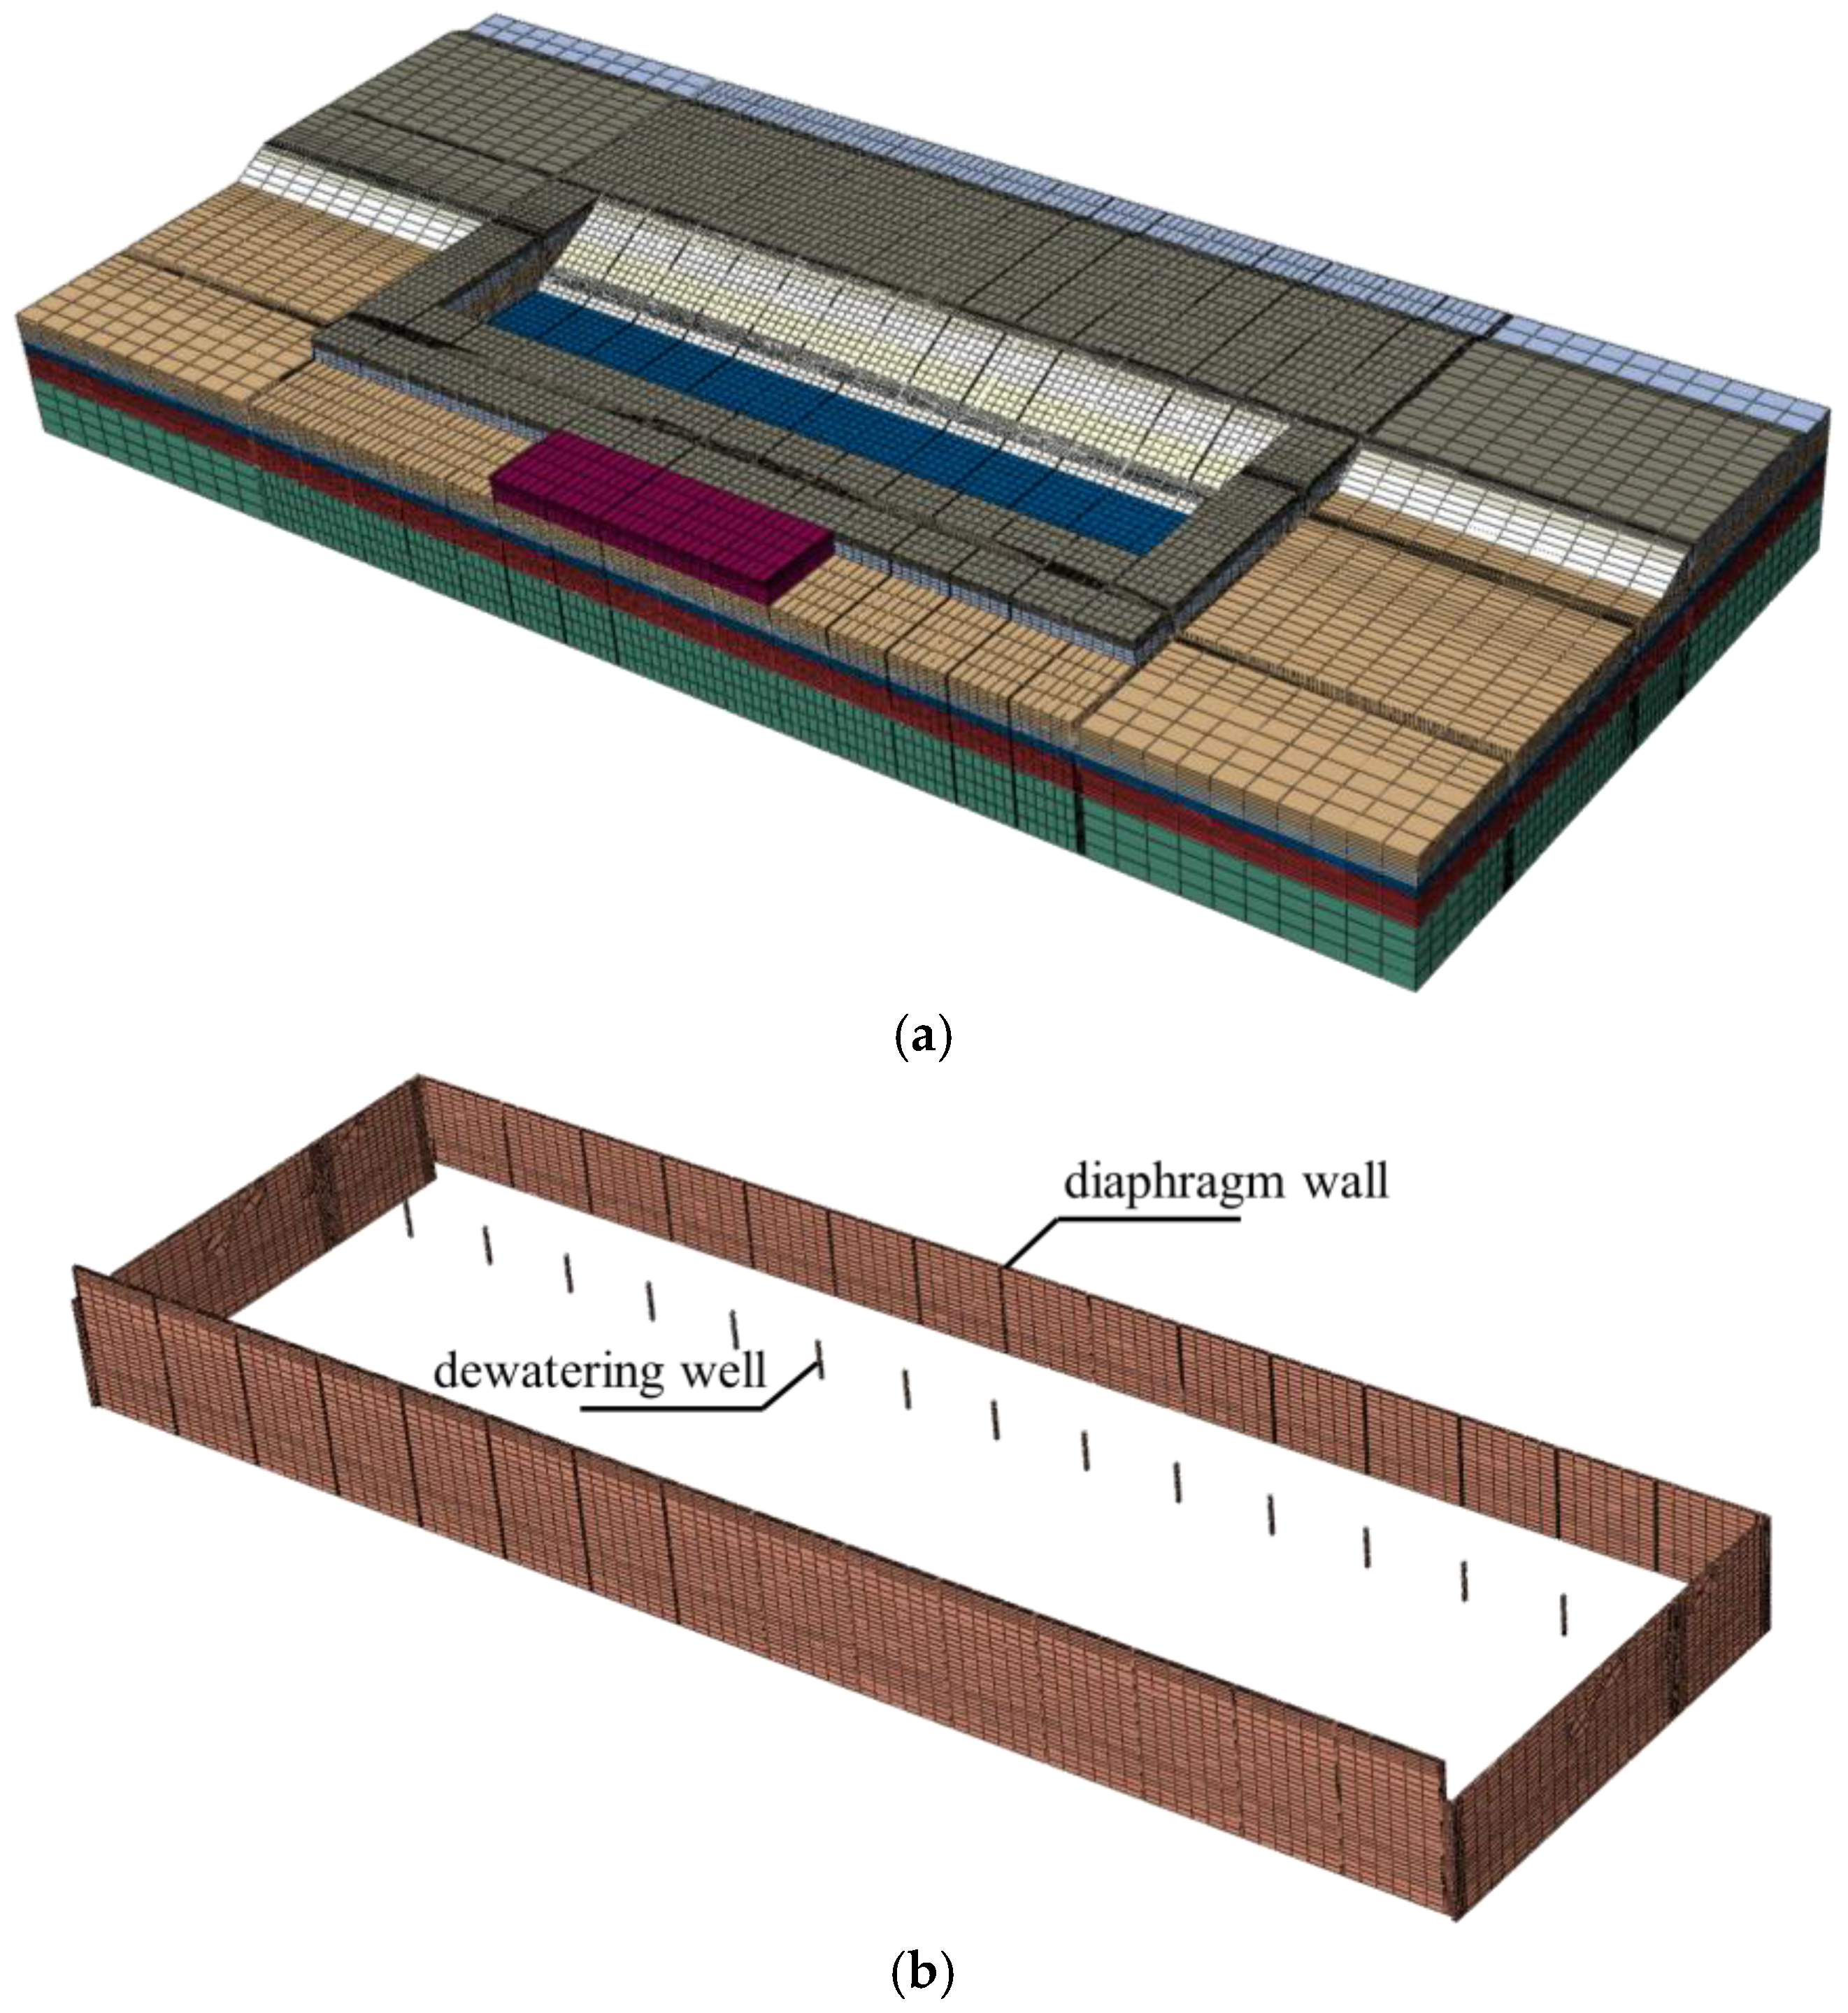
The hub project features a regulating sluice gate and a Class IV ship lock. The hydraulic structures of the project are designed to meet Grade 2 standards. The designed discharge capacity of the regulating sluice gate is 3910 m3/s, with a flood control capacity of 4770 m3/s. In consideration of navigation planning and current traffic volume requirements, a double-lane ship lock has been planned on the left side of the existing ship lock. Both upper and lower lock gates for both new and old ship locks align with the regulating sluice gate, while the approach channel is asymmetrically arranged. Figure 1 illustrates the layout of the ship lock. The upper and lower lock gates for the double-lane ship lock are monolithic concrete structures resembling human figures, while the lock chamber takes on an inverted “Π” shape in monolithic concrete construction. The water distribution system follows a dispersed configuration.
Multiple instances of seepage were observed during the excavation of the ship lock foundation pit. This study focuses on studying the third occurrence, which occurred at the location of the upstream right bank guide wall. The inflow point was identified at the connection between the steel sheet pile of the upstream steel cofferdam and the old navigation wall, as illustrated in Figure 2.

2.2. FEM Model

A three-dimensional seepage analysis model was constructed utilizing field measurement data from the ship lock pit. The ship lock pit measures 43.8 m in width and 300.0 m in length, with a bottom elevation of 16.90 m. Its anti-seepage system comprises a diaphragm wall and dewatering wells. The left side of the foundation pit is sloped and excavated, featuring a concrete diaphragm wall with a thickness of 0.8 m, a bottom elevation of 7.0 m, and a top elevation of 34.5 m. On the right side of the pit slope, dewatering wells are arranged with a bottom elevation of 8.0 m, a length of 8.85 m, a diameter of 0.5 m, and an interval of 20 m between adjacent dewatering wells. The upper lock head water level stands at 32.50 m, and the lower lock head water level is at 27.90 m. A three-dimensional seepage calculation model was developed using ABAQUS 2022 software, employing the C3D8P element type. The finite element mesh comprises 441,939 elements and 468,776 nodes, as illustrated in Figure 3a. This chapter focuses on the impact of defects in the anti-seepage system on the seepage safety of the ship lock project, primarily considering indicators such as pore water pressure and gradient. Therefore, the construction process of the initial excavation of the foundation pit is not taken into account, i.e., the deformation index during the seepage process is disregarded. The specific arrangement of the anti-seepage system can be seen in Figure 3b. The parameters of the FEM model are detailed in Table 1, while Figure 4 depicts the distribution of soil layers and some pressure monitoring points’ locations in the field.

2.3. Principles of Multi-Objective Optimization

The fundamental approach to evaluating seepage risk (the probability of seepage failure due to various factors) involves transforming the practical engineering issue into an optimization problem and determining the critical risk value through numerical computation. Based on the principles of multi-objective optimization and numerical analysis, two key variables are chosen as independent factors for risk assessment: firstly, the well clogging rate, calculated as (standard working efficiency − actual working efficiency)/standard working efficiency; secondly, the proportion of defective area in the diaphragm wall, defined as the ratio of defect area to the total selected sectional area. These quantitative indicators enable effective determination of the critical seepage damage value, facilitating prediction and control of seepage risk. The objective function is formulated by the following equation:
d K i = = i = 1 n λ i d F X i , K i
In the formula, d(Ki) represents the objective function, d [F(Xi, Ki)] represents the effectiveness function of each evaluation index, Xi denotes the number of evaluation indicators, and λi signifies the weight of the effectiveness function. The independent variables K1 and K2 represent the rate of clogging of dewatering wells and the proportion of defective areas in the diaphragm wall, respectively. The technical route for seepage risk assessment is illustrated in Figure 5.

3. Safety Risk Assessment System for Seepage in Ship Locks

3.1. Seepage Calculation Result

This study examined the seepage barrier system under three distinct calculation scenarios: standard conditions, clogging of dewatering wells, and defects in diaphragm walls. Three representative cross-sections were chosen from the 3D model, as depicted in Figure 6. Cross-sections 1-1 and 3-3 correspond to horizontal and vertical views of dewatering wells, while cross-section 2-2 corresponds to the location of the diaphragm wall defect.
Figure 7 illustrates the comparison between the observed and calculated pore pressure values at monitoring points within the barrier system under normal operating conditions. The figure demonstrates that the model proposed in this study effectively captures the trend of pore pressure decline at each monitoring point, with a high degree of agreement between observed and calculated values.
Figure 8 illustrates the pore pressure distribution in various sections, clearly demonstrating the dissipation of pore pressure due to rainfall wells and diaphragm walls. The selected sections indicate that the ship lock’s waterproof system has effectively lowered the zero-pore pressure surface to a depth of less than 2 m below the slab, meeting construction requirements. The intersection of the wetted line with the slope represents the overflow point. Figure 9 depicts the water head flow network, revealing no outflow across the entire cross-section. As shown in Figure 10, under the normal operation of existing waterproof systems and rainfall wells, maximum water head gradient reduction during excavation is measured at 0.46, which falls below the critical gradient reduction value of 0.60 for soil layers, indicating a relatively low risk of hydraulic failure.

3.2. Evaluation Index

3.2.1. Silting of Dewatering Well

When the dewatering well operates under normal conditions, its water pumping rate is 960 m3/day. Considering variations in operational efficiency, the dewatering rates decrease by 10%, 20%, and 30%, respectively. Figure 11 illustrates the pore pressure distribution within the dewatering well at varying degrees of clogging. It is evident that a decrease in dewatering efficiency leads to a significant increase in pore pressure. When the efficiency decreases by more than 20%, effective dissipation of pore pressure becomes unattainable, causing the zero-pore pressure boundary to rise to the bottom of the excavation and pose a threat to seepage stability.
Figure 12 illustrates the hydraulic network diagram of the dewatering wells under varying degrees of clogging. With the decreasing efficiency of the dewatering wells, the water headline noticeably increases. The points where the infiltration line intersects with the bottom and slope of the excavation are identified as overflow points. It is evident that when the dewatering efficiency decreases by more than 20%, overflow points emerge at both the bottom slab and the right slope of the excavation.
Figure 13 illustrates the variation in water head gradient for a well experiencing different degrees of clogging. It is observed that layer ⑥2 exhibits the highest gradient ratio, indicating that clogging significantly impacts the drainage efficiency of this layer, leading to delayed discharge of porous water and consequently resulting in reduced water level difference and a smaller gradient. Therefore, assessing the influence of well clogging on seepage safety solely based on gradient may not accurately reflect real conditions.
Figure 14 illustrates the variation in flow velocity (flvel) distribution under varying degrees of groundwater well clogging. It is evident that with an increase in the degree of groundwater well clogging, the outflow capacity diminishes. Inadequate discharge of groundwater may lead to potential overflow at the slope position adjacent to the well, thereby inducing seepage damage.
In summary, the velocity distribution map surrounding the dewatering well indicates that blockages within the well hinder the timely discharge of accumulated groundwater. This obstruction directly leads to an increase in pore water pressure and hydraulic head within the foundation pit. Conversely, such blockages also result in a reduced water level differential in the foundation pit, which effectively diminishes the gradient present therein.

3.2.2. Defect in Diaphragm Wall

Select model sections on the left and right of section 2-2 within a 0.5 m length to quantitatively analyze the impact of diaphragm wall defects on the safety of basement pit seepage. Evaluate the effects of diaphragm wall defect areas measuring 1.5 m2, 3 m2, and 4.5 m2 on basement pit seepage safety. Figure 15 illustrates the distribution of pore pressure under varying degrees of diaphragm wall defects, indicating a significant increase in pore water pressure with defective walls. When the area of the diaphragm wall defect exceeds 3 m2, the zero-pore pressure boundary rises above the bottom of the basement pit, elevating the seepage failure risk.
Figure 16 illustrates the hydraulic network diagram depicting water head flow under varying degrees of defects in the diaphragm wall. As the area of the diaphragm wall defect increases, there is a noticeable elevation in the water headline. It is evident that when the area of the diaphragm wall defect exceeds 3 m2, overflow occurs at the bottom sluice gate and on the right slope of excavation, significantly elevating the likelihood of seepage damage in these areas.
Figure 17 illustrates the gradient distribution in the vicinity of the defect location under varying degrees of diaphragm wall defects. The presence of a defect in the diaphragm wall leads to an influx of water through the defective area, resulting in an elevation of the water level difference at that location and, consequently, an increase in the gradient. Upon reaching an area of 4.5 m2, the value of the gradient exceeds the critical threshold for the soil layer.
Figure 18 illustrates the flow velocity distribution under varying degrees of diaphragm wall defect conditions. It is evident that with a smaller defect area, water flow ascends around the defective position. As the defect area expands, the flow velocity around the defective position increases and exhibits an upward impact trend, potentially leading to water overflow onto the slab and consequent seepage damage.
It is evident that when a defect occurs in the diaphragm wall, water infiltrates through the breach and impacts the diaphragm. As the size of the defect enlarges, there is a marked increase in pore water pressure within the excavation, leading to a significant rise in water head. Furthermore, the gradient at the location of the defect also intensifies due to an augmented difference in the water head on either side.

3.3. Performance Function Based on the Efficiency of a Precipitation Well

The calculation results in Section 2 indicate that the left lower corner of the excavation is particularly vulnerable to permeability failure when defects are present in the impermeable system. Consequently, a monitoring point located 3 m below the left lower corner was selected. The relationship between the water head H at this monitoring point and the clogging rate K1 of the dewatering well is depicted on the σp~K1 plane, as illustrated in Figure 19a. As K1 increases, there is a continuous rise in the water head at the monitoring point. When this exceeds 3 m, it signifies that the water level has surpassed the bottom slab of the excavation, indicating a potential risk of permeability failure. The evolving relationship between H and K1 aligns with an exponential growth pattern.
The relationship between the gradient ratio JC at the monitoring point and the efficiency of well K1 is depicted in the JC~K1 plane, as illustrated in Figure 19b. With an increase in K1, inadequate dissipation of pore water pressure leads to a marginal change in water level difference at the monitoring point, resulting in a lower gradient compared to normal operation. Overall, as K1 increases, the gradient at the monitoring point does not surpass the critical threshold but exhibits a declining trend following a quadratic function.
In order to standardize the performance function and remove its dimensional units, we normalize it using the following calculation equation:
d F X i , K i = F X i , K i F X i , K i min F X i , K i m a x F X i , K i min
The normalized function for the objective function, with the head and gradient as targets, is expressed by Equations (3) and (4):
d F H , K 1 = 0.123 1 exp K 1 / 0.451
d F J C , K 1 = 2 exp K 1 / 1.372 1
Figure 20 illustrates the comparison of the performance function regarding the clogging rate of dewatering well K1. As the clogging rate of dewatering well K1 increases, the water head at the monitoring point rises. Upon reaching a certain degree of clogging, the water head exceeds 3 m, potentially leading to overflow at the base or above excavation, following along the direction of permeable water flow and possibly forming a seepage channel, resulting in pipe burst and soil erosion. Conversely, dewatering well clogging constrains water level decline, leading to a reduced water level difference within the soil layer and decreased gradient; thus, a gradient at monitoring points is maintained consistently lower than critical levels. Specifically, when K1 reaches 0.273, water head H surpasses its critical value; henceforth, the clogging rate of dewatering well K1 is selected as its performance function based on changes in water head H.

3.4. Performance Function Based on Ground Wall Defects

By selecting the ratio of defect area to section area (the height of diaphragm wall x section length) as the target function K2, a plot is generated to illustrate the relationship between water head H and K2 at the monitoring point, as depicted in Figure 21a. As K2 increases, there is a corresponding rise in water head, leading to an increased risk of permeability damage when the water level exceeds the bottom plate height. The relationship between H and K2 follows a quadratic function. Furthermore, a plot illustrating the relationship between the gradient JC and K2 at the monitoring point is presented in Figure 21b. The defect of the diaphragm wall results in localized elevation of water levels, contributing to an augmented difference in water head at the monitoring point and an increase in gradient. Reaching a certain degree of defect within the diaphragm wall leads to exceeding the critical gradient at the monitoring point.
The normalized function for the objective function with water head and gradient as targets is expressed by Equations (5) and (6), respectively:
d F H , K 2 = 3.01 K 2 2 + 0.249 K 2
d F J C , K 2 = 1.462 1 exp ( ( K 2 / 1.159 ) )
Figure 22 illustrates that, at K2 values of 0.192 and 0.205, respectively, the functions (F(H,K2)) and (F(JC,K2)) attain their critical values. In general, in comparison to changes in water head, the gradient is more likely to reach its critical value. Therefore, for safety considerations, the efficiency function for K2 should be based on the gradient at the measurement point.

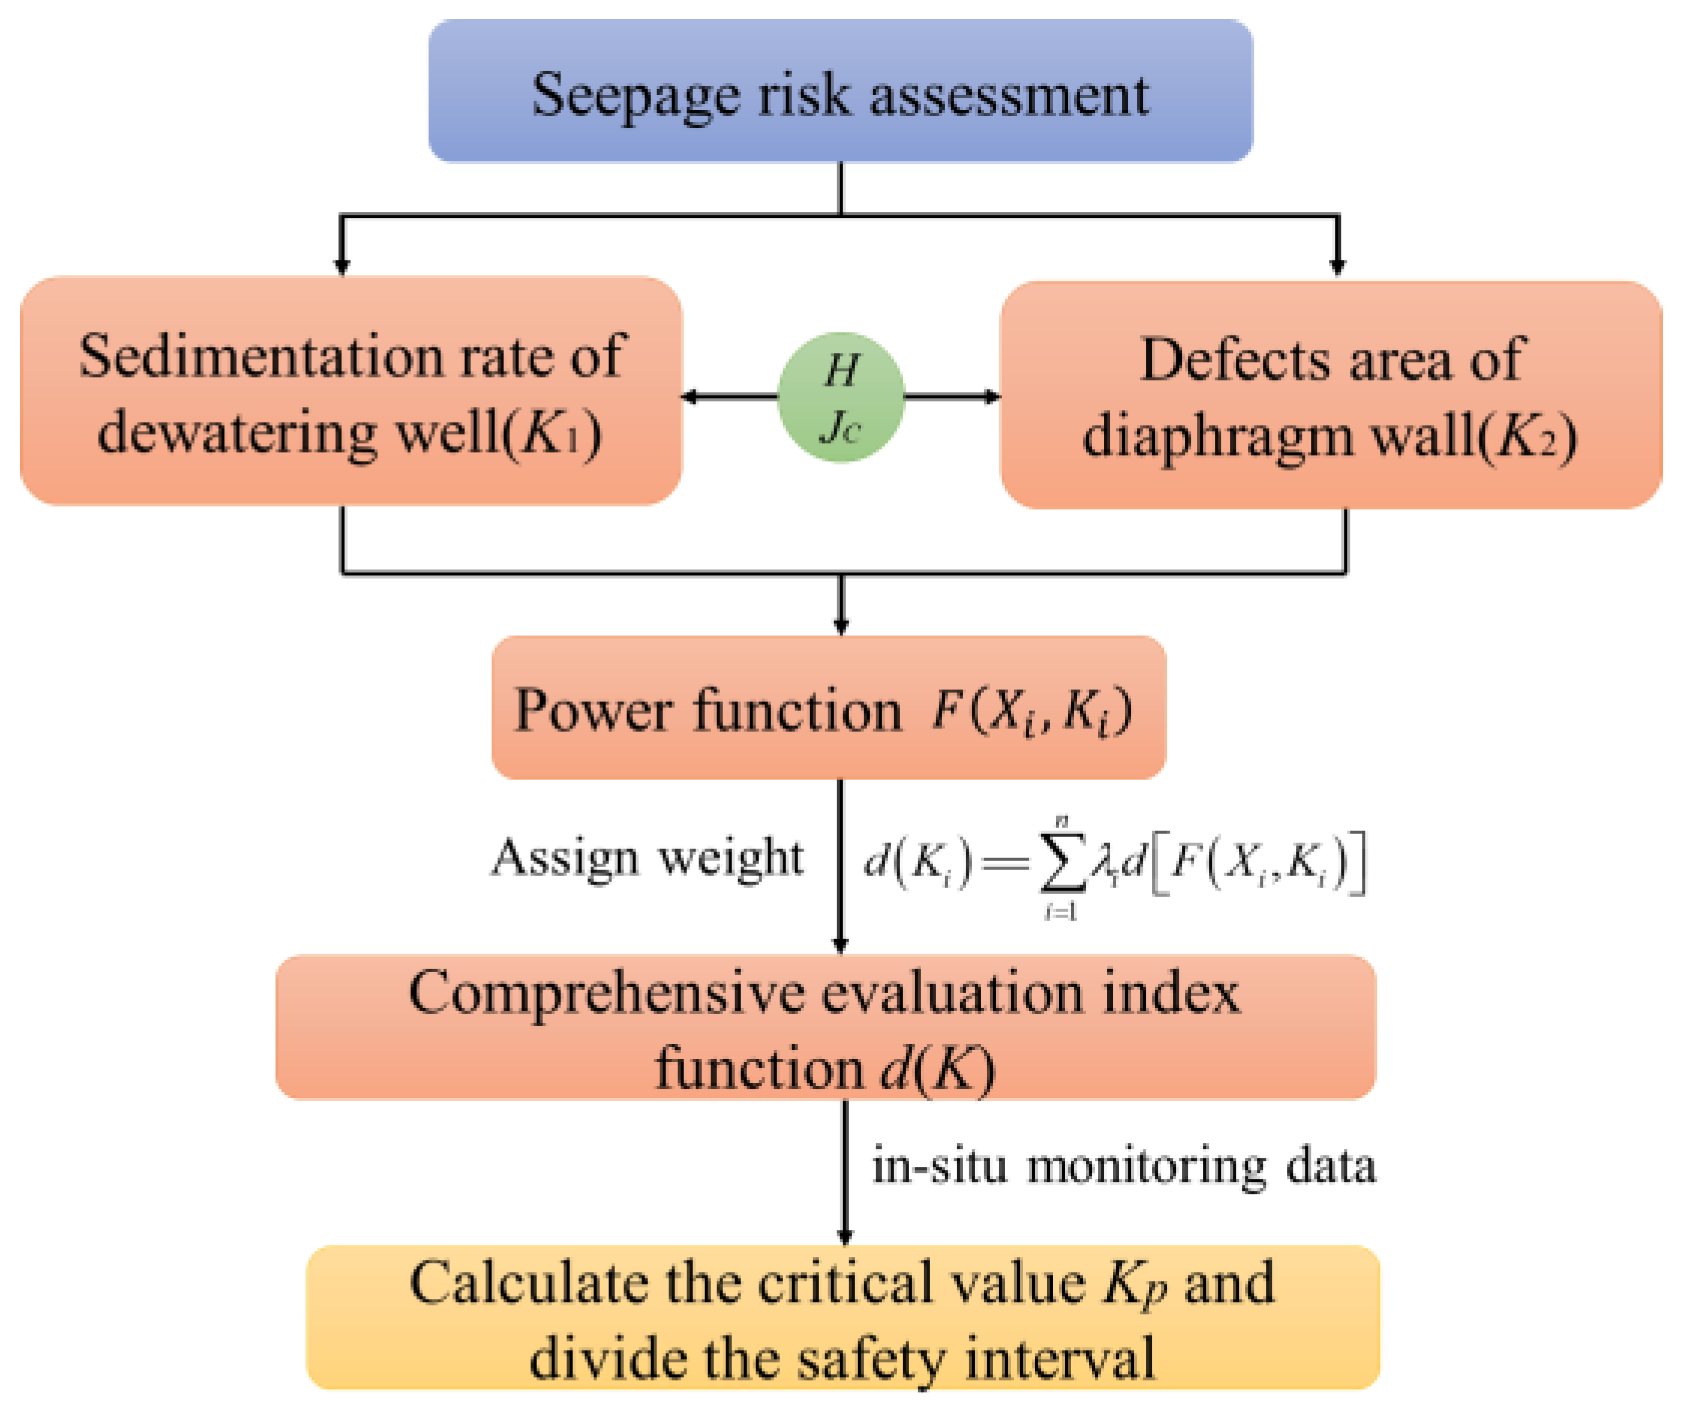
3.5. Objective Function for Risk Assessment

The above analysis indicates that the primary deficiencies in the anti-seepage system stem from the imperfections of the diaphragm wall and the clogging of dewatering wells. Furthermore, damage to the anti-seepage system typically occurs concurrently rather than independently, thus allowing for the derivation of a comprehensive risk evaluation index for seepage damage based on these two factors. Weighting factors can be allocated to each factor according to their respective proportions in actual engineering projects, resulting in an expression for the comprehensive evaluation index as follows:
d K = λ 1 0.123 1 exp K 1 / 0.451 + λ 2 1.462 1 exp ( ( K 2 / 1.159 ) )
In this approach, K represents the comprehensive risk assessment index, d(K) denotes the comprehensive evaluation function, and λ1 and λ2 are the respective weights assigned to these two factors. Figure 23a illustrates the variation of the objective function d(K) under different weight combinations, clearly delineating the critical value range Kp corresponding to changes in the evaluation function. Figure 23b depicts alterations in safety margins across various weight allocation scenarios, categorized based on the critical value Kp.
Consequently, the water head H and the gradient H are identified as critical indicators for assessing the safety range. In scenarios involving silting of dewatering wells, the water head H should be treated as a functional variable. Conversely, when defects in the diaphragm wall are present, the gradient JC should be regarded as a functional variable. Factors K1, associated with well plugging, and K2, related to continuous wall defects, are analyzed alongside field monitoring data to derive functions for each factor along with their respective weights. This process culminates in a comprehensive risk function that effectively delineates the safety interval concerning seepage. Should the calculated comprehensive risk assessment index K exceed this established safety threshold, appropriate anti-seepage measures should be implemented—such as utilizing reinforced materials for continuous walls or establishing redundant drainage systems.

4. Conclusions

This study developed a FEM model to comprehensively analyze the seepage field in the ship lock pit post-dewatering, with a specific focus on evaluating the seepage safety of the ship lock pit under conditions of anti-seepage system defects. A comprehensive seepage safety assessment system was established. The key findings are as follows:
(1)
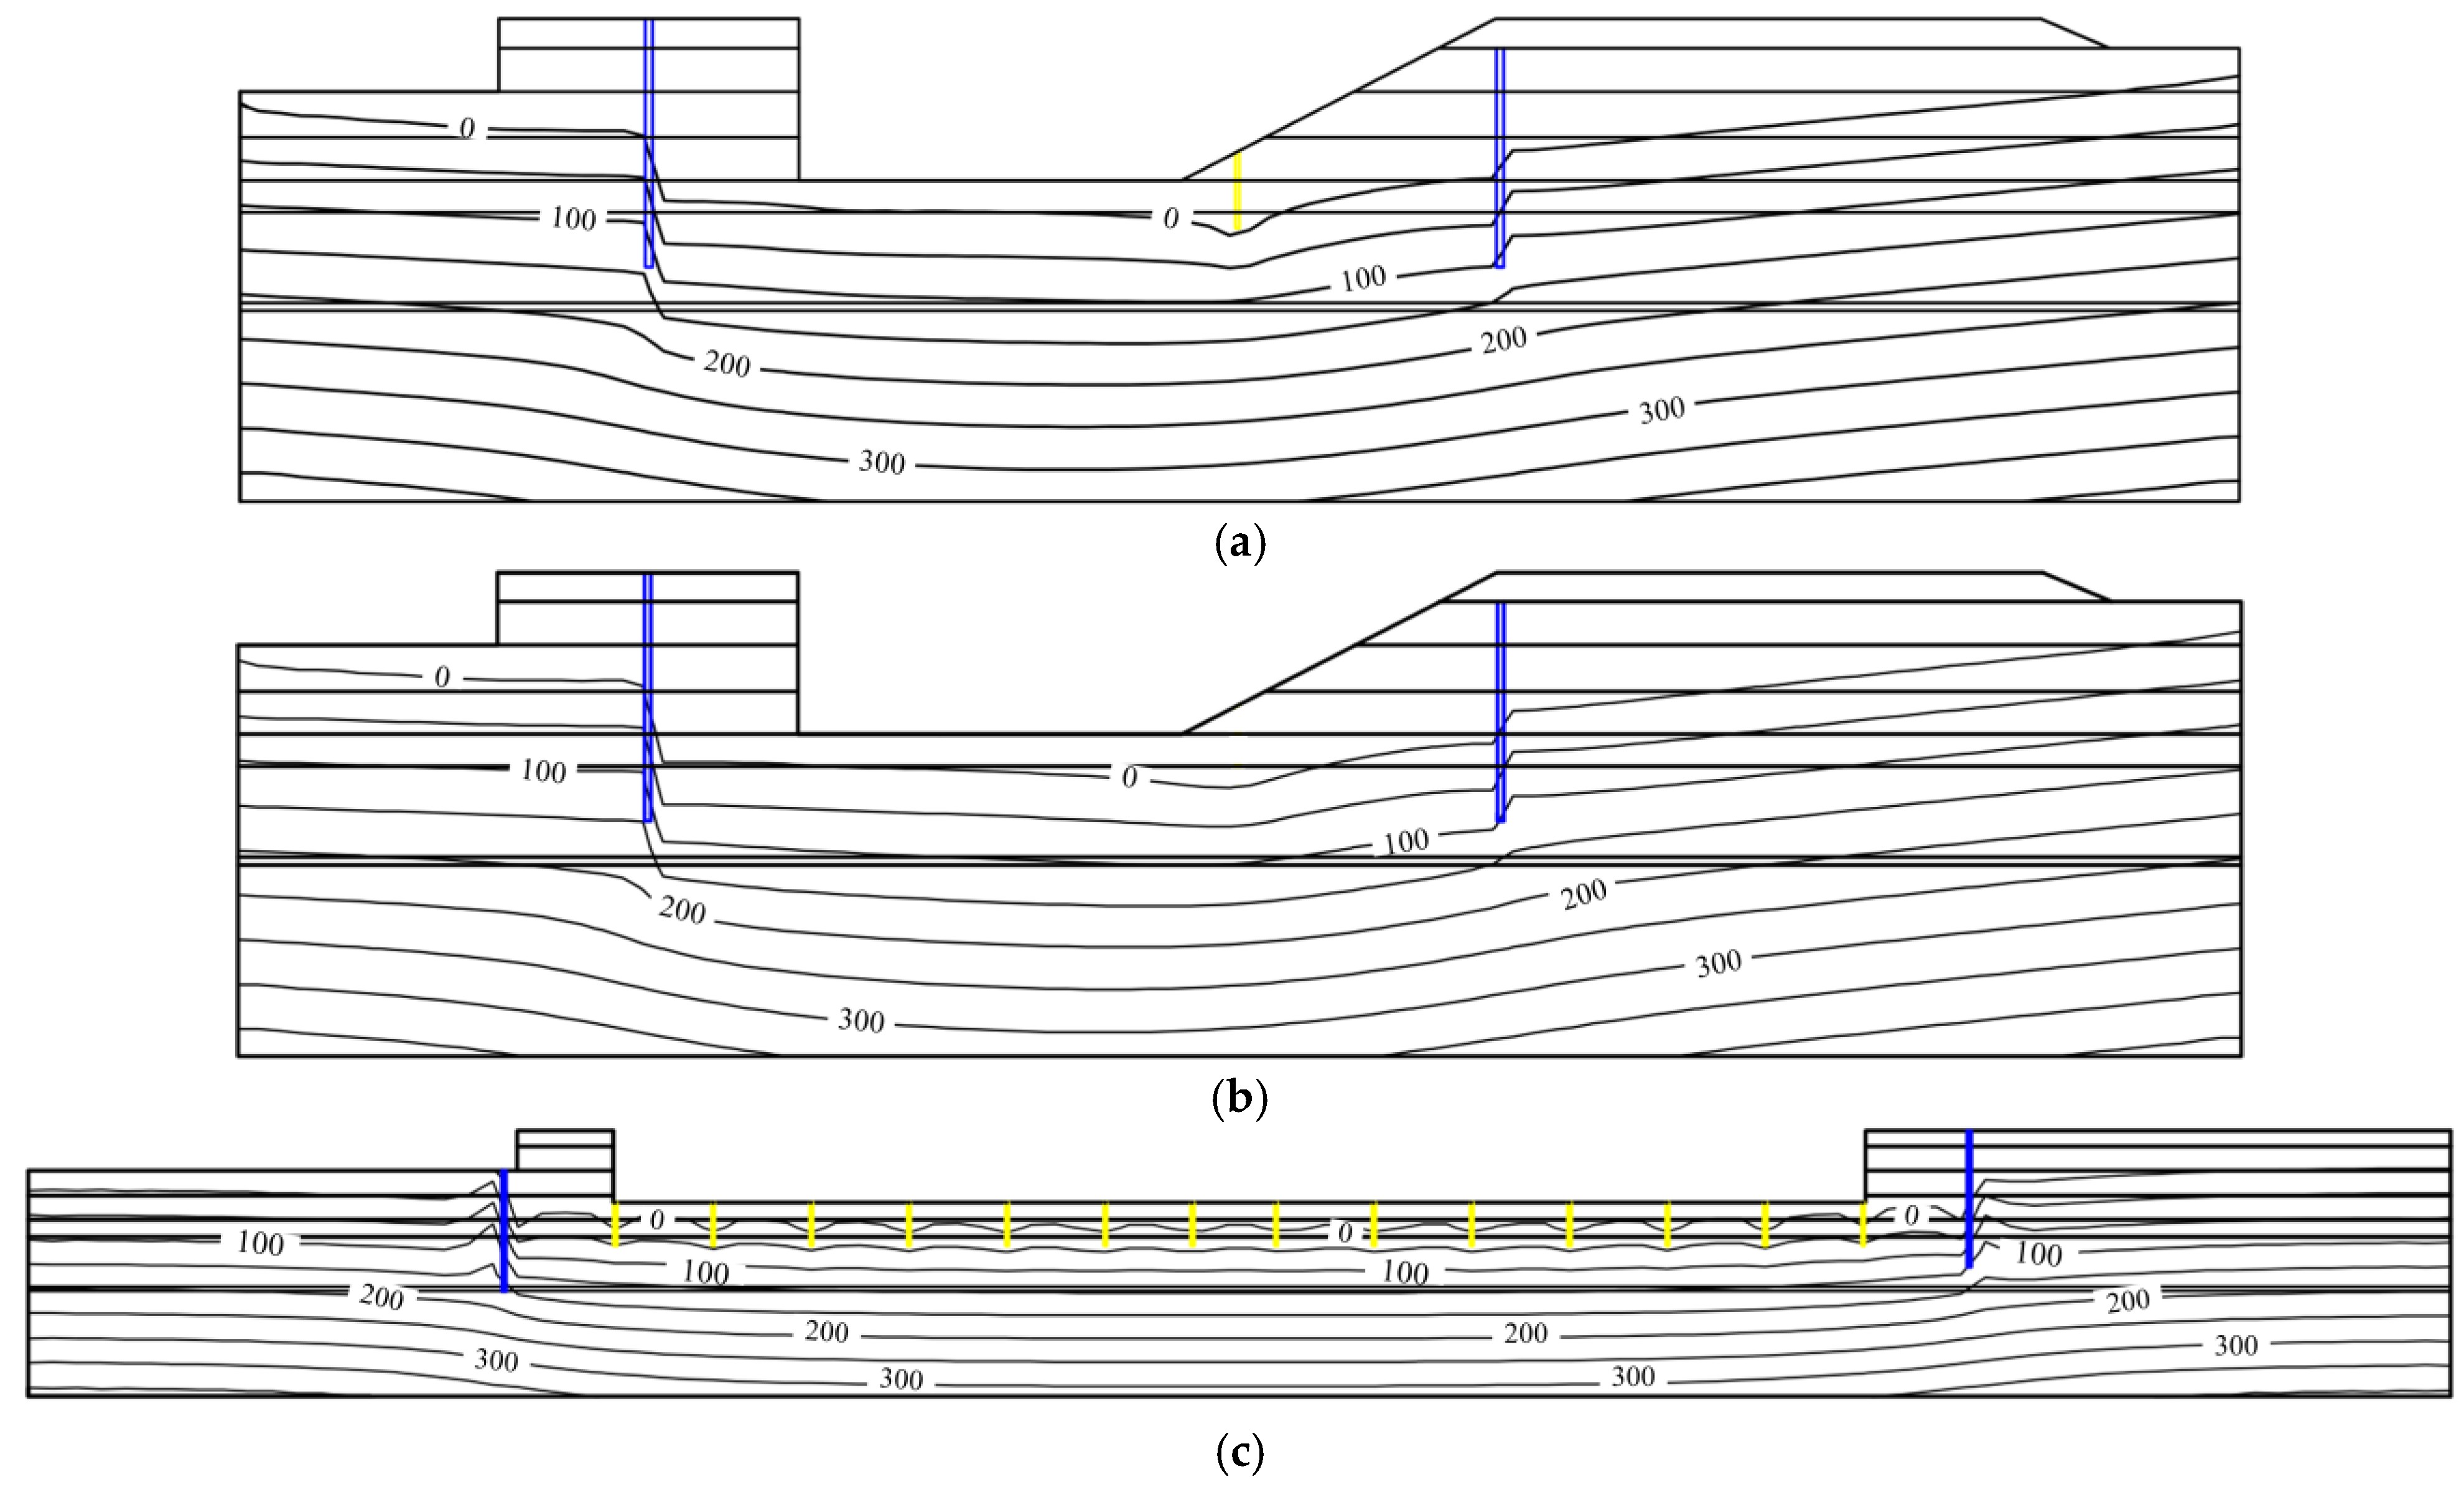
The numerical analysis indicates that when the anti-seepage system is intact, the seepage resistance of the anti-seepage wall remains within normal parameters, and drainage in the basement operates effectively. The zero-pressure boundary is situated 2 m below the bottom slab, with each soil layer’s gradient remaining below the critical threshold, thereby satisfying design specifications.
(2)
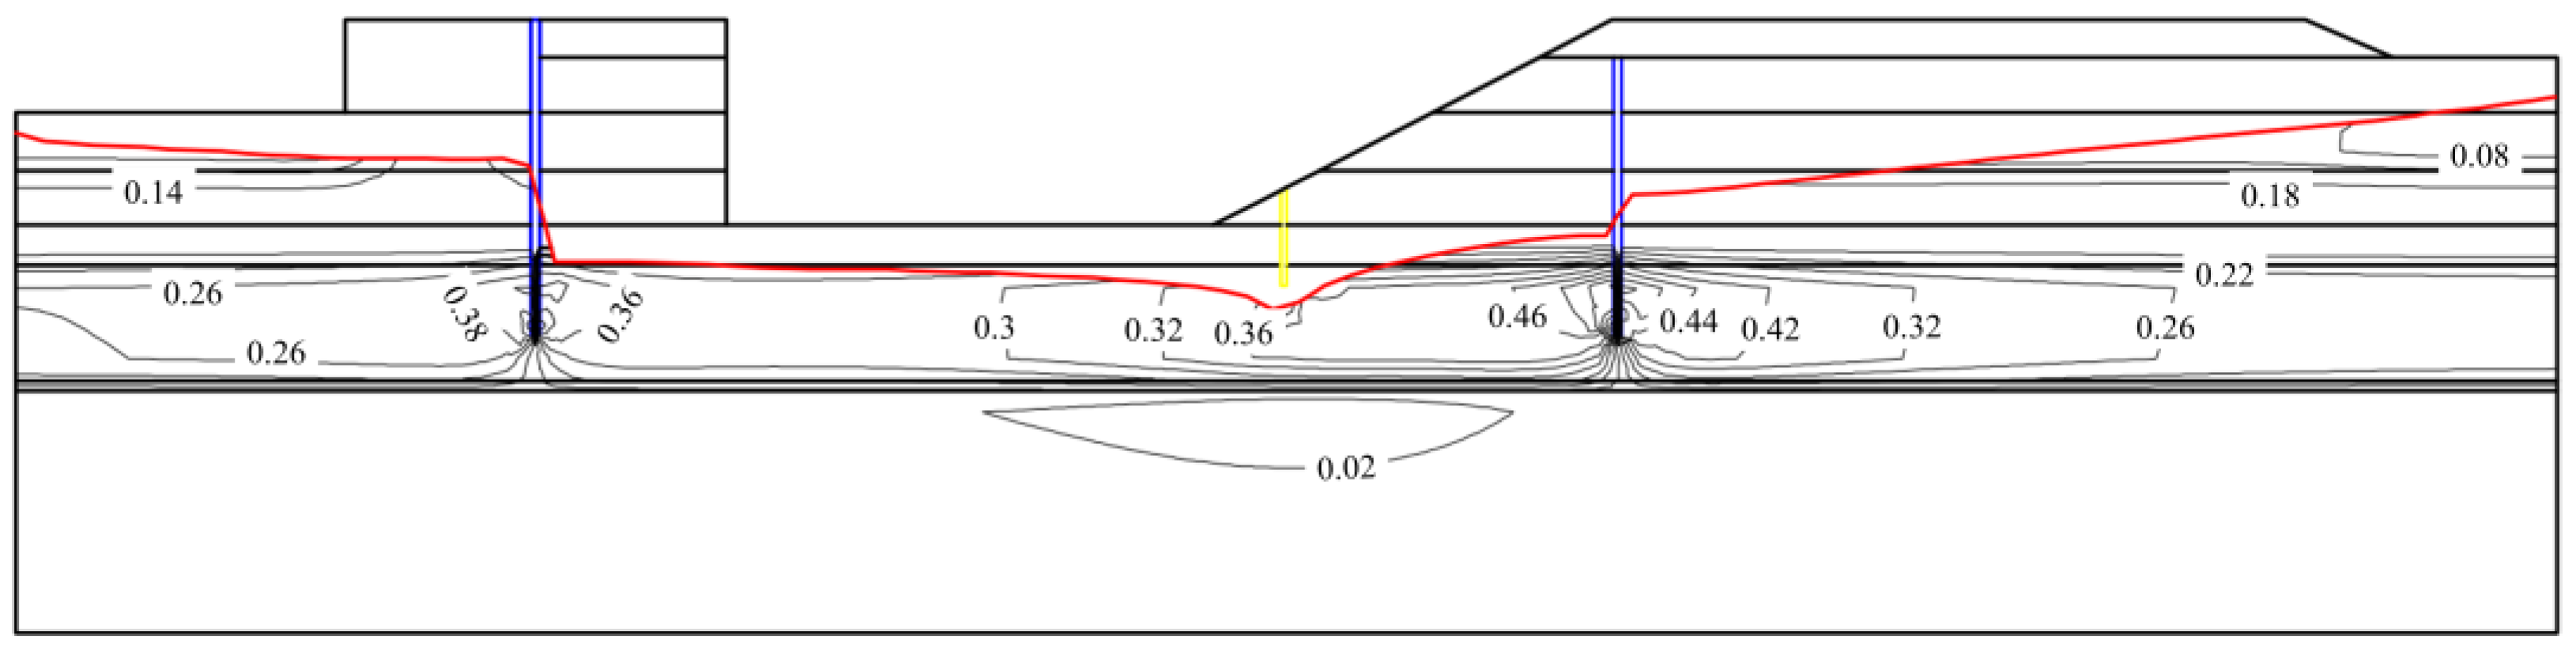
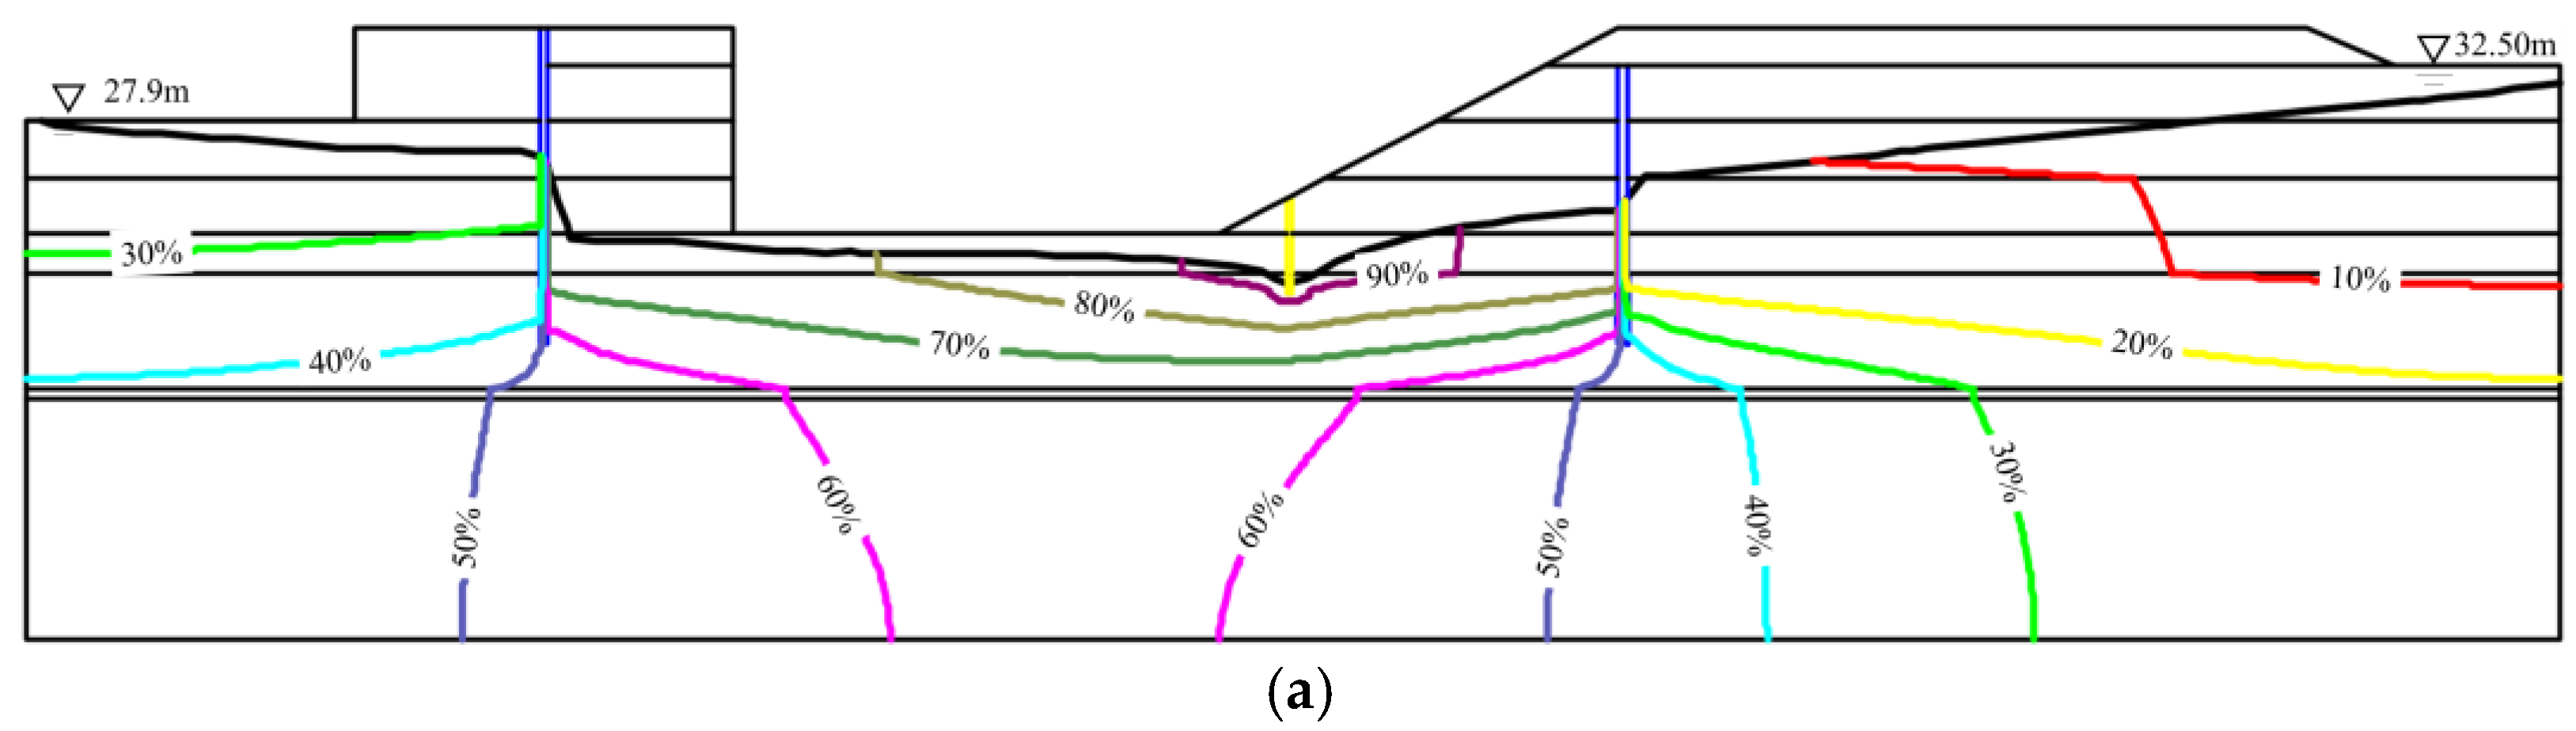
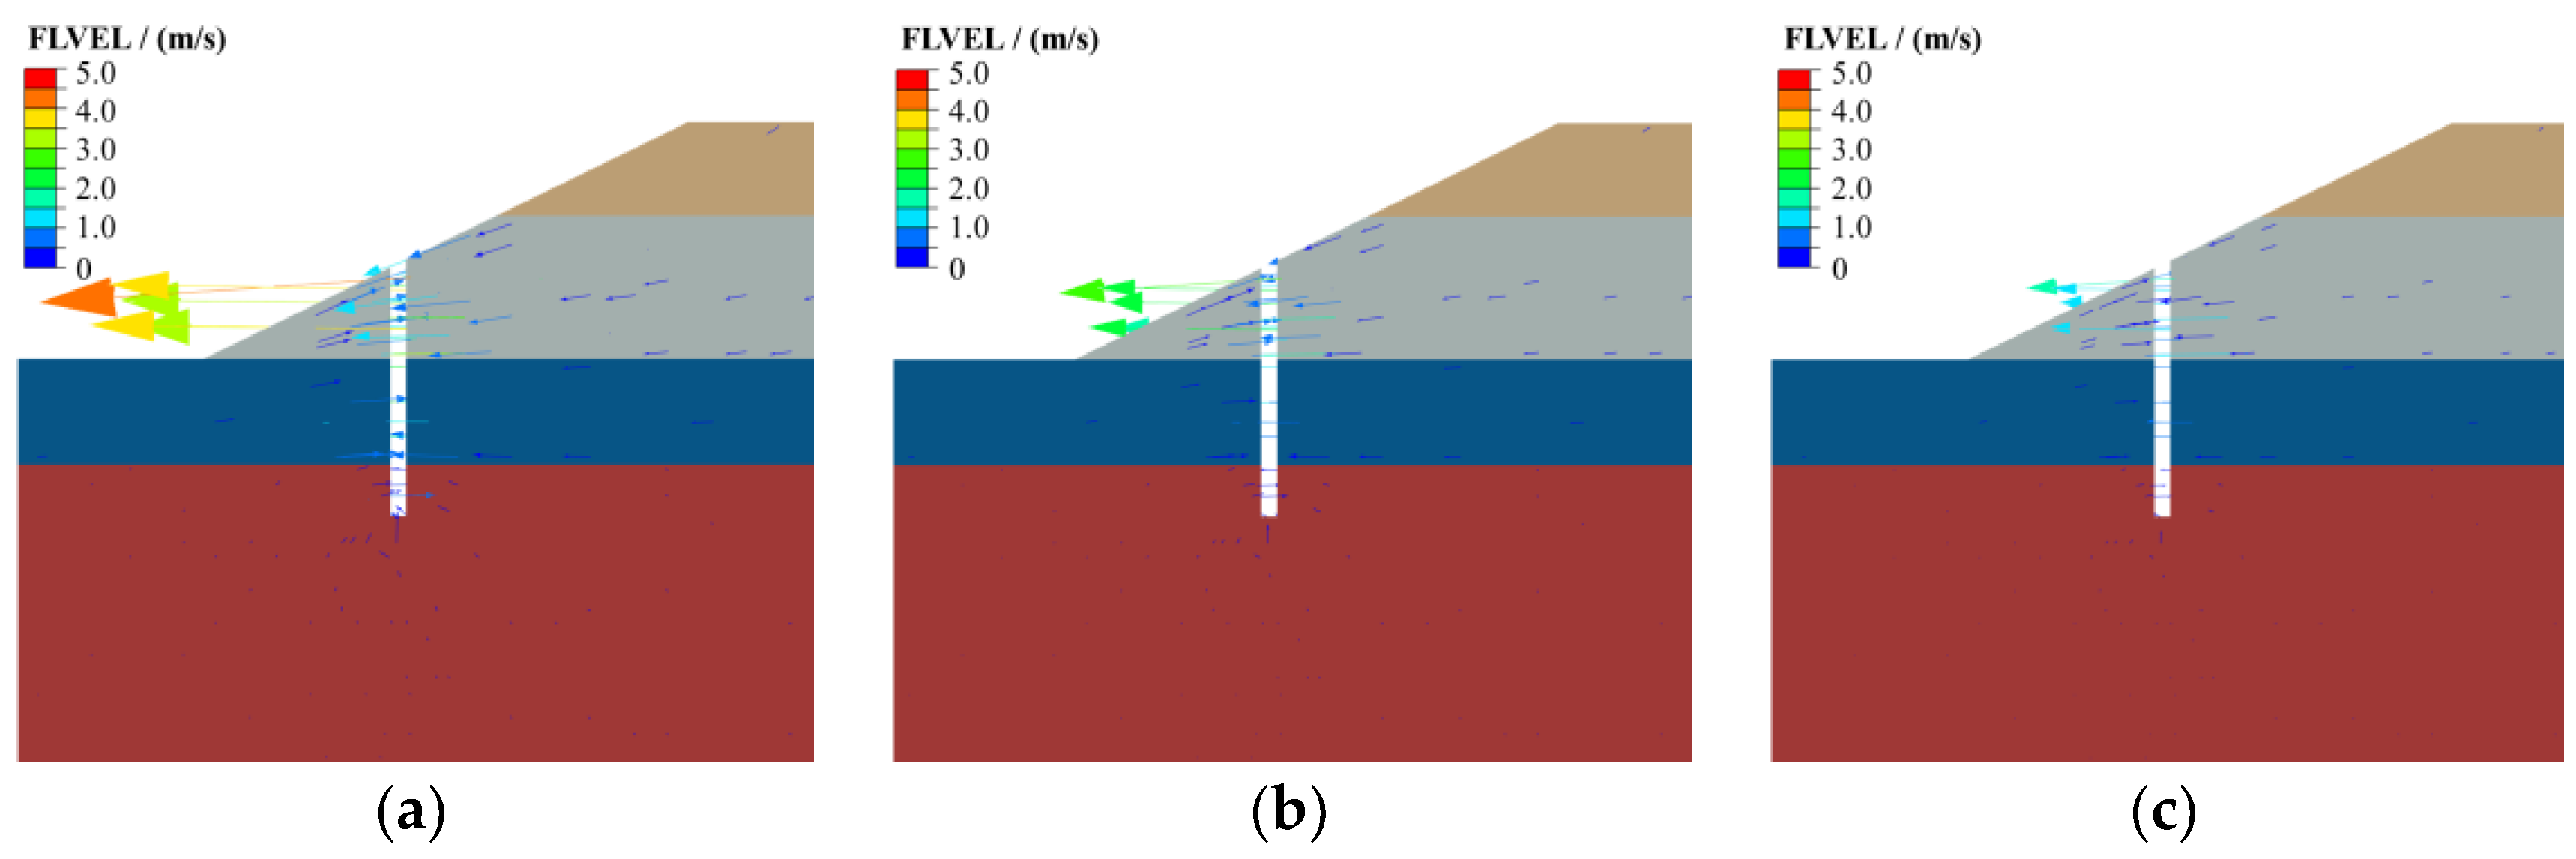
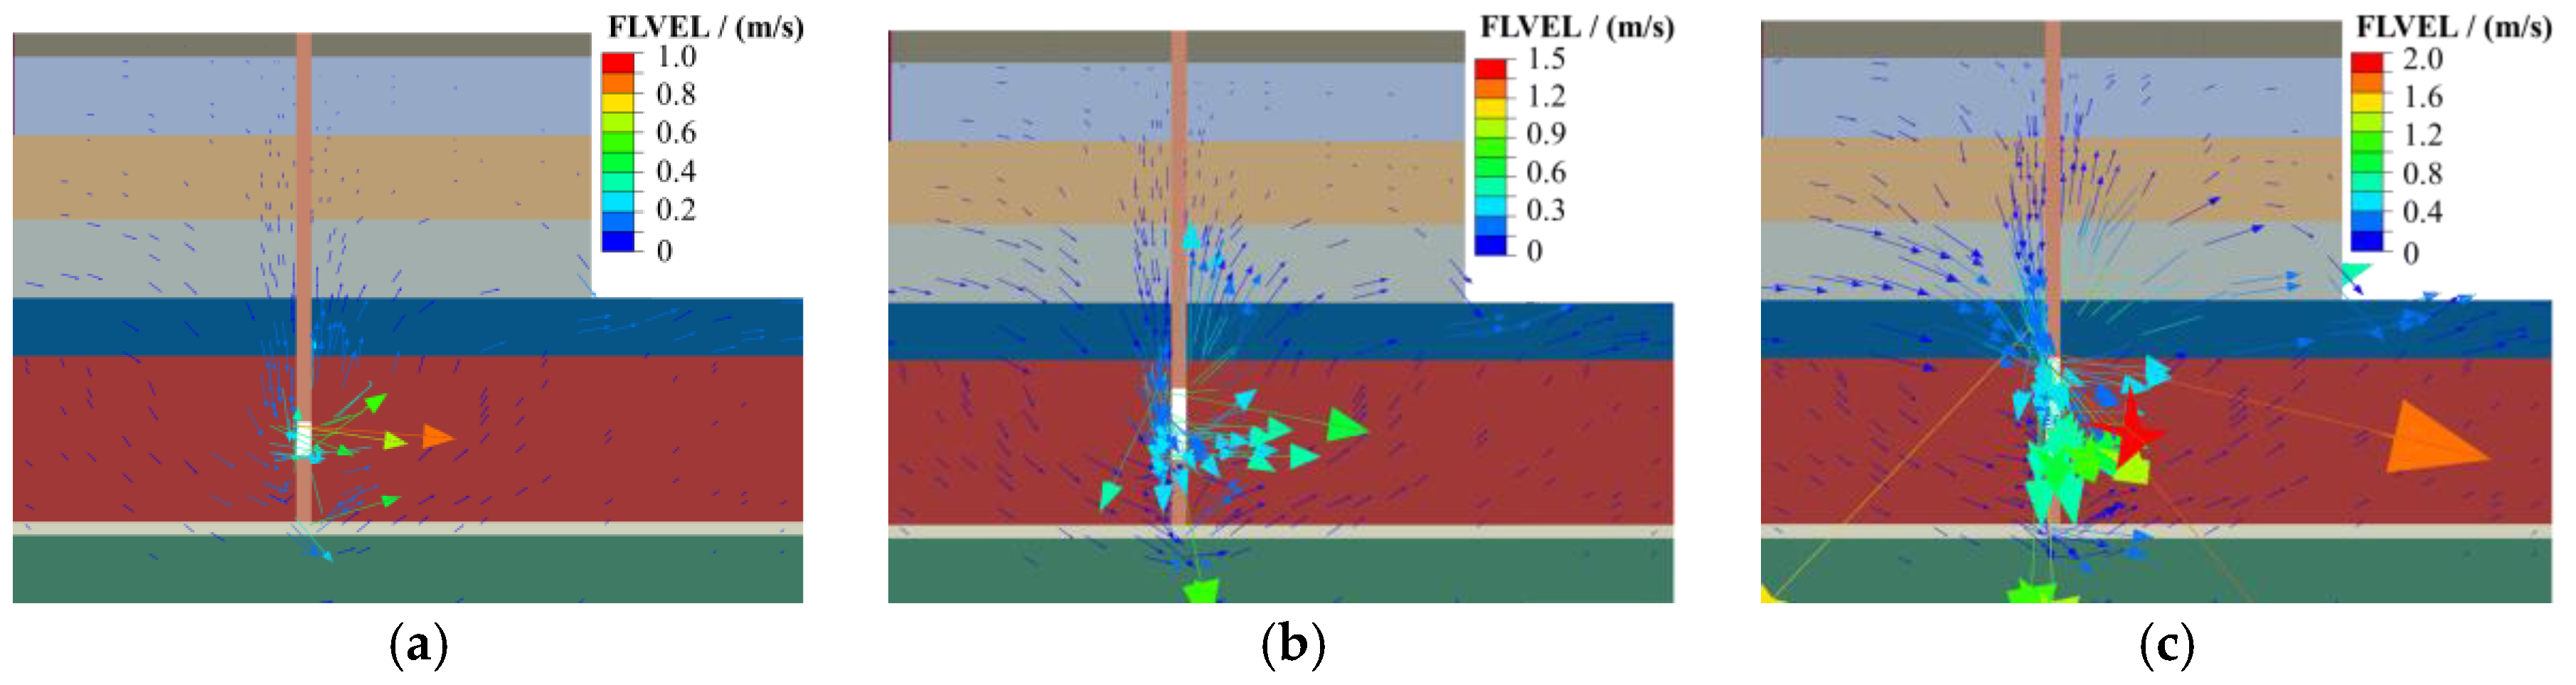
Clogging of dewatering wells and defects in the diaphragm wall significantly influence the seepage characteristics within the pit. Increased severity of clogging in dewatering wells correlates with a larger area of the diaphragm wall defects, resulting in heightened water head elevation. Furthermore, assessing seepage failure based on gradient metrics proves inadequate under conditions characterized by dewatering well clogging.
(3)
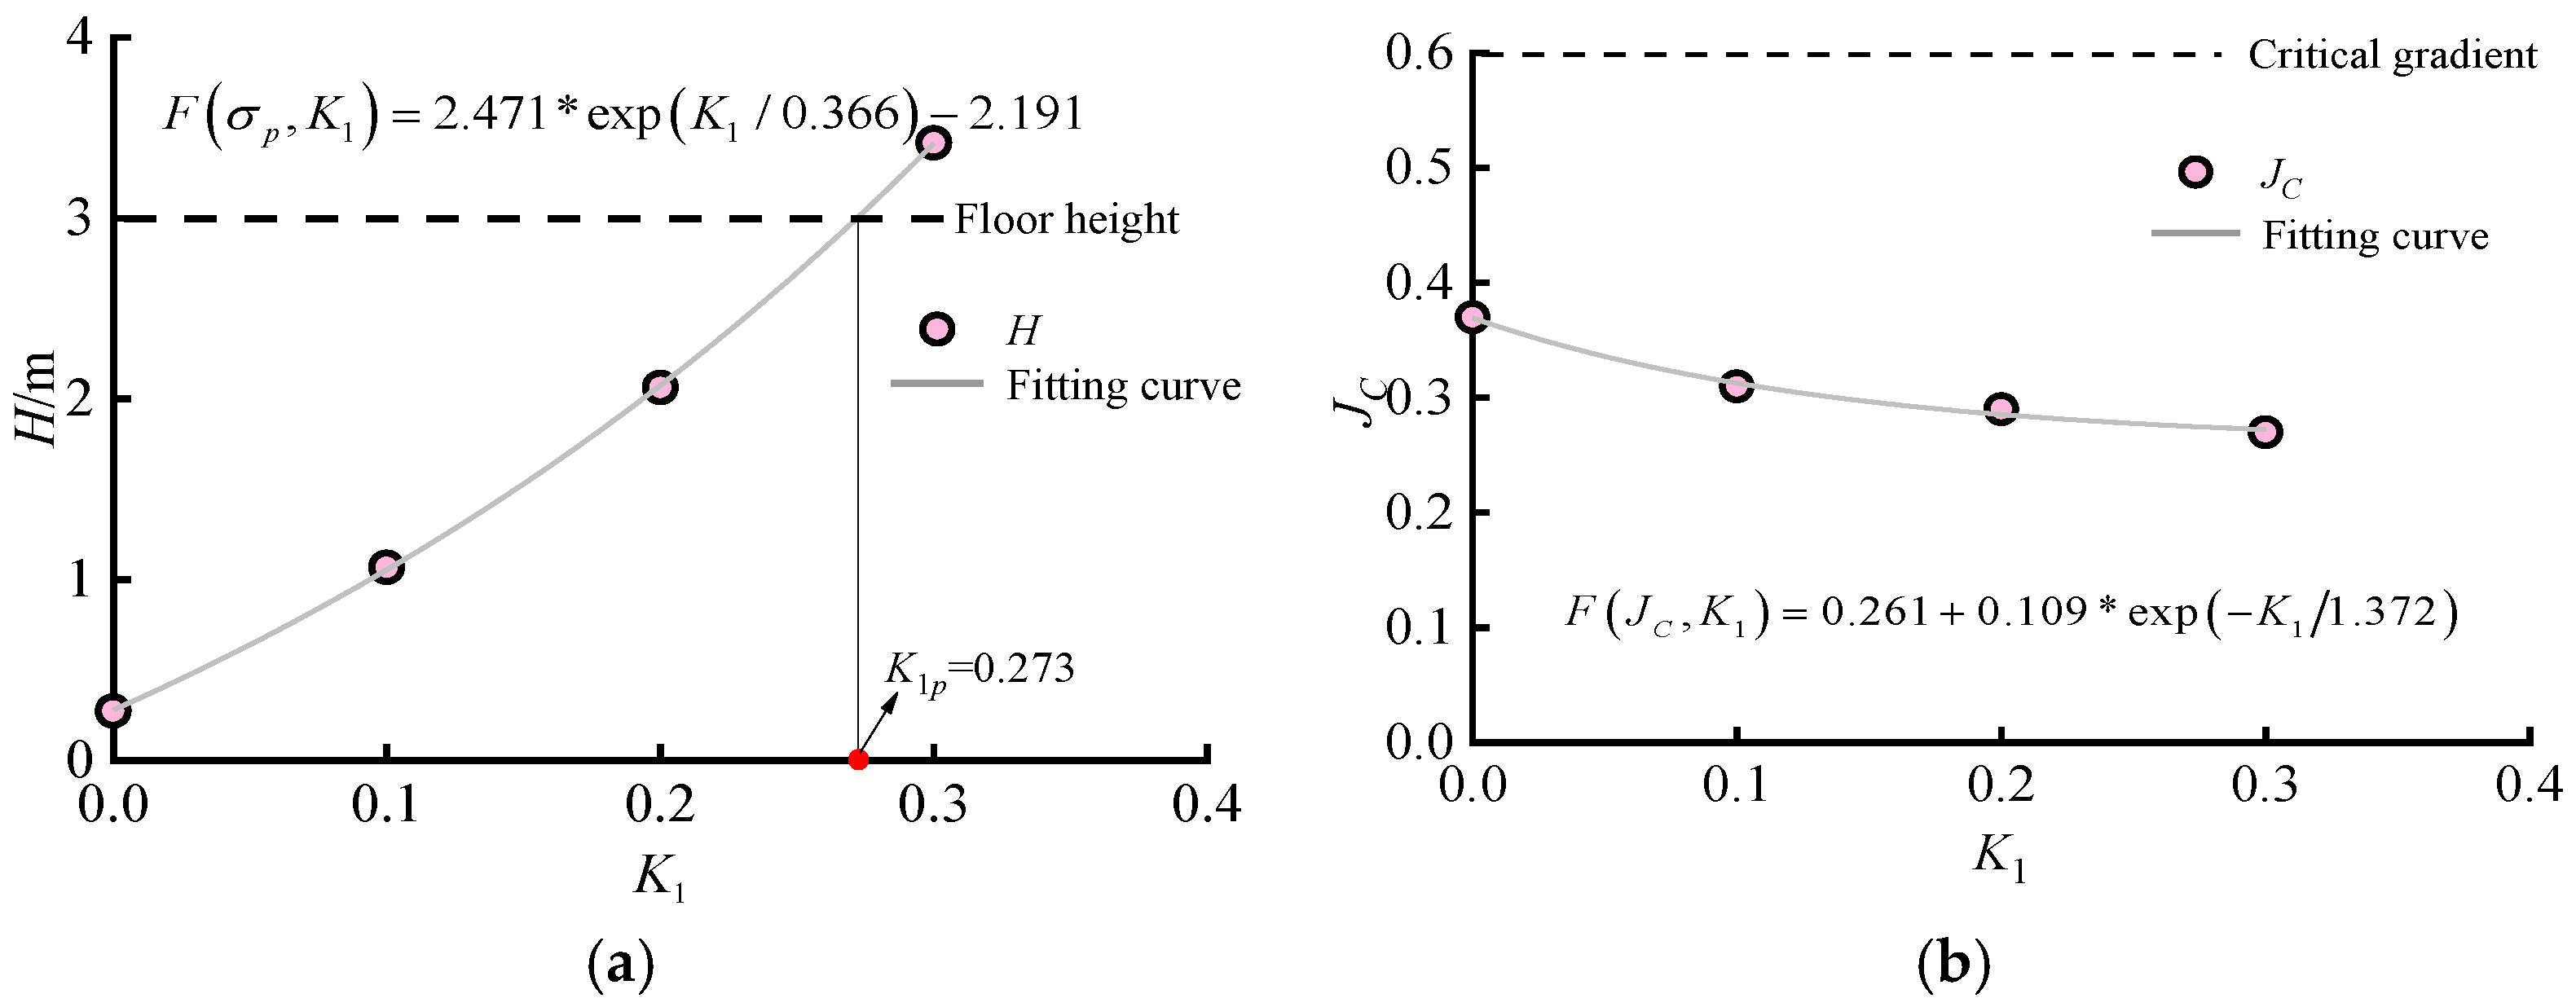
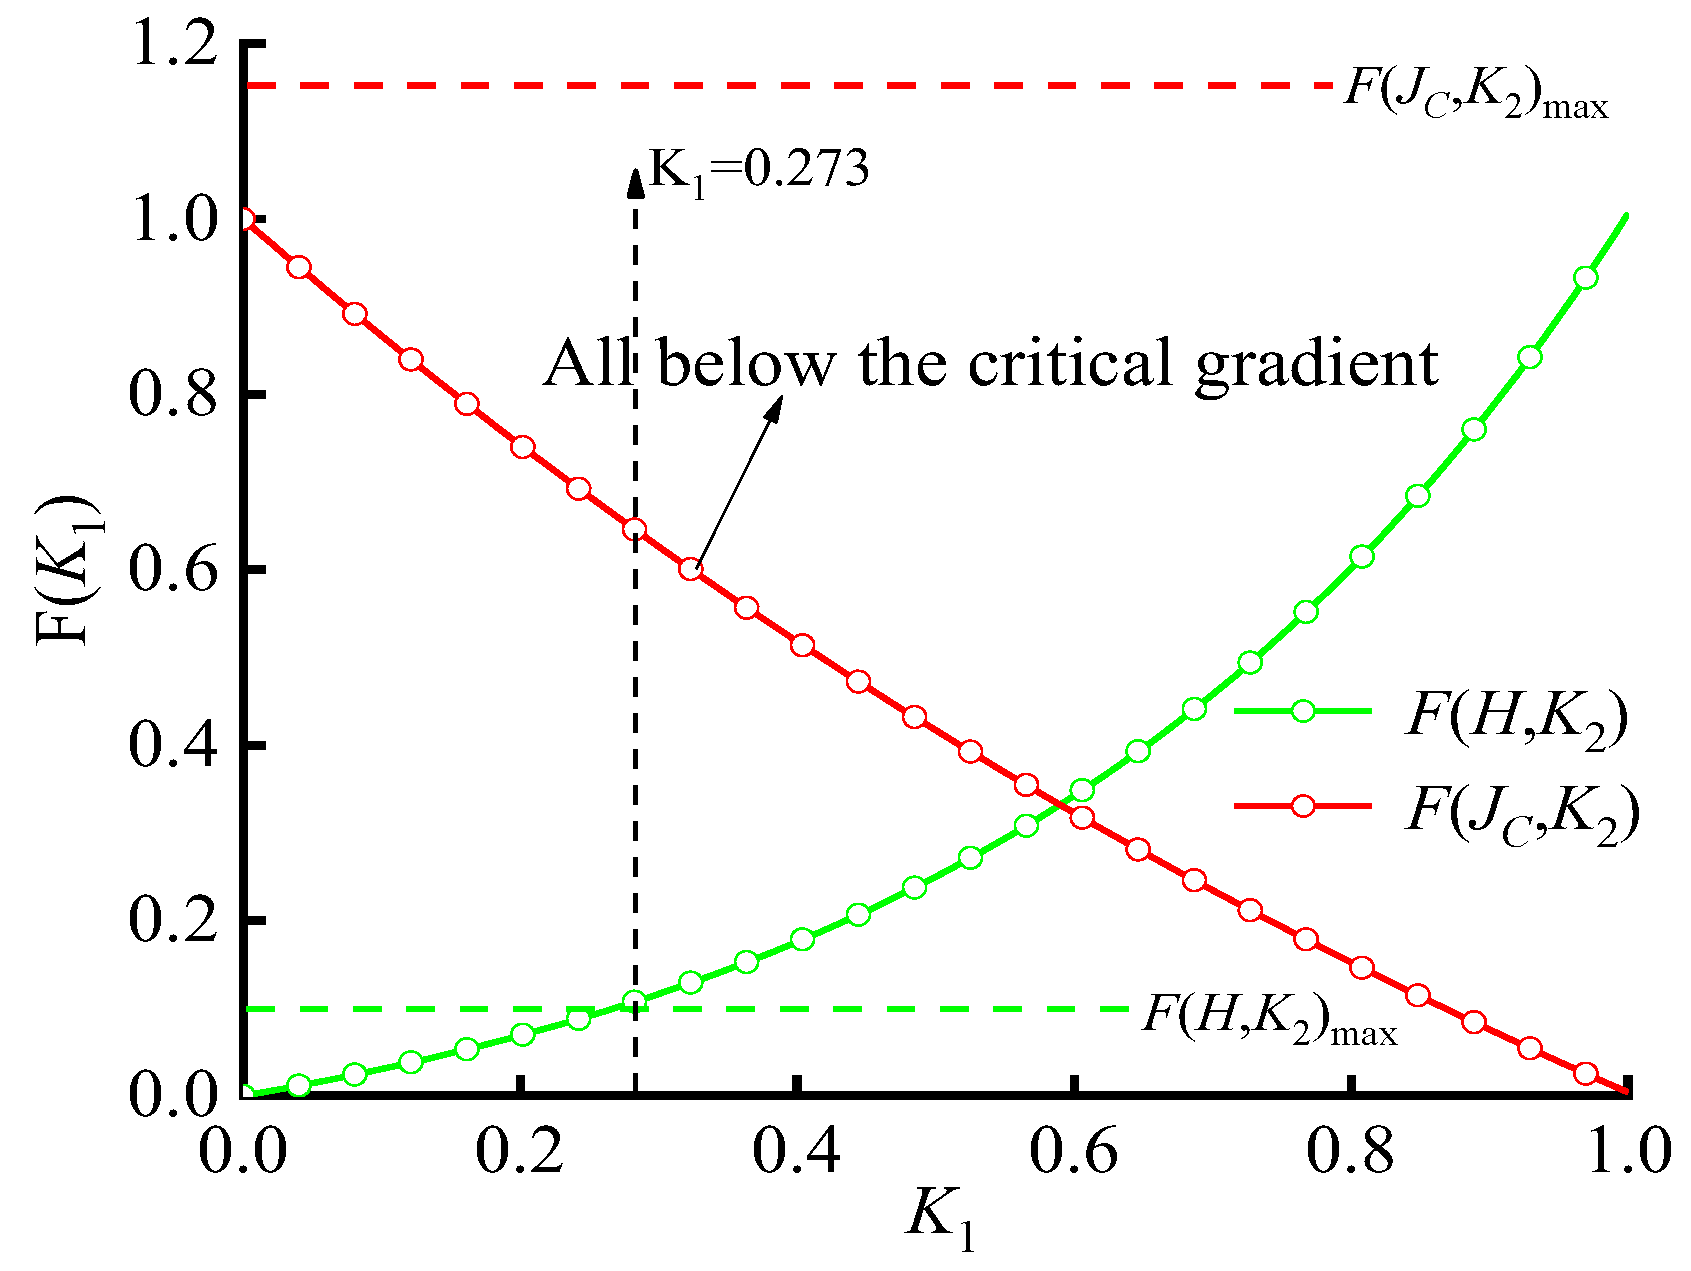
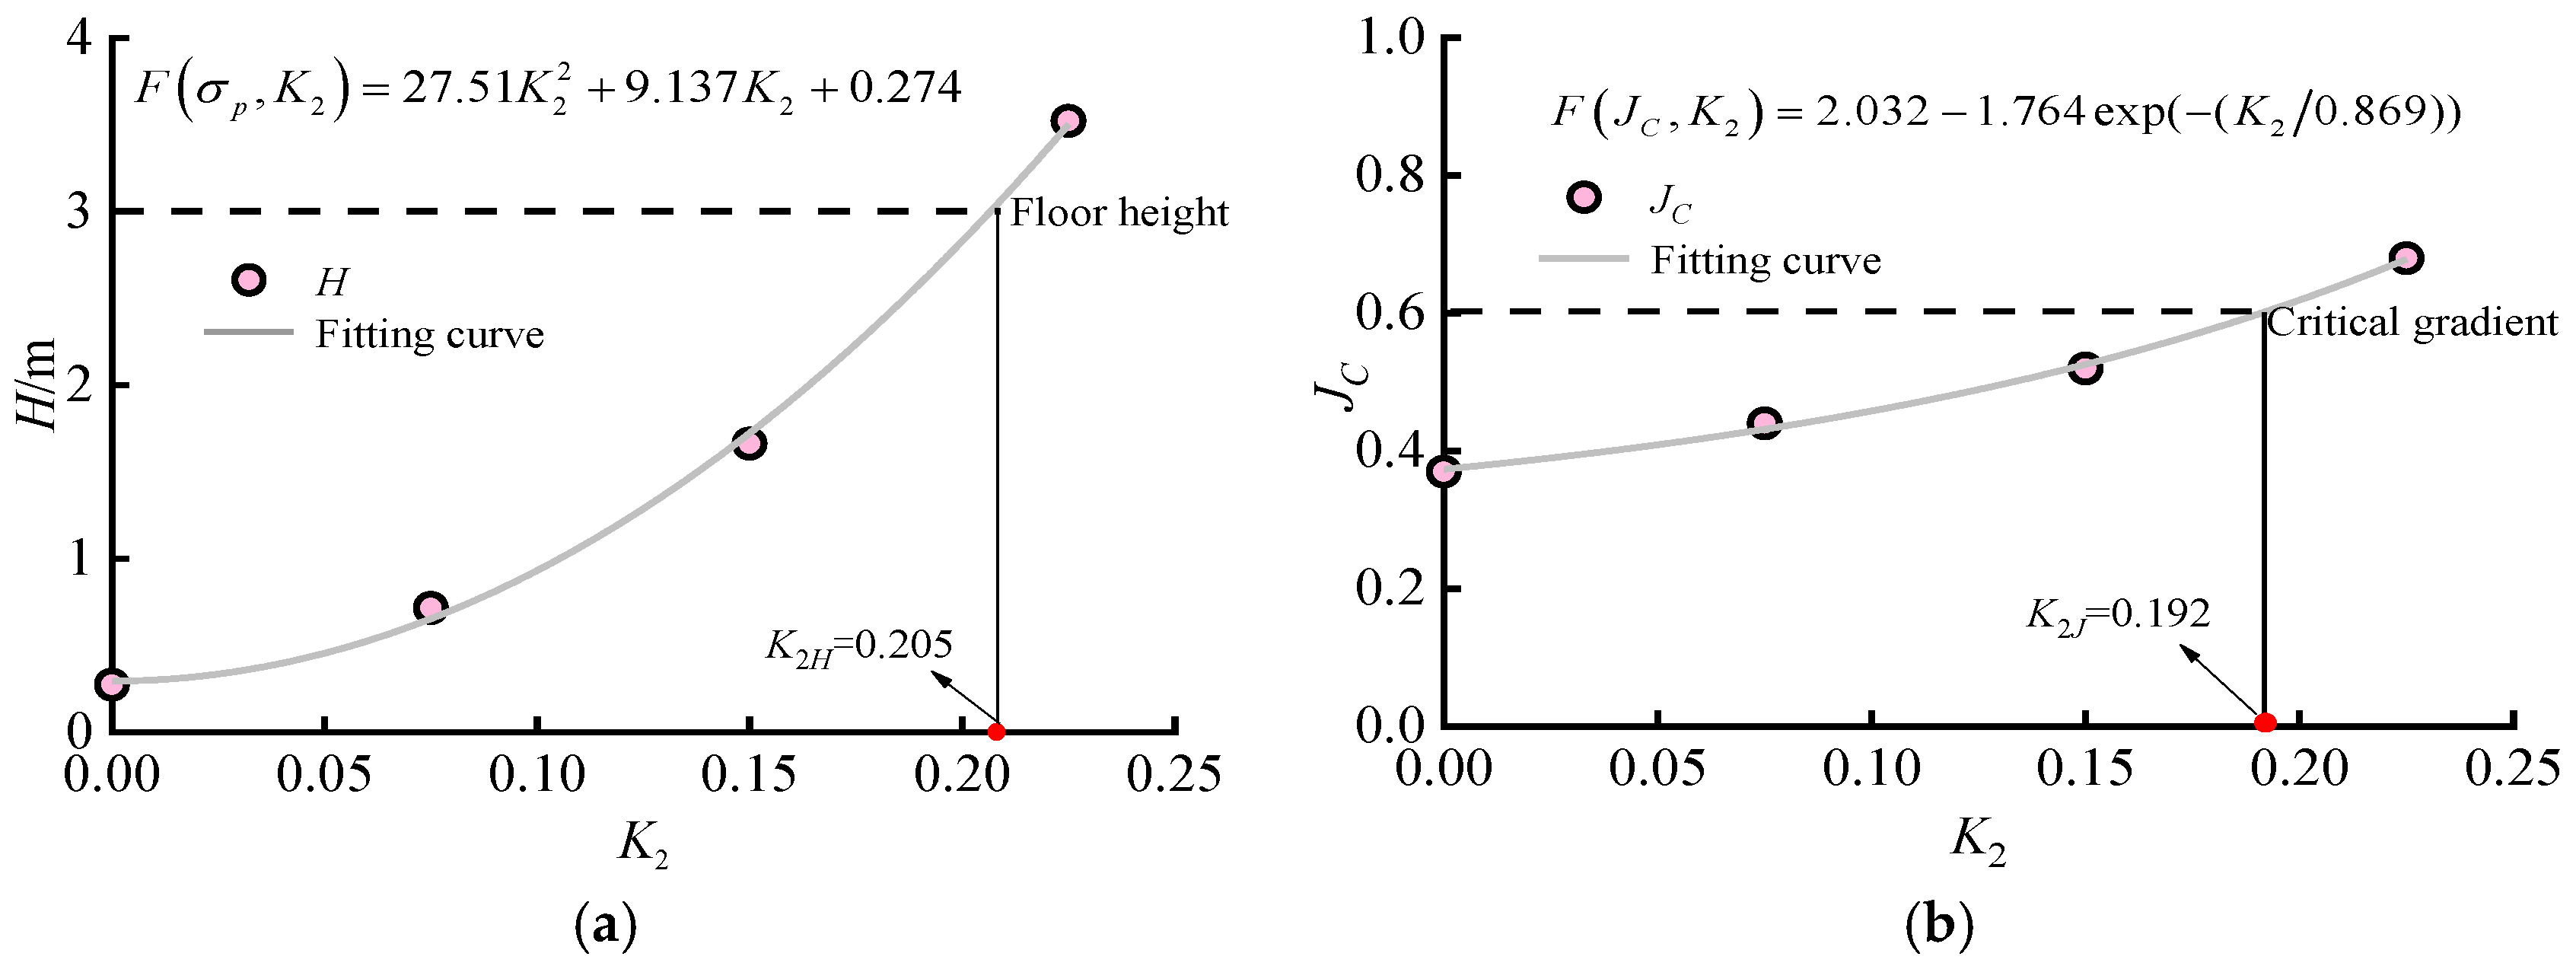
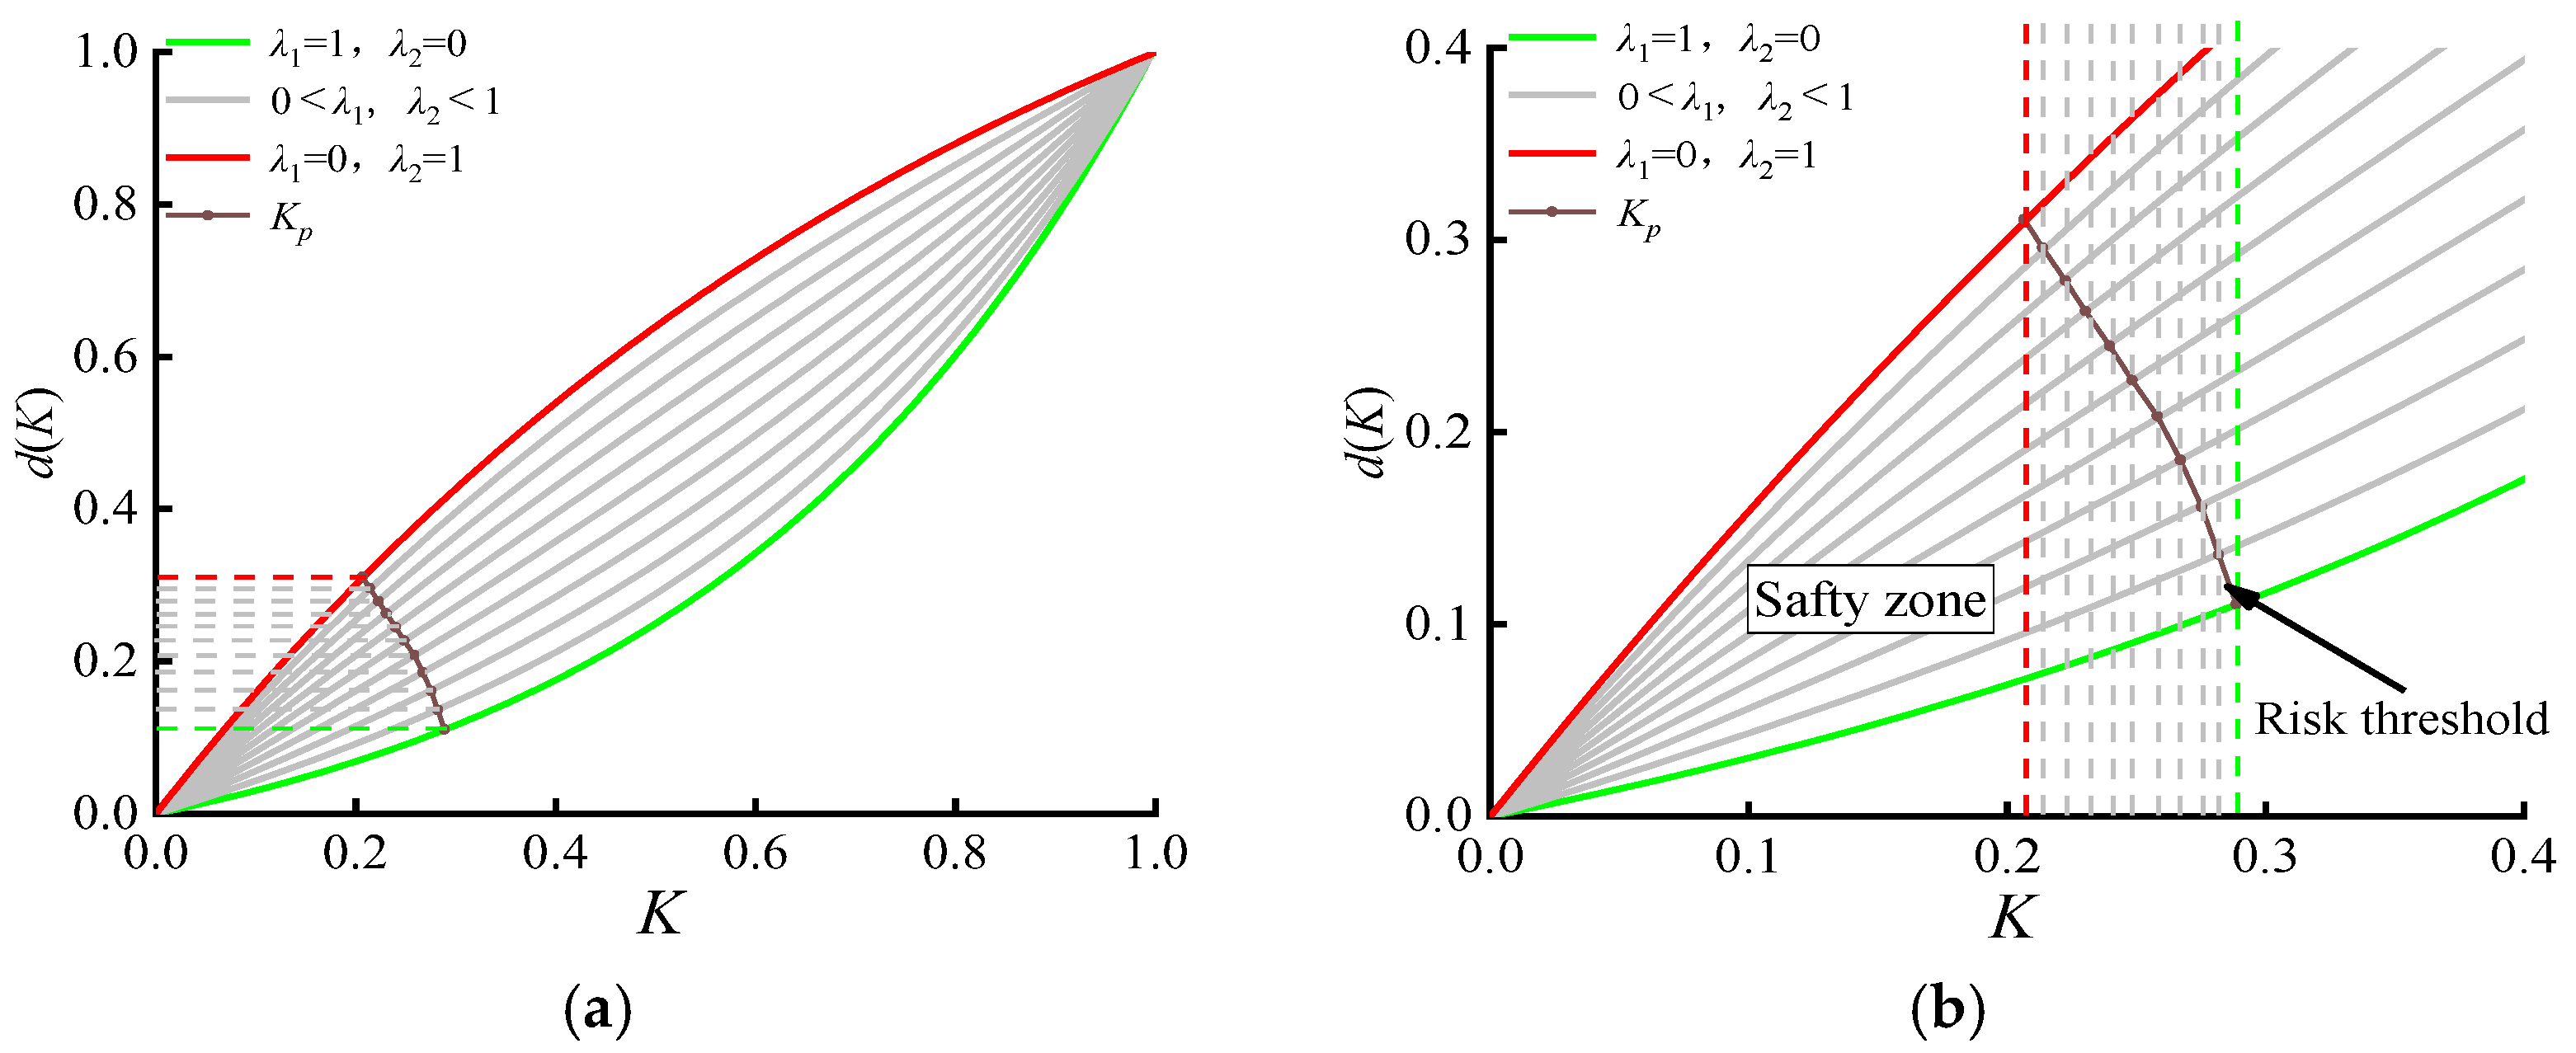
An effectiveness function was derived from two risk factors: dewatering well clogging and diaphragm wall defects; distinct weights were assigned to these factors to formulate a comprehensive evaluation function for seepage failure risk. This approach enables an effective delineation of safe ranges concerning seepage actions.
The findings presented herein provide valuable insights for constructing anti-seepage systems and conducting safety evaluations related to seepage in ship lock pit engineering.

Author Contributions

Conceptualization, J.H. and J.X.; methodology, J.H.; software, H.R.; validation, H.R. and J.X.; formal analysis, J.X. and J.H.; investigation, J.H. and J.X.; resources, J.H.; data curation, H.R. and J.H.; writing—original draft preparation, J.H. and H.R.; writing—review and editing, J.H. and J.X.; project administration, J.H and H.R. All authors have read and agreed to the published version of the manuscript.

Funding

This research was funded by the Fundamental Research Funds for Central Public Welfare Research Institutes (No. Y423008).

Data Availability Statement

The data presented in this study are available on request from the corresponding author.

Acknowledgments

The authors sincerely appreciate the anonymous reviewer and editors’ valuable comments and suggestions to improve the manuscript.

Conflicts of Interest

Author Jian Xie was employed by the company Guangxi Datengxia Water Conservancy Hub Development Co., Ltd. The remaining authors declare that the research was conducted in the absence of any commercial or financial relationships that could be construed as a potential conflict of interest.

References

  1. Niu, Z.Y.; Niu, J.Y. Research on calculation of node cost water prices for long distance water diversion projects: A case study of Nanshan Canal. Water Res. Dev. Res. 2024, 278, 83–89. (In Chinese) [Google Scholar]
  2. Farinha, A.; Sousa, L.; Reis, L. Evaluating lock gates’ strength due to ship collisions: A Douro waterway lock gates case study. Mar. Struct. 2018, 60, 261–278. [Google Scholar] [CrossRef]
  3. Li, W.J.; Dai, J.L.; Xiao, Y.; Yang, S.F.; Chen, S. Estimating waterway freight demand at Three Gorges ship lock on Yangtze River by backpropagation neural network modeling. Marit. Econ. Logist. 2020, 23, 495–521. [Google Scholar] [CrossRef]
  4. Xu, I.C.; Xuan, G.X.; Li, Y.; Li, Z.H.; Hu, Y.G.; Jin, Y.Z.; Huang, Y. Study on the squat of extra-large scale ship in the Three Gorges ship lock. Ocean Eng. 2016, 123, 65–74. [Google Scholar] [CrossRef]
  5. Todor, B.; Vladimir, B.; Filip, K.; Željko, K. Adaptable Fuzzy Expert System for Ship Lock Control Support. J. Navig. 2016, 69, 1341–1356. [Google Scholar]
  6. Feng, Y.T.; Yan, F.Y.; Wu, L.R.; Lu, G.Y.; Liu, T.Y. Numerical Analyses of Slope Stability Considering Grading and Seepage Prevention. Water 2023, 15, 1745. [Google Scholar] [CrossRef]
  7. Jin, L.X.; Wei, J.J.; Luo, C.W.; Tian, Q.H. Slope stability analysis based on improved radial movement optimization considering seepage effect. Alex. Eng. J. 2023, 79, 591–607. [Google Scholar] [CrossRef]
  8. Qu, X.L.; Zhang, Y.K.; Chen, Y.R.; Chen, Y.Y.; Qi, C.Z.; Pasternak, E.; Dyskin, A. A Coupled Seepage–Deformation Model for Simulating the Effect of Fracture Seepage on Rock Slope Stability Using the Numerical Manifold Method. Water 2023, 15, 1163. [Google Scholar] [CrossRef]
  9. Jiang, X.G.; Zhu, Z.Y.; Chen, H.Y.; Deng, M.F.; Niu, Z.P.; Deng, H.X.; Zou, Z.Y. Natural dam failure in slope failure mode triggered by seepage. Geomat. Nat. Hazards Risk 2020, 11, 698–723. [Google Scholar] [CrossRef]
  10. Ansari, S.U.; Hussain, M.; Ahmad, S.M.; Rashid, A.; Mazhar, S. A stabilized mixed finite element method for Darcy flow. Comput. Methods Appl. Mech. Eng. 2017, 191, 4341–4370. [Google Scholar] [CrossRef]
  11. Rui, H.X.; Zhang, J.Y. A stabilized mixed finite element method for coupled Stokes and Darcy flows with transport. Comput. Methods Appl. Mech. Eng. 2017, 315, 169–189. [Google Scholar] [CrossRef]
  12. Song, J.P.; Rui, H.G. A combined stabilized mixed finite element and discontinuous Galerkin method for coupled Stokes and Darcy flows with transport. Comput. Math. Appl. 2022, 120, 92–104. [Google Scholar] [CrossRef]
  13. Ren, D.C.; Liu, Y.C.; Zhu, G.S. Analysis on seepage of high excavated slopes of cracked rock in the ship locks of Three Gorges. Chn. J. Geotech. Eng. 2007, 11, 180–183. (In Chinese) [Google Scholar]
  14. Shi, C.G.; Sun, X.H.; Liu, S.L.; Cao, C.Y.; Liu, L.H.; Lei, M.F. Analysis of Seepage Characteristics of a Foundation Pit with Horizontal Waterproof Curtain in Highly Permeable Strata. Water 2021, 13, 1303. [Google Scholar] [CrossRef]
  15. Huang, J.S.; Gu, L.C.; He, Z.; Yu, J. Analytical Solution for the Steady Seepage Field of an Anchor Circular Pit in Layered Soil. Buildings 2023, 14, 74. [Google Scholar] [CrossRef]
  16. Tracy, F.T.; Vahedifard, F. Analytical solution for coupled hydro-mechanical modeling of infiltration in unsaturated soils. J. Hydrol. 2022, 612, 128198. [Google Scholar] [CrossRef]
  17. Deng, Y.S.; Guo, Y.; Zou, B.P.; Wang, J.X.; Liu, X.T.; Chen, Q.Z.; Kong, B.W.; Liang, S.J. Failure analysis and zoning control of water gushing in foundation pit. Eng. Fail. Anal. 2023, 145, 107029. [Google Scholar] [CrossRef]
  18. Xiong, H.; Zhang, Z.M.; Sun, X.M.; Yin, Z.Y.; Chen, X.S. Clogging effect of fines in seepage erosion by using CFD–DEM. Comput. Geotech. 2022, 152, 105013. [Google Scholar] [CrossRef]
  19. Nan, X.; Liu, X.X.; Wu, B.Q.; Zhang, H.M.; Song, K.L.; Wang, X.D. Coupled CFD-DEM simulation and experimental study of particle distribution and accumulation during tailings seepage process. J. Clean. Prod. 2023, 427, 139229. [Google Scholar] [CrossRef]
  20. Wei, F.R.; Wang, H.N.; Zeng, G.S.; Jiang, M.J. Seepage flow around twin circular tunnels in anisotropic ground revealed by an analytical solution. Undergr. Space 2023, 10, 1–14. [Google Scholar] [CrossRef]
  21. Hu, Z.; Yang, Z.X.; Guo, N.; Zhang, Y.D. Multiscale modeling of seepage-induced suffusion and slope failure using a coupled FEM–DEM approach. Comput. Methods Appl. Mech. Eng. 2022, 398, 115177. [Google Scholar] [CrossRef]
  22. Yu, J.K.; Yang, X.X.; Deng, P.B.; Chen, W.B. Analytical Solution for a Steady Seepage Field of a Foundation Pit in Layered Soil. Int. J. Geomech. 2022, 22, 1342–1367. [Google Scholar] [CrossRef]
  23. Yuan, C.Y.; Hu, Z.H.; Zhu, Z.; Yuan, Z.J.; Fan, Y.X.; Guan, H.; Li, L. Numerical Simulation of Seepage and Deformation in Excavation of a Deep Foundation Pit under Water-Rich Fractured Intrusive Rock. Geofluids 2021, 2021, 6628882. [Google Scholar] [CrossRef]
  24. Tony, L.; Zhan, T.; Qiu, Q.W.; Xu, W. Analytical solution for infiltration and deep percolation of rainwater into a monolithic cover subjected to different patterns of rainfall. Comput. Geotech. 2016, 77, 1–10. [Google Scholar]
  25. Bi, J.F.; Jiang, H. Water infiltration in drained circular tunnels: An analytical solution and its simplification. Geotechnique 2023, 17, 1–12. [Google Scholar] [CrossRef]
  26. Wu, L.Z.; He, B.; Peng, J.B. Analysis of Rainfall-Caused Seepage into Underlying Bedrock Slope Based on Seepage Deformation Coupling. Int. J. Geomech. 2024, 24, 263497. [Google Scholar] [CrossRef]
  27. Sharma, V.; Fujisawa, K.; Murakami, M. Space-Time Finite Element Method for Transient and Unconfined Seepage Flow Analysis. Finite Elem. Anal. Des. 2023, 197, 103632. [Google Scholar] [CrossRef]
  28. Lei, Y.; Dai, Q.H.; Zhang, B.; Yang, J.S. A Gradient Smoothing Technique-Based S-FEM for Simulating the Full Impacts of Anomalies on Seepage Solutions and its Application in Multi-Parameter Seepage Inversion. Water Resour. Manag. 2024, 38, 753–773. [Google Scholar] [CrossRef]
  29. Wan, Z.Y.; Yun Li, Y.; Wang, X.G.; An, J.F.; Cheng, L.; Liao, Y.P. Effect of ship-lock-induced surges on navigation safety in a branched lower approach channel system. J. Hydroinform. 2022, 24, 481–496. [Google Scholar] [CrossRef]
  30. Wang, H.Z.; Zou, Z.J. Numerical study on hydrodynamic interaction between a berthed ship and a ship passing through a lock. Ocean Eng. 2014, 88, 409–425. [Google Scholar] [CrossRef]
  31. Zhou, Z.; Zhou, Z.W.; Li, Y.B.; Vanapalli, K.S.; Huang, H.L. Analysis of deformation and leakage performance of Xiluodu reservoir dam foundation using a coupled two-factor stress-deformation-seepage model. Eng. Geol. 2022, 310, 106871. [Google Scholar] [CrossRef]
  32. Fan, X.L.; Wu, Z.Y.; Liu, L.J.; Wen, Y.Q.; Yu, S.; Zhao, Z.P.; Li, Z.F. Analysis of Sluice Foundation Seepage Using Monitoring Data and Numerical Simulation. Adv. Civ. Eng. 2019, 31, 1–15. [Google Scholar]
  33. Du, K.L.; Li, J.Y.; Wang, H.; Zhang, J. Multi-objective multi-criteria evolutionary algorithm for multi-objective multi-task optimization. Complex Intell. Syst. 2022, 9, 1211–1228. [Google Scholar] [CrossRef]
  34. Wang, Z.Y.; Wallace, T.G.; Rangaiah, G.P.; Wu, Z. Machine learning aided model predictive control with multi-objective optimization and multi-criteria decision making. Comput. Chem. Eng. 2023, 179, 108414. [Google Scholar] [CrossRef]
  35. Yazdani, H.; Baneshi, M.; Yaghoubi, M. Techno-economic and environmental design of hybrid energy systems using multi-objective optimization and multi-criteria decision making methods. Energy Convers. Manag. 2022, 282, 116873. [Google Scholar] [CrossRef]
  36. Hou, W.Y.; Wen, Y.Q.; Deng, G.; Zhang, Y.Y.; Wang, X.N. A multi-target prediction model for dam seepage field. Front. Earth Sci. 2023, 11, 1156114. [Google Scholar] [CrossRef]
  37. Ritam, G.; Kalyanmoy, D. Compromising Pareto-Optimality with Regularity in Platform-Based Multi-Objective Optimization. IEEE Trans. Evol. Comput. 2023, 14, 1–15. [Google Scholar]
Figure 1. Floor plan of ship lock.
Buildings 14 02972 g001
Figure 2. Location of the third piping seepage.
Buildings 14 02972 g002
Figure 3. Model drawing of ship lock pit: (a) Overall model; (b) Anti-seepage system.
Buildings 14 02972 g003
Figure 4. Soil layer distribution and site measurement point layout.
Buildings 14 02972 g004
Figure 5. Technical roadmap of seepage risk assessment.
Buildings 14 02972 g005
Figure 6. Computational cross-section selection: (a) 1-1; (b) 2-2; (c) 3-3.
Buildings 14 02972 g006
Figure 7. Comparison of in-situ monitoring value and calculated value of pore pressure.
Buildings 14 02972 g007
Figure 8. Pressure distribution of different severed faces (unit: kPa): (a) 1-1; (b) 2-2; (c) 3-3.
Buildings 14 02972 g008
Figure 9. Water head distribution map (unit: m).
Buildings 14 02972 g009
Figure 10. Gradient distribution map.
Buildings 14 02972 g010
Figure 11. Pressure distribution map of the pore pressure under different degrees of decreased infiltration efficiency (unit: kPa): (a) 10%; (b) 20%; (c) 30%.
Buildings 14 02972 g011
Figure 12. Water head distribution map of the pore pressure under different degrees of decreased infiltration efficiency (unit: kPa): (a) 10%; (b) 20%; (c) 30%.
Buildings 14 02972 g012aBuildings 14 02972 g012b
Figure 13. Gradient distribution map of the bottom of the dewatering well: (a) 10%; (b) 20%; (c) 30%.
Buildings 14 02972 g013
Figure 14. Flow velocity distribution map of the pore pressure under different degrees of decreased infiltration efficiency (unit: kPa): (a) 10%; (b) 20%; (c) 30%.
Buildings 14 02972 g014
Figure 15. Pressure distribution map of the pore pressure under different defect areas in the diaphragm wall (unit: kPa): (a) 1.5 m2; (b) 3 m2; (c) 4.5 m2.
Buildings 14 02972 g015
Figure 16. What head distribution map of the pore pressure under different defect areas in the diaphragm wall (unit: kPa): (a) 1.5 m2; (b) 3 m2; (c) 4.5 m2.
Buildings 14 02972 g016
Figure 17. Position gradient distribution map of ground wall defects: (a) 1.5 m2; (b) 3 m2; (c) 4.5 m2.
Buildings 14 02972 g017
Figure 18. FLVEL distribution map of the pore pressure under different defect areas in the diaphragm wall (unit: kPa): (a) 1.5 m2; (b) 3 m2; (c) 4.5 m2.
Buildings 14 02972 g018
Figure 19. Technical roadmap of seepage risk assessment: (a) water head; (b) gradient.
Buildings 14 02972 g019
Figure 20. Performance function of K1.
Buildings 14 02972 g020
Figure 21. The influence of ground wall defect K2 on main seepage parameters: (a) water head; (b) gradient.
Buildings 14 02972 g021
Figure 22. Power function of K2.
Buildings 14 02972 g022
Figure 23. The safety interval is divided based on the objective function: (a). Critical point solution; (b). Safety interval division.
Buildings 14 02972 g023
Table 1. Parameters of FEM model.
PartElastic Modulus/MpaPoisson RatioOsmotic Coefficient (cm/s)Pore RatioDensity/g/cm3Critical Gradient
silty clay8.00.153.0 × 10−60.301.81.3
silt loam5.50.258.0 × 10−60.502.10.8
Silty-sandy interlayer2.50.253.0 × 10−40.402.50.6
Sandy loam6.50.354.0 × 10−40.651.90.6
silt loam7.50.305.0 × 10−60.602.21.2
Fine sand7.50.301.0 × 10−30.551.80.5
silt loam10.00.156.0 × 10−60.303.21.2
dewatering well12.00.326.0 × 10−10.302.5-
diaphragm wall7.50.307.3 × 10−80.602.1-
Disclaimer/Publisher’s Note: The statements, opinions and data contained in all publications are solely those of the individual author(s) and contributor(s) and not of MDPI and/or the editor(s). MDPI and/or the editor(s) disclaim responsibility for any injury to people or property resulting from any ideas, methods, instructions or products referred to in the content.

