Article

Parametric Analysis of Moment-Resisting Timber Frames Combined with Cross Laminated Timber Walls and Prediction Models Using Nonlinear Regression and Artificial Neural Networks

by
Osama Abdelfattah Hegeir
*,
Haris Stamatopoulos
and
Kjell Arne Malo
Department of Structural Engineering, Norwegian University of Science and Technology (NTNU), Rich. Birkelandsvei 1A, 7491 Trondheim, Norway
*
Author to whom correspondence should be addressed.
Buildings 2024, 14(9), 2975; https://doi.org/10.3390/buildings14092975
Submission received: 11 August 2024 / Revised: 11 September 2024 / Accepted: 18 September 2024 / Published: 20 September 2024
(This article belongs to the Section Building Structures)

Abstract

:
The light weight and moderate stiffness of multistorey timber buildings make them susceptible to increased lateral displacements and accelerations under service-level wind loading. Therefore, the fulfilment of serviceability requirements is a major challenge. In this study, linear elastic finite element analysis was used to perform a parametric study of moment-resisting timber frames combined with cross laminated timber walls. In the parametric study, various mechanical and geometrical parameters were varied within practical ranges. The results of the parametric study were used to derive simplified analytical expressions and to train artificial neural networks which can be used to estimate fundamental frequency, mode shape, top floor displacement, maximum inter-storey drift, and wind-induced acceleration. The analytical expressions and the artificial neural networks can be used for the preliminary assessment of serviceability performance of moment-resisting timber frames with and without cross laminated timber walls, under service-level wind loading.

1. Introduction

Timber has an excellent weight-to-strength ratio, primarily due to its light weight compared to other building materials. Nevertheless, the lightweight nature and moderate stiffness of timber buildings make them susceptible to serviceability problems, such as excessive lateral displacements and accelerations under service-level wind loading [1,2,3,4,5,6,7]. Large lateral displacements can cause damage to non-structural elements and may impact the building’s functionality, and large accelerations may cause discomfort to the occupants. Therefore, it is important to ensure that lateral displacements and accelerations are within acceptable limits.
Lateral displacements can be reduced by enhancing the lateral stiffness of the building, e.g., by use of stiffer connections [1,2,3,4]. Wind-induced accelerations can be reduced by increasing the lateral stiffness [1,2,3,4], the mass [1,2,4], or the damping [8] of the building, or a combination.
Several Lateral Load-Resisting Systems (LLRSs) can be used to provide the lateral stability for multistorey timber buildings. A common LLRS is based on Cross Laminated Timber (CLT) walls. Examples for buildings that employ CLT walls as LLRS are Stadthaus in London [9], and Moholt 50/50 [10] in Trondheim. Multistorey timber buildings employing lateral bracing as LLRS are also prevalent, such as Treet [5] and Mjøstårnet [11] in Norway. Nevertheless, these LLRSs impose architectural restrictions and space limitations.
Moment-Resisting Timber Frames (MRTFs) can be used as an alternative structural system that can provide more open space with fewer architectural restrictions. In MRTFs, the lateral stiffness is achieved by use of moment-resisting beam-to-column connections. Such connections can be based on screwed-in threaded rods [3,12,13,14,15], glued-in rods [16,17,18], self-tapping screws [19], or dowel-type connections [20,21]. The use of moment-resisting connections reduces the need for lateral bracing and improves the performance of floors against human-induced vibrations [1,14].
A parametric study by Vilguts et al. [2] highlighted the feasibility of MRTFs made with Glued Laminated Timber (glulam) for multistorey timber buildings. However, under high wind velocities, the system can hardly be used for more than eight storeys with limited out-of-plane spacing of 2.4 m between adjacent frames, due to increased wind-induced accelerations and lateral displacements [2].
The use of MRTFs in combination with CLT walls (i.e., dual frame-wall) can allow for buildings up to 12 storeys with out-of-plane spacing of up to 5 m under moderate to high wind velocities [1]. Moreover, stairs and elevators usually exist in multistorey buildings and walls often surround the staircase and elevator shaft; hence, employing CLT walls in combination with MRTFs presents a practical consideration.
In this study, a parametric study of planar (i.e., 2D) MRTFs in combination with CLT walls was performed using linear elastic Finite Element Analysis (FEA). The results of the parametric study were used to derive simplified analytical expressions for fundamental frequency, mode shape, top floor displacement, maximum inter-storey drift, and wind-induced acceleration by use of nonlinear regression. Additionally, the results were utilized to train Artificial Neural Networks (ANNs) that can be used to predict the aforementioned response parameters with improved accuracy.
For non-seismic design, the design of multistorey timber buildings is typically governed by Serviceability Limit State (SLS) [1,2,3,5]. A parametric study of timber dual frame-wall system highlighted that SLS requirements are more critical than the ultimate limit state [1]. The derived analytical expressions and ANNs can be used to facilitate the preliminary assessment of multistorey timber buildings, specifically addressing the SLS requirements.
Although the parametric study was performed using 2D FEA and resulted in analytical expressions and ANNs specifically designed for 2D analysis, a discussion on the behaviour of the structural system in a 3D context is also included.

2. Methods

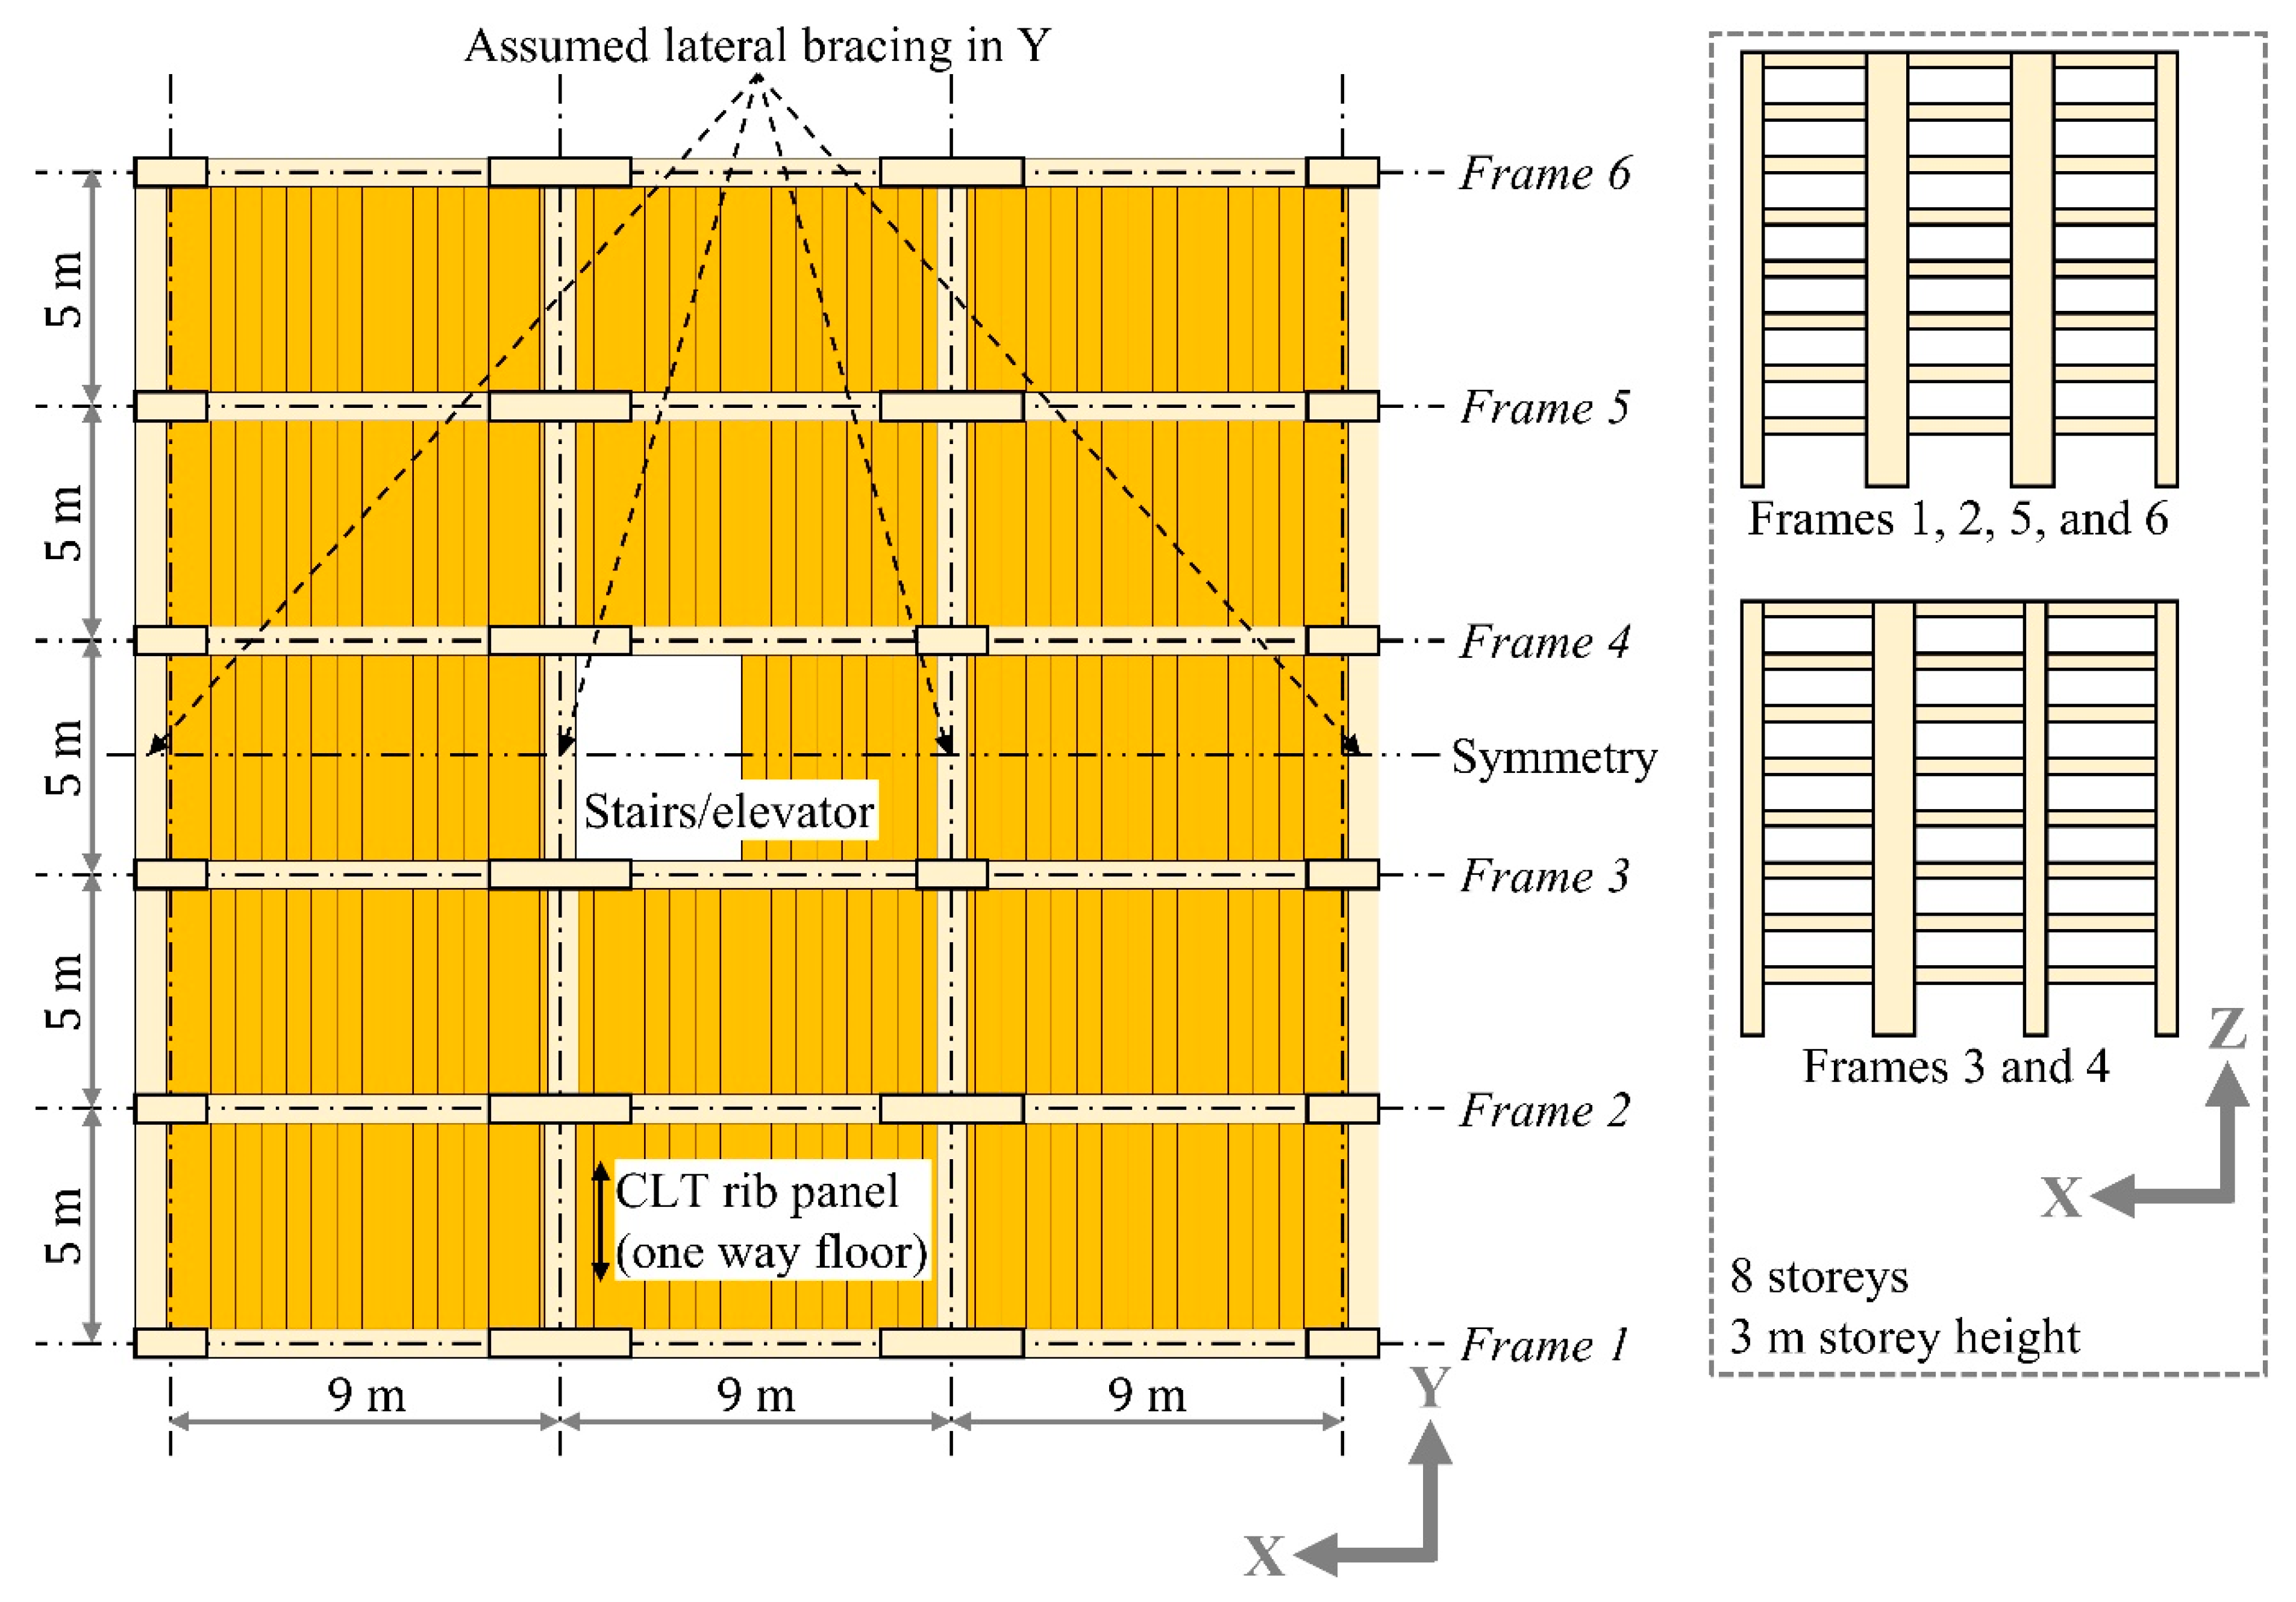
2.1. Structural System

Figure 1 shows an example of a multistorey timber building. The LLRS in X direction is a dual frame-wall system. In Y direction, the building is stabilized using CLT walls around the staircase or elevator shaft, and lateral bracing. In this example, CLT rib panel floors were assumed. The focus in this paper is on the system in X direction (i.e., the dual frame-wall system). The dual system consists of continuous CLT walls and glulam columns, and glulam beams. The connections between beams and columns or walls are moment-resisting. In X direction, all beams, columns, and walls were assumed of a double cross section; consult Figure 1.

2.2. Parametric Study

Figure 2 shows an example of a dual frame-wall system. The present study considers the response of the dual system in 2D. The cases of two and three bays were considered, and the location and number of CLT walls were varied; see Figure 2b,c. The case of no CLT walls was also considered; see variation 3 and variation 7 in Figure 2b,c. Table 1 summarizes the parameters of the considered frames; the relevant notations are shown in Figure 1 and Figure 2. The values of the varied parameters were selected based on practical ranges commonly used in practice.
The ratios β b , β c , and β w were defined as the ratio of the connection stiffness to the flexural stiffness of beams, columns, and walls, respectively:
β b = K θ , b · L b E I b   ;   β c = K θ , c · H E I c ;   β w = K θ , w · H E I w
where K θ , b is the rotational stiffness of beam-to-column/wall connections, K θ , c is the rotational stiffness of column-to-foundation connections, and K θ , w is the rotational stiffness of wall-to-foundation connections. L b and H are the bay length and the total height, respectively. E I b , E I c , and E I w are the beam, the column, and the wall bending stiffness, respectively. All relevant notations are shown in Figure 1 and Figure 2.
For each FEA simulation, the location and the number of the CLT walls were randomly selected from the variations shown in Figure 2b,c. The preceding variation of parameters in Table 1 results in a total of 746,496 analyses.

2.3. Finite Element Analysis

Figure 2a shows the FEA model considered in this paper. OpenSeesPy [22] Python library was used to perform linear elastic 2D FEA. Beams, columns, and walls were modelled using Timoshenko beam elements. The beam elements representing the CLT walls were verified against layered shell elements under in-plane loading. The verification was performed on both stresses and deformations, and the difference was of the order of 5%. Hence, beam elements were deemed to have sufficient accuracy for the purpose of this study.
The glulam beams and columns were assumed of strength class GL30c according to EN 14080 [23], with a mean elastic modulus E0,mean of 13,000 N/mm2 and a mean shear modulus Gmean of 650 N/mm2. The connections between the beams and the columns/walls were modelled using rotational springs with stiffness K θ , b ; consult Figure 2a. Similarly, the connections of the columns and the walls to the foundation were modelled using rotational springs with stiffness K θ , c and K θ , w , respectively.
The lamellae constituting the CLT panels were assumed of strength class C24 according to EN 338 [24]. It was assumed that 2/3 of the lamellae are parallel to the longitudinal (main) direction of the CLT walls (main direction as indicated in Figure 2a). The remaining 1/3 is orthogonal to the main direction. The CLT walls were modelled assuming a homogeneous cross section with equivalent material properties as proposed by [25]. This simplified modelling approach was deemed to have reasonable accuracy for CLT walls loaded in-plane [26]. Based on the preceding assumptions, an equivalent elastic modulus Eeq,0,mean and an equivalent shear modulus Geq,mean of 8000 and 518 N/mm2 were considered in this study, respectively.
Modelling columns and walls using beam elements (i.e., 1D) results in an increased beam span. Rigid elements with high stiffness were added at both ends of the beam to avoid this increase in beam span; see Figure 2a. The rigid elements allow no shear or bending deformations.
To estimate the modal properties (frequency and mode shape), modal analysis was performed. For lateral displacements, the second-order effects due to nonlinear geometry were not included. The exclusion of the second-order effects was implemented to reduce computational time and enable extrapolation to loads beyond those presented in Table 1. Nevertheless, an additional dataset of approximately 130,000 analyses was created to quantify the magnitude of including the second-order effects on lateral displacements.

2.4. Calculation of Wind-Induced Acceleration

Several methods exist in building design codes for the estimation of wind-induced acceleration; a comparison between different methods can be found in [27,28]. In this study, the peak wind-induced acceleration was calculated using the method described in EN 1991-1-4 Annex B [29]. Relevant parameters that were kept constant in the parametric study (see Section 2.2 in this paper) are summarized in Table 2.
Additional to the parameters in Table 2, fundamental frequency, mode shape, basic wind velocity, dimensions of the building (L, B, H; consult Figure 1), and floors masses are required for the calculation of wind-induced acceleration. EN 1998-1 [30] and EN 1991-1-4 Annex F [29] provide the simplified Equations (2) and (3) for the fundamental frequency, respectively:
f = 1 C t   · H 0.75   for   H 40   m
f = 46 H   for   H > 50   m
where f is the fundamental frequency in Hz, H is the total height of the building in m, and C t is 0.085 for moment-resisting steel frames, 0.075 for moment-resisting concrete frames and eccentrically braced steel frames, and 0.05 for other structures.
According to EN 1991-1-4 [29], the mode shape can be approximated using Equation (4):
Φ ( z ) = z H ζ  
where z is the height above ground in m, H is in m, and ζ is the mode shape exponent. The mode shape exponent depends on the type of the building and varies from 0.6 to 2.5 [29].
In combination with the 746,496 analyses generated based on Table 1, three additional parameters are required for acceleration calculation. The values of these parameters were defined as below:
  • Fundamental basic wind velocity v b , 0 : 10, 15, 20, 25, 30, 35, and 40 m/s.
  • Damping ratio ξ: 0.01, 0.015, 0.02, 0.025, and 0.03.
  • Cross wind dimension of the building B (confer Figure 1): 10, 15, 20, 25, and 30 m.
For the calculation of wind-induced acceleration, v b , 0 , ξ, and B were randomly selected from the defined set of values for each frame (i.e., dual frame-wall).
Little research has been done on the damping of timber structures. In this study, the values of the damping ratio were reasonably assumed based on [10,31].

3. Results and Discussion

3.1. Nonlinear Regression

The FEA results generated from the parametric study were used to derive analytical expressions for fundamental frequency, mode shape exponent, top floor displacement, and maximum inter-storey drift. Prior to performing the nonlinear regression, some frames were deemed unrealistic:
  • Frames with fundamental frequency f , where f > 5.0 Hz or f < 0.20 Hz, were excluded.
  • For frames with a number of storeys n 10 , β b , β c , and β w   2.0 were considered.
  • For frames with a number of storeys n 10 , b 215 mm was considered.
  • For frames with number of storeys n 6 , h w 1.0 m was considered.

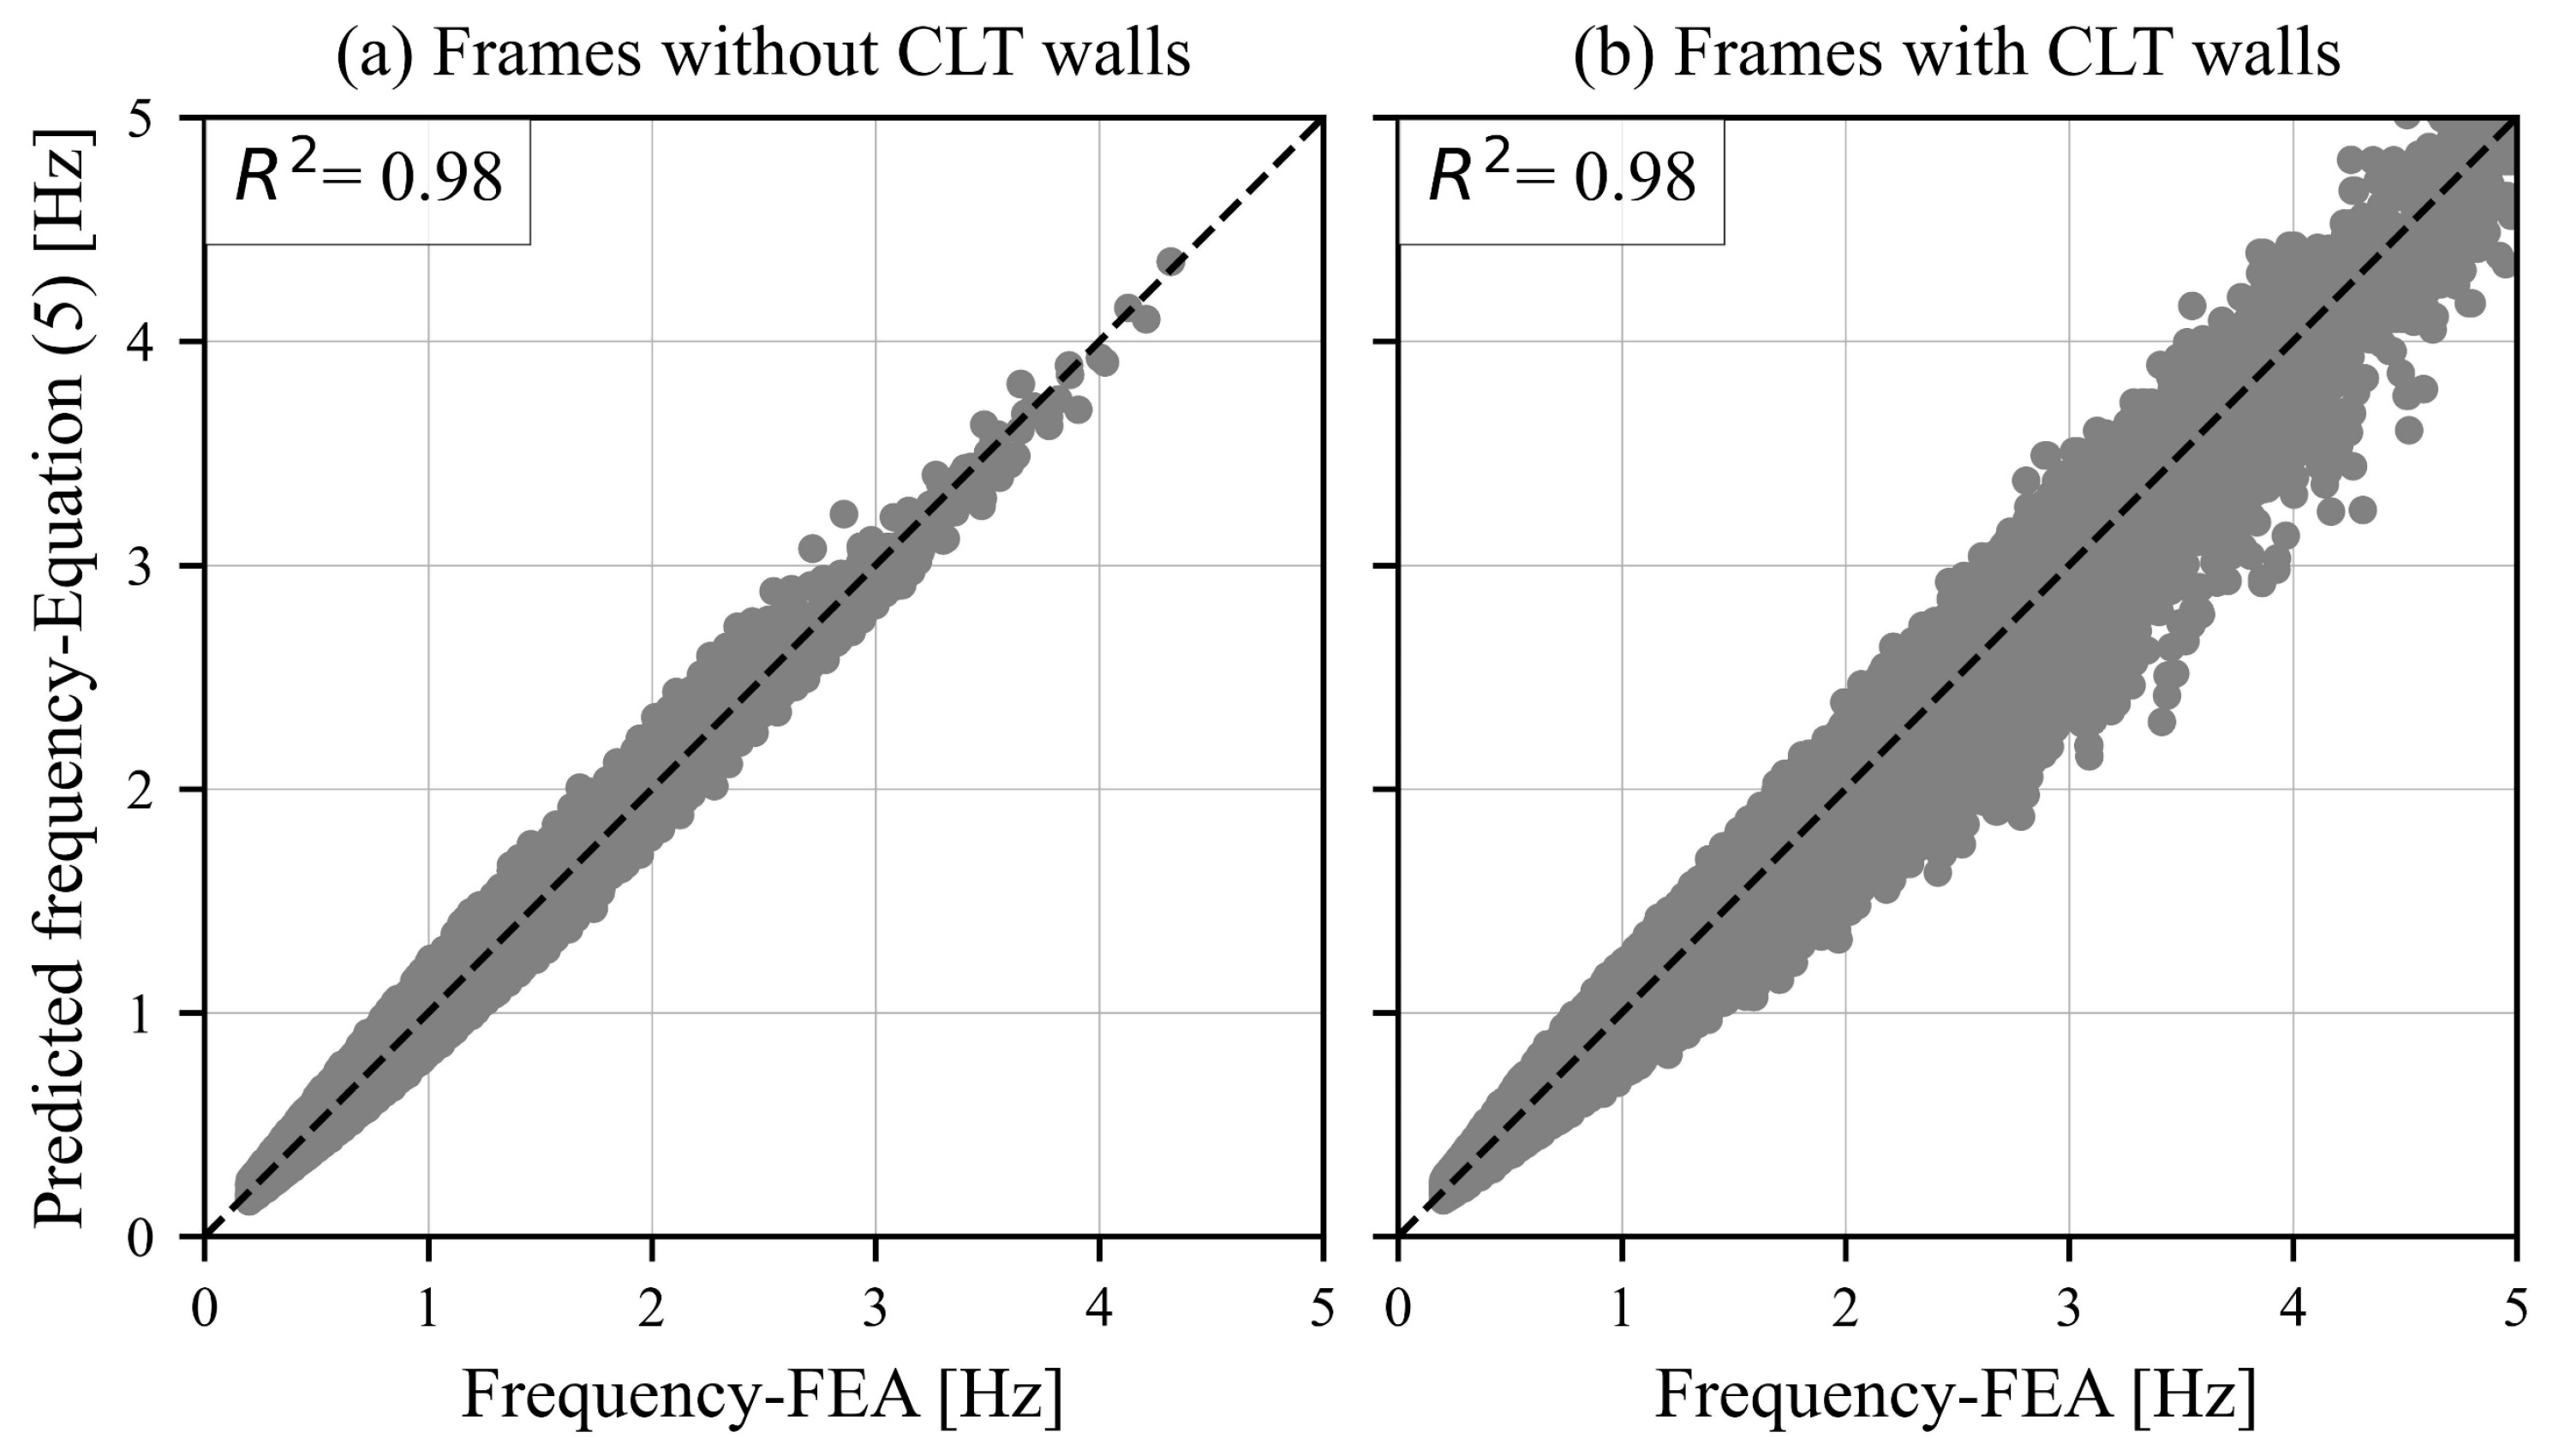
3.1.1. Fundamental Frequency
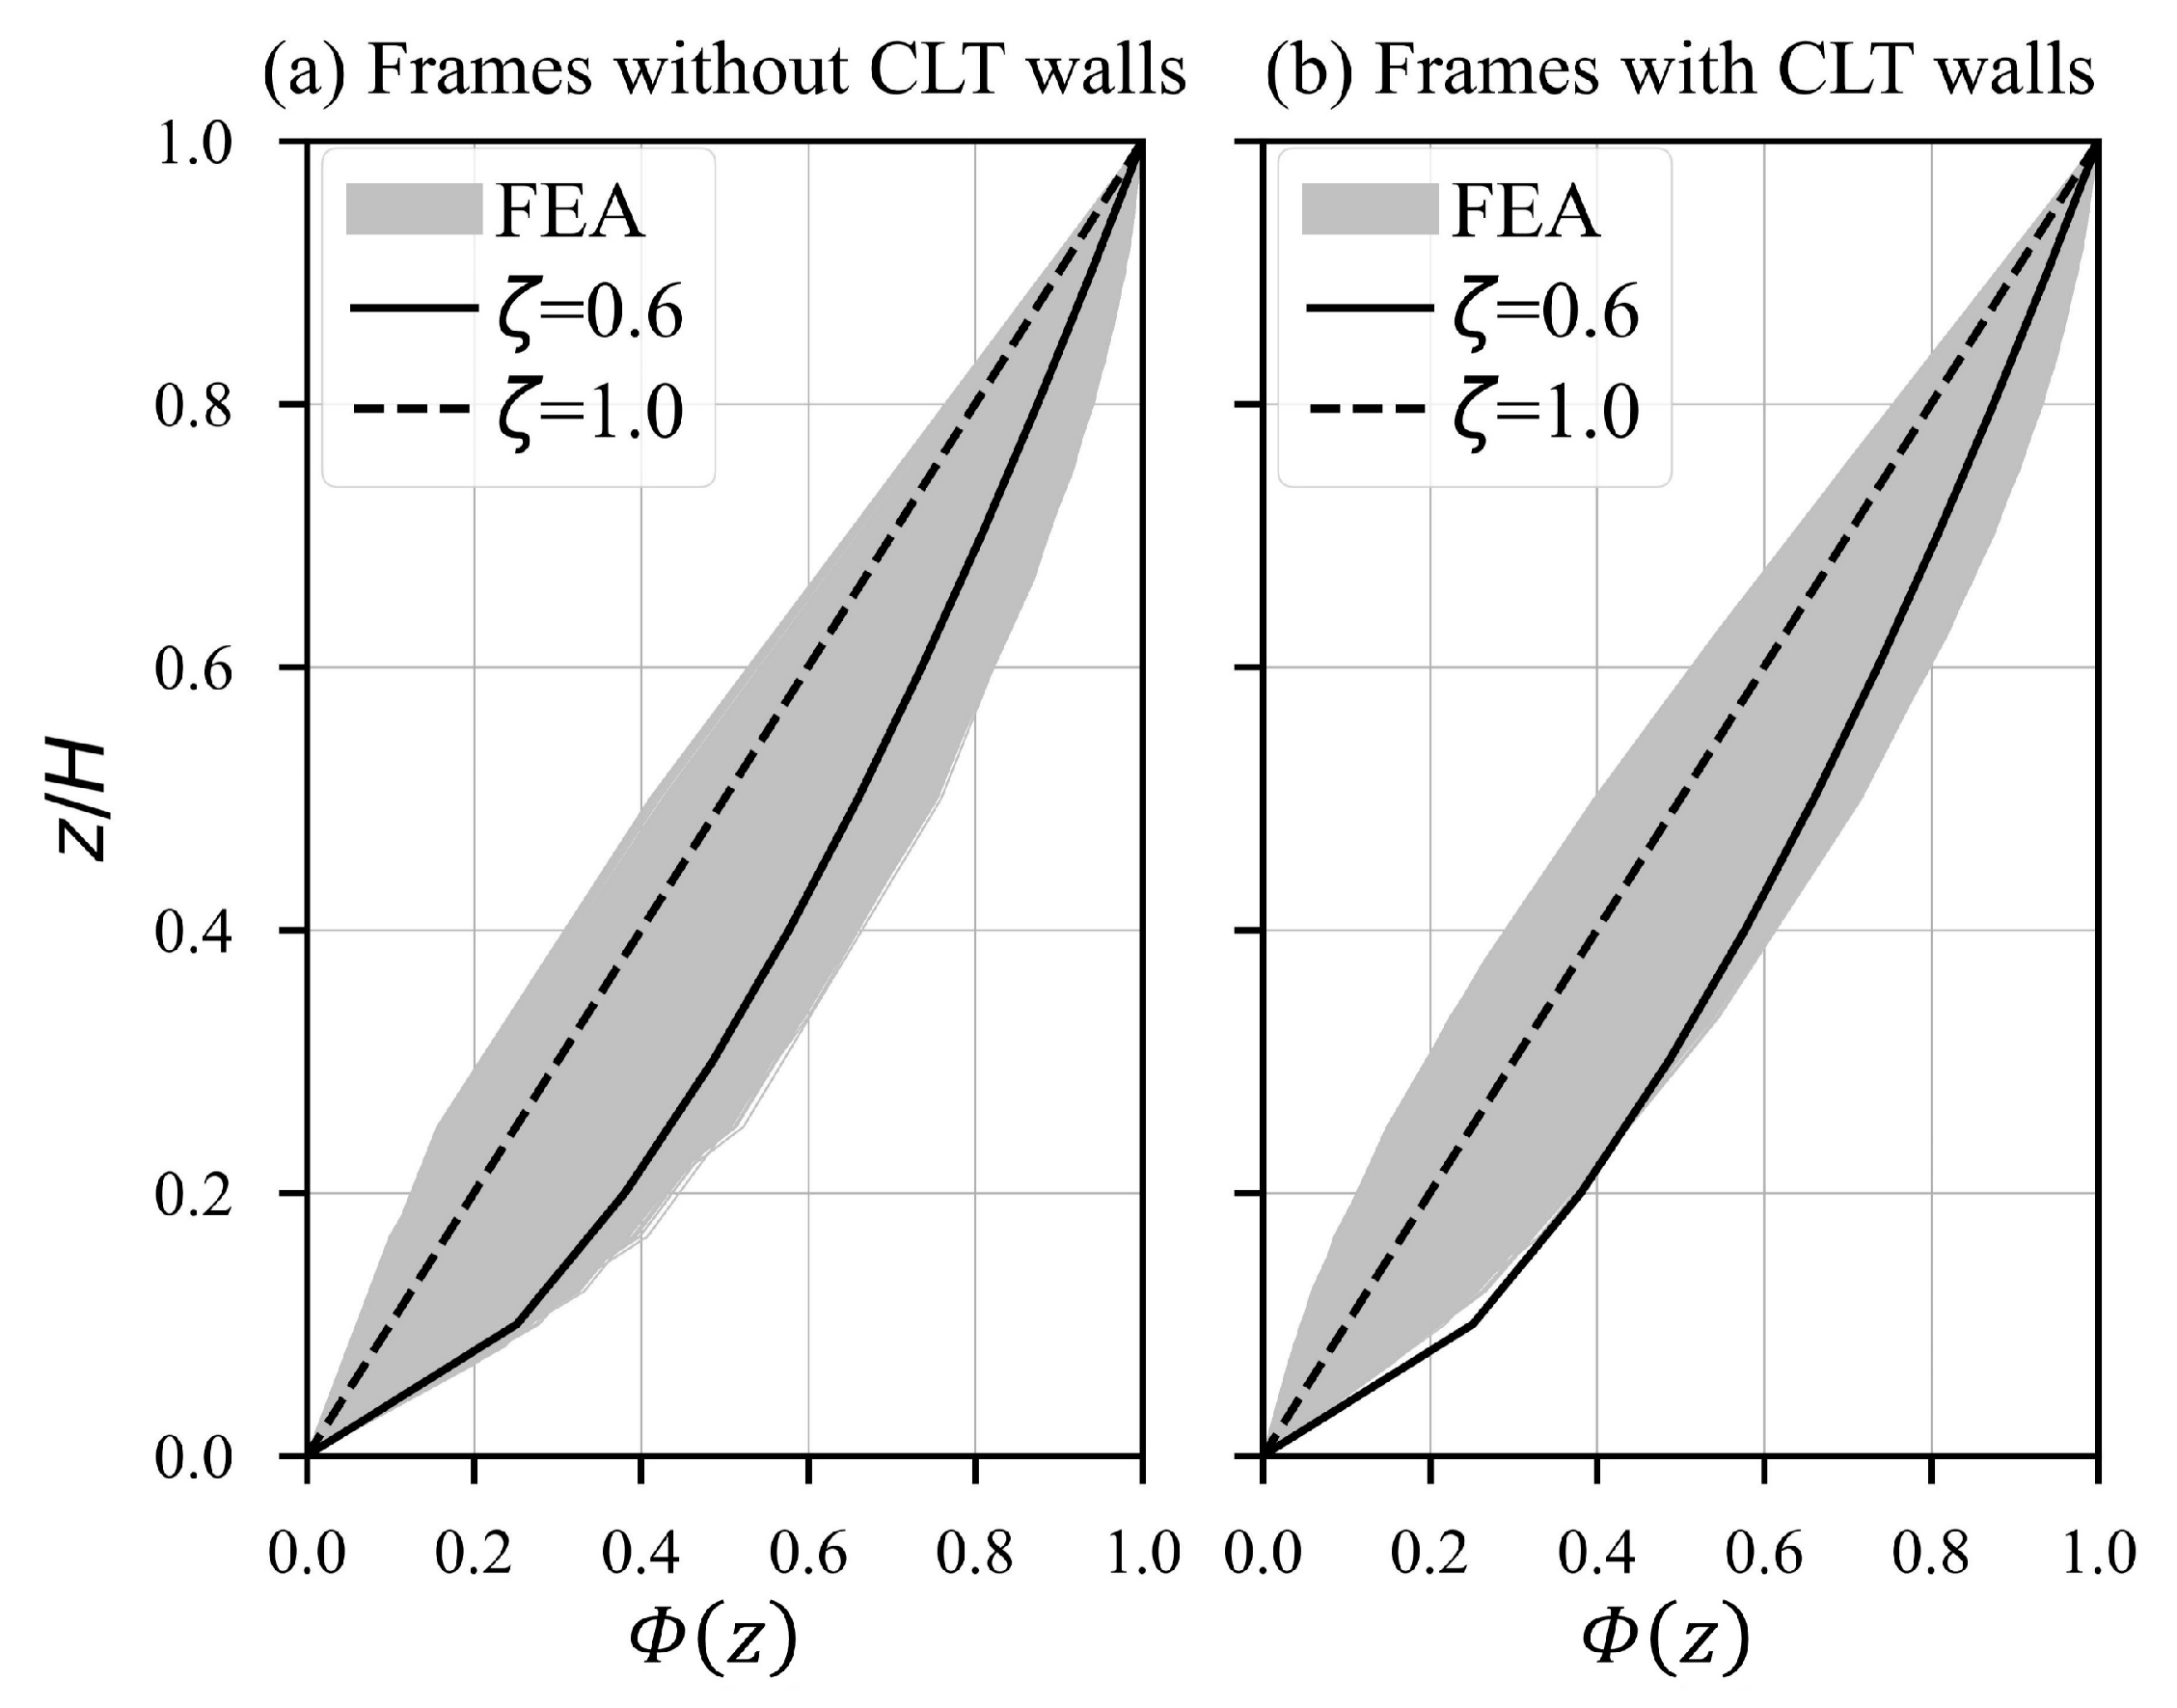
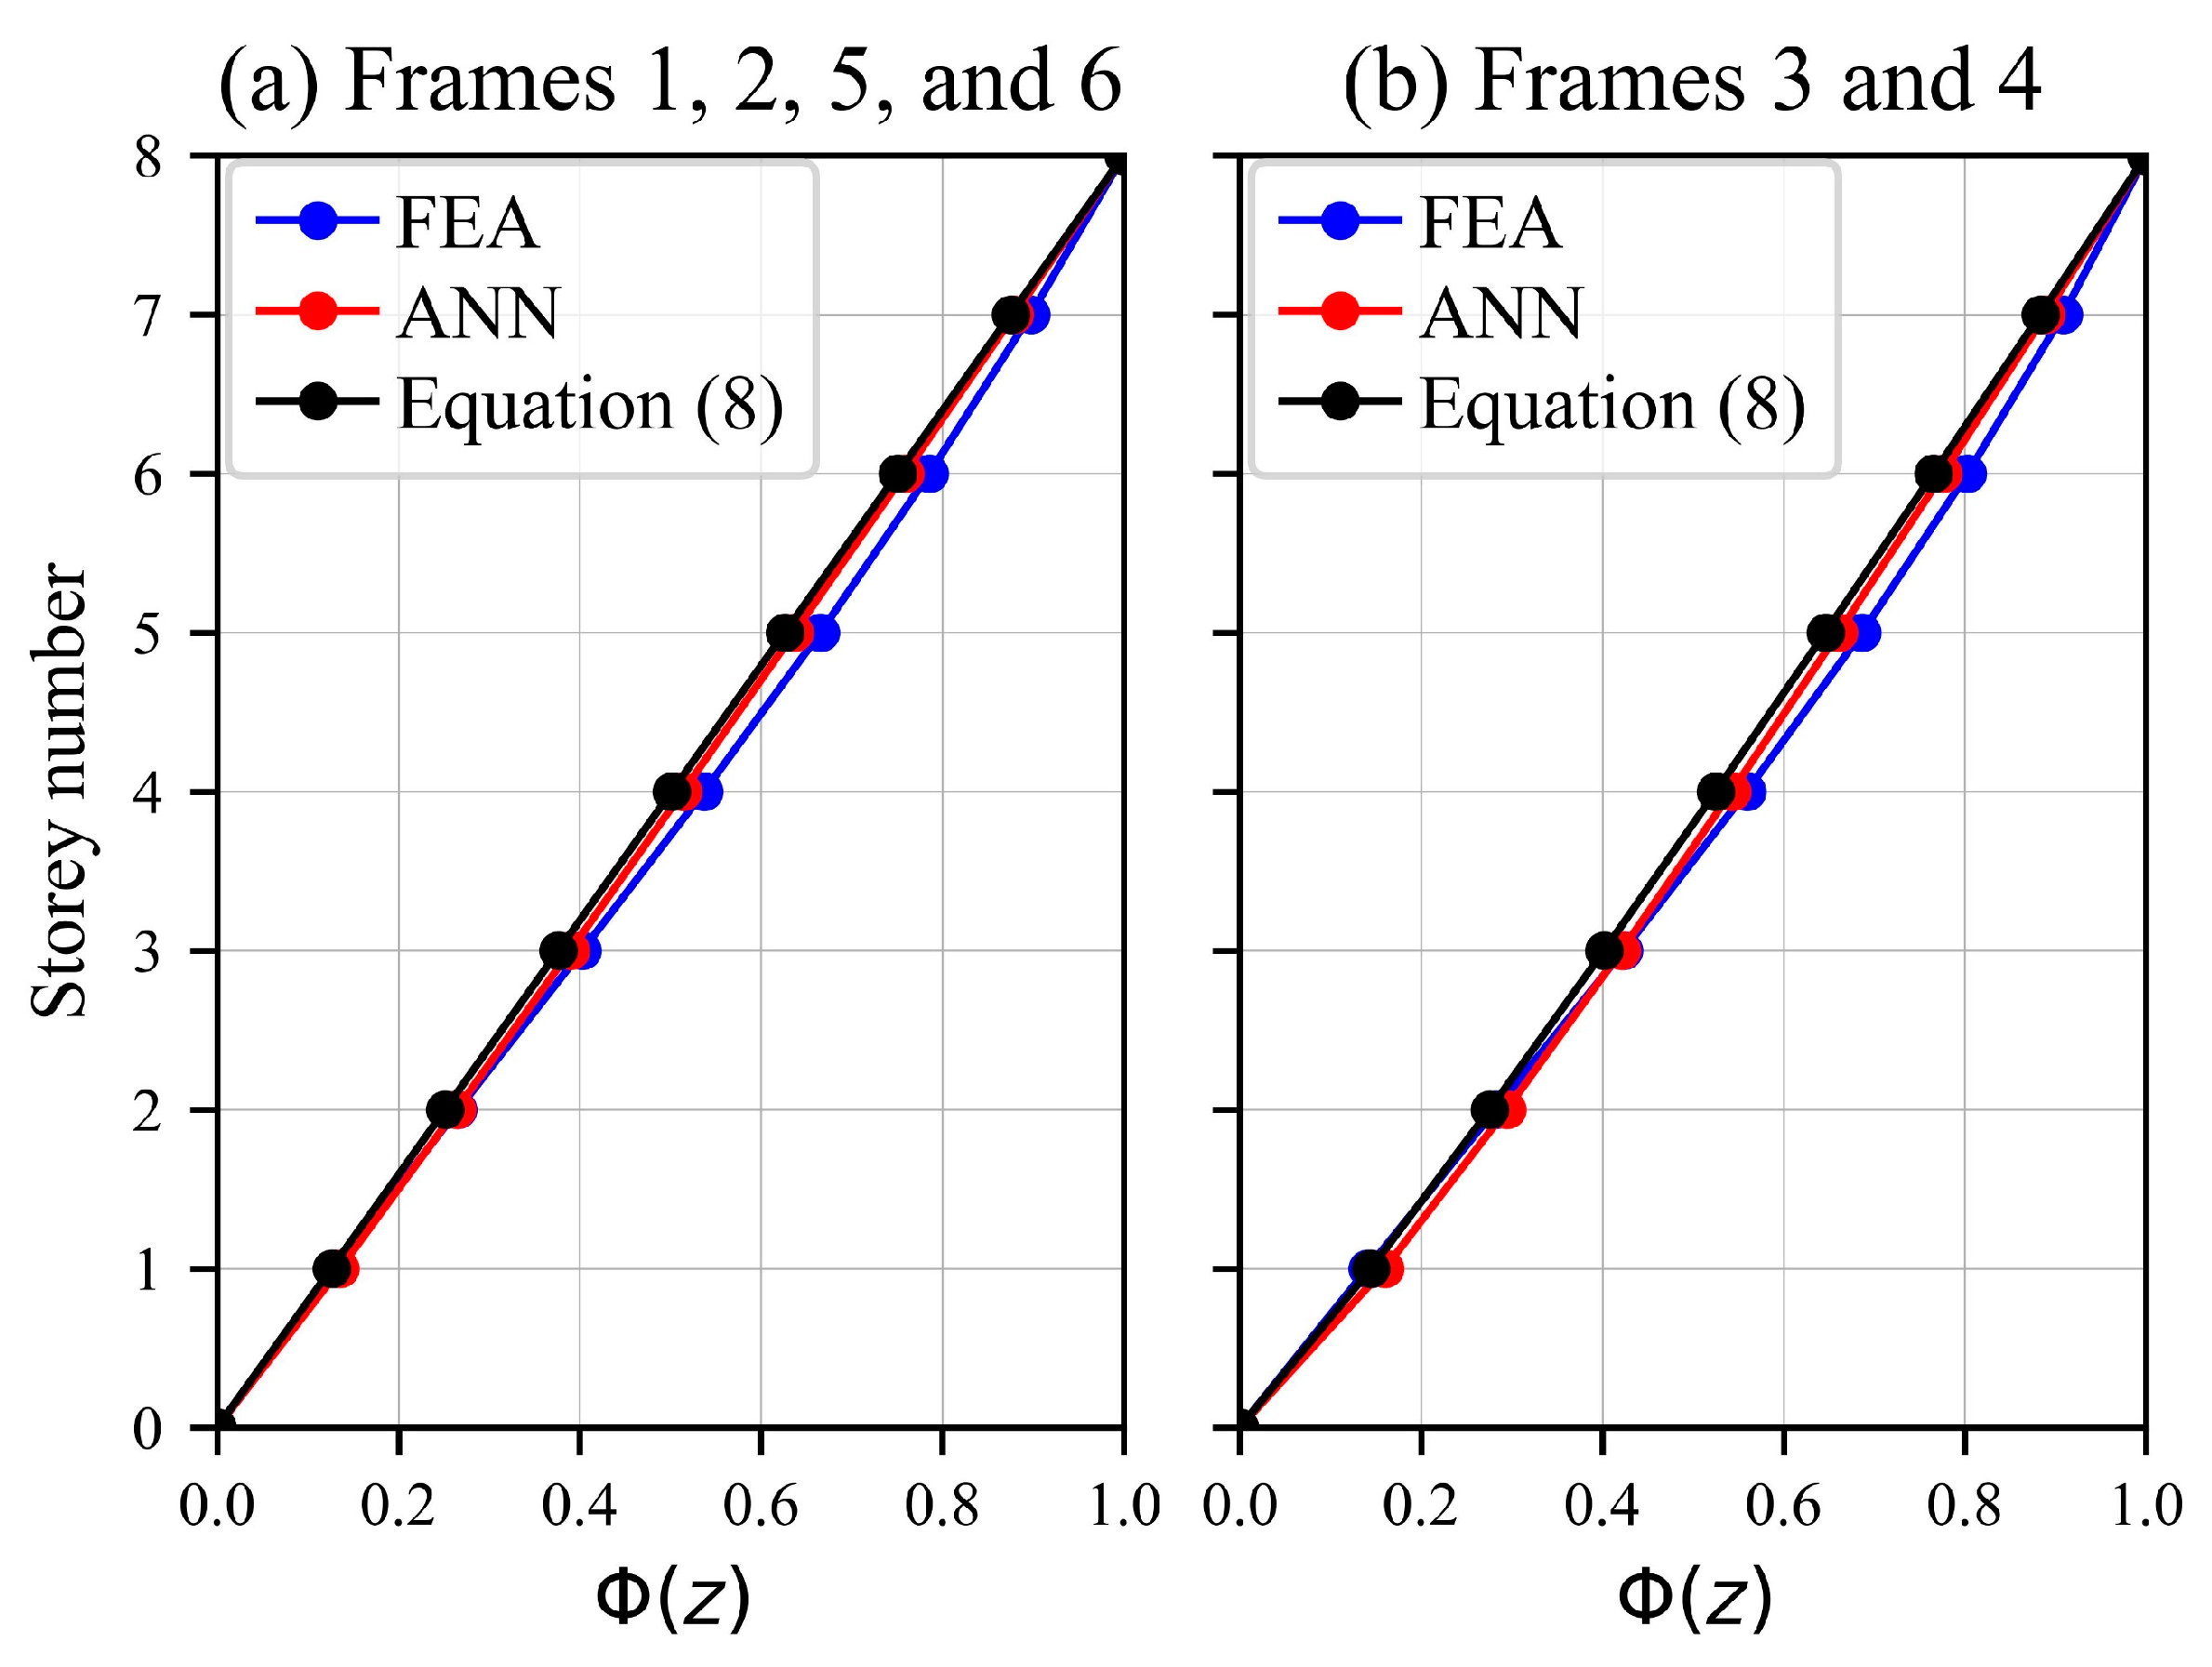
Figure 3 shows the parity plot for the fundamental frequencies estimated from the FEA results and those calculated using Equations (2) and (3). None of the equations provide accurate predictions of the fundamental frequency compared to the FEA. The equations rely solely on the total height of the building as an input. To provide better predictions, factors such as quasi-permanent load, stiffness of connections, and cross-sectional dimensions of structural elements should be considered.
The FEA results were used to derive Equation (5):
f = C 1 · n b 0.7 · h b 0.8 · b 0.5 · β b 0.15 L 0.85 · H 1.1 · Q 0.5
C 1 = 1100 · h c 0.5 · β c 0.07   f o r   f r a m e s   w i t h o u t   C L T   w a l l s
C 1 = 930 · n w 0.15 · h c 0.15 · h w 0.45 · β w 0.1   f o r   f r a m e s   w i t h   C L T   w a l l s
where f is the fundamental frequency in Hz, n b is the number of bays, L is the length of the frame in m, H is the total height of the frame in m, Q is the quasi-permanent load in kN/m, h b , h c , and h w are the heights of beam, column, and wall cross sections in m, respectively, b is the width of beam, column, and wall cross sections in m, and n w is the number of CLT walls. The stiffness ratios β b , β c , and β w are defined in Equation (1). The parameters are also depicted in Figure 1 and Figure 2.
Figure 4 shows the parity plots for the fundamental frequency obtained from FEA and Equation (5). The goodness of fit was evaluated using the coefficient of determination R 2 :
R 2 = 1 Σ i = 1 n y i y ^ i 2 Σ i = 1 n y i y ¯ i 2
where y i is the value from FEA, y ^ i is the predicted value, and y ¯ i is the mean value of FEA results. Hereafter, Equation (6) is also used for the estimation of R 2 for all other response parameters.
As shown in Figure 4, Equation (5) can provide better predictions of the fundamental frequency than Equations (2) and (3). The predictions for frames without CLT walls are slightly better than those for frames with CLT walls.

3.1.2. Mode Shape

According to EN 1991-1-4 [29], a mode shape exponent ζ [consult Equation (4)] of 0.60 is recommended for slender frame structures with non-load-sharing walls, and a value of 1.0 is recommended for buildings with a central core plus peripheral columns or larger columns plus shear bracing. Figure 5 shows the mode shapes obtained from FEA and those obtained using Equation (4) with the values of ζ recommended in EN 1991-1-4 [29].
As shown in Figure 5, the mode shapes obtained from FEA vary among different frames and cannot be approximated by a single value of ζ .
A mode shape exponent based on the structural parameters of individual frames can provide a better approximation of the mode shape. For each individual frame, the best-fitting mode shape exponent was obtained using the method of least squares. The results were then used to derive Equation (7) for frames without CLT walls and Equation (8) for frames with CLT walls:
ζ = 0.85 n b 0.2 · L H 0.15 · h c h b 0.4 · β c β b 0.1   f o r   f r a m e s   w i t h o u t   C L T   w a l l s
ζ = 0.85 · n w 0.1 n b 0.3 · L H 0.2 · h w h b 0.3 · β w β b 0.08   f o r   f r a m e s   w i t h   C L T   w a l l s
where ζ is the mode shape exponent to be used in Equation (4) and L , H , h b , h c , h w are in m.
Figure 6 shows the parity plots for the mode shape exponent obtained based on FEA and using Equations (7) and (8). As shown in the figure, both equations provide a fairly good accuracy with a coefficient of determination exceeding 0.90.

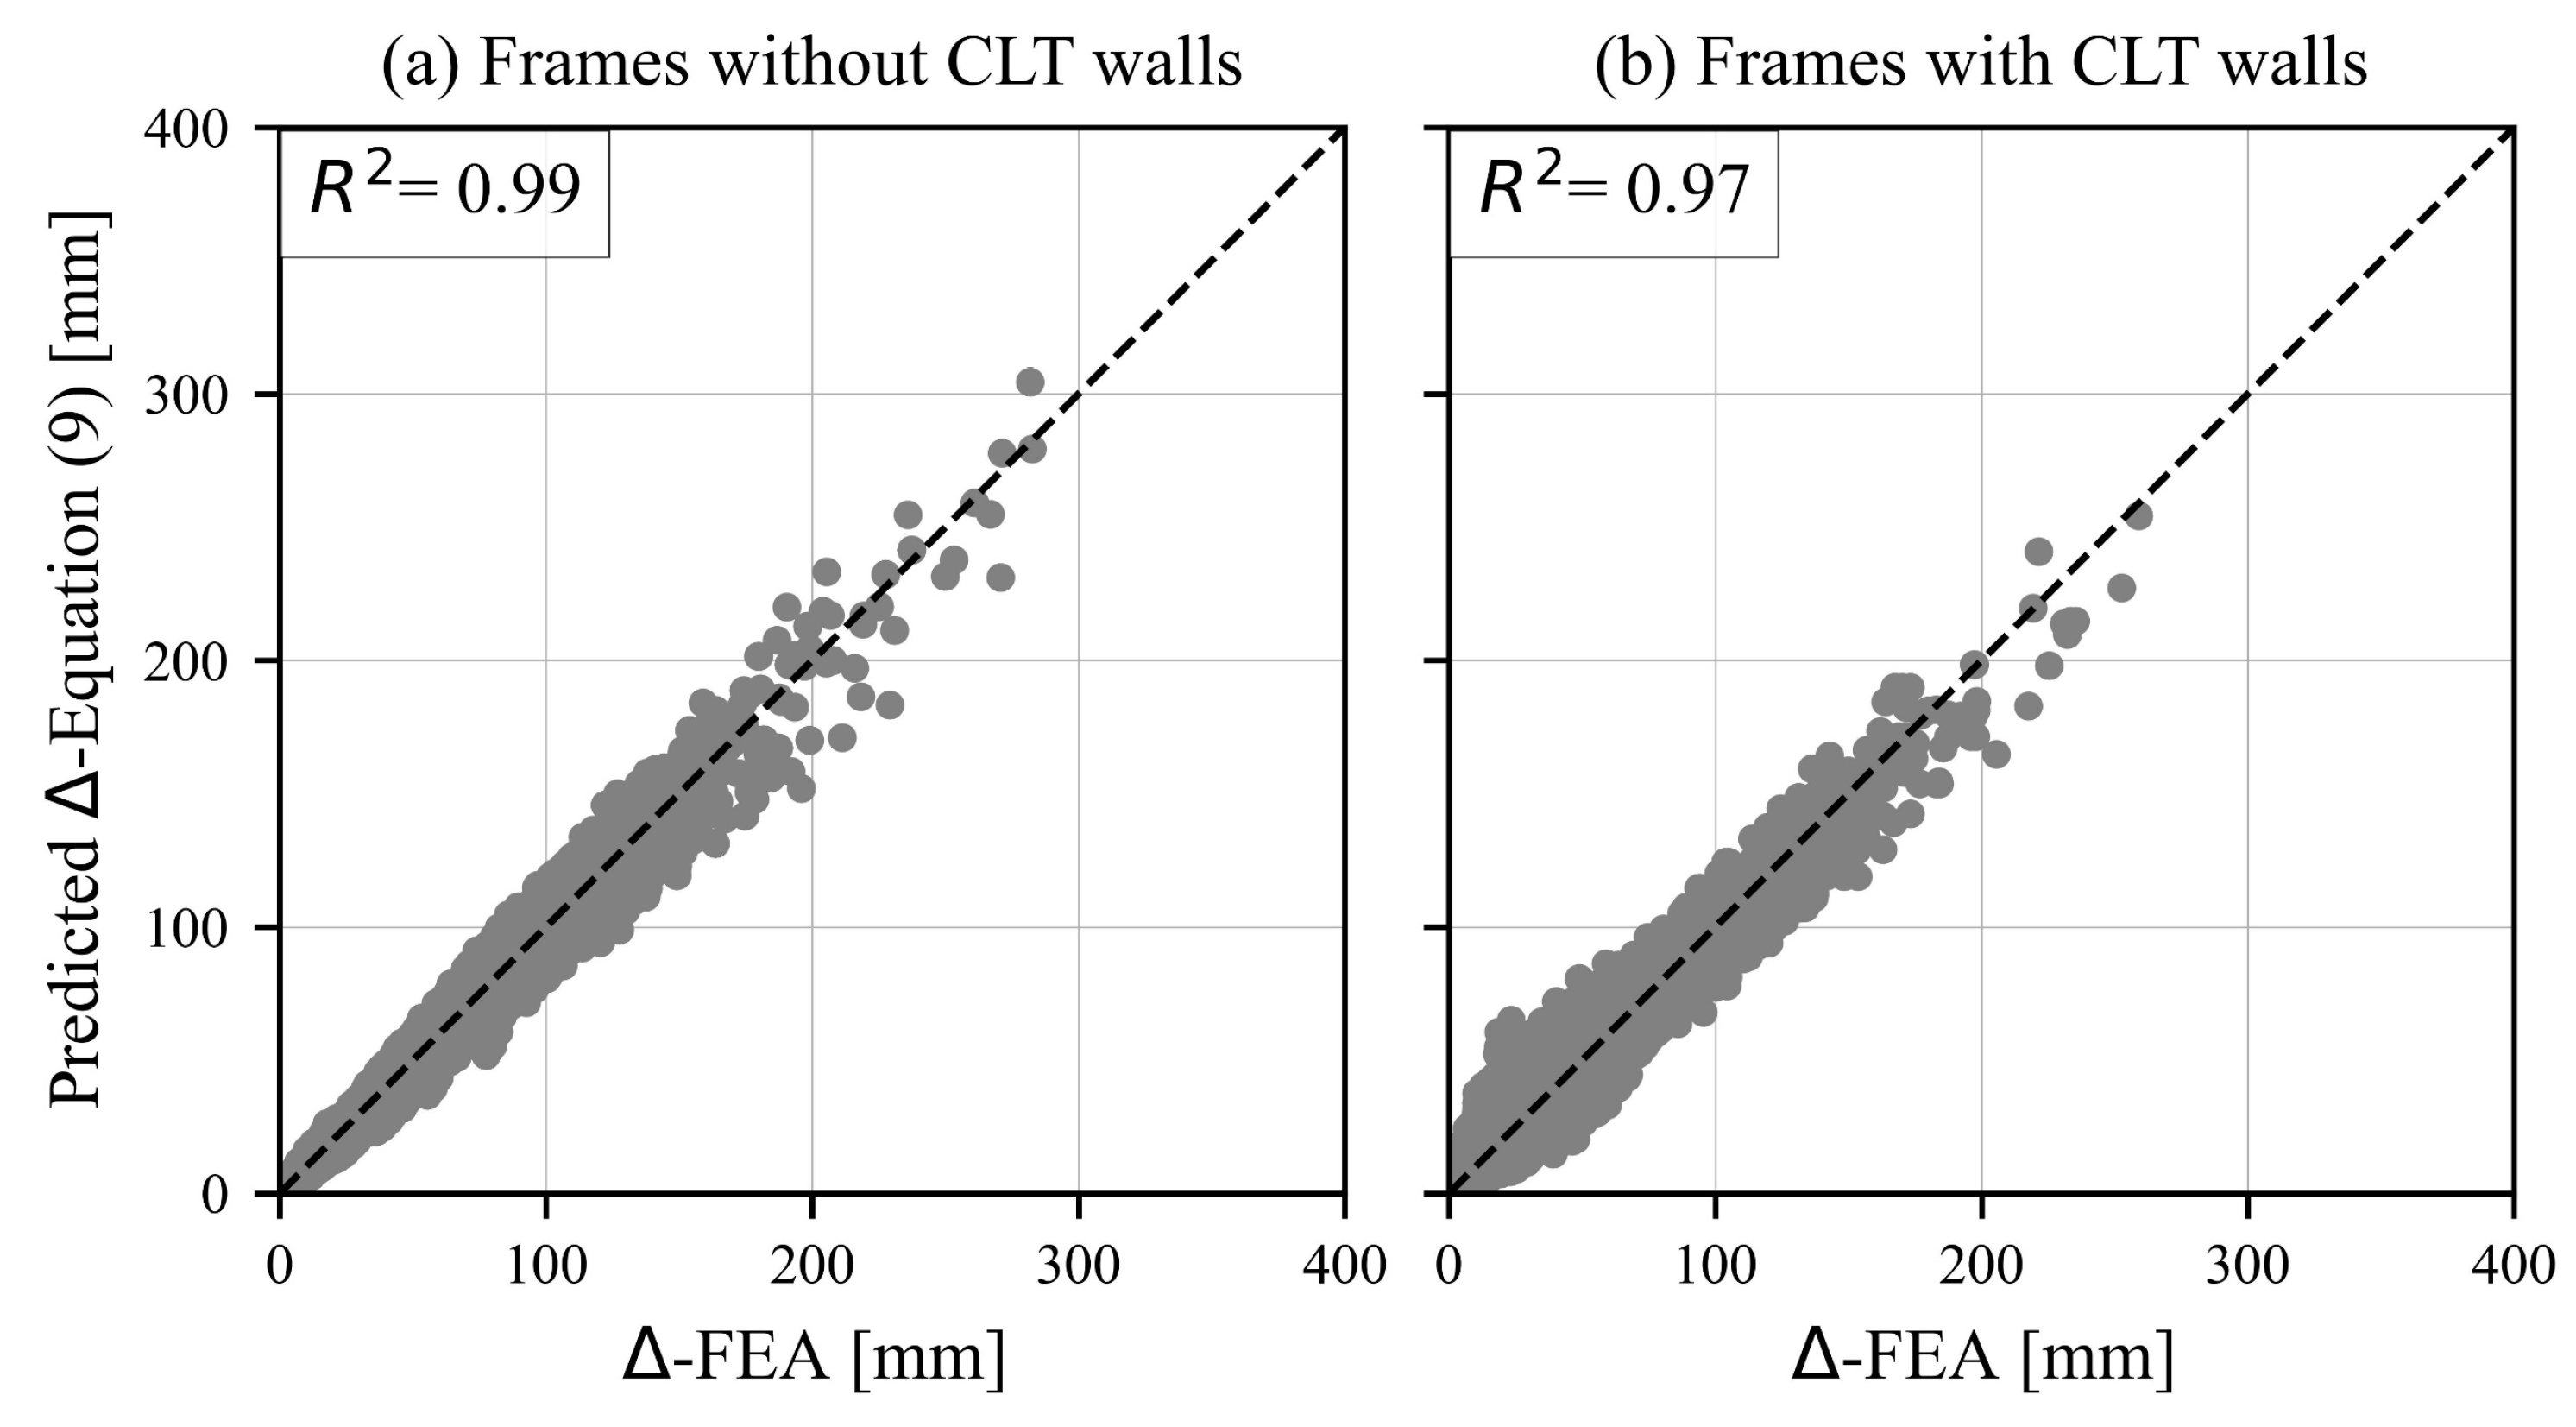
3.1.3. Top Floor Displacement

Using the FEA results, Equation (9) has been derived for the top floor displacement (i.e., roof displacement) due to a uniform lateral load w :
Δ = C 2 · L 0.8 · h 3.1 · n 2.2 n b 1.6 · h b 2.1 · β b 0.45 · b · w
C 2 = 2.1 · 10 4 h c 0.7 · β c 0.1   f o r   f r a m e s   w i t h o u t   C L T   w a l l s
C 2 = 2.35 · 10 4 h c 0.3 · h w 0.85 · β w 0.1 · n w 0.1   f o r   f r a m e s   w i t h   C L T   w a l l s
where Δ is the top floor displacement in mm, h is the storey height in m, n is the number of storeys, w is a uniform lateral load in kN/m, and L , b , h b , h c , and h w are in m.
Figure 7 shows the parity plots for the top floor displacement obtained from FEA and Equation (9). As shown in the figure, Equation (9) shows a good correlation with FEA results. The displacement calculated using Equation (9) does not include second-order effects. To quantify the influence of these effects, a smaller parametric study ( 130,000 analyses) was performed with and without the inclusion of second-order effects. The results show that the inclusion of the second-order effects results in an approximately 5% increase in top floor displacements for stiff frames ( β b , β c , and β w   3.0 ) and a 9% increase for softer frames ( β b , β c , and β w   2.0 ).

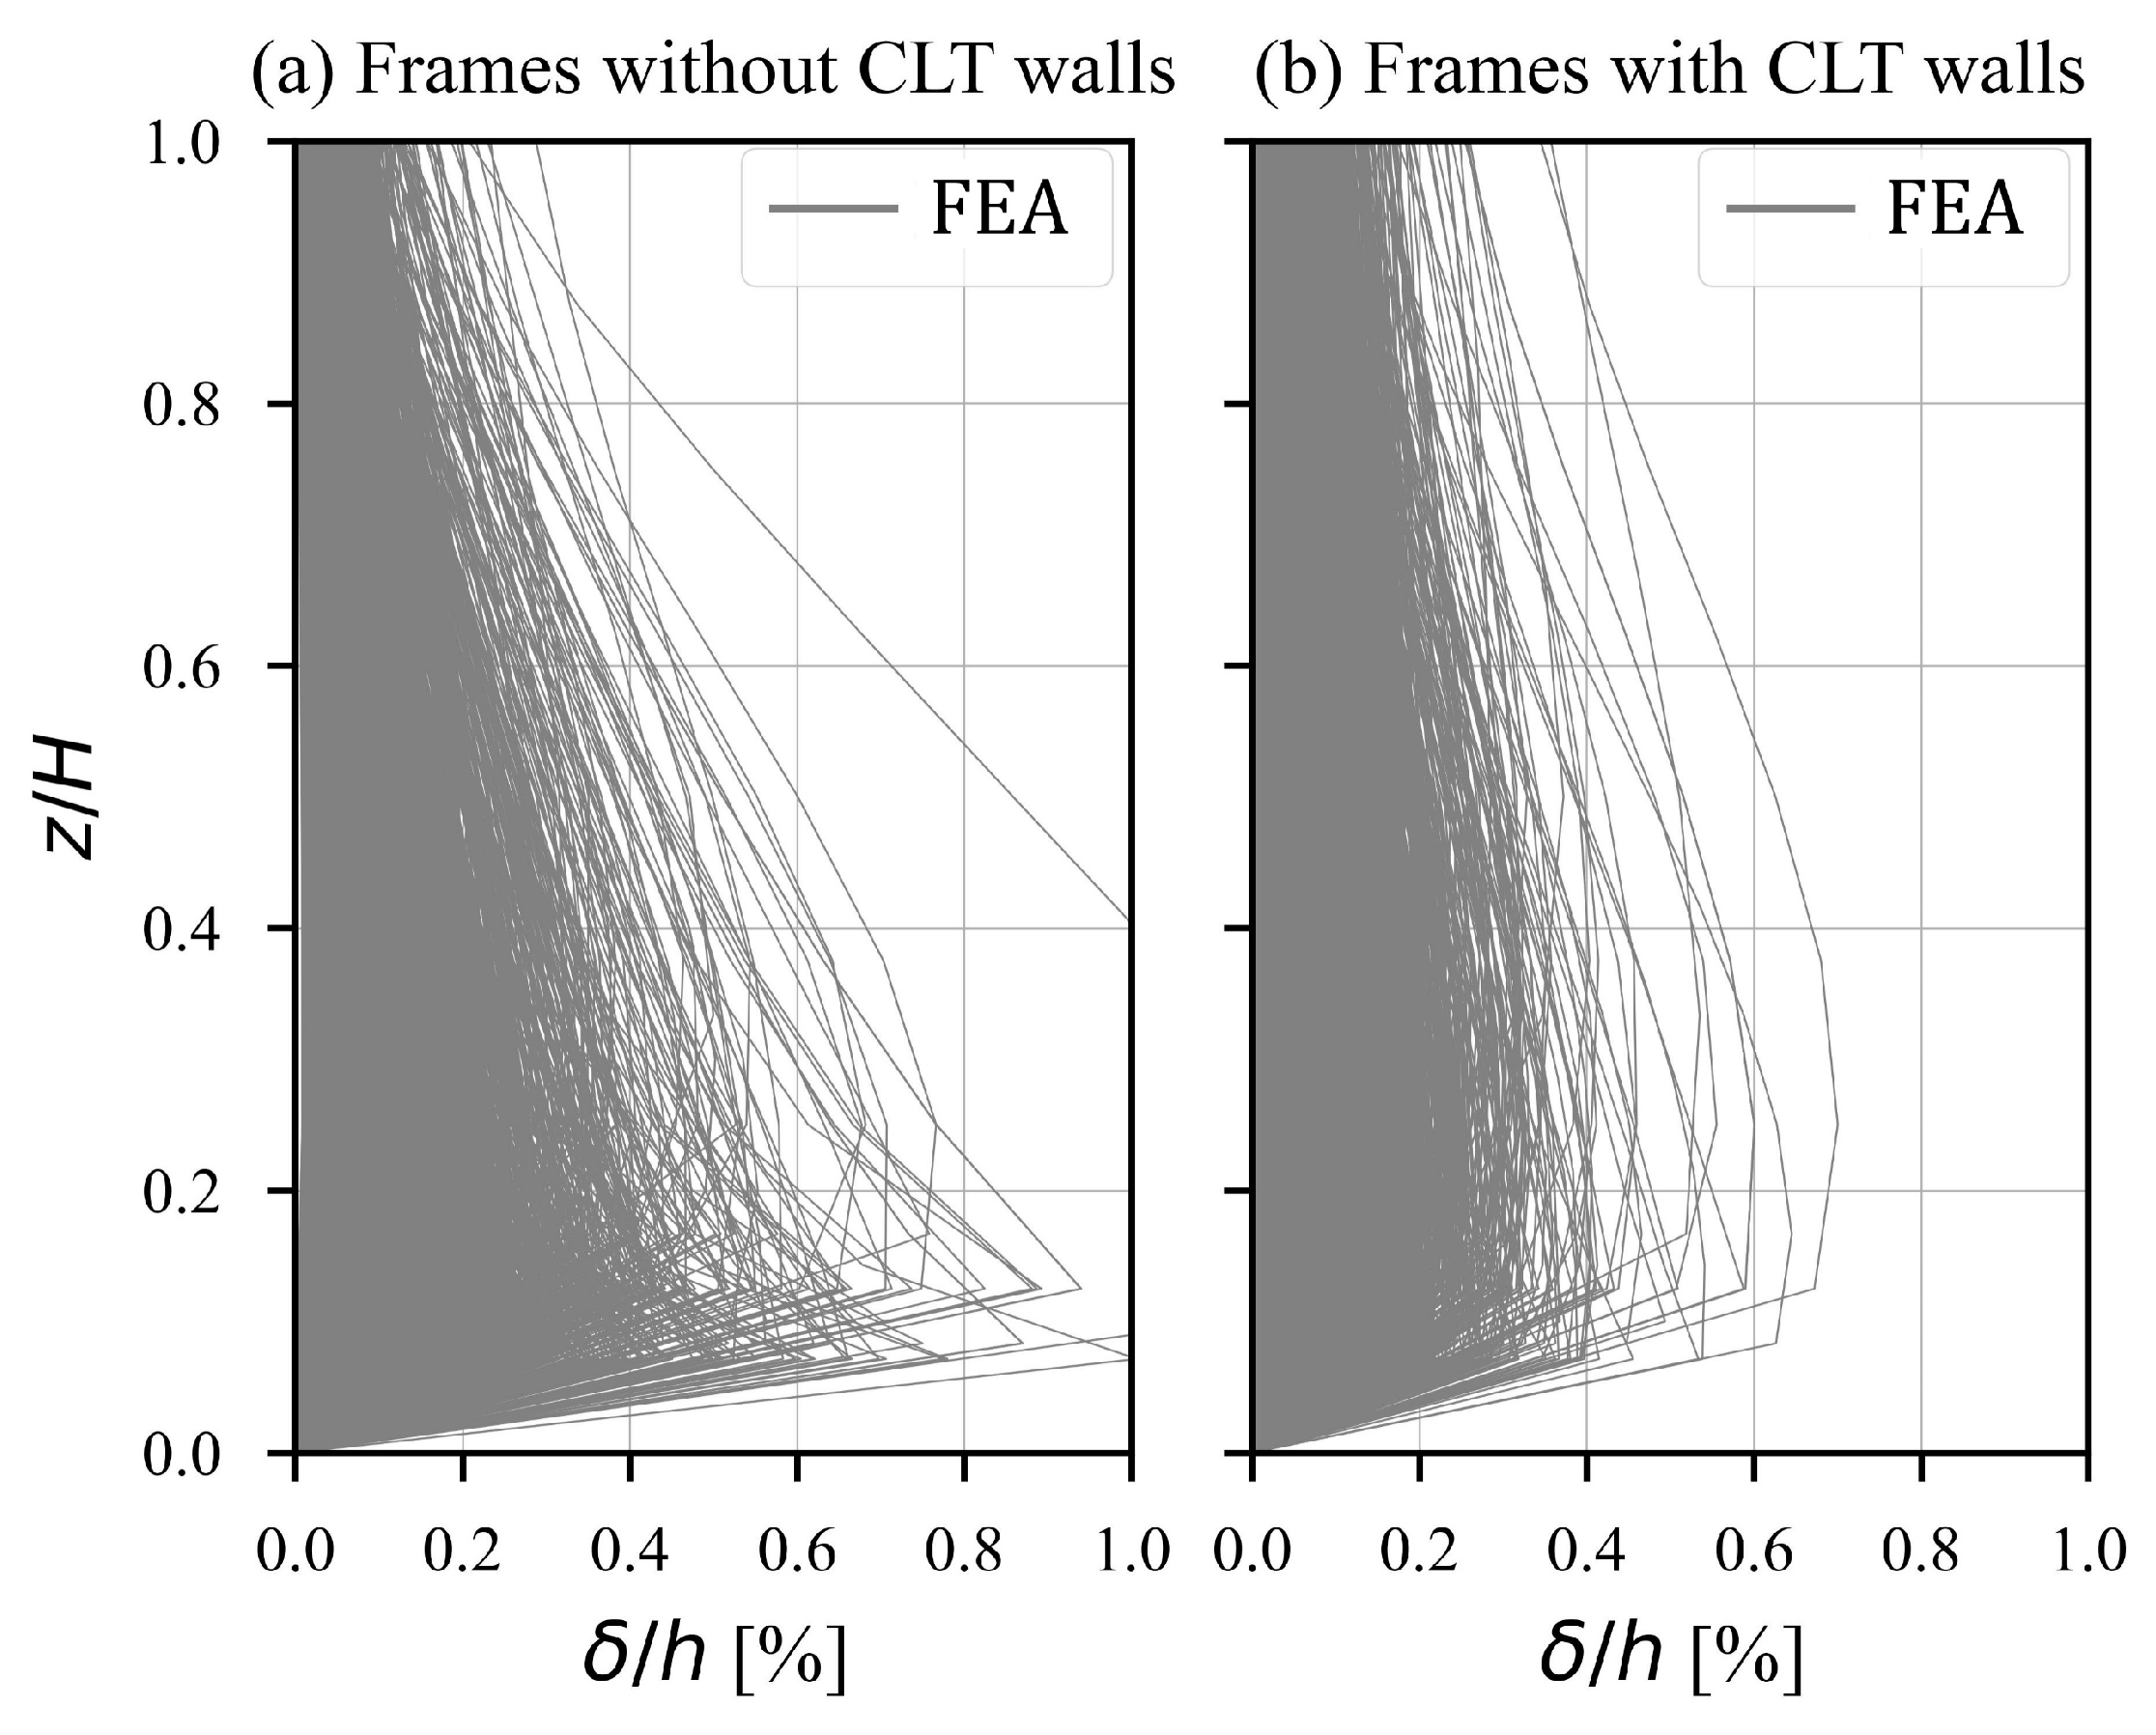
3.1.4. Inter-Storey Drift

Inter-storey drift ( δ ) is the relative displacement between two successive floors. The inter-storey drift from FEA for a representative set of 10,000 frames (randomly selected) is plotted in Figure 8. As shown in the figure, the maximum inter-storey drift occurs at lower storeys. The maximum inter-storey drift is, on average, located at 0.30 H and 0.18 H (measured from ground level) for frames with and without walls, respectively. It is therefore possible to optimize the design of connections by employing stiffer connections at lower storeys with a larger inter-storey drift. The concept of varying the stiffness of connections across different storeys has been explored in [1].
Equation (10) has been derived for the maximum inter-storey drift δ m a x using the FEA results:
δ m a x = C 3 · L 0.6 · h 3.3 · n 1.4 n b 1.4 · h b 1.6 · β b 0.35 · b · w
C 3 = 3 · 10 4 h c 1.3 · β c 0.2   f o r   f r a m e s   w i t h o u t   C L T   w a l l s
C 3 = 3.5 · 10 4 h c 0.4 · h w · β w 0.15 · n w 0.2   f o r   f r a m e s   w i t h   C L T   w a l l s
where δ m a x is the maximum inter-storey drift in mm and L , h , b , h b , h c , and h w are in m.
Figure 9 shows the parity plots for the maximum inter-storey drift obtained from FEA and Equation (10). As shown in the figure, Equation (10) provides good predictions. Similar to the case with top floor displacement, Equation (10) does not include second-order effects. The inclusion of the second-order effects results in an approximately 6% increase in maximum inter-storey drift for stiff frames ( β b , β c , and β w   3.0 ) and a 10% increase for softer frames ( β b , β c , and β w   2.0 ).

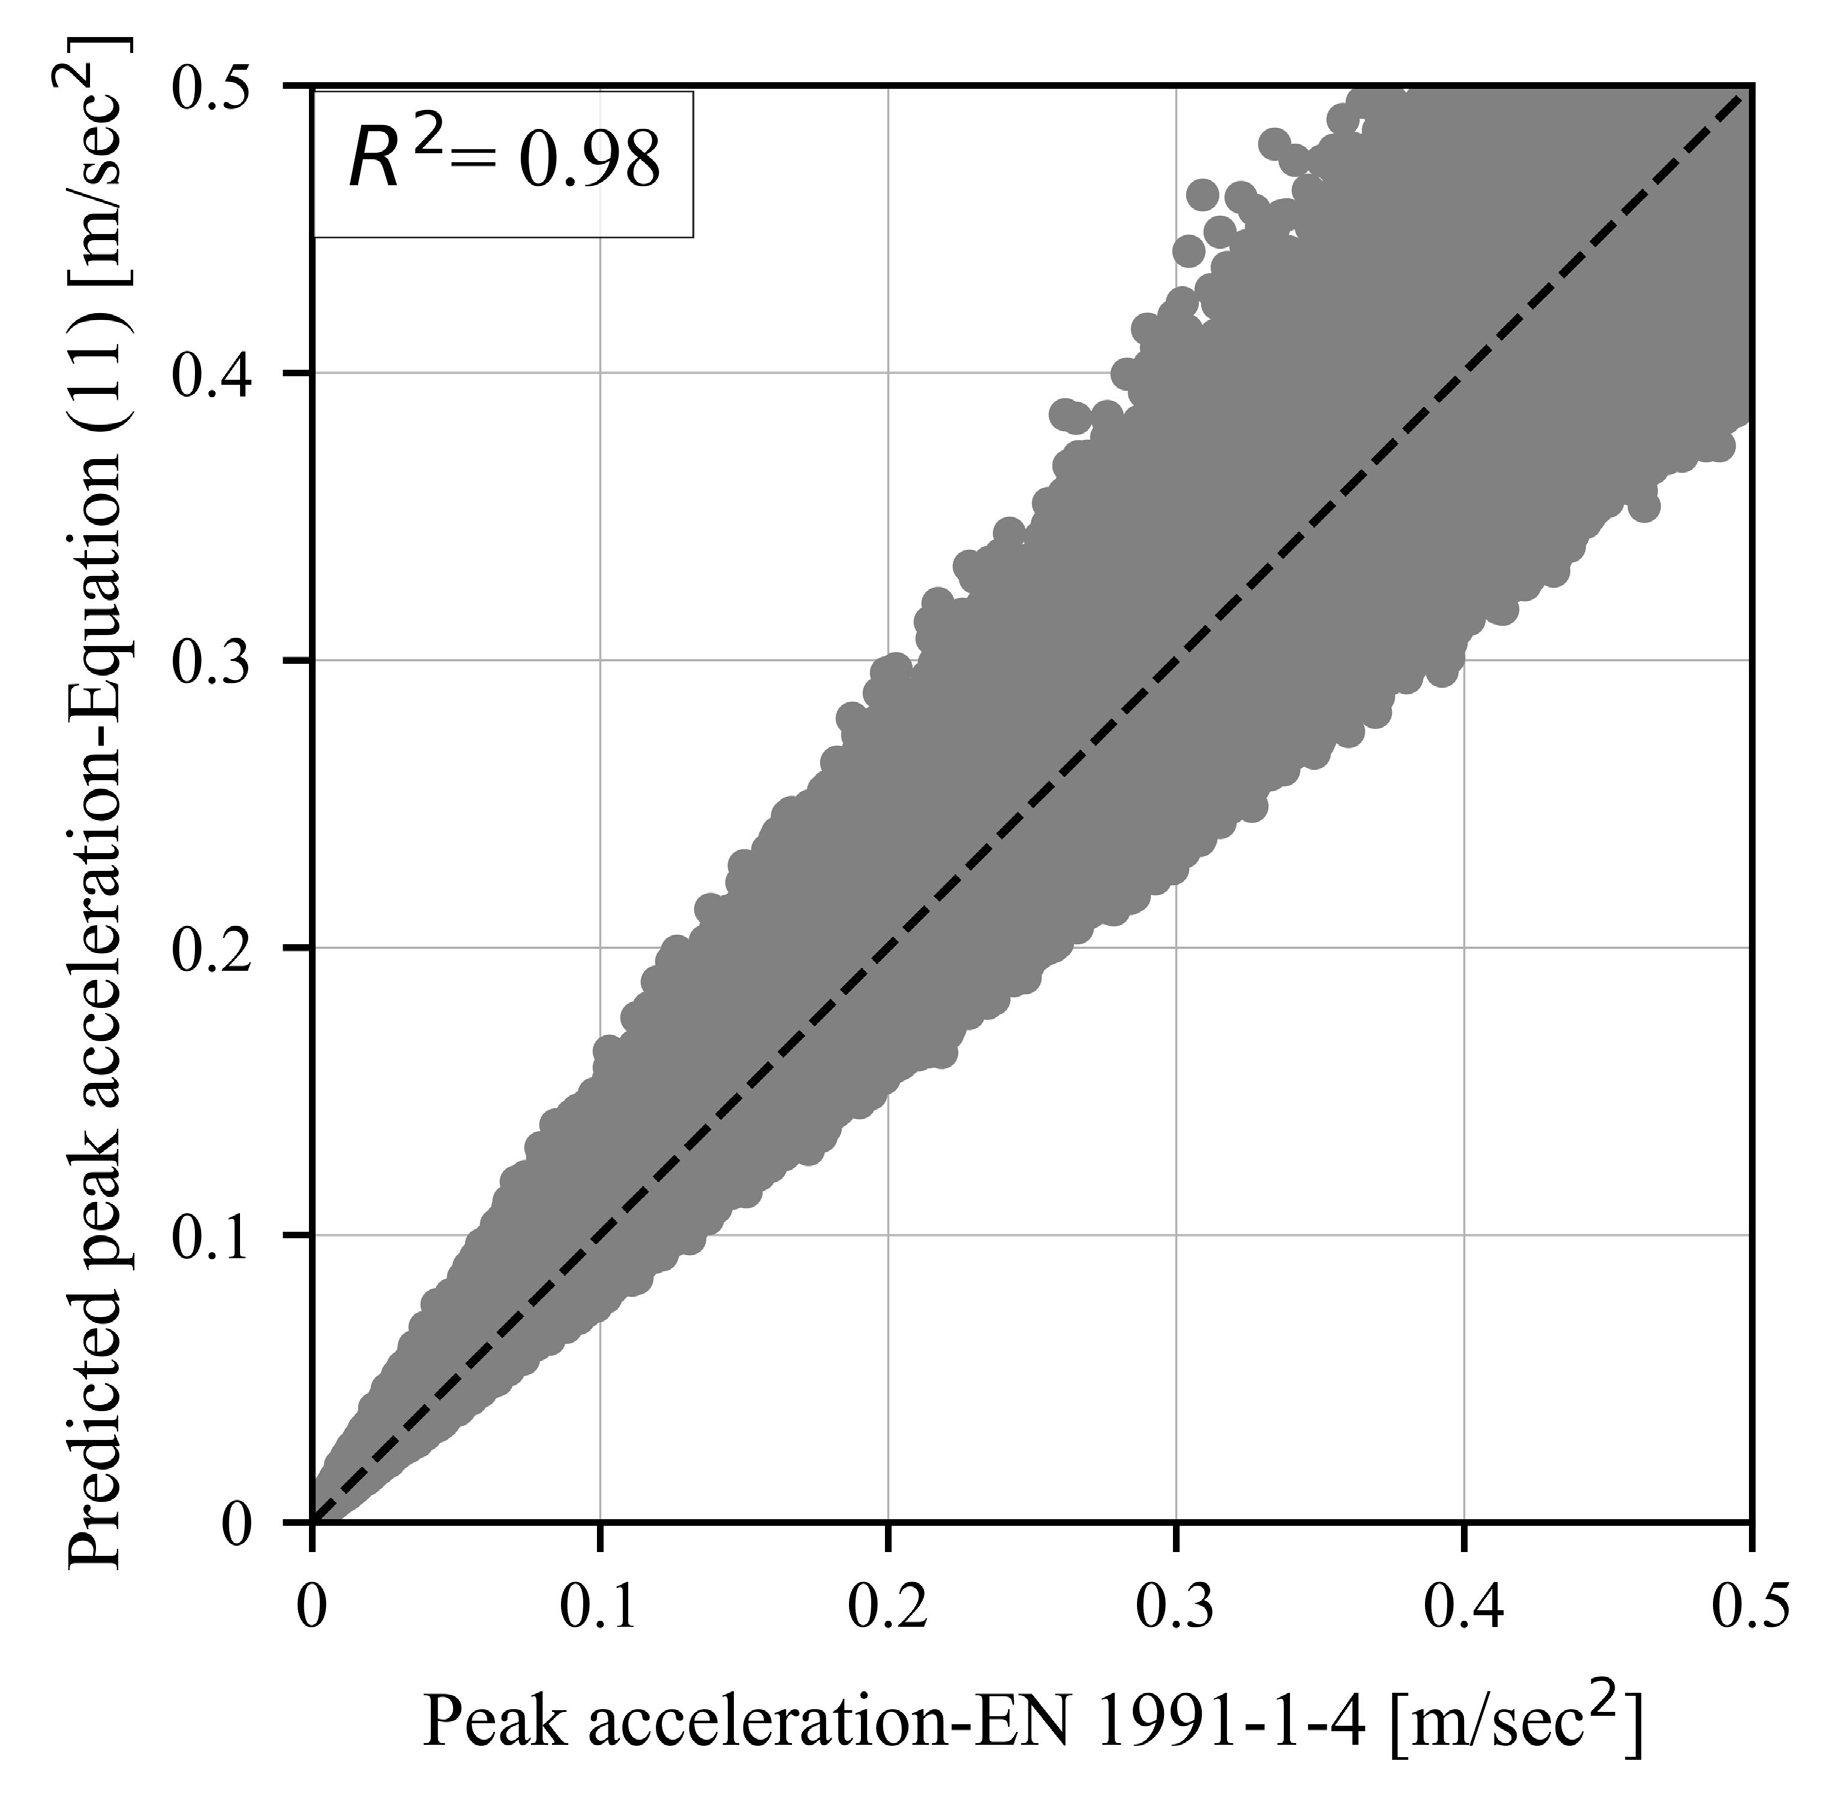
3.1.5. Wind-Induced Acceleration

Wind-induced accelerations at the top storey, calculated using the FEA results in combination with EN 1991-1-4 [29] (consult Section 2.4 in this paper), were used to derive Equation (11). For the derivation of Equation (11), additional to the excluded frames listed in Section 3.1, frames with wind-induced acceleration a at the top storey, where a > 0.50 m/s2, were also deemed unrealistic and hence were excluded.
a = 0.0044 · v b , 0 3 f 0.9 · q m 0.9 · L 1.1 · B 0.2 · ξ 0.4
a is the peak wind-induced acceleration at the top storey in m/s2, v b , 0 is the fundamental basic wind velocity in m/s, f is the fundamental frequency in Hz, q m is the quasi-permanent mass per unit area of the floor in kg/m2, L and B are in m (consult Figure 1), and ξ is the damping ratio.
The parity plot for the peak acceleration calculated using EN 1991-1-4 [29] and using Equation (11) is depicted in Figure 10. Despite the simplicity of Equation (11) compared the procedure described in EN 1991-1-4 [29], it provides good estimates for the acceleration and hence can be used for the preliminary design of multistorey timber buildings in urban environments.

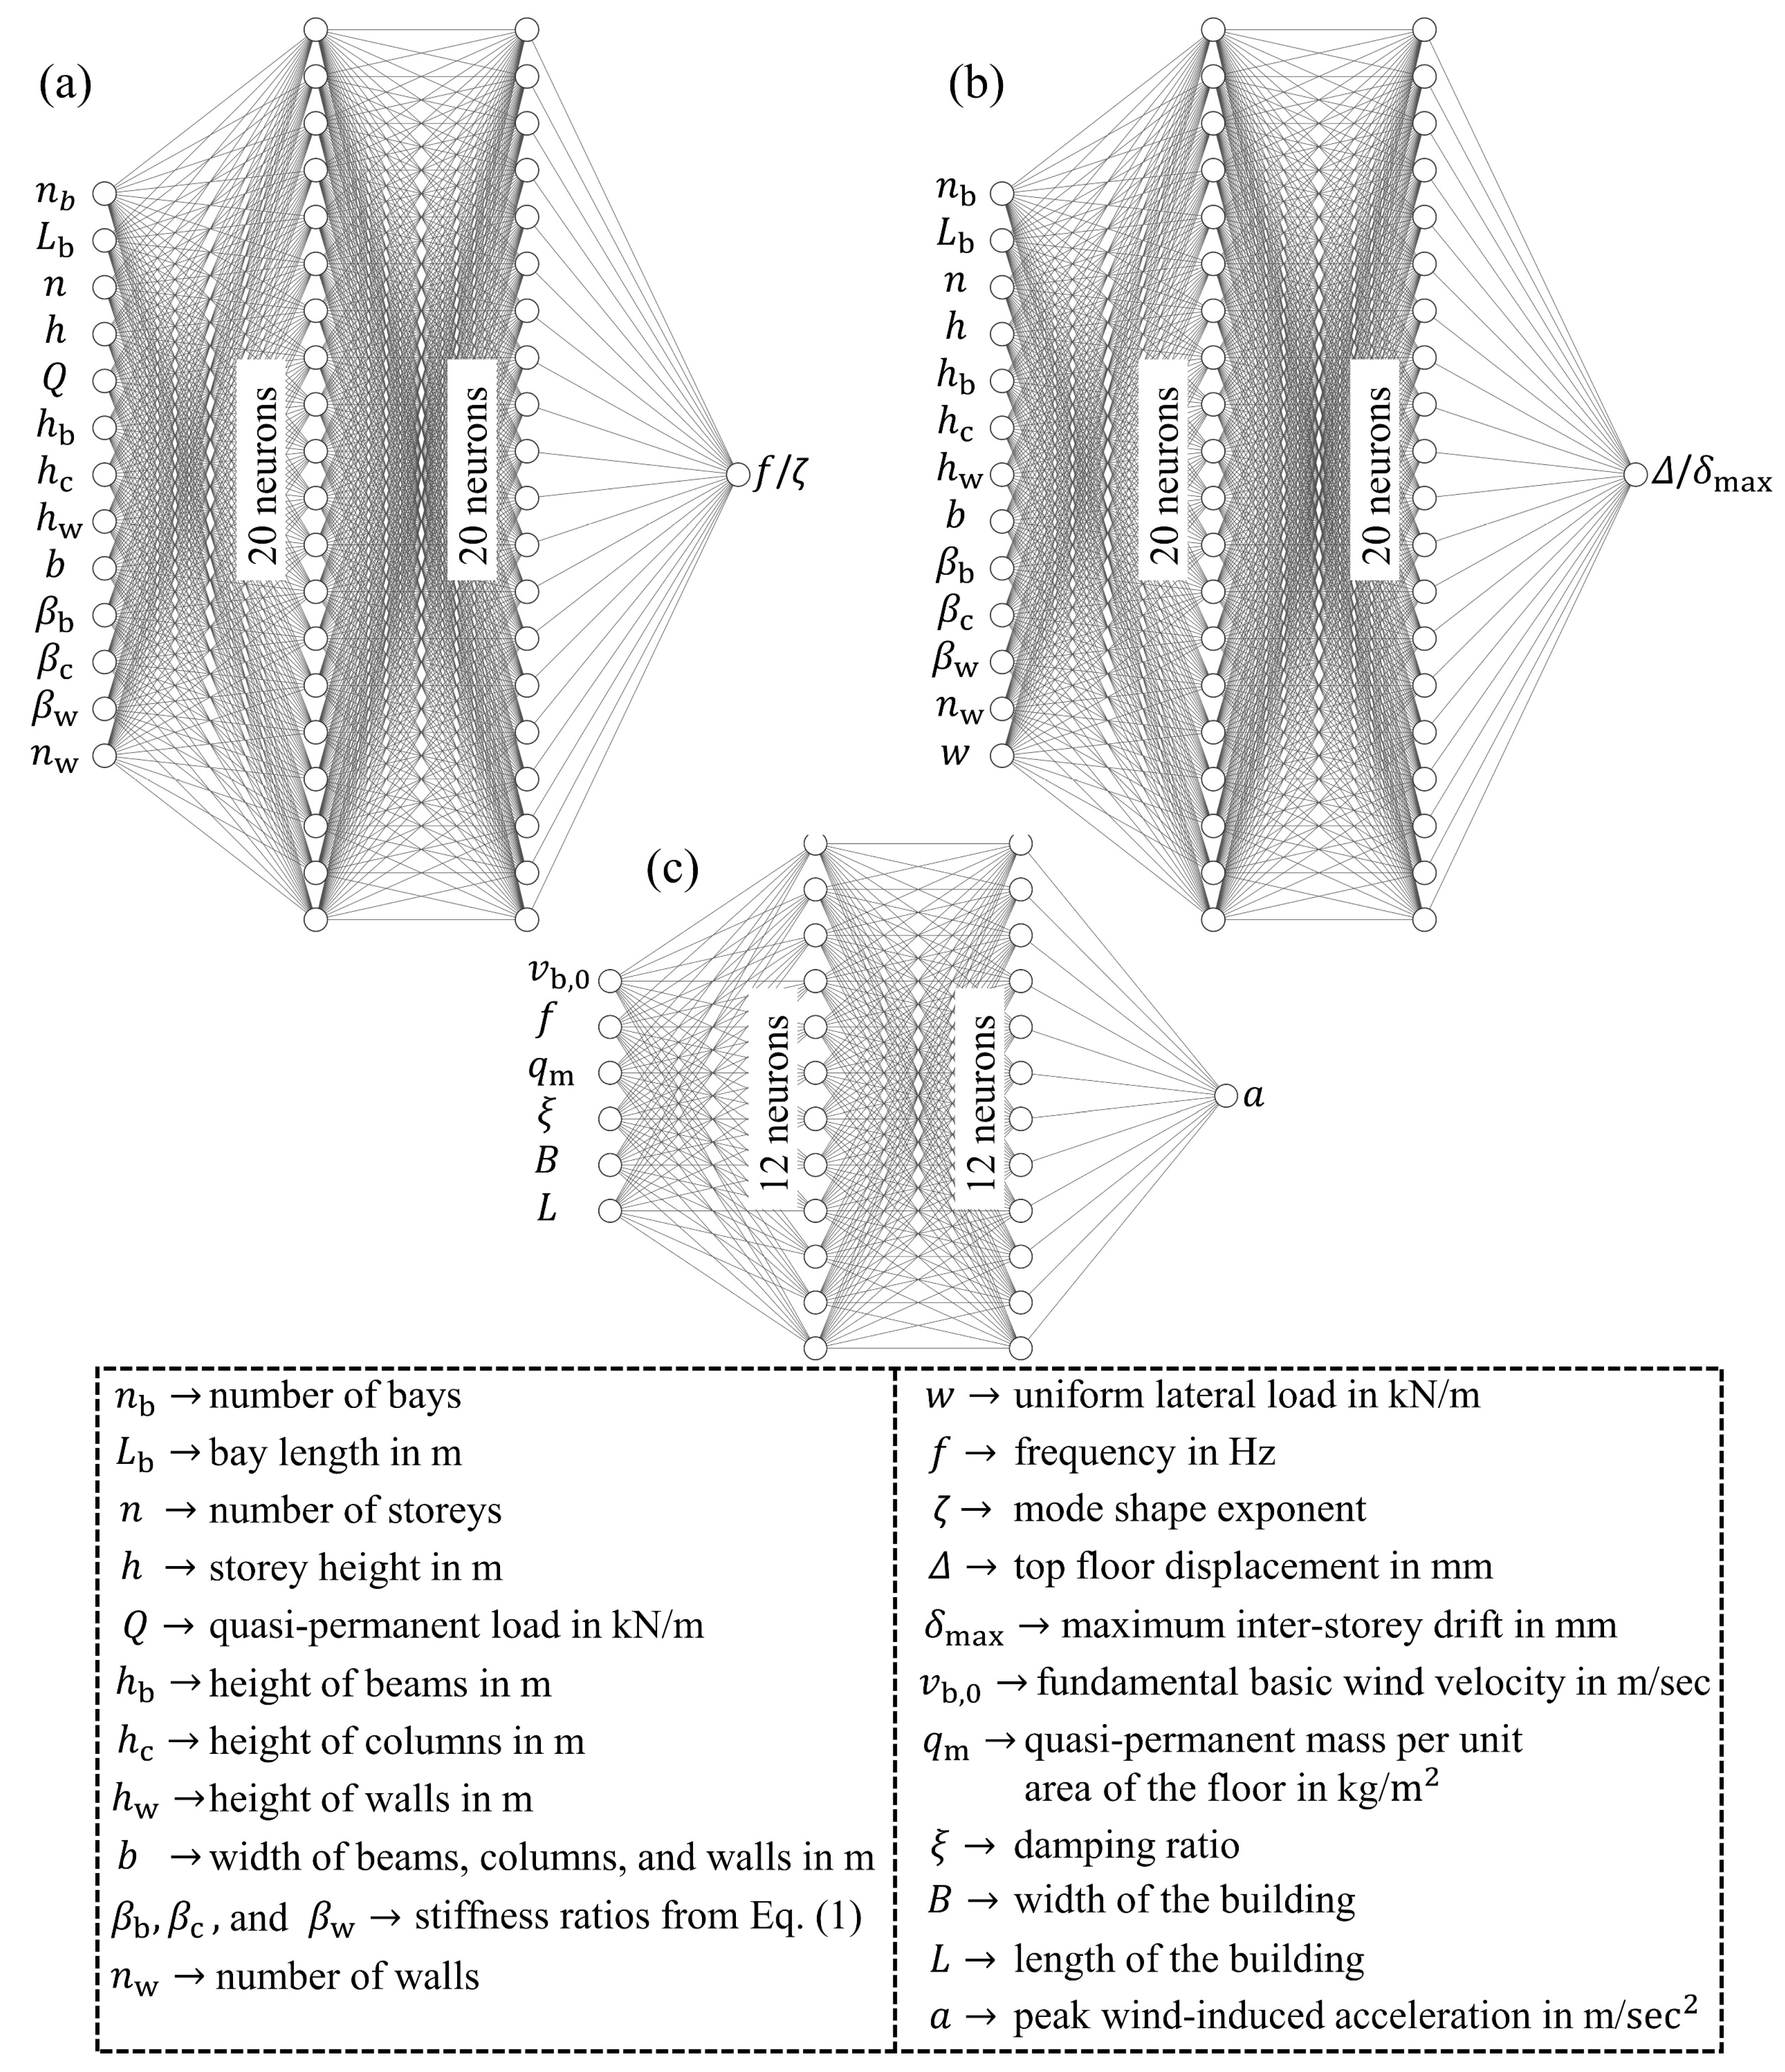
3.2. Artificial Neural Networks (ANNs)

The research community has observed a remarkable increase in the applications of machine learning in structural engineering. A comprehensive review on applications of machine learning techniques in structural engineering can be found in [32]. ANNs are a subset of various machine learning techniques which mimic how biological neurons work. Rosenblatt [33] pioneered the first ANN in 1958, which was employed for pattern recognition purposes.
Five ANNs have been trained for prediction of fundamental frequency f , mode shape exponent ζ , top floor displacement Δ , maximum inter-storey drift δ m a x , and peak wind-induced acceleration a . For the training, 70% of the FEA results was used; the remaining 30% was used for testing the accuracy of the ANNs (referred to as the testing dataset). Figure 11 depicts the architecture of all ANNs. All neurons employ a sigmoid activation function.
Figure 12 depicts the parity plots for the FEA results (and acceleration according to EN 1991-1-4 [29]) and the values predicted using the ANNs for the testing dataset. Each ANN can predict frames with and without CLT walls. As shown in Figure 12, the accuracy of the developed ANNs slightly outperforms the analytical expressions derived using nonlinear regression, with a coefficient of determination of 0.99 for all ANNs.

3.3. Solved Example

The derived analytical expressions and the ANNs were used to estimate lateral displacements and wind-induced acceleration for a dual frame-wall structural system. The results were compared with FEA results. Figure 13 shows the considered example building. In X direction, the building was stabilized using a dual frame-wall system. In Y direction, lateral bracing was assumed. Table 3 summarizes the properties of the dual systems in X.

3.3.1. Solving the Individual Frames in 2D

Substituting in Equations (5) and (8)–(10) for frames 1 and 6:
C 1 = 930 · 2 0.15 · 0.54 0.15 · 2.5 0.45 · 1.5 0.1 = 1479.7
f = 1479.7 · 3 0.7 · 0.585 0.8 · 0.43 0.5 · 2.5 0.15 27 0.85 · 24 1.1 · 5 0.5 = 1.29   H z
ζ = 0.85 · 2 0.1 3 0.3 · 27 24 0.2 · 2.5 0.585 0.3 · 1.5 2.5 0.08 = 0.99
C 2 = 2.35 · 10 4 0.54 0.3 · 2.5 0.85 · 1.5 0.1 · 2 0.1 = 1.162 · 10 4
Δ = 1.162 · 10 4 · 27 0.8 · 3 3.1 · 8 2.2 3 1.6 · 0.585 2.1 · 2.5 0.45 · 0.43 · 2.125 = 8.26   m m
C 3 = 3.5 · 10 4 0.54 0.4 · 2.5 · 1.5 0.15 · 2 0.2 = 1.47 · 10 4
δ m a x = 1.47 · 10 4 · 27 0.6 · 3 3.3 · 8 1.4 3 1.4 · 0.585 1.6 · 2.5 0.35 · 0.43 · 2.125 = 1.33   m m
The ANNs were used to estimate frequency, mode shape exponent, and lateral displacements. Frequencies and lateral displacements calculated using the derived analytical expressions, the ANNs, and the FEA are summarized in Table 4; the mode shapes are plotted in Figure 14.

3.3.2. Estimating the 3D Properties Based on the 2D Results

Assuming symmetry about X (i.e., no eccentricity/torsional modes; consult Figure 13), and diaphragm action at all floor levels, the frequency of the building in Figure 13 in X direction can be estimated based on the frequencies of the 2D frames in Table 4 using Equation (16):
f 3 D = i = 1 N n m a s s , i · f i 2 i = 1 N n m a s s , i
where f 3 D is the frequency of the 3D building in Hz, f i is the frequency of frame (i) in Hz, N is the number of frames (here, 6), and n m a s s , i is the mass ratio (i.e., Q ratio) of frame (i) to a selected reference frame. The derivation of Equation (16) is shown in Appendix A.
Assuming frame 1 to be the reference frame, the mass ratios can be calculated:
n m a s s , 1 = n m a s s , 6 = 5.0 5.0 = 1.0 n m a s s , 2 = n m a s s , 3 = n m a s s , 4 = n m a s s , 5 = 10.0 5.0 = 2.0
Using the frequencies obtained with the derived analytical expressions:
f 3 D = 2 · 1 · 1.29 2 + 2 · 2 · 0.91 2 + 2 · 2 · 0.82 2 2 · 1 + 2 · 2 + 2 · 2 = 0.97   H z  
Using the frequencies obtained with the ANNs:
f 3 D = 2 · 1 · 1.24 2 + 2 · 2 · 0.88 2 + 2 · 2 · 0.77 2 2 · 1 + 2 · 2 + 2 · 2 = 0.92   H z
The frequency estimated from 3D FEA is 0.96 Hz.
Setting the wind load w in Equations (9) and (10) to unity yields the frame compliance. Based on the assumption of diaphragm action, the parallel frames (frames 1–6) can be considered a system of springs in parallel. The compliance of the 3D building can therefore be calculated:
C 3 D 1 = i = 1 N C i 1
where C 3 D is the compliance of the 3D building in mm/(kN/m), C i is the compliance of frame (i) in mm/(kN/m), and N is the number of frames (here, 6).
The displacements ( Δ 3 D and δ m a x , 3 D ) can be calculated by multiplying the compliance term C 3 D by the total load ( P = 2.125 · 2 + 4.25 · 4 = 21.25   k N / m ) .
Using the results of the analytical expressions, the compliance terms for top floor displacement and inter-storey drift can be calculated:
C 3 D , Δ = 0.662   m m / ( k N / m ) ,   C 3 D , δ = 0.109   m m / ( k N / m )  
Multiplying by the total load P :
Δ 3 D = 14.07   m m ,   δ m a x , 3 D = 2.31   m m
Using the results of the ANNs:
C 3 D , Δ = 0.751   m m / ( k N / m ) ,   C 3 D , δ = 0.115   m m / ( k N / m )
Multiplying by the total load P :
Δ 3 D = 15.97   m m ,   δ m a x , 3 D = 2.44   m m
The top floor displacement and inter-storey drift obtained from 3D FEA are 15.20 mm and 2.24 mm, respectively. The results of the 3D analysis are summarized in Table 5.
Using the frequency from Equation (18), and for a basic wind velocity of 26 m/s and a damping ratio of 0.02, the peak wind-induced acceleration can be calculated:
a = 0.0044 · 26 3 0.97 0.9 · 2 · 1000 9.81 0.9 · 27 1.1 · 25 0.2 · 0.02 0.4 = 0.044   m / s 2
The peak wind-induced acceleration estimated using the developed ANN and the procedure described in EN 1991-1-4 [29] are 0.043 m/s2 and 0.037 m/s2, respectively.
The frequency, top floor displacement, and maximum inter-storey drift obtained using the derived analytical expressions and ANNs show good accuracy compared with the results obtained from the FEA. The accelerations calculated using Equation (11) and the ANN are approximately 20% higher than the acceleration calculated using EN 1991-1-4 [29].

4. Conclusions

The fulfilment of serviceability requirements is challenging for multistorey timber buildings, due to their light weight and moderate stiffness. A parametric study using 2D linear elastic Finite Element Analysis (FEA) was performed for Moment-Resisting Timber Frames (MRTFs) with and without Cross Laminated Timber (CLT) walls. Various mechanical and geometrical parameters were varied within practical ranges, resulting in a total of 746,496 analyses.
The FEA results were used to derive simplified analytical expressions for the fundamental frequency, mode shape, top floor displacement, maximum inter-storey drift, and wind-induced acceleration by use of nonlinear regression. The derived analytical expressions show a coefficient of determination (R2) with the FEA results in the range of 0.92–0.99, indicating excellent goodness of fit. The FEA results were also used to train Artificial Neural Networks (ANNs) that can predict the same response parameters. All the developed ANNs show an R2 of 0.99, indicating better accuracy than the analytical expressions.
EN 1998-1 [30] and EN 1991-1-4 [29] provide simplified expressions for the estimation of the fundamental frequency. Comparison between the frequency calculated using FEA and using the expressions provided in EN 1998-1 [30] and EN 1991-1-4 [29] shows that the provided expressions cannot be used and may result in significant underestimation or overestimation of the frequency. Similarly, the mode shape cannot be represented by the exponent values given in EN 1991-1-4 [29]. Therefore, the derived expressions and the ANNs can be used to provide better estimation of the frequency and the mode shape.
Although the derived analytical expressions and the ANNs are designed for 2D analysis, analytical expressions are proposed to allow for extrapolation to a 3D building. A 3D building was solved using FEA, and the results were compared with those obtained using the derived analytical expressions and the ANNs. The comparison showed good agreement, indicating the possibility of using the analytical expressions or the ANNs for preliminary assessment of multistorey timber buildings employing MRTFs, with and without CLT walls, specifically addressing serviceability requirements.
The data used for the development of the analytical expressions and the ANNs were generated based on an assumption of a simplified building layout. This simplification may not accurately capture the complexities and variations found in practical buildings. Future research addressing this limitation is necessary.

Author Contributions

O.A.H., conceptualization, formal analysis, methodology, software, visualization, writing—original draft; H.S. and K.A.M., conceptualization, methodology, supervision, writing—review and editing. All authors have read and agreed to the published version of the manuscript.

Funding

This research received no external funding.

Data Availability Statement

The data presented in this study are available on request from the corresponding author.

Conflicts of Interest

The authors declare no conflict of interest.

Appendix A

Figure A1a shows a plan view of five parallel frames in X direction (frames 1–5). For the derivation of Equation (16), several assumptions were made:
  • The building is symmetric; see the symmetry line in Figure A1a (i.e., no eccentricity), and diaphragm action is assumed at all floor levels.
  • All frames have the same mode shape, i.e., Φ i = Φ , where i is the frame number.
Based on the assumptions above, the 3D angular natural frequency ω 3 D can be calculated:
ω 3 D 2 = i = 1 N Φ T · K i · Φ i = 1 N Φ T · M i · Φ
where Φ is the mode shape (Figure A1b), Φ T is the transpose of the mode shape, K i is the stiffness matrix, M i is the mass matrix, and N is the number of frames.
For an individual frame (i), the angular natural frequency ω i can be calculated:
ω i 2 = Φ T · K i · Φ Φ T · M i · Φ Φ T · K i · Φ = Φ T · M i · Φ · ω i 2
Substituting with Equation (A2) in Equation (A1):
ω 3 D 2 = i = 1 N Φ T · M i · Φ · ω i 2 i = 1 N Φ T · M i · Φ
Assuming Frame 1 to be the reference frame, the mass ratio n m a s s , i = M i / M 1 can be calculated. Substituting in Equation (A3):
ω 3 D 2 = i = 1 N Φ T · M 1 · Φ · n m a s s , i · ω i 2 i = 1 N Φ T · M 1 · Φ · n m a s s , i
The term Φ T · M 1 · Φ is a scalar and is a common factor, leading to:
ω 3 D 2 = i = 1 N n m a s s , i · ω i 2 i = 1 N n m a s s , i
Dividing Equation (A5) by ( 2 π ) 2 leads to:
f 3 D 2 = i = 1 N n m a s s , i · f i 2 i = 1 N n m a s s , i f 3 D = i = 1 N n m a s s , i · f i 2 i = 1 N n m a s s , i
Figure A1. Example building (a) plan view and (b) mode shape of the 3D building in X.
Buildings 14 02975 g0a1

References

  1. Hegeir, O.; Stamatopoulos, H.; Malo, K.A. Serviceability performance of timber dual frame-wall structural system under wind loading. In Proceedings of the World Conference on Timber Engineering (WCTE 2023), Oslo, Norway, 19–22 June 2023. [Google Scholar] [CrossRef]
  2. Vilguts, A.; Stamatopoulos, H.; Malo, K.A. Parametric analyses and feasibility study of moment-resisting timber frames under service load. Eng. Struct. 2021, 228, 111583. [Google Scholar] [CrossRef]
  3. Stamatopoulos, H.; Malo, K.A. Wood frame solutions for free space design in urban buildings (WOODSOL). In Proceedings of the 7th Forum Wood Building Nordic, Växjö, Sweden, 27–28 September 2018; pp. 27–28. [Google Scholar]
  4. Cao, A.S.; Stamatopoulos, H. A theoretical study of the dynamic response of planar timber frames with semi-rigid moment-resisting connections subjected to wind loads. Eng. Struct. 2021, 240, 112367. [Google Scholar] [CrossRef]
  5. Malo, K.A.; Abrahamsen, R.B.; Bjertnæs, M.A. Some structural design issues of the 14-storey timber framed building “Treet” in Norway. Eur. J. Wood Wood Prod. 2016, 74, 407–424. [Google Scholar] [CrossRef]
  6. Aloisio, A.; Pasca, D.P.; De Santis, Y.; Hillberger, T.; Giordano, P.F.; Rosso, M.M.; Tomasi, R.; Limongelli, M.P.; Bedon, C. Vibration issues in timber structures: A state-of-the-art review. J. Build. Eng. 2023, 76, 107098. [Google Scholar] [CrossRef]
  7. Johansson, M.; Linderholt, A.; Jarnerö, K.; Landel, P. Tall timber buildings: A preliminary study of wind-induced vibrations of a 22-storey building. In Proceedings of the World Conference on Timber Engineering (WCTE 2016), Vienna, Austria, 22–25 August 2016; Vienna University of Technology: Vienna, Austria, 2016. [Google Scholar]
  8. Chapain, S.; Aly, A.M. Vibration Attenuation in a High-Rise Hybrid-Timber Building: A Comparative Study. Appl. Sci. 2023, 13, 2230. [Google Scholar] [CrossRef]
  9. Wells, M. Raising the bar for timber buildings. In Proceedings of the Institution of Civil Engineers-Civil Engineering, Stadthaus, London, UK, August 2011; Thomas Telford Ltd.: London, UK, 2011; Volume 164, pp. 122–128. [Google Scholar]
  10. Tulebekova, S.; Malo, K.A.; Rønnquist, A. Dynamic identification and model calibration of connection stiffness in multi-storey cross-laminated timber buildings. J. Build. Eng. 2023, 72, 106607. [Google Scholar] [CrossRef]
  11. Abrahamsen, R. Mjøstårnet-Construction of an 81 m tall timber building. In Proceedings of the Internationales Holzbau-Forum IHF, Garmisch-Partenkirchen, Germany, 6–8 December 2017; Volume 2017. [Google Scholar]
  12. Stamatopoulos, H.; Malo, K.A.; Vilguts, A. Moment-resisting beam-to-column timber connections with inclined threaded rods: Structural concept and analysis by use of the component method. Constr. Build. Mater. 2022, 322, 126481. [Google Scholar] [CrossRef]
  13. Vilguts, A.; Nesheim, S.; Stamatopoulos, H.; Malo, K.A. A study on beam-to-column moment-resisting timber connections under service load, comparing full-scale connection testing and mock-up frame assembly. Eur. J. Wood Wood Prod. 2022, 80, 753–770. [Google Scholar] [CrossRef]
  14. Malo, K.A.; Stamatopoulos, H. Connections with threaded rods in moment resisting frames. In Proceedings of the World Conference on Timber Engineering (WCTE2016), Vienna, Austria, 22–25 August 2016. [Google Scholar]
  15. Vilguts, A.; Malo, K.A.; Stamatopoulos, H. Moment resisting frames and connections using threaded rods in beam-to-column timber joints. In Proceedings of the World Conference on Timber Engineering (WCTE2018), Seoul, Republic of Korea, 20–23 August 2018. [Google Scholar]
  16. Fragiacomo, M.; Batchelar, M. Timber frame moment joints with glued-in steel rods. I: Design. J. Struct. Eng. 2012, 138, 789–801. [Google Scholar] [CrossRef]
  17. Fragiacomo, M.; Batchelar, M. Timber frame moment joints with glued-in steel rods. II: Experimental investigation of long-term performance. J. Struct. Eng. 2012, 138, 802–811. [Google Scholar]
  18. Gauthier-Turcotte, É.; Ménard, S.; Fiset, M. Strength and Behavior of Spruce Pine Glulam Timber Moment Connections Using Glued-In Steel Rods. J. Struct. Eng. 2022, 148, 04022192. [Google Scholar]
  19. Fang, L.; Wang, L.; Qu, W.; Zhang, S. Mechanical performance of glulam beam-column moment-resisting connections with self-tapping screws as fasteners. J. Build. Eng. 2022, 54, 104586. [Google Scholar] [CrossRef]
  20. Lam, F.; Gehloff, M.; Closen, M. Moment-resisting bolted timber connections. Proc. Inst. Civ. Eng.-Struct. Build. 2010, 163, 267–274. [Google Scholar] [CrossRef]
  21. Zhang, C.; Guo, H.; Jung, K.; Harris, R.; Chang, W.S. Using self-tapping screw to reinforce dowel-type connection in a timber portal frame. Eng. Struct. 2019, 178, 656–664. [Google Scholar] [CrossRef]
  22. Zhu, M.; McKenna, F.; Scott, M.H. OpenSeesPy: Python library for the OpenSees finite element framework. SoftwareX 2018, 7, 6–11. [Google Scholar] [CrossRef]
  23. NS-EN 14080; Timber Structures-Glued Laminated Timber and Glued Solid Timber-Requirements. European Committee for Standardization: Brussels, Belgium, 2013.
  24. NS-EN 338; Structural Timber–Strength Classes. European Committee for Standardization: Brussels, Belgium, 2016.
  25. Blass, H.J.; Fellmoser, P. Design of solid wood panels with cross layers. In Proceedings of the 8th World Conference on Timber Engineering, Lahti, Finland, 14–17 June 2004. [Google Scholar]
  26. Follesa, M.; Christovasilis, I.P.; Vassallo, D.; Fragiacomo, M.; Ceccotti, A. Seismic design of multi-storey CLT buildings according to Eurocode 8. Ingegneria Sismica. Int. J. Earthq. Eng. Spec. Issue Timber Struct. 2013, 30, 27–53. [Google Scholar]
  27. Steenbergen, R.D.J.M.; Vrouwenvelder, A.C.W.M.; Geurts, C.P.W. The use of Eurocode EN 1991-1-4 procedures 1 and 2 for building dynamics, a comparative study. J. Wind. Eng. Ind. Aerodyn. 2012, 107, 299–306. [Google Scholar] [CrossRef]
  28. Landel, P.; Johansson, M.; Linderholt, A. Comparative study of wind-induced accelerations in tall timber buildings according to four methods. In Proceedings of the WCTE 2021, World Conference on Timber Engineering, Santiago, Chile, 9–12 August 2021. [Google Scholar]
  29. NS-EN 1991-1-4:2005+NA:2009; Actions on Structures—Part 1-4: General Actions–Wind Actions. European Committee for Standardization: Brussels, Belgium, 2009.
  30. EN1998-1:2004; In Eurocode 8: Design of Structures for Earthquake Resistance—Part 1: General Rules, Seismic Actions and Rules for Buildings. European Committee for Standardization: Brussels, Belgium, 2004.
  31. Feldmann, A.; Huang, H.; Chang, W.; Harris, R.; Dietsch, P.; Gräfe, M.; Hein, C. Dynamic properties of tall timber structures under wind-induced vibration. In Proceedings of the World Conference on Timber Engineering (WCTE 2016), Vienna, Austria, 22–25 August 2016. [Google Scholar]
  32. Thai, H.-T. Machine learning for structural engineering: A state-of-the-art review. Structures 2022, 38, 448–491. [Google Scholar] [CrossRef]
  33. Rosenblatt, F. The perceptron: A probabilistic model for information storage and organization in the brain. Psychol. Rev. 1958, 65, 386. [Google Scholar] [CrossRef] [PubMed]
Figure 1. An example of a multistorey timber building with dual frame-wall system in X direction.
Buildings 14 02975 g001
Figure 2. Planar dual frame-wall (a) analytical model, (b) variations with two bays, and (c) variations with three bays.
Buildings 14 02975 g002
Figure 3. Parity plot for frequency from FEA and Equations (2) and (3).
Buildings 14 02975 g003
Figure 4. Parity plots for fundamental frequency from FEA and Equation (5).
Buildings 14 02975 g004
Figure 5. Mode shape obtained from FEA and using Equation (4) with ζ = 0.6 and 1.0.
Buildings 14 02975 g005
Figure 6. Parity plots for mode shape exponent from FEA and Equations (7) and (8).
Buildings 14 02975 g006
Figure 7. Parity plots for top floor displacement from FEA and Equation (9).
Buildings 14 02975 g007
Figure 8. Inter-storey drift for a representative set of 10,000 frames ( w = 1 kN/m).
Buildings 14 02975 g008
Figure 9. Parity plots for maximum inter-storey drift from FEA and Equation (10).
Buildings 14 02975 g009
Figure 10. Parity plot for peak acceleration using EN 1991-1-4 [29] and Equation (11).
Buildings 14 02975 g010
Figure 11. Architecture of the developed ANNs for the prediction of (a) fundamental frequency and mode shape exponent, (b) top floor displacement and maximum inter-storey drift, and (c) peak wind-induced acceleration.
Buildings 14 02975 g011
Figure 12. Parity plots for the ANNs (for frames with and without CLT walls) for the prediction of (a) fundamental frequency, (b) mode shape exponent, (c) top floor displacement, (d) maximum inter-storey drift, and (e) peak wind-induced acceleration.
Buildings 14 02975 g012
Figure 13. The considered example building.
Buildings 14 02975 g013
Figure 14. Mode shapes of individual frames in 2D.
Buildings 14 02975 g014
Table 1. Parameters of the parametric study.
ParameterValueParameterValueParameterValue
n 4/6/8/10/12/14 q (kN/m2)1.5/3.0 h b (mm)450/540/630
h (m)3.0/3.5 w (kN/m)1.0 h c (mm)420/585/765
n b 2/3 C / C (m)3.0/4.5/6.0 h w (m)1.0/2.0/3.0
L b (m)6.0/7.5/9.0 b (mm)140/215/430 β b , β c , β w 1/2/5/10
Table 2. Assumed constant parameters for the calculation of wind-induced acceleration.
ParameterValue
Directional factor C d i r 1.0
Seasonal factor C s e a s o n 1 .00
Probability factor C p r o b 0.73
Orography factor C 0 ( z ) 1 .00
Turbulence factor k l 1 .00
Terrain categoryUrban environment ( I V )
Reference height Z t 200
Reference length L t 300
Table 3. Parameters of the dual frame-wall systems in X.
ParameterFrames 1 and 6Frames 2 and 5Frames 3 and 4
n 8
h (m)3.0
n b 3
L b (m)9.0
n w 221
h w (m)2.52.52.5
h b (m)0.5850.5850.585
h c (m)0.540.540.54
b (m) a0.430.430.43
β w 1.51.51.5
β b 2.52.52.5
β c 2.02.02.0
K θ , w (kNm/rad) b279,948279,948279,948
K θ , b (kNm/rad) b25,90625,90625,906
K θ , c (kNm/rad) b611361136113
q (kN/m2)2.02.02.0
Q (kN/m)5.010.010.0
w (kN/m) c2.1254.254.25
a Double cross section was assumed, b Substituting β in Equation (1), c Corresponds to a fundamental basic wind velocity of 26 m/s and urban environment (IV) as defined in EN 1991-1-4 [29].
Table 4. Summary of the results calculated using the derived expressions, ANNs, and FEA in 2D.
Method of CalculationFrames 1 and 6Frames 2 and 5Frames 3 and 4
f
(Hz)
Δ
(mm)
δ m a x
(mm)
f
(Hz)
Δ
(mm)
δ m a x
(mm)
f
(Hz)
Δ
(mm)
δ m a x
(mm)
Analytical expressions1.298.261.330.9116.512.660.8217.703.05
ANNs1.248.811.340.8817.622.690.7723.223.58
FEA1.278.691.270.8917.372.550.7624.103.85
Table 5. Summary of results using the derived expressions, ANNs, and FEA in 3D.
Method of Calculation f 3 D (Hz) Δ 3 D (mm) δ m a x , 3 D (mm)
Analytical expressions0.9714.072.31
ANNs0.9215.972.44
FEA0.9615.202.24
Disclaimer/Publisher’s Note: The statements, opinions and data contained in all publications are solely those of the individual author(s) and contributor(s) and not of MDPI and/or the editor(s). MDPI and/or the editor(s) disclaim responsibility for any injury to people or property resulting from any ideas, methods, instructions or products referred to in the content.

