1. Introduction
Environmental evaluation of buildings has played an essential role in conserving resource use and improving overall performance. Approaches such as Life Cycle Assessment (LCA) and other ecological accounting models offer environmental decision-making solutions. While on one hand, LCA methods explicitly include manufacturing and maintenance energies or costs, they exclude much of the environmental work provided by the biosphere in the formation and concentration of resources, particularly raw materials used in the manufacture of building materials. With respect to inventory data and aggregation methods, LCA primarily focuses on emissions, and direct and indirect consumption of resources through every stage of a product’s life cycle. This involves a cradle-to-grave approach to evaluating the product or process, since its environmental impact is assessed from the point of obtaining the raw materials for product development through production, distribution, and its final disposal or recycling [
1,
2].
In the building sector, embodied energy of the building materials and energy consumption and the associated emissions over the period of use were evaluated using the LCA method [
3]. While almost all of the embodied energy is accumulated during the construction phase of the building, energy used for operating the building,
i.e., electricity, chilled water, water, steam, wastewater treatment,
etc., constitutes the operational phase of the building. A study by Sartori and Hestnes [
4] revealed a linear relation between operating and total energy use across sixty cases in a survey of nine countries. A similar study by Ramesh
et al. [
5] showed that most of the building lifecycle energy is expended during its operational phase. In [
6], a methodological approach was proposed to design and evaluate eco-design of buildings. Besides concluding that the operational phase had the highest contribution over the entire lifecycle of the three buildings studied in this paper, Asdrubali
et al. implemented energy optimizations to reduce operational energy use. Nevertheless, the use of LCA for buildings is not as ubiquitous as in the manufacturing industry. Moreover, issues such as setting system boundaries, procedural responsibility, allocation of inputs used (resource consumption), undesired outputs (emissions), and heavy dependency on data collection expenses and data quality, in some cases impose restrictions on the application of LCA. Besides, most of the ecosystem services that are required for dispersing the emissions and absorbing their impact are not specified in the LCA methods and the links between LCA and natural resource depletion are largely missing [
7]. Moreover, lacking a rigorous thermodynamic framework in LCA leads to the incompleteness and inaccuracy of ecosystem analysis and in certain situations may even violate thermodynamic laws [
8].
On the other hand, emergy analysis, as an ecological accounting model offers environmental decision-making solutions, which include ecological considerations related to material and energy flows during a building’s entire lifetime. Emergy was developed to systematically include all the work required for the preparation and delivery of a resource or service [
9]. In emergy analysis, first, a system diagram of the process or system under consideration is constructed. This is followed by accounting for all inputs and outflows over the lifespan of the material or product, including an inventory of essential processes, storages, and flows [
10]. Emergy analysis uses thermodynamic principles and offers a “total environmental analysis” that includes all environmental energies involved in the system under investigation. A few research efforts have focused on assessing built environments using emergy analysis. They are: evaluation of recycling and reuse of building materials [
11]; emergy associated with the operation of a building [
12]; building manufacturing, maintenance, and development of Em-building indices [
13]; emergy evaluation of a green façade [
14]; comparison of life cycle methodologies [
15]; emergy-energy assessment of buildings [
16]. Among these, an energy and emergy based cost-benefit evaluation of building envelopes relative to geographical location and climate [
17] focused on the building envelope. Also, an emergy-based method to assess the Renewable Emergy Balance (REB) of a building to guide movement towards the highest order of sustainability was developed and demonstrated using a case study building [
18].
The central aspect of a REB is the estimation of the maximum renewable emergy potential of the building. This quantity is a limit, also a moving target, which improves as the technology improves to integrate and/or generate more renewable resources. Moreover, this limit sets a benchmark that is required to achieve a higher level of sustainability in buildings.
In order to strive for material and energy balance in buildings, there is an urgent need to assess the renewable and non-renewable resources used in the manufacturing process and to progressively replace non-renewable resources with renewables. Such progressive disinvestment in non-renewable resources that may be substituted with renewable resources is referred to as Renewable Substitutability (RS), and if implemented, will lead to a paradigm shift in the way building materials are manufactured [
18]. For this paper, emergy analysis was chosen as the tool to assess the resources used in building and to develop the Renewable Substitutability Index (RSI). This paper develops a Renewable Substitutability Index to maximize renewable resource use in buildings using emergy analysis as the means of assessment. A case study of an existing building in a university campus setting was used to demonstrate the application of RSI to attain maximum renewable resource investment. This paper is organized as follows: while
Section 2 discusses the concept of RSI and its significance,
Section 3 uses a case study building in a university campus setting to apply the concept of RSI and to discover how this index can be used for optimal decision-making during material replacement.
2. Renewable Substitutability Index (RSI) of a Building
A building is supported by a variety of inputs and outputs, some purchased and others provided free (
i.e., without explicit cost) by the environment. Inputs include embodied energies of all kinds and qualities, from the sun shining on the window to the ancient sunlight expended in the formation of the fossil fuels used to prepare the glass through which the sun is shining. By translating all inputs into emergy with a common energy unit, the solar emjoule (sej), meaningful comparisons can be established between renewable and non-renewable resources, and between natural and manmade energies, including refining the assessment of real costs over time. The quasi-sustainability principle as discussed by Holling [
19] and Odum [
20,
21] can be extended to buildings,
i.e., related to renew- non-renew substitution [
18]. Theoretical possibilities of using non-renewables to take advantage of renewable resources have been discussed by Bastianoni
et al. [
22].
In other words, as emergy is accounted for in a particular system, the renewability and non-renewability of materials are appropriately identified. This, then, is used to develop Renewable Substitutability, followed by, calculating RSI values for decision-making. For example, the electric energy from coal used in a cement manufacturing unit might be replaced with electricity generated from renewable resources such as solar, kinetic energy of wind, water or geothermal heat. Thus, the use of non-renewable resources to improve the system’s capacity to exploit renewable resources will aid the development of a quasi-sustainable solution, over the long run. Such non-renewable resources may be replaced with renewable resources progressively.
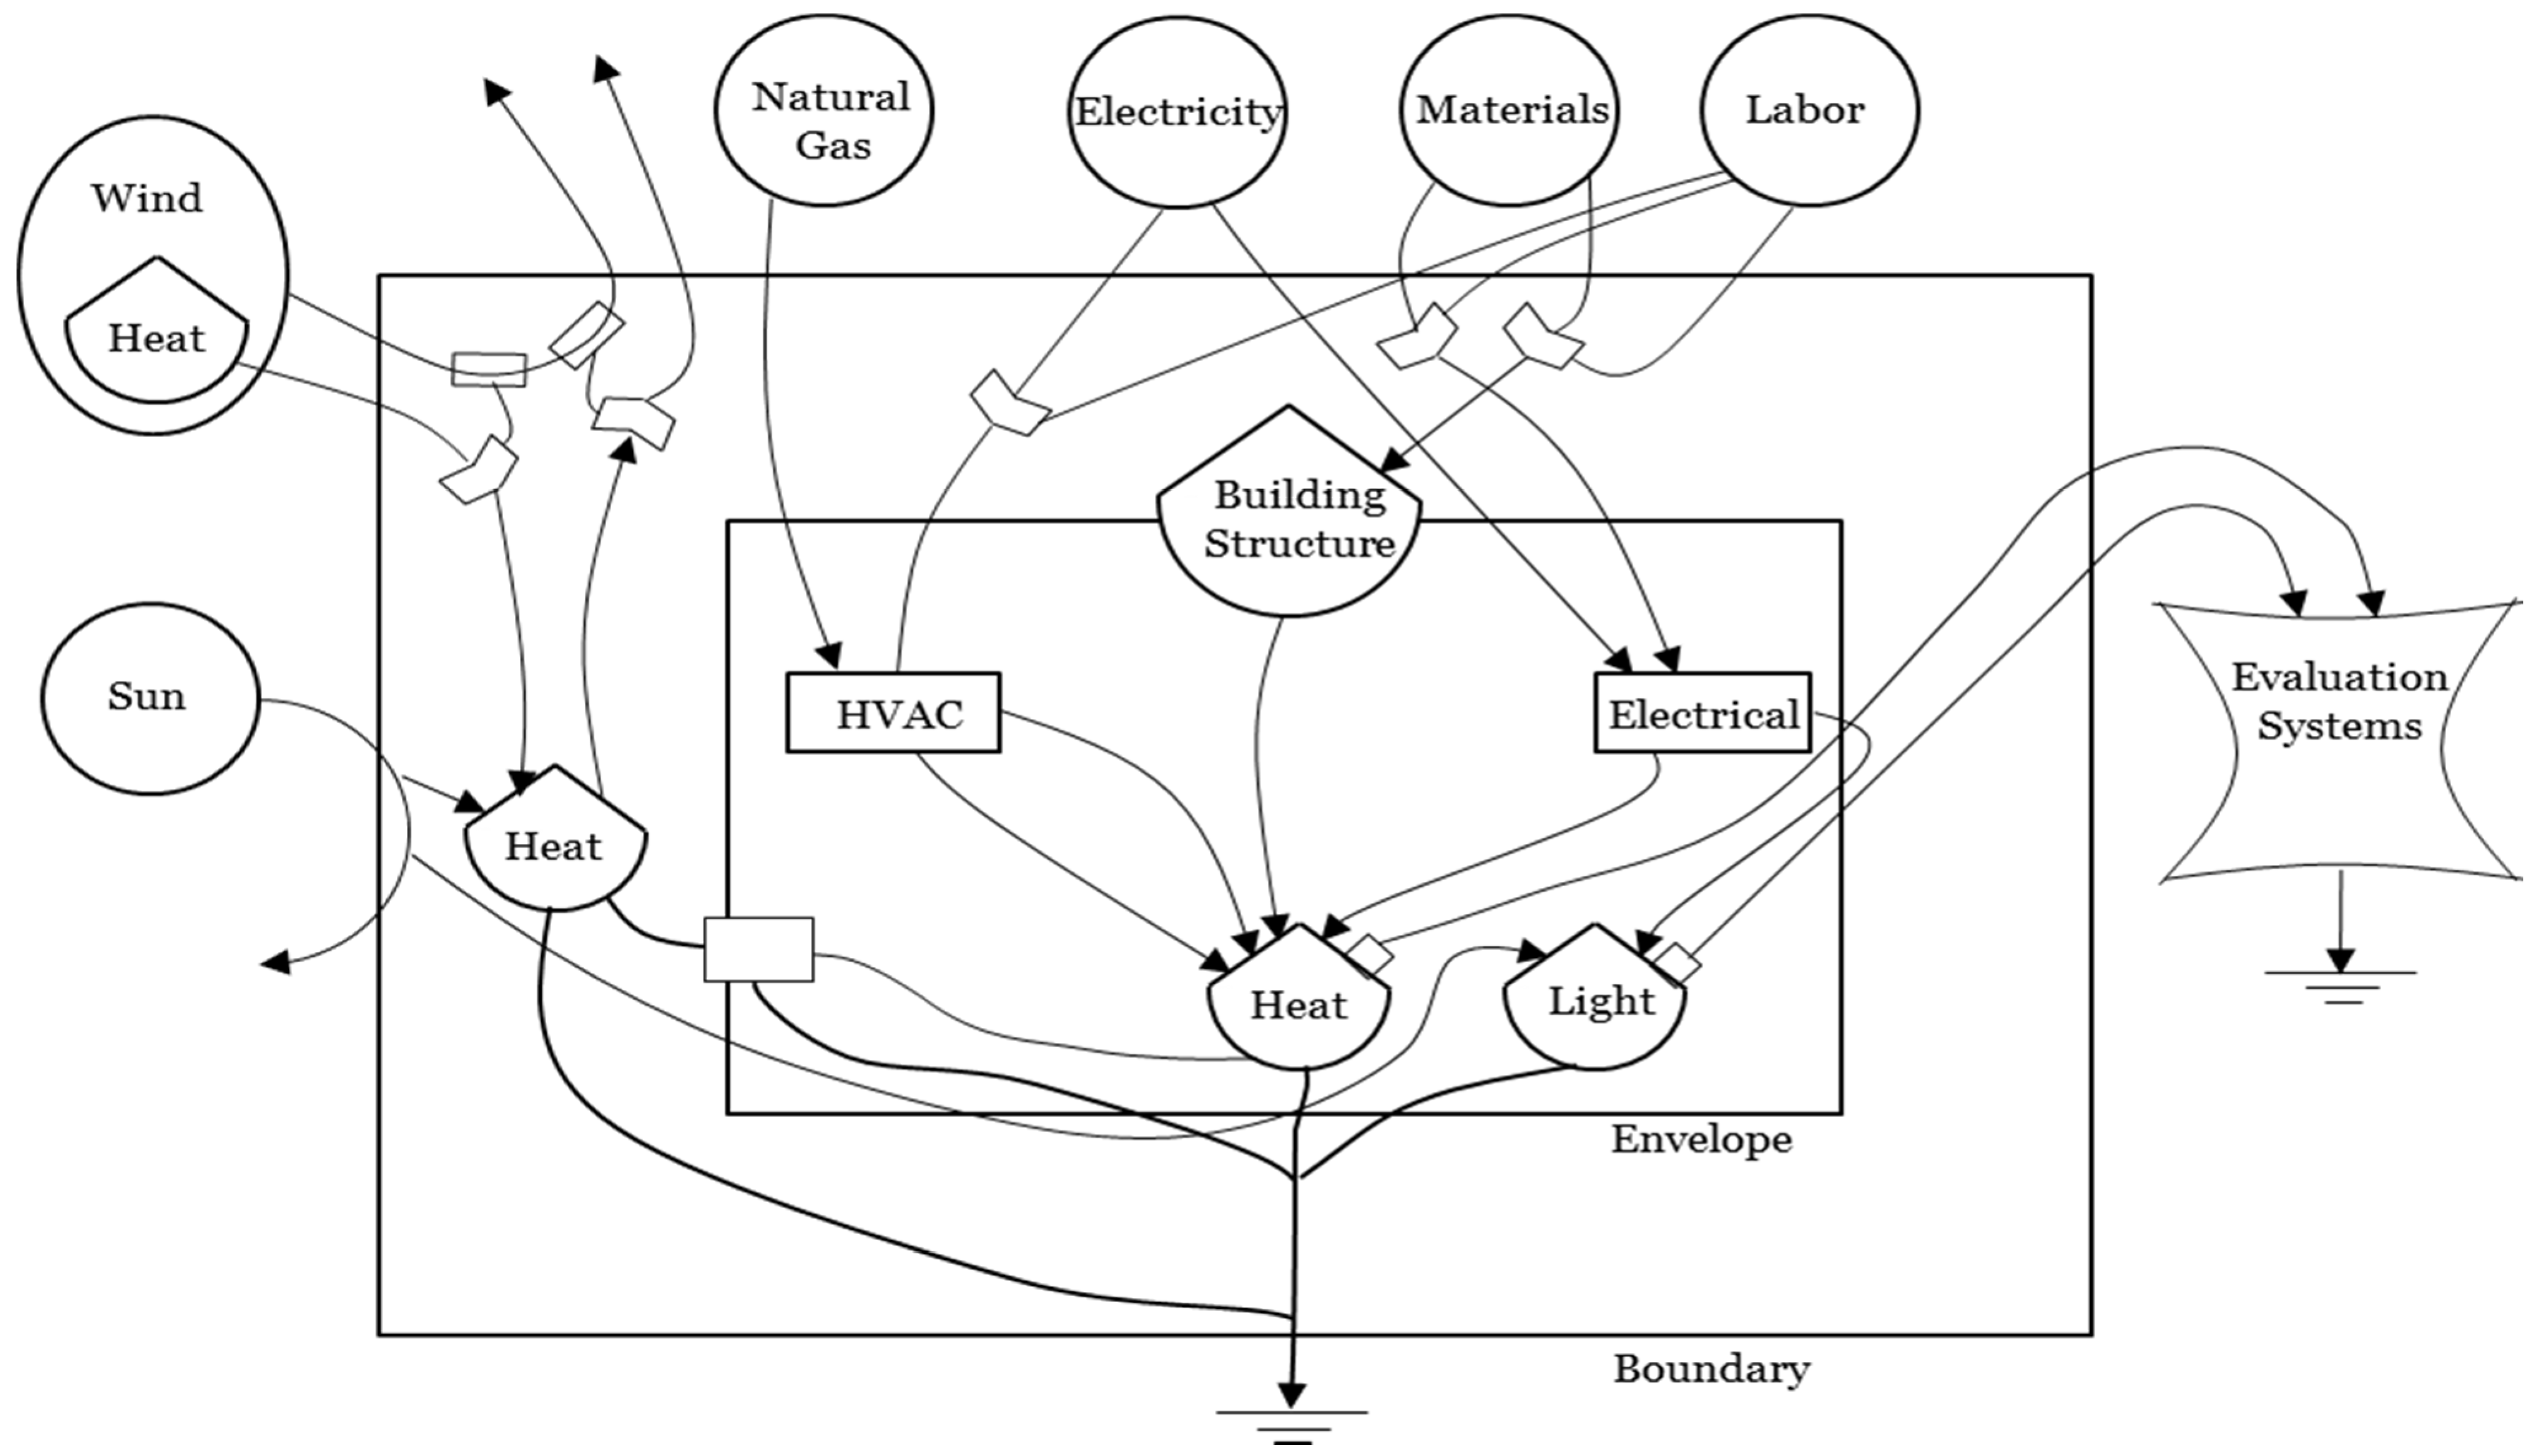
Figure 1 shows a simplified systems diagram.
Figure 1.
Typical systems diagram of a building. Only building structure was used for this study.
Figure 1.
Typical systems diagram of a building. Only building structure was used for this study.
Using emergy analysis and through the identification of the Renewable Substitutability of all non-renewable resources, the emergy content may be split into non-renewables with Renewable Substitutability (RS) and unsubstitutable Non-Renewables (NR),
i.e., non-renewable resources that cannot be substituted with renewables using the best available technology. Detailed steps and explanation of developing RS and NR for building materials is discussed in Srinivasan
et al. [
18]; Table A.1 in the paper of Srinivasan
et al. [
18] lists the RS and NR for a subset of building materials. Non-renewable resources with Renewable Substitutability have, at least, a potential to be replaced by Renewables (R) and this should be exploited to attain more sustainable buildings. Thus, the Renewable Substitutability Index in a building’s useful life is defined as the ratio of the Renewables used in construction, including replacement and maintenance, to its maximum renewable emergy potential. The maximum renewable potential is sum of R and RS.
where R
n and (R
n + RS
n) are the amount of renewable materials used and the maximum renewable potential remaining of
n materials.
A building structure may be described as a collection of element-level (e.g., brick, wood flooring, etc.) or component-level (e.g., building envelope, HVAC, etc.) parts. RSI values range between 0 and 1.0. Thus, by making progressive improvements, over the useful life of a building, all non-renewable resources with Renewable Substitutability can be replaced by renewables, and the RSI of the building will approach 1.0, at which point it will achieve a Renewable Emergy Balance. The central aspect of RSI is that it can be used to evaluate improvement strategies during the operation and maintenance phases of existing structures. RSI can also be used to compare element-level building data such as brick, concrete, steel, aluminum, ceramic, wood, etc.
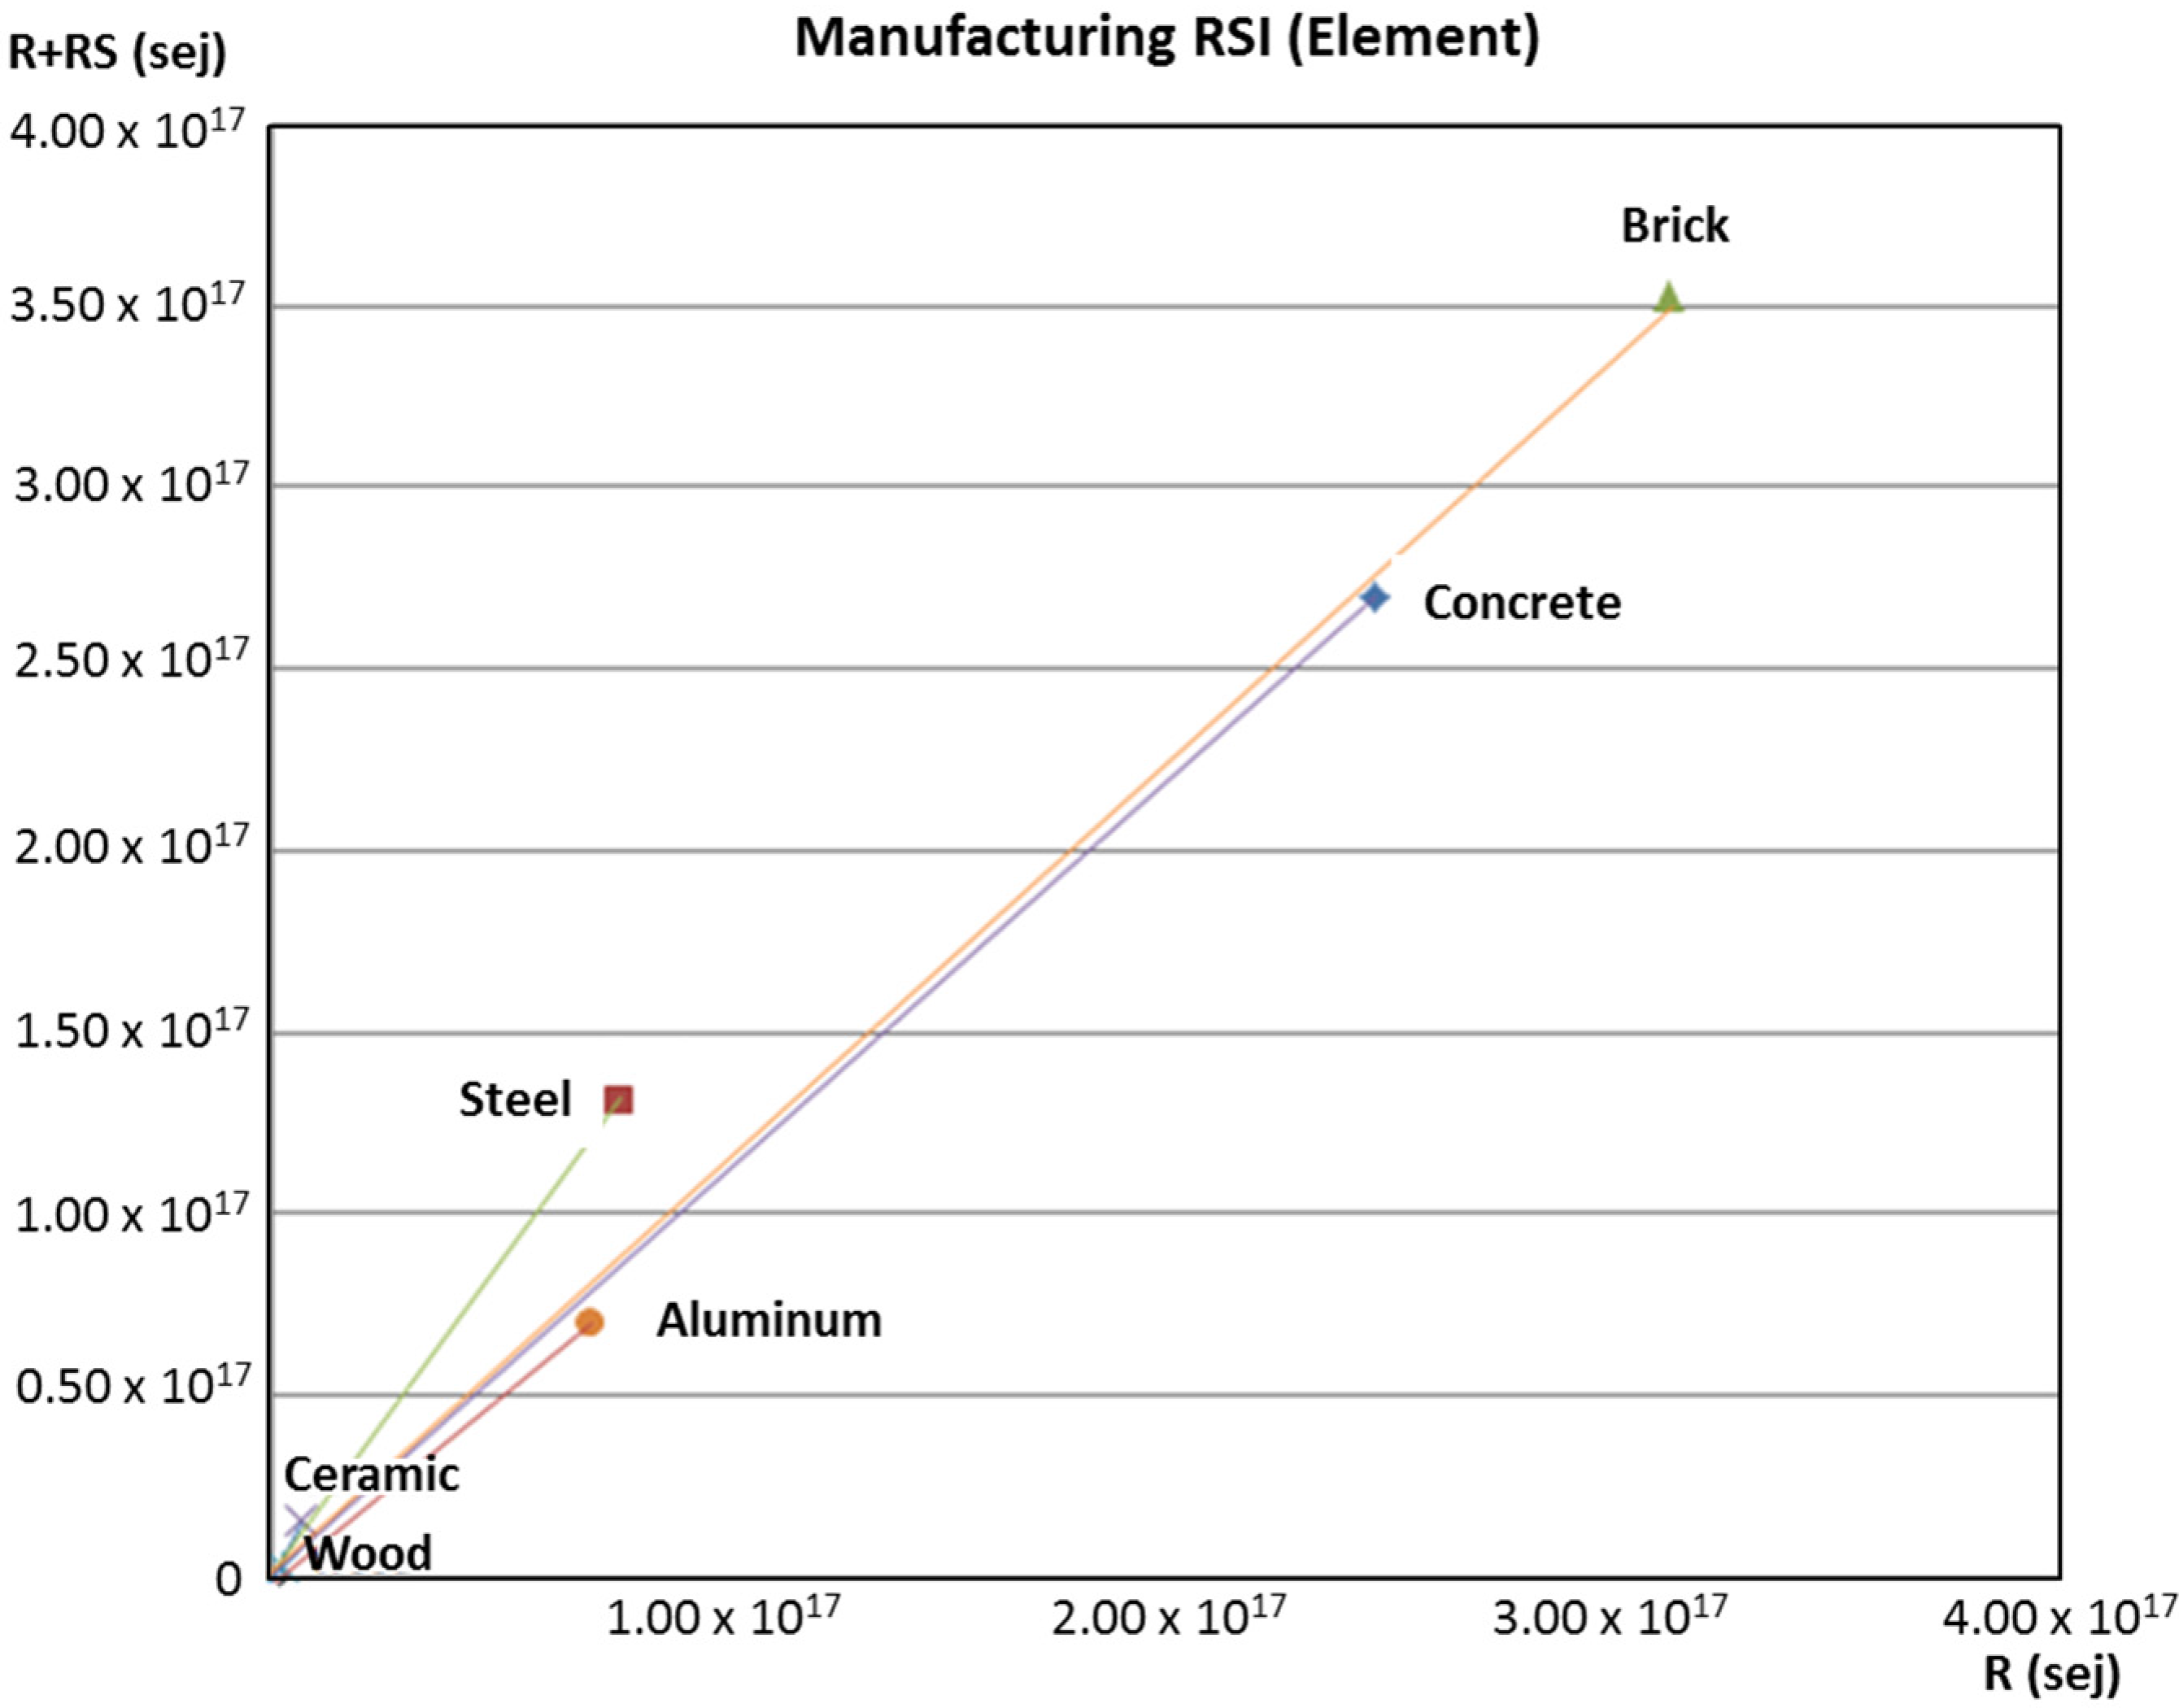
Figure 1 compares element-level data; the
X- and
Y- axes represent Renewables (R) and maximum renewable emergy potential (R + RS) respectively. The highest, or optimal, RSI is achieved if the elemental data falls on the bisector,
i.e., when R equals (R + RS),
i.e., RSI equals 1.0. For example, in
Figure 2 (refer to
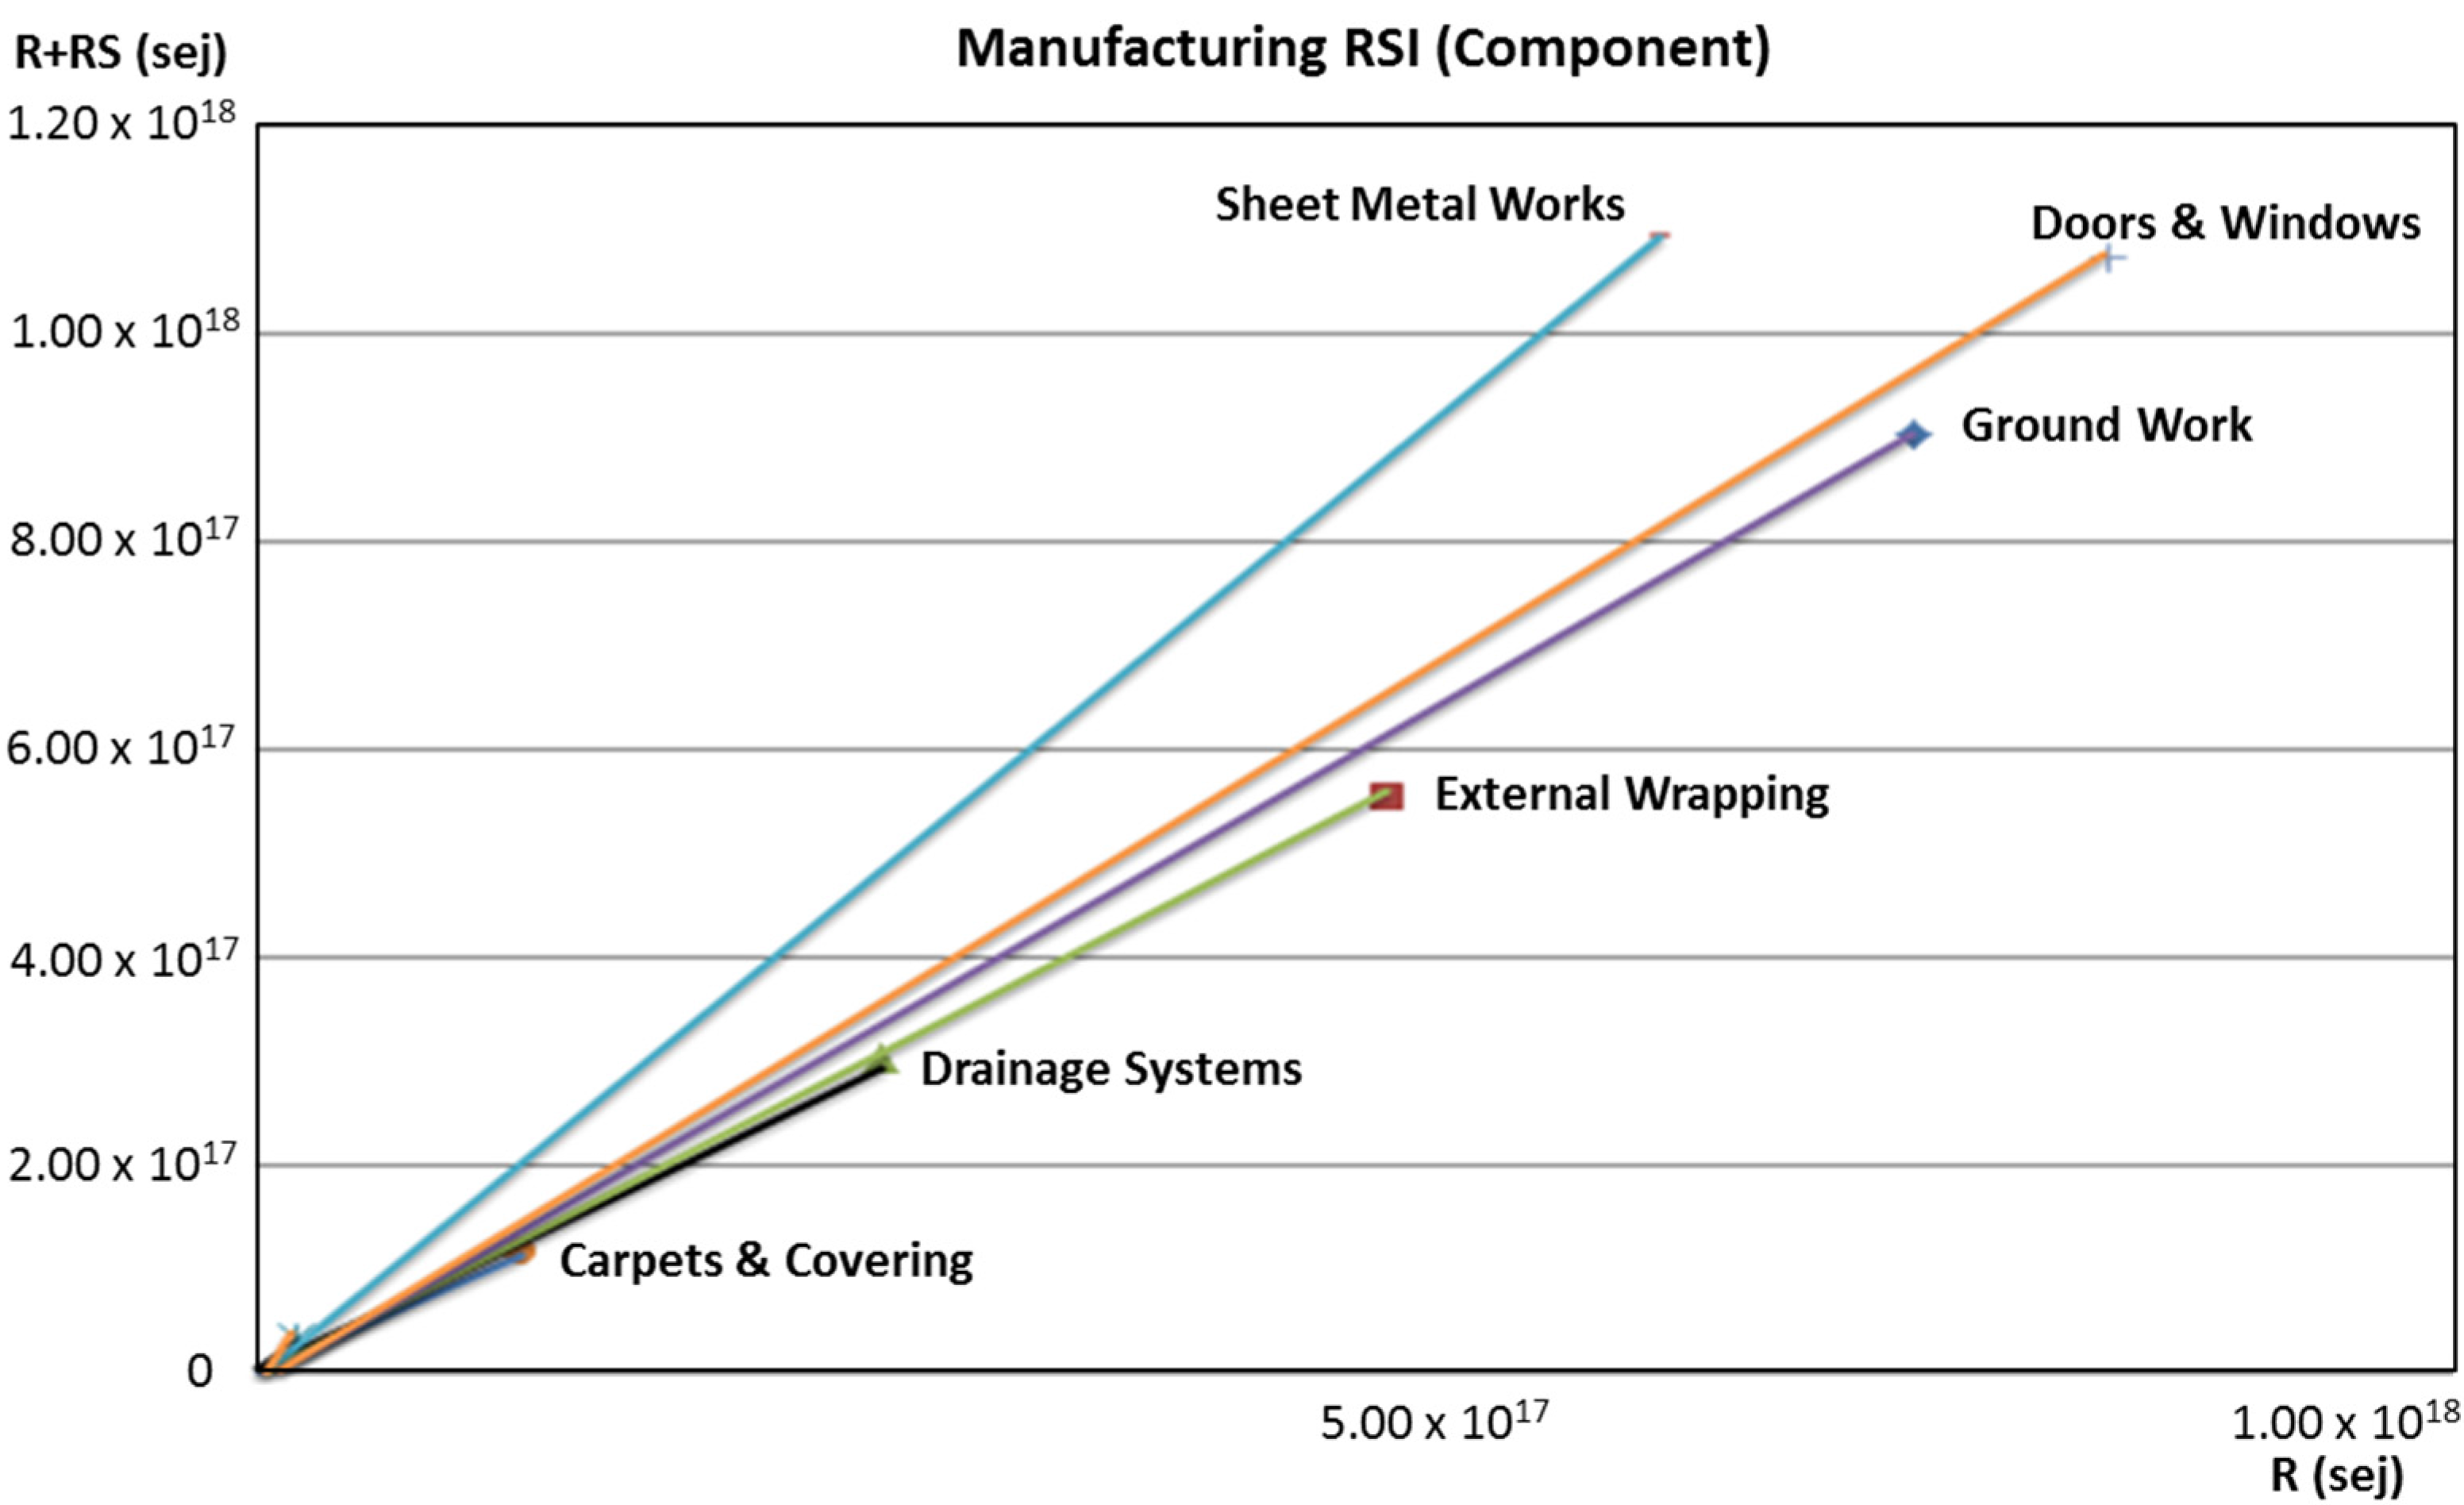
Section 3 for RSI calculation), concrete (RSI, 0.91) falls closer to the bisector when compared to brick (RSI, 0.89). In other words, concrete has a higher renewable emergy potential compared to brick. Similarly, aluminum (RSI, 0.99) has the highest renewable emergy potential compared to concrete and brick. A similar analysis can be performed at a component-level, for example, groundwork, building frame, external wrapping (sidewalls and facades), internal walls, pavements and coverings, doors and windows, sheet-metal works, and drainage systems,
Figure 3. Compared to other building components, “pavements and coverings” possess high RSI indicating that the element-level materials of the components (
i.e., carpet, linoleum, red brick, rubber, enamel and vinyl acrylic latex) hold high renewable emergy potential and the most desirable renewable resource recovery rate.
Figure 2.
Renewable Substitutability Index (RSI): Element-level.
Figure 2.
Renewable Substitutability Index (RSI): Element-level.
Figure 3.
RSI: Component-level.
Figure 3.
RSI: Component-level.
As the RSI of particular element- or component- level data and the associated design decision that affects the building’s overall performance tends to move towards 1.0, it significantly reduces the total non-renewable energy use of a building over its entire useful life through progressive disinvestment of all substitutable non-renewable resources in a building, thereby, achieving a low- non-renewable energy building with a more sustainable status. Using this index, improvement strategies for existing buildings can be evaluated from a holistic perspective in order to maximize renewable resource use. The following section discusses a case study of an existing facility in a university campus setting that is used to demonstrate the application of RSI to strive for the maximum renewable resource investment.
3. RSI of an Existing Building: Case Study
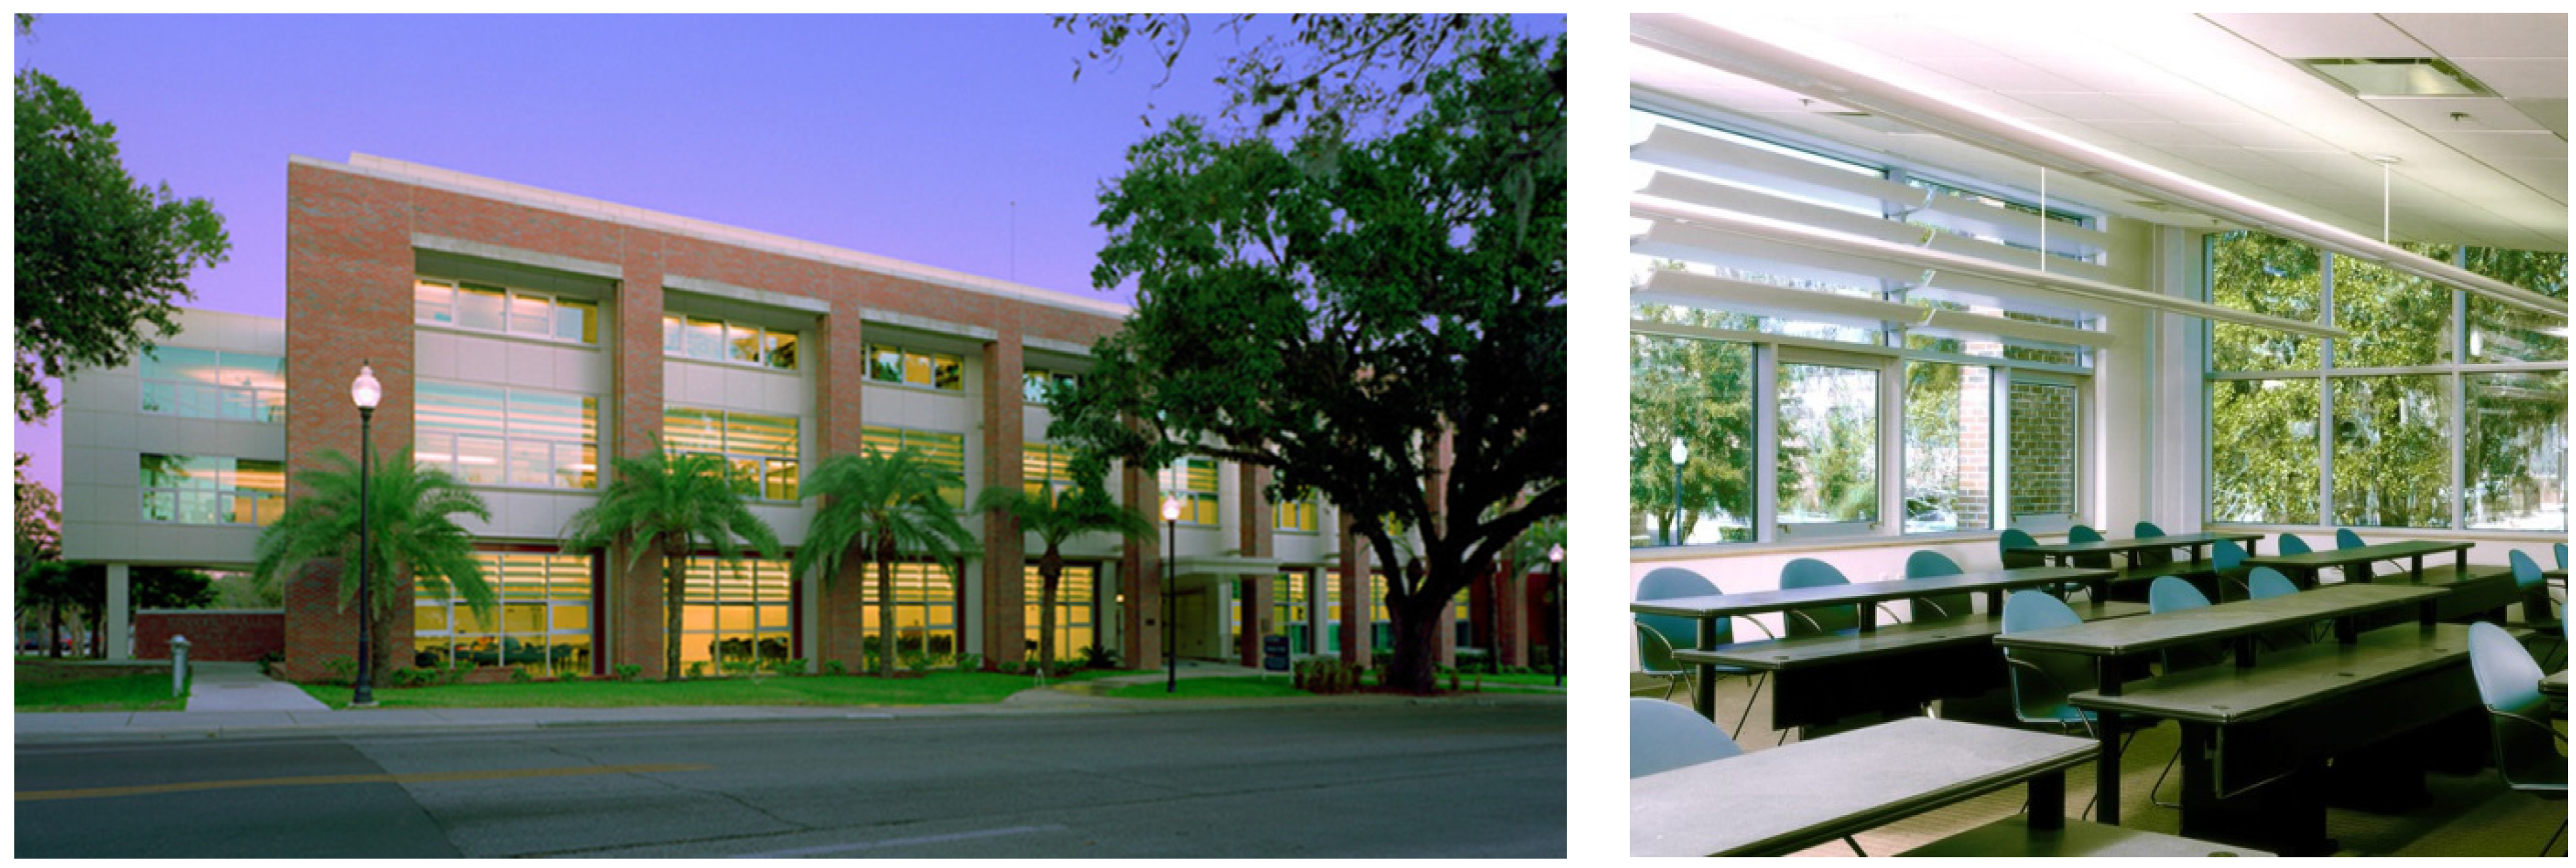
Completed in January 2003, Rinker Hall is a three-story, 47,300-square-foot building that houses the School of Construction Management at the University of Florida,
Figure 4. As the first gold standard LEED™ building in the State of Florida, Rinker Hall sets a high bar for design excellence and it incorporates a range of green building features to provide a productive, healthy environment for students, staff, and faculty [
23]. Located on the site of a former parking lot, Rinker Hall includes a mix of classrooms, construction labs, teaching labs, faculty and administrative offices, and student facilities. The building was designed to maximize natural light with lighting controls such as motion detectors and low-flow plumbing fixtures and waterless urinals were installed to promote efficiency of water use. Building materials were reviewed for proximity in manufacturing, sustainable harvesting, renewable-resource content,
i.e., by using reused bricks from demolition, recycled cellulose insulation material, local and regional assemblies, certified wood, and renewable flooring material. During the operation phase, the building’s energy is supplied by three separate energy sources: electricity, chilled water, and steam.
Figure 4.
(Left) Exterior view of Rinker Hall; (Right) Typical classroom (Photo credits: Croxton Collaborative Architects).
Figure 4.
(Left) Exterior view of Rinker Hall; (Right) Typical classroom (Photo credits: Croxton Collaborative Architects).
The facility’s Renewable Substitutability was first evaluated by studying the building construction, operation, and maintenance phases. Using this data, RSI values, for both elemental- and component-levels, were calculated. These represented each of the retrofit options. These options were plotted to identify optimal solutions for progressive replacement of non-renewable resources with renewables. Technical documents such as construction plans, finish schedules, and commissioning reports were used to generate an inventory of inputs. The inventory included a list of materials used and their mass. For this paper, a few assumptions were used, namely: (i) land use was assumed to be a renewable resource because the site was previously a parking lot and not virgin land; (ii) demolition, site pavement, and human services were excluded; (iii) for materials whose specific emergy values were unavailable, RS was assumed to be 0 (zero), i.e., NR is 1.0; (iv) for materials whose total emergy was unavailable, R was assumed to be 0 (zero) such that the total emergy is (RS + NR); and (v) the RS of operational energy is assumed as 10.6% based on DOE (2010) data, i.e., total electricity generation in the United States included 10.6% renewable generation.
3.1. RSI Assessment Methodology
The RSI assessment methodology is comprised of four steps. While the first three steps estimate the emergy content during the building’s manufacturing, operation, and maintenance phases, the final step calculates the RSI based on the data from the previous steps. The resultant RSI values can be used to evaluate improvement strategies from a holistic perspective in order to maximize renewable resource content of the existing facility.
3.1.1. Step 1: Emergy Analysis of the Building Manufacturing Process
In this first step, the emergy content of the building materials used during the construction process were quantified. Material emergy is the product of the material quantity derived from contract documents (mass) and specific emergy (sej/kg). In order to identify the Renewable Substitutability portions of materials, the specific emergy was split into three portions namely R, RS, and NR. For this study, the materials were aggregated into ten major categories and each category was further separated into various units for clarity,
Table 1. In the case of Rinker Hall building, future replacement and maintenance efforts may be targeted based on the percentage of Renewable Substitutability of the components. For example, the roofs have 71.1% of RS potential.
Table 1.
Emergy analysis of building manufacturing (RS—Renewable Substitutability; NR—Non Renewables; R—Renewables; El—Elemental; Cp—Component).
Table 1.
Emergy analysis of building manufacturing (RS—Renewable Substitutability; NR—Non Renewables; R—Renewables; El—Elemental; Cp—Component).
| Item | Specification | Unit | Specific Emergy (sej/kg) | RSI | % of RS |
|---|
| RS | NR | Total (R + RS + NR) | R | R/(R + RS) |
|---|
| El. | Cp. |
|---|
| Solar irradiation | Irradiation on building yard | J | 0 | 0 | 1.00 | 1.00 | 1.00 | 1.00 | 0.00 |
| Land use (soil erosion) | Soil Organic matter (3% of 1 m depth vol.) | J | 1.24 × 10⁵ | 0 | 1.24 × 10⁵ | 0 | 0 | 0 | 1.91 |
| Groundwork | | | | | | | | 0.84 | 0.50 |
| Foundation | Concrete | kg | 3.47 × 10¹⁰ | 1.41 × 10¹² | 1.81 × 10¹² | 3.65 × 101` | 0.91 | | |
| Footing | Steel | kg | 1.17 × 10¹² | 4.18 × 10¹² | 6.97 × 10¹² | 1.62 × 10¹² | 0.58 | | |
| Lean concrete | Concrete | kg | 3.47 × 10¹⁰ | 1.41 × 10¹² | 1.81 × 10¹² | 3.65 × 101` | 0.91 | | |
| Lean concrete | Steel | kg | 1.17 × 10¹² | 4.18 × 10¹² | 6.97 × 10¹² | 1.62 × 10¹² | 0.58 | | |
| Building frame | | | | | | | | 0.84 | 0.68 |
| Bearing wall | Concrete | kg | 3.47 × 10¹⁰ | 1.41 × 10¹² | 1.81 × 10¹² | 3.65 × 10¹¹ | 0.91 | | |
| Beams and columns | Concrete | kg | 3.47 × 10¹⁰ | 1.41 × 10¹² | 1.81 × 10¹² | 3.65 × 101` | 0.91 | | |
| Exterior structure framing | Steel | kg | 1.17 × 10¹² | 4.18 × 10¹² | 6.97 × 10¹² | 1.62 × 10¹² | 0.58 | | |
| Gypsum dry construction Framing | Steel | kg | 1.17 × 10¹² | 4.18 × 10¹² | 6.97 × 10¹² | 1.62 × 10¹² | 0.58 | | |
| Overhangs | Concrete | kg | 3.47 × 10¹⁰ | 1.41 × 10¹² | 1.81 × 10¹² | 3.65 × 10¹¹ | 0.91 | | |
| Stairs | Concrete | kg | 3.47 × 10¹⁰ | 1.41 × 10¹² | 1.81 × 10¹² | 3.65 × 10¹¹ | 0.91 | | |
| Elevator Box | Concrete | kg | 3.47 × 10¹⁰ | 1.41 × 10¹² | 1.81 × 10¹² | 3.65 × 101` | 0.91 | | |
| Elevator Box | Steel | kg | 1.17 × 10¹² | 4.18 × 10¹² | 6.97 × 10¹² | 1.62 × 10¹² | 0.58 | | |
| External wrapping (side walls + facades) | | | | | | | | 0.92 | 0.14 |
| Side wall (16" thick) | CMU | kg | 0 | 1.00 | 1 | 0 | 0 | | |
| Side walls thermal insulation | fiberglass | kg | 0 | 1.00 | 1.00 | 0 | 0 | | |
| Binder (Side wall) | Mortar | kg | 0 | 1.00 | 3.31 × 10¹² | 3.31 × 10¹² | 1 | | |
| Precast side wall coping | Concrete | kg | 3.47 × 10¹⁰ | 1.41 × 10¹² | 1.81 × 10¹² | 3.65 × 10¹¹ | 0.91 | | |
| Precast screen wall coping | Concrete | kg | 3.47 × 10¹⁰ | 1.41 × 10¹² | 1.81 × 10¹² | 3.65 × 10¹¹ | 0.91 | | |
| Façades (External skin) | CMU | kg | 0 | 1.00 | 1.00 | | 0 | | |
| Façades | Brick | kg | 1.89 × 10¹¹ | 2.03 × 10¹² | 3.68 × 10¹² | 1.46 × 10¹² | 0.89 | | |
| Binder | Mortar | kg | 0 | 1.00 | 3.31 × 10¹² | 3.31 × 10¹² | 1.00 | | |
| Thermal insulation | Extruded polystyrene | kg | 0 | 1.00 | 1.00 | 0 | 0 | | |
| Thermal insulation | Fiberglass | kg | 0 | 1.00 | 1.00 | 0 | 0 | | |
| Filling | Concrete | kg | 3.47 × 10¹⁰ | 1.41 × 10¹² | 1.81 × 10¹² | 3.65 × 10¹¹ | 0.91 | | |
| Floors | | | | | | | | 0.60 | 23.2 |
| Floor (20 cm thick) | Concrete | kg | 3.47 × 10¹⁰ | 1.41 × 10¹² | 1.81 × 10¹² | 3.65 × 10¹¹ | 0.91 | | |
| Floor (3-3/8" & 7 3/8" thick) | Red Brick | kg | 1.89 × 10¹¹ | 2.03 × 10¹² | 3.68 × 10¹² | 1.46 × 10¹² | 0.89 | | |
| Insulation | High-density polyethylene | kg | 0 | 1.00 | 8.85 × 10¹² | 8.85 × 10¹² | 1.00 | | |
| Vapor barrier | Concrete | kg | 3.47 × 10¹⁰ | 1.41 × 10¹² | 1.81 × 10¹² | 3.65 × 10¹¹ | 0.91 | | |
| Tile | Ceramic | kg | 1.03 × 10¹² | 2.03 × 10¹² | 3.68 × 10¹² | 6.20 × 10¹¹ | 0.38 | | |
| Floor deck | Steel | kg | 1.17 × 10¹² | 4.18 × 10¹² | 6.97 × 10¹² | 1.62 × 10¹² | 0.58 | | |
| Roof | | | | | | | | 0.58 | 71.1 |
| Roof | Gypsum | kg | 0 | 1.00 | 1.00 | 0 | 0 | | |
| Roof (Shingle-ply) | Built-up 3 ply & gravel | kg | 1.16 × 10¹² | 4.76 × 10¹¹ | 1.64 × 10¹² | 0 | 0 | | |
| Roof blocking | Wood | kg | 7.98 × 10¹¹ | 8.70 × 10¹⁰ | 2.40 × 10¹² | 1.52 × 10¹² | 0.65 | | |
| Electro welding net | Steel | kg | 1.17 × 10¹² | 4.18 × 10¹² | 6.97 × 10¹² | 1.62 × 10¹² | 0.58 | | |
| Metal roof deck | Steel | kg | 1.17 × 10¹² | 4.18 × 10¹² | 6.97 × 10¹² | 1.62 × 10¹² | 0.58 | | |
| Internal walls | | | | | | | | 0.60 | 0.04 |
| Wall | Gypsum | kg | 0 | 1.00 | 1.00 | 0 | 0 | | |
| Wall | CMU | kg | 0 | 1.00 | 1.00 | 0 | 0 | | |
| Tape and finish | Fiberglass | kg | 0 | 1.00 | 1.00 | 0 | 0 | | |
| Binder | Mortar | kg | 0 | 1.00 | 3.31 × 10¹² | 3.31 × 10¹² | 1.00 | | |
| Tile | Ceramic | kg | 1.03 × 10¹² | 2.03 × 10¹² | 3.68 × 10¹² | 6.20 × 10¹¹ | 0.38 | | |
| Pavements and coverings | | | | | | | | 0.99 | 0.01 |
| Carpeting | Carpet | kg | 0 | 1.00 | 1.00 | 0 | 0 | | |
| Resilient flooring | Linoleum | kg | 0 | 1.00 | 1.00 | 0 | 0 | | |
| Ext. pavement | Red brick | kg | 1.89 × 10¹¹ | 2.03 × 10¹² | 3.68 × 10¹² | 1.46 × 10¹² | 0.89 | | |
| Cove base | Rubber | kg | 0 | 1.00 | 7.22 × 10¹² | 7.22 × 10¹² | 1.00 | | |
| Tread and riser | Rubber | kg | 0 | 1.00 | 7.22 × 10¹² | 7.22 × 10¹² | 1.00 | | |
| Tile | Rubber | kg | 0 | 1.00 | 7.22 × 10¹² | 7.22 × 10¹² | 1.00 | | |
| Walls and ceilings | Enamel | kg | 0 | 1.00 | 1.00 | 0 | 0 | | |
| Walls and ceilings | Vinyl acrylic latex | kg | 5.29 × 10⁹ | 6.32 × 10¹² | 6.33 × 10¹² | 0 | 0 | | |
| Doors and windows | | | | | | | | 0.78 | 0.78 |
| Door | Hollow metal | kg | 0 | 1.00 | 1.00 | 0 | 0 | | |
| Door | Glass | kg | 6.22 × 10¹² | 1.65 × 10¹² | 7.87 × 10¹² | 0 | 0 | | |
| Door | Wood | kg | 7.98 × 10¹¹ | 8.70 × 10¹⁰ | 2.40 × 10¹² | 1.52 × 10¹² | 0.65 | | |
| Door frame | Hollow metal | kg | 0 | 1.00 | 1.00 | 0 | 0 | | |
| Door frame | Wood | kg | 7.98 × 10¹¹ | 8.70 × 10¹⁰ | 2.40 × 10¹² | 1.52 × 10¹² | 0.65 | | |
| Door frame | Aluminum | kg | 4.70 × 10¹⁰ | 1.27 × 10¹³ | 2.13 × 10¹³ | 8.55 × 10¹² | 0.99 | | |
| Window | Glass | kg | 6.22 × 10¹² | 1.6 × 10¹² | 7.87 × 10¹² | 0 | 0 | | |
| Int. window casing frame | Wood | kg | 7.98 × 10¹¹ | 8.70 × 10¹⁰ | 2.40 × 10¹² | 1.52 × 10¹² | 0.65 | | |
| Ext. window casing frame | Aluminum | kg | 4.70 × 10¹⁰ | 1.27 × 10¹³ | 2.13 × 10¹² | 8.55 × 10¹² | 0.99 | | |
| Int. window casings | Wood | kg | 7.98 × 10¹¹ | 8.70 × 10¹⁰ | 2.40 × 10¹² | 1.52 × 10¹² | 0.65 | | |
| Ext. window casings | Aluminum | kg | 4.70 × 10¹⁰ | 1.27 × 10¹³ | 2.13 × 10¹³ | 8.55 × 10¹² | 0.99 | | |
| Sheet-metal works | | | | | | | | 0.58 | 1.54 |
| Tube | Steel | kg | 1.17 × 10¹² | 4.18 × 10¹² | 6.97 × 10¹² | 1.62 × 10¹² | 0.58 | | |
| Structural tees | Steel | kg | 1.17 × 10¹² | 4.18 × 10¹² | 6.97 × 10¹² | 1.62 × 10¹² | 0.58 | | |
| Channel | Steel | kg | 1.17 × 10¹² | 4.18 × 10¹² | 6.97 × 10¹² | 1.62 × 10¹² | 0.58 | | |
| Angles | Steel | kg | 1.17 × 10¹² | 4.18 × 10¹² | 6.97 × 10¹² | 1.62 × 10¹² | 0.58 | | |
| Plates, bent and flat | Steel | kg | 1.17 × 10¹² | 4.18 × 10¹² | 6.97 × 10¹² | 1.62 × 10¹² | 0.58 | | |
| Drainage system | | | | | | | | 0.94 | 0.06 |
| Standard PVC pipe | PVC | kg | 0 | 1.00 | 9.86 × 10¹² | 9.86 × 10¹² | 1.00 | | |
| Junction box | Concrete | kg | 3.47 × 10¹⁰ | 1.41 × 10¹² | 1.81 × 10¹² | 3.65 × 10¹¹ | 0.91 | | |
| Reinforced concrete pipe | Concrete | kg | 3.47 × 10¹⁰ | 1.41 × 10¹² | 1.81 × 10¹² | 3.65 × 10¹¹ | 0.91 | | |
| Ductile iron pipe | Iron | kg | 0 | 1.00 | 6.97 × 10¹² | 6.97 × 10¹² | 1.00 | | |
| Covering | Concrete | kg | 3.47 × 10¹⁰ | 1.41 × 10¹² | 1.81 × 10¹² | 3.65 × 10¹¹ | 0.91 | | |
3.1.2. Step 2: Emergy Analysis of the Building Operation Process
In this step, energy use during building operation was assessed. Energy use data was obtained from the university’s Physical Plant Division. For this building, steam is used primarily for space heating. Owing to an insignificant quantity of steam used, it was not included. Emergy for the operational phase is a product of the actual usage data of energy sources and their respective transformities. For this study, year 2010 energy data was used. Using the above data, total emergy flows including the Renewable Substitutability portions of the operational energy were calculated,
Table 2.
Table 2.
Emergy analysis of building operation.
Table 2.
Emergy analysis of building operation.
| Operational Energy Use | Unit (MBtu) | Emergy (sej) | Renewable Resource (R) | Renewable Substitutability Index (RSI) |
|---|
| Electrical | 1446.5 | 2.21 × 10¹² | 3.35 × 10¹⁰ | 0.11 |
| Chilled Water (Cooling) | 3864 | 5.91 × 10¹² | 8.94 × 10¹⁰ | 0.11 |
| Total | 5310.5 | 8.12 × 10¹² | 1.23 × 10¹¹ | 0.11 |
3.1.3. Step 3: Emergy Analysis of the Building Maintenance Process
In this step, the depreciation of the stored emergy associated with building elements such as windows and doors was evaluated. For this paper, replacement of glass based on the building maintenance schedule was studied. Assuming a 100-year useful life for the building, the conventional float glass is replaced with traditional recycled float glass product every 30 years. As the Renewable Substitutability of the replacement product is larger than the ones that will be replaced, the overall Renewable Substitutability of the building is slated to improve,
Table 3.
Table 3.
Emergy analysis of building maintenance (using windows as an example).
Table 3.
Emergy analysis of building maintenance (using windows as an example).
| Building Element | Lifetime (years) | Specific Emergy (sej/kg) |
|---|
| Non-Renewables (NR) | Total | Renewable (R) |
|---|
| Window | 30 | 1.65 × 10¹² | 7.87 × 10¹² | 0 |
| 1.04 × 10¹² | 7.69 × 10¹² | 0 |
3.1.4. Step 4: RSI Calculation
In this final step, the renewable emergy potential at the component-level and of the overall building is assessed to determine the respective RSI values,
Table 4. It is to be noted that the RSI of a material remained constant relative to its specific emergy irrespective of its mass quantity. Alternatively put, a material retains its renewable emergy potential, which is derived based on its manufacturing process and does not alter when used in varied forms. This offers an opportunity to seek materials that have both higher Renewable Substitutability and are renewable (
i.e., RSI → 1.0), refer
Table 1.
Table 4.
Emergy analysis of energy efficient measures.
Table 4.
Emergy analysis of energy efficient measures.
| Energy Efficient Measures (EEM) | Energy Use | Improvement (Saving) | Emergy | Improvement Emergy (Saving) | Renewable Resource (R) |
|---|
| MBtu | MBtu | % | R (sej) | R (sej) | 10.6% Renew (sej) |
|---|
| EEM1: Change lighting power density—ASHRAE 90.1 space-by-space application | 5214.1 | 96.4 | 0.018 | 1.14 × 10¹² | 2.11 × 10¹⁰ | 1.21 × 10¹¹ |
| EEM2: Replace inefficient refrigerator—with Energy Star performer | 5221.7 | 88.8 | 0.017 | 1.14 × 10¹² | 1.94 × 10¹⁰ | 1.21 × 10¹² |
| EEM3: Modify temperature setpoint to 76F—SHRAE 90.1 as long as 80% of occupants are comfortable | 5219.4 | 91.1 | 0.017 | 1.14 × 10¹² | 1.99 × 10¹⁰ | 1.21 × 10¹¹ |
| EEM4: Install 20KW PV system—total area 2000 ft2 on the roof | 5221.1 | 89.4 | 0.017 | 1.14 × 10¹² | 1.95 × 10¹⁰ | 1.21 × 10¹¹ |
| EEM5: Shorten Hours of Operation to 7 a.m.-9 p.m.—modify California Alternative Calculation Method (ACM) Manual from 6 a.m. to 10 p.m. | 4633.7 | 676.8 | 0.127 | 1.01 × 10¹² | 1.48 × 10¹¹ | 1.07 × 10¹¹ |
| EEM6: Improve Energy Recovery Ventilation (ERV)—install ERV to handle additional outside air and install premium motor | 5130.5 | 180.0 | 0.034 | 1.12 × 10¹² | 3.93 × 10¹⁰ | 1.19 × 10¹¹ |
| EEM7: Reduce cooling capacity—specifically during weekends | 4690.1 | 620.4 | 0.117 | 1.02 × 10¹² | 1.35 × 10¹¹ | 1.09 × 10¹¹ |
| EEM8: Repair lighting controls—classroom lights do not remain on during the night | 5167.0 | 143.5 | 0.027 | 1.13 × 10¹² | 3.13 × 10¹⁰ | 1.20 × 10¹¹ |
| EEM9: Install Variable Frequency Displays (VFD)—on both heating hot water pumps | 5230.8 | 79.7 | 0.015 | 1.14 × 10¹² | 1.74 × 10¹⁰ | 1.21 × 10¹¹ |
| EEM10: Provide higher temperature delta—in chilled water supply and return lines | 5138.1 | 172.4 | 0.032 | 1.12 × 10¹² | 3.76 × 10¹⁰ | 1.19 × 10¹¹ |
| EEM11: Install shut-off timers—in classroom to prevent 24 h idle load | 3630.5 | 233.5 | 0.060 | 7.93 × 10¹¹ | 5.10 × 10¹⁰ | 8.40 × 10¹⁰ |
| EEM12: Repair lighting controls—classroom lights do not remain on during the night | 5208.8 | 101.7 | 0.019 | 1.14 × 10¹² | 2.22 × 10¹⁰ | 1.21 × 10¹¹ |
3.2. Selection of Improvement Scenarios
RSI assessment methodology was used to calculate the RSI values, for both element- and component- levels. Using this data, several scenarios for improvement were evaluated from a holistic perspective in order to maximize renewable resource use. For this paper, the operational and maintenance phases were assessed as discussed below.
3.2.1. Operational Phase
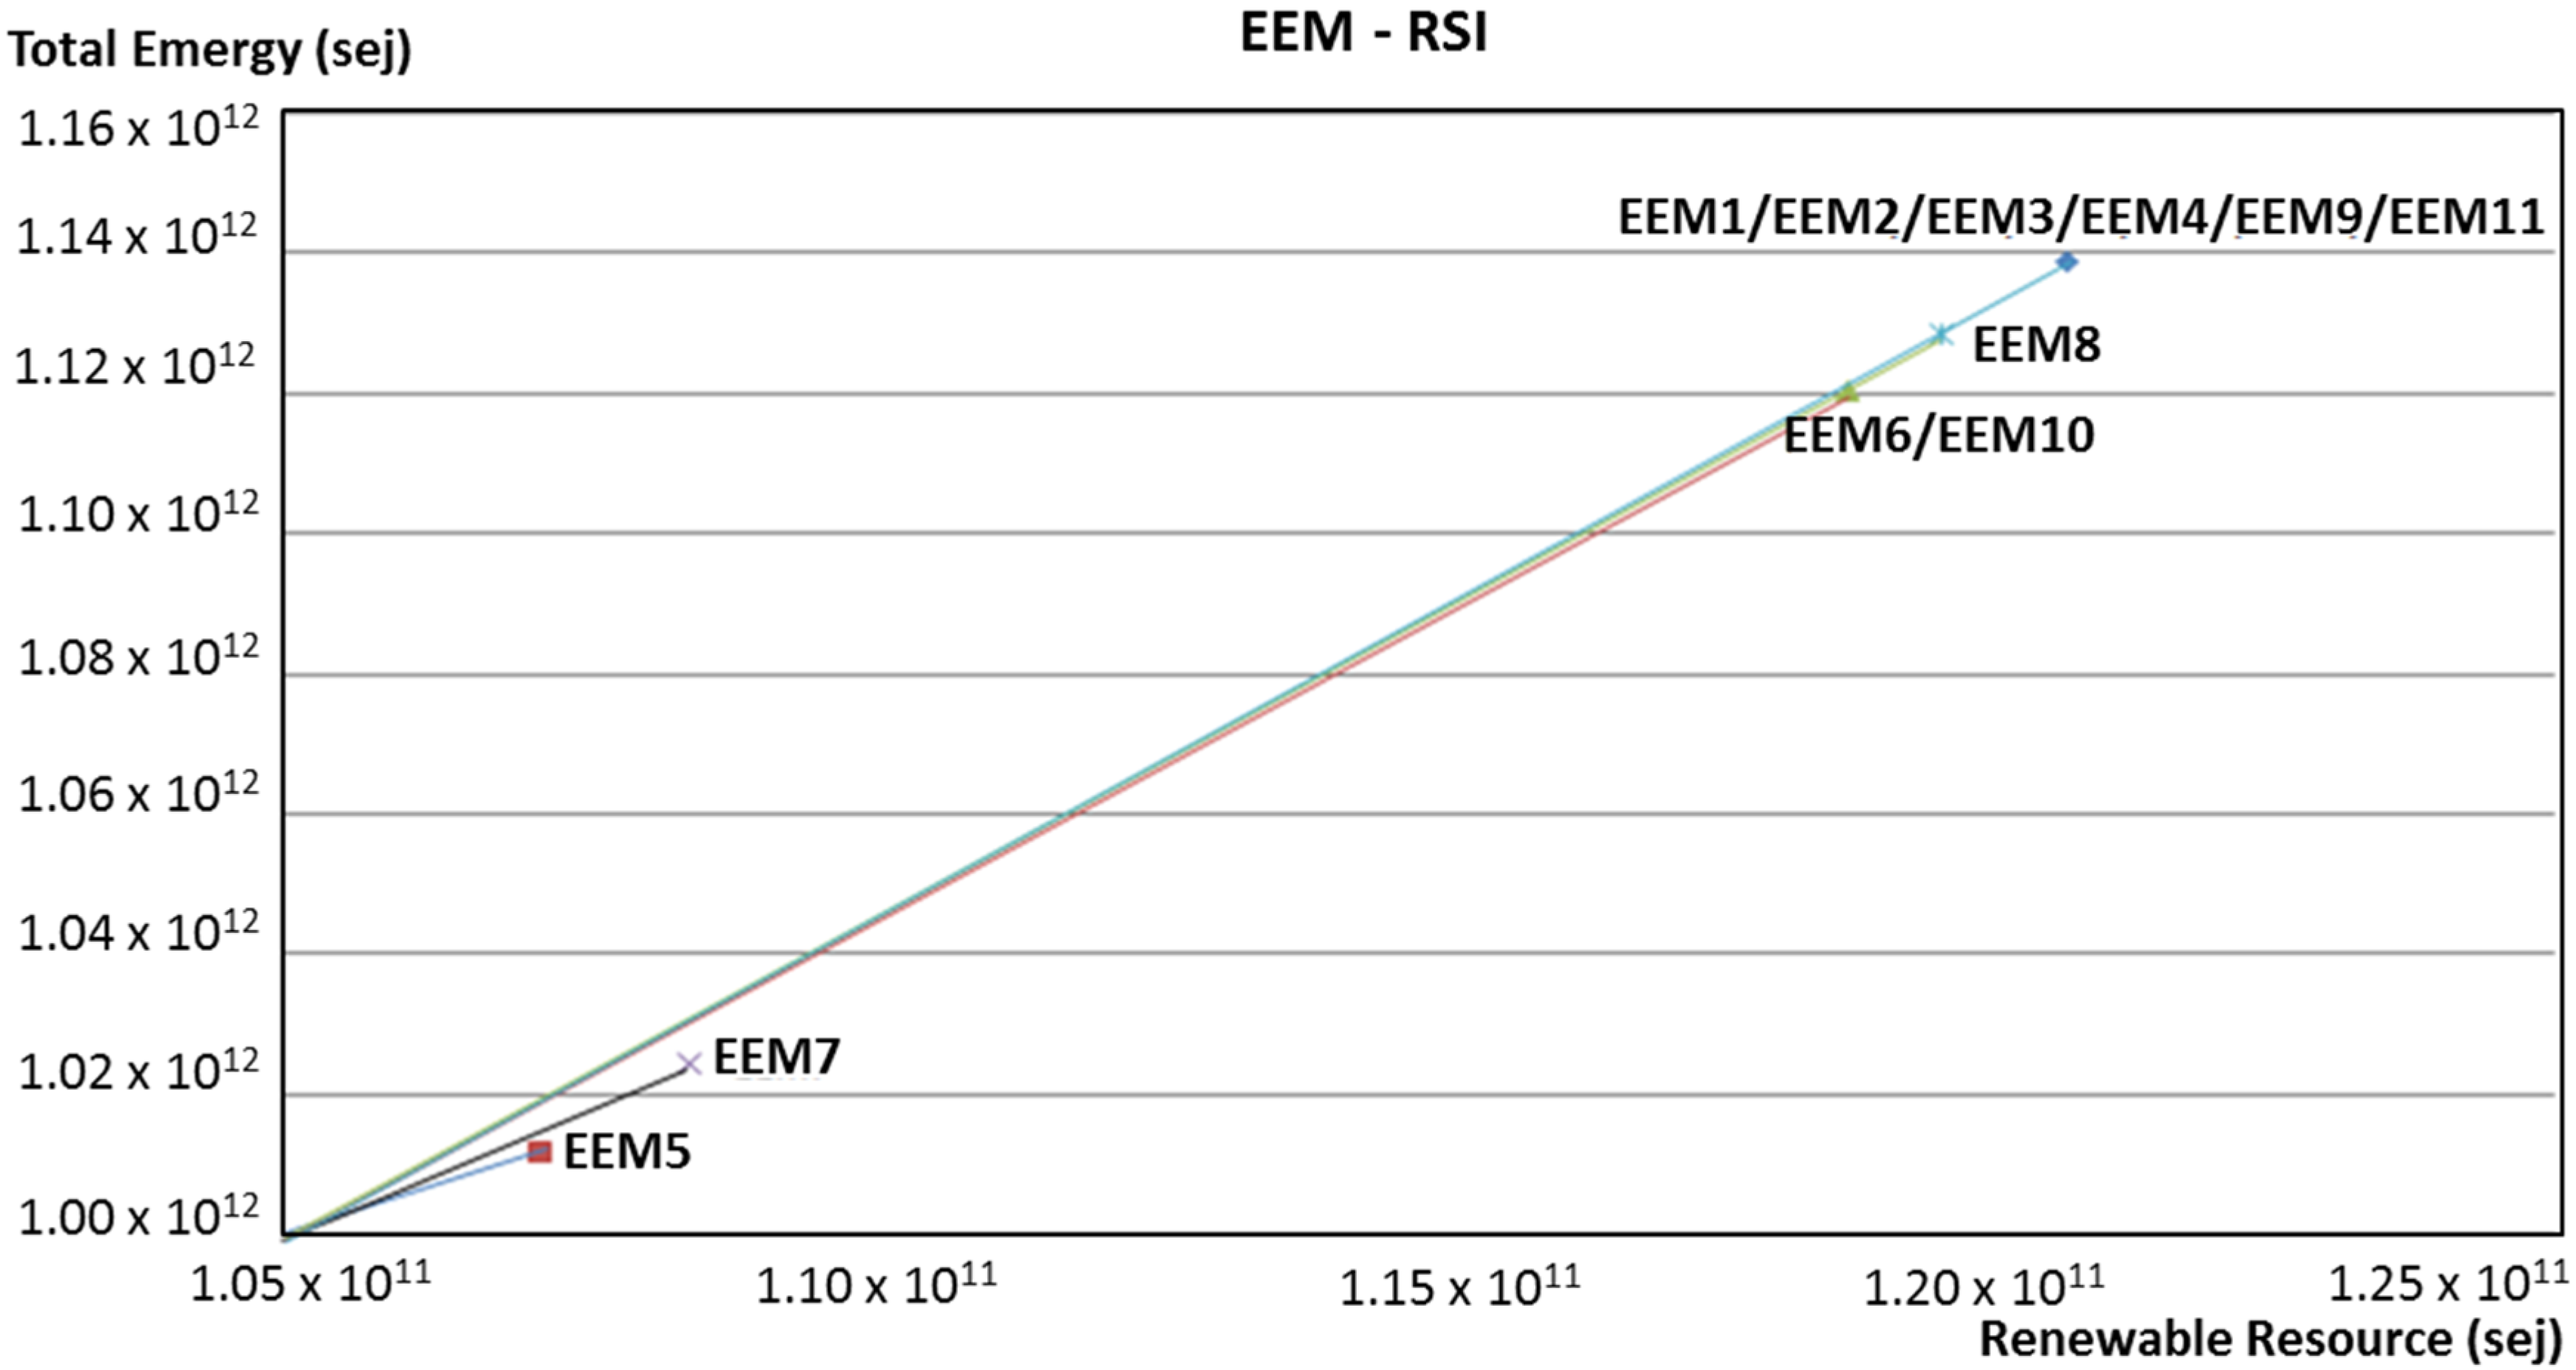
To reduce energy use in building operation, Energy Efficiency Measures (EEMs) are typically considered. Through evaluations of Renewable Substitutability potential of energy sources, an optimum solution that maximizes renewable resource use can be identified. Take, for example, the nine EEMs that were developed based on detailed energy audits and onsite building assessment [
24].
Using the energy breakdown of the electricity and chilled water systems (steam was not included owing to insignificant quantities), each of the EEMs’ equivalent emergy flows including their renewable resource use were assessed,
Table 4. In this study, 10.6% renewable electricity generation was the only renewable operational source for the building. Evaluating the RSI of all EEMs shows that EEM5 approaches 1.0 rapidly when compared with other EEMs,
Figure 5. By calculating the ratio of the operational renewable energy use to total energy use, an RSI of 0.11 was calculated and remained a constant for all EEMs. However, if the renewable mix changes, these EEMs will not co-locate in the bisector, rather they will spread across the plot depicting their emergy qualities.
Figure 5.
RSI of energy efficient measures.
Figure 5.
RSI of energy efficient measures.
3.2.2. Maintenance Phase
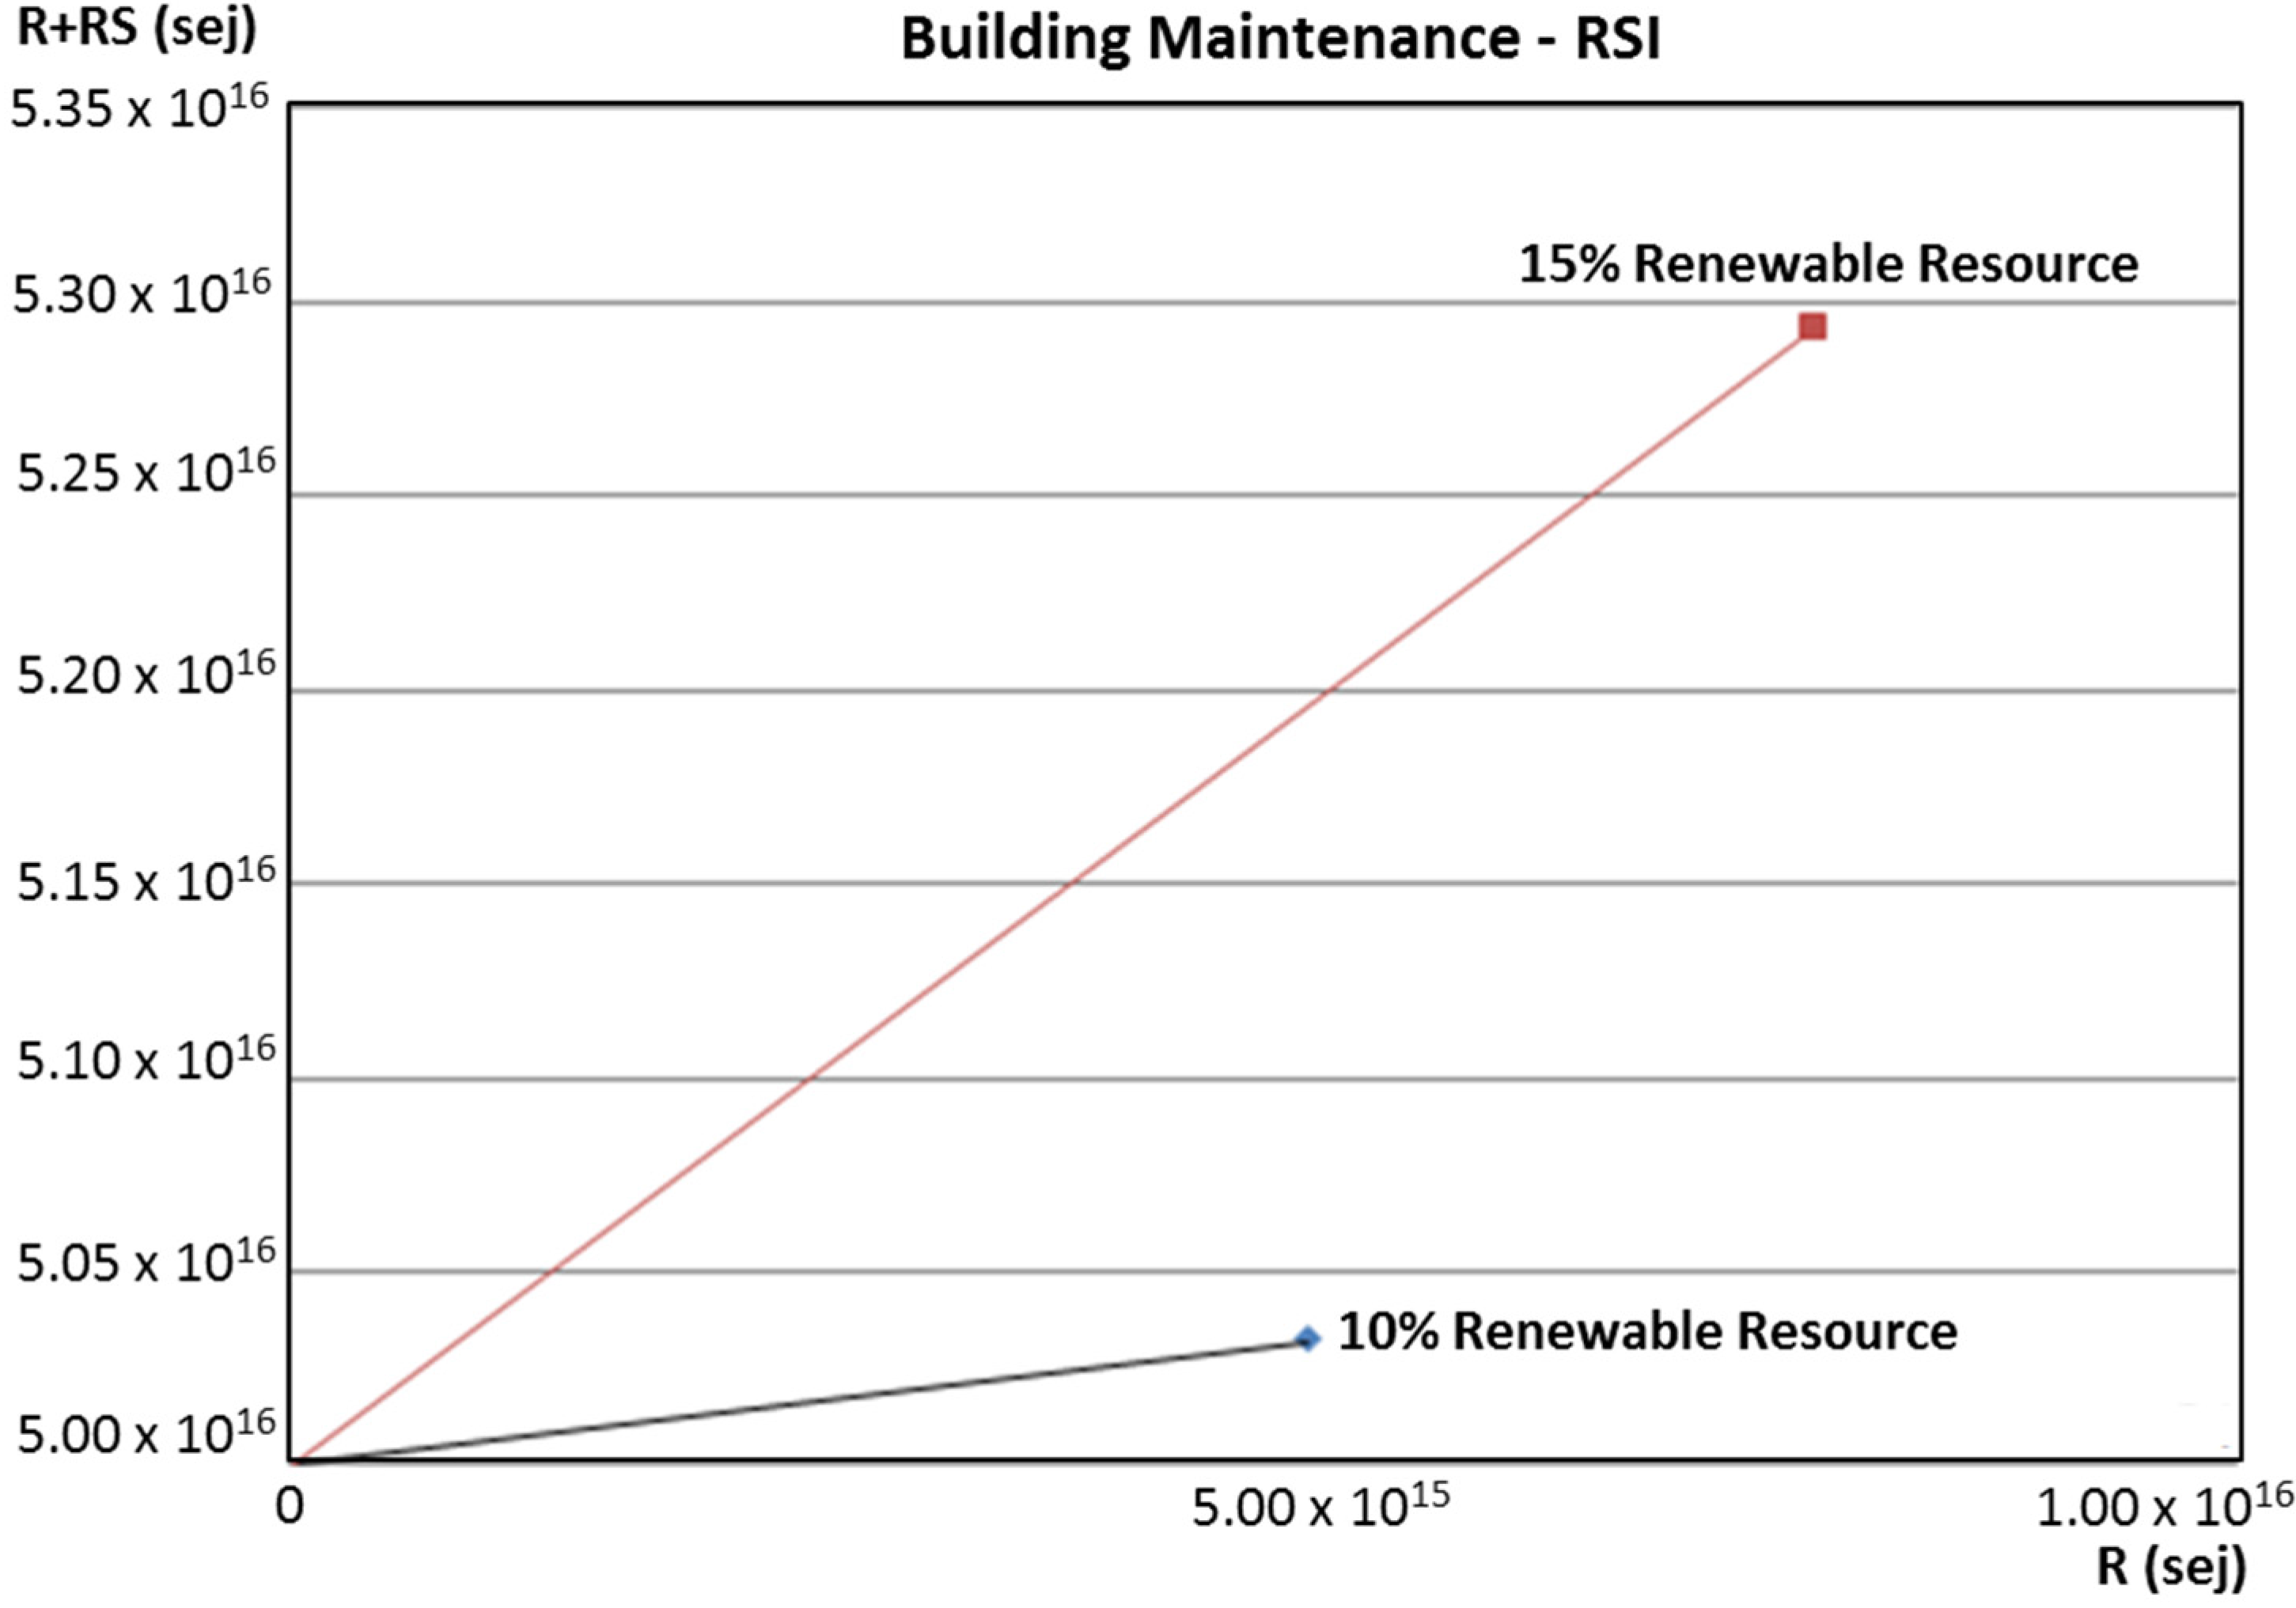
By realizing the Renewable Substitutability of replacement during the maintenance phase, optimal solutions can be identified. Take, for example, the scenario that includes two replacement glazing, one with 10% renewables and another, 15%,
Table 5,
Figure 6. The second alternative possesses a higher RSI and is recommended for use as replacement glass.
Figure 6.
Emergy analysis of 10% and 15% renewable resource of replacement glass.
Figure 6.
Emergy analysis of 10% and 15% renewable resource of replacement glass.
Table 5.
Emergy analysis of renewable substitutability of replacement glass (using 10% and 15% of the total emergy required for manufacture as renewable resource).
Table 5.
Emergy analysis of renewable substitutability of replacement glass (using 10% and 15% of the total emergy required for manufacture as renewable resource).
| Item | Emergy (sej) | % |
|---|
| RS | NR | Total | RS | NR |
|---|
| Current Glazing Systems | 4.22 × 10¹⁶ | 1.12 × 10¹⁶ | 5.33 × 10¹⁶ | 79% | 21% |
| Replacement Glazing | 4.51 × 10¹⁶ | 7.05 × 10¹⁵ | 5.22 × 10¹⁶ | 86% | 14% |
| w/Renewable resources (10%) | 4.96 × 10¹⁶ | 2.53 × 10¹⁵ | 5.22 × 10¹⁶ | 95% | 5% |
| w/Renewable resources (15%) | 5.19 × 10¹⁶ | 2.79 × 10¹⁵ | 5.22 × 10¹⁶ | 99% | 1% |


