1. Introduction
Sheep are well adapted to diverse environments and are raised principally for their meat, milk, and fiber. These products could meet global needs for meat and essential nutrients for an increasing population around the world, especially in developing countries or regions. Growth and development traits, including body weight, body length, and body height, have economic importance in sheep production because these traits reflect production efficiency. Therefore, improving sheep growth and development traits is important for increasing the economic returns for farmers and the meat supply for customers. Genomic selection is one of the most effective ways to improve economic traits [
1]. However, the economic returns of sheep genomic selection are still limited. The costs of genotyping and computation are still unaffordable for large-scale sheep populations in developing countries [
2]. Marker-assisted selection is an alternative way to increase the rate of genetic improvement, which could reduce the time required to improve sheep growth at an acceptable cost. Thus, finding key candidate genes and then designing genetic markers for the genetic improvement of growth and development traits is essential for the sheep industry.
By utilizing the advancements in high-throughput sequencing and genotyping, researchers have effectively employed genome-wide association analysis (GWAS) using single-nucleotide polymorphisms (SNPs) across the whole genome to discover SNPs and important genes associated with growth and development traits in sheep populations from various backgrounds [
3,
4,
5,
6,
7,
8,
9,
10,
11,
12,
13,
14,
15,
16,
17,
18,
19,
20,
21,
22,
23,
24]. These studies provide an important theoretical basis for further investigating functional genes and designing genetic markers for the genetic improvement of growth and development traits. Among these GWAS studies, several studies with relatively large population sizes have identified a striking candidate gene called non-SMC condensin I complex subunit G (
NCAPG) on ovine chromosome 6 associated with sheep growth and development traits [
4,
7,
8]. Beef cattle GWAS results suggest that
NCAPG is linked with an average daily gain [
25]. A meta-analysis of GWAS for cattle stature identified that
NCAPG may regulate body size in mammals [
26]. In beef research, the expression of
NCAPG in the fetal longissimus muscle was significantly greater than that in adults [
27], and the abundance of
NCAPG was significantly correlated with the average daily gain trait [
25]. Recently, a study in cattle revealed that
NCAPG could regulate myogenesis in the fetal stage [
28]. Nevertheless, explicit evidence of
NCAPG regulating sheep growth and development is still scarce, especially in muscle development.
The development of skeletal muscles is a crucial indicator of a sheep’s growth and development characteristics since it has been estimated using computerized tomography (CT) scans that muscles make up more than 60% of a sheep’s body weight [
19]. Muscle development can usually be classified into two stages, namely the prenatal and postnatal stages. Muscle development during the prenatal period is crucial as it determines the number of muscle fibers, which scarcely increases after birth [
29,
30,
31]. Myoblast proliferation, differentiation, and fusion determine prenatal myogenesis [
32,
33]. To date, the role of
NCAPG in the myogenesis of sheep myoblasts is still largely unknown.
When a gene’s function is determined, the genetic markers linked with economic traits in the gene’s regulatory regions, e.g., its promoter region, can be explored. For example, in Romney sheep, SNPs in the promoter region of the myostatin (
MSTN) were significantly related to growth and carcass traits [
34]. Similarly, in Hu sheep, SNPs in the promoter region of the melanocortin-4 receptor (
MC4R) were linked with body conformation traits [
35]. Despite the importance of the SNPs in the promoter region of a functional gene, no studies investigating the association between SNPs in
NCAPG’s promoter region and growth and development traits in sheep have been implemented.
The goal of this study was to investigate the direct role of NCAPG in regulating myogenic development and differentiation of myoblasts and explore potential SNPs in its promoter region in relation to sheep growth and development traits. To achieve this goal, cell proliferation and differentiation after RNA interference with NCAPG were investigated in myoblasts derived from fetal ovine muscle tissue. In addition, SNPs in the promoter region of NCAPG (from transcription start site to upstream 2000 bp of transcription start site) were detected by Sanger sequencing and genotyped by the improved multiplex ligation detection reaction (iMLDR®) method. The association analysis between SNPs and sheep growth and development traits was implemented. This study could provide direct evidence on NCAPG in regulating myogenesis and provide useful genetic markers in NCAPG’s promoter region to increase the selection efficacy for sheep growth and development traits.
2. Materials and Methods
2.1. Ethical Statement
Animal experiments in the current study underwent censorship and received approval from Yangzhou University’s Experimental Animal Ethical Committee (approval number 202103279, approval date 8 March 2021).
2.2. Sample and Phenotypic Data Collection
One experimental pregnant ewe of Hu sheep used for the primary embryonic myoblasts’ isolation was provided by Suzhou Taihu Dongshan Sheep Industry Development Co., Ltd. (Suzhou 215000, Jiangsu Province, China). The pregnant ewe was slaughtered, and the fetal longissimus dorsi muscle was obtained from its descendants. Then, the fetal longissimus dorsi muscle was conserved in an insulated bucket and brought back to the laboratory for the subsequent isolation of cells.
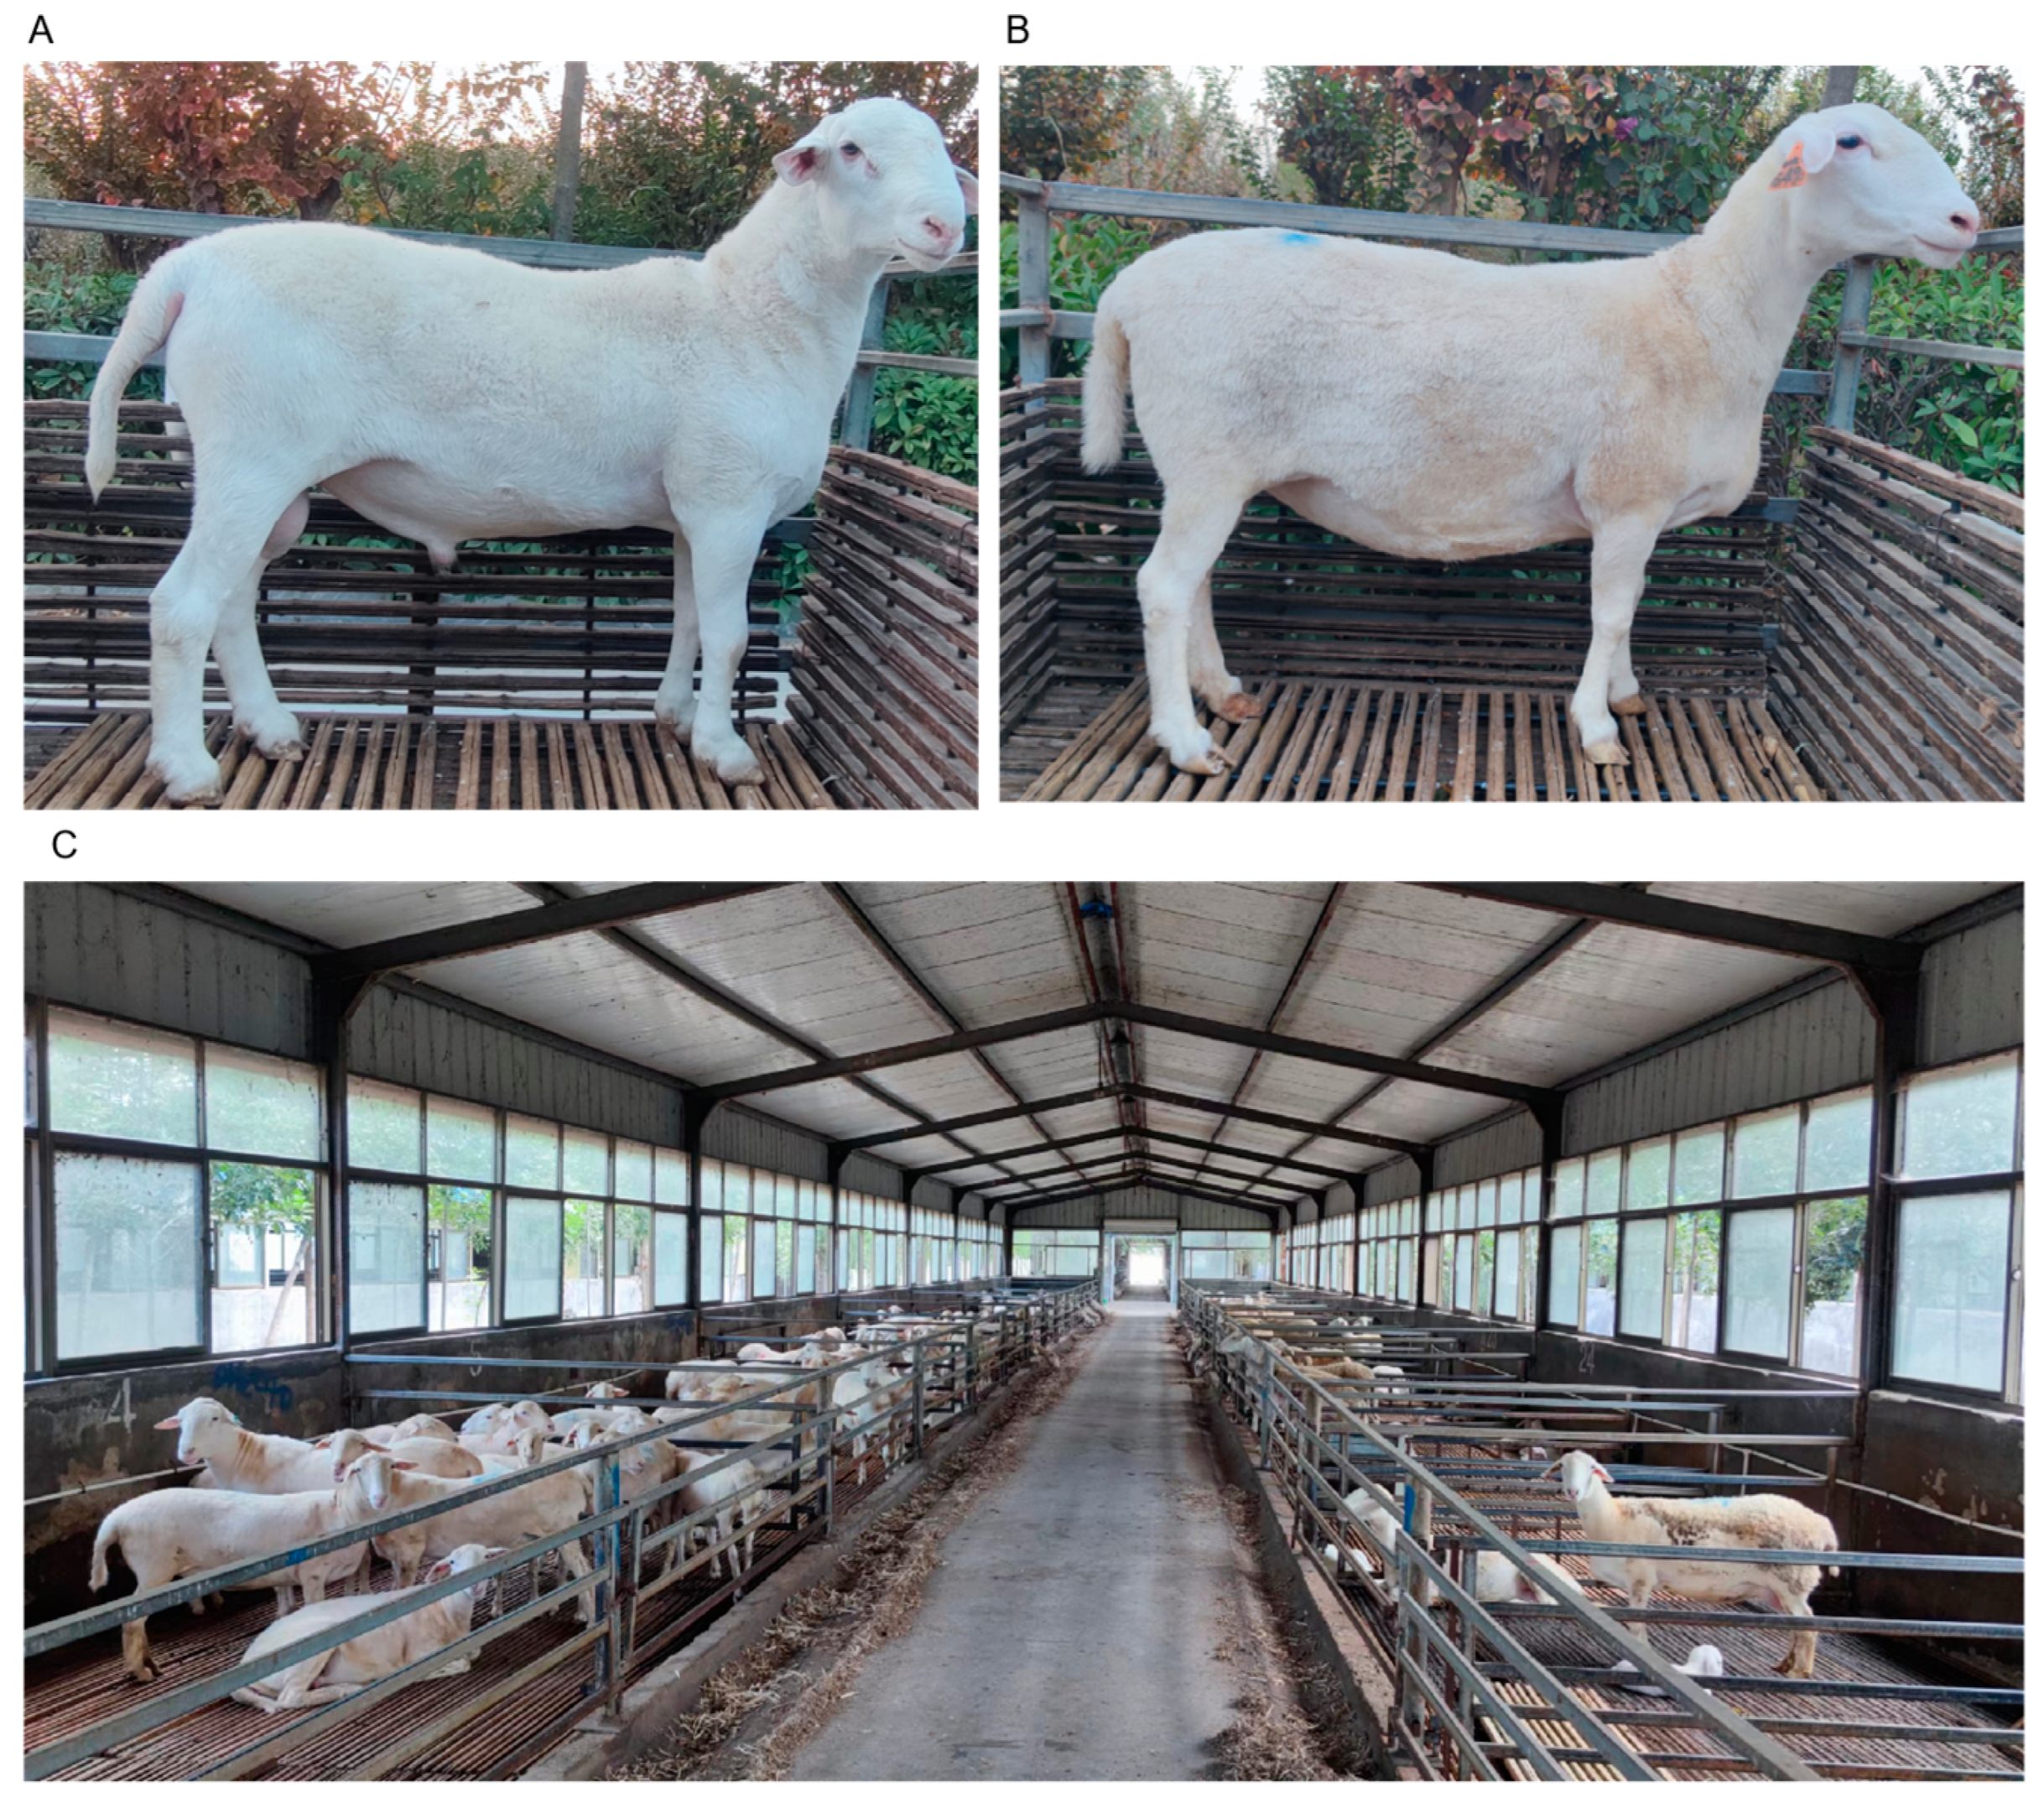
Suhu meat sheep (
Figure 1) is a breeding population that was constructed by our group. It derives from the selective breeding of white Dorper and Hu sheep. All Suhu meat sheep were raised under the same management conditions in Xuzhou Suyang Sheep Industry Co., Ltd. (Xuzhou 215000, Jiangsu Province, China). Six types of tissue samples, namely
longissimus dorsi muscle, heart, liver, spleen, lung, and kidney, were collected from Suhu sheep. In total, three fetuses (around day 85) from two pregnant ewes, three five-day-old male newborn lambs, and three one-year-old male sheep were used for tissue sample collection. All tissue samples were collected within 30 min with three triplicates after the sheep were slaughtered. Samples were placed in liquid nitrogen and stored in a refrigerator set at −80 °C for long-term preservation.
In the current study, the 2nd generation of Suhu meat sheep (
Figure 1) was used for phenotypic data collection. Four traits, namely body weight, body height, body length, and shin circumference, representing sheep growth and development were measured at born, one month, two months, three months, and six months following a published protocol [
36]. A total of 539 blood samples with phenotypic data were collected, including 190 male and 349 female lambs. Genomic DNA was extracted from blood using a conventional phenol-chloroform method. Double-distilled water was used to dissolve the DNA samples, which were then stored in a refrigerator at a temperature of −20 °C.
2.3. Isolation of Sheep Embryonic Myoblasts
Primary embryonic myoblasts were successfully isolated in our previous study [
37]. Briefly, embryonic myoblasts were obtained following three steps: (1) primary embryonic myoblast isolation, (2) primary embryonic myoblast purification, and (3) embryonic myoblast identification. Firstly, primary embryonic myoblasts were isolated from the fetal
longissimus dorsi tissue by using the collagenase and trypsin combined digestion differential adhesion methods [
38]. Secondly, embryonic myoblasts were purified by using the cell suspension method [
37]. Thirdly, primary embryonic myoblasts were identified by using quantitative analysis of myogenic regulatory factors (MRFs) after inducing differentiation. Finally, 0.25% trypsin was used to digest myoblasts, and then they were frozen in liquid nitrogen for further experiments. The cells were cultured in a growth medium (GM) with a temperature of 37 °C and 5% CO
2.
2.4. Plasmid Construction and Small Interfering RNA Synthesis
The coding sequence (CDS) of
NCAPG was amplified from embryonic myoblasts’ complementary DNA (cDNA). Primers of CDS used for plasmid construction designed using the CE Design online tools (
http://www.vazyme.com, accessed on 2 October 2023) and Primer Premier 5 [
39] are documented in
Table 1. The pcDNA3.1(+) plasmid was digested using
Hind III and
BamH I restriction enzymes, resulting in linearization. Next, the PCR product was inserted into the linearized vector according to the guidelines provided by the ClonExpress
® II One Step Cloning Kit (Vazyme Biotech Co., Ltd., Nanjing 210000, Jiangsu Province, China). Finally, the constructed recombinant plasmid was named pcDNA3.1(+)-
NCAPG. To confirm pcDNA3.1(+)-NCAPG, Sanger sequencing was performed by a commercial sequencing provider (Tsingke Biotechnology Co., Ltd., Nanjing 210000, Jiangsu Province, China).
Small interfering RNAs (siRNAs) specifically targeting ovine
NCAPG were designed and synthesized by a commercial service provider (GenePharma Pharmaceutical Technology Co., Ltd., Suzhou 215000, Jiangsu Province, China). Meanwhile, a negative control (NC) was also synthesized. All the synthesized siRNA sequences were documented in
Table 2.
2.5. Cell Transfection and Induction of Differentiation
The procedures of cell transfection and induction of differentiation followed our previous work [
37]. In short, once the cells reached a confluence level of 50–60%, the transfection was carried out by using the jetPRIME transfection reagent (Polyplus transfection, Strasbourg, Illkirch, France). Following transfection for 24–48 h, embryonic myoblasts were induced to differentiate in vitro when GM was changed into a differential medium (DM, consisting of 98% high-glucose Dulbecco’s Modified Eagle Medium (DMEM) and 2% horse serum). Afterward, the cells were gathered for additional RNA extraction.
2.6. Total RNA Extraction, Reverse Transcription, and RT-PCR
TRIzol reagent (TIANGEN, Beijing, China) was used to extract total RNA from tissues and cells. A NanoReady spectrophotometer (Life Real, Hangzhou, China) was used to measure RNA concentration. In addition, 1% agarose gels were used to detect RNA integrity and contamination. All total RNA samples were stored in a −80 °C refrigerator until use.
FastKing gDNA Dispelling RT Super Mix (TIANGEN, Beijing, China) was utilized for reverse transcription according to the guidelines provided by the manufacturer. RT-PCR was conducted on the CFX96 Connect™ Real-Time System (BIO-RAD, Hercules, CA, USA) using 2 × TSINGKE Master qPCR Mix (SYBR Green I) (Tsingke, Beijing, China) following the manufacturer’s guidelines. To normalize the gene expression, the abundance of the housekeeping gene
GAPDH was utilized. The commonly used 2
−∆∆Ct method was used to calculate gene abundance [
40]. The primers were designed by Primer Premier 5 [
39] and are displayed in
Table 3.
2.7. Cell Proliferation Detection
In the current study, cell proliferation after interference with NCAPG was detected by Cell Counting Kit-8 (CCK-8) assay, 5-Ethynyl-20 -deoxyuridine (EdU) proliferation assay, and flow cytometry for cell cycle analysis.
2.7.1. CCK-8 Assay
The CCK-8 assay was performed using a CCK-8 kit (Vazyme, Nanjing, China) according to the instructions provided by the manufacturer. In short, embryonic myoblasts were seeded into the 96-well plates and were cultured in GM. Subsequently, cells were transfected using the methods documented in
Section 2.5 for a duration of 24 h. Afterward, 10 µL of cck-8 solution was gently added into each well. Cells were incubated at 37 °C in darkness for 2–3 h. Finally, the optical density (OD) value at 450 nm representing the relative cellular activity at 0 h, 24 h, 48 h, and 72 h was detected by using a microplate reader (Tecan, Männedorf, Switzerland).
2.7.2. EdU Proliferation Assay
The EdU cell proliferation kit (RIBOBIO, Guangzhou, China) was utilized to carry out the EdU proliferation assay. Initially, embryonic myoblasts were transfected for 24–48 h. Then, the EdU staining assay was carried out following the manufacturer’s guidelines, and an inverted fluorescence microscope (Nikon, Minato, Tokyo, Japan) was used to take fluorescent photos. Finally, cell numbers in each image were counted using Image J (National Institutes of Health, Bethesda, MD, USA). The calculation involved using a formula to determine the percentage of EdU-positive cells, which was obtained by dividing the number of EdU-stained cells by the number of Hoechst-stained cells and multiplying the result by 100%.
2.7.3. Flow Cytometry for Cell Cycle Analysis
Flow cytometry was performed using a Cell Cycle kit (Beyotime, Shanghai, China). In short, trypsin was employed for cell digestion. After embryonic myoblasts were transfected for 24–48 h, the cells were gathered in a centrifuge tube with a capacity of 1.5 mL. Subsequently, 70% ethanol, which had been pre-cooled at 4 °C, was added into the centrifuge tube to preserve the cells for a duration of 12 h. Afterward, propidium (PI) staining was employed to color the cell samples in a dark environment at a temperature of 37 °C for 30 min. In the end, the DNA content of the cells was detected using Modfit (Version 3.1) (Topsham, ME, USA) on a BD LSRFortessa flow cytometer (BD, Franklin Lakes, NJ, USA).
2.8. Cell Differentiation Detection
Cell differentiation was detected in the present study using cell immunofluorescence and quantification of myogenic regulatory factors (MRFs).
2.8.1. Cell Immunofluorescence Staining
The detailed immunofluorescence staining procedure can be found in a previous study [
37]. The main experimental steps were as follows:
- (1)
Discard the cell culture medium; rinse 1–2 times with 1 × PBS on a destaining shaker; add 500 μL cell fixative to each well and incubate at room temperature for 15–30 min;
- (2)
Discard the fixative and rinse with 1 × PBS destaining shaker 3–4 times, 5 min/time; add 500 μL of 0.5% Triton X-100 to each well, and incubate with destaining shaker for 20–30 min to enhance cell membrane permeability;
- (3)
Discard the permeabilization solution and rinse with 1 × PBS decolorizing shaker 3–4 times, 5 min/time; add 500 μL of freshly prepared 10% goat serum working solution to each well, and incubate at 37 °C in the dark for 60 min;
- (4)
Discard the blocking solution, add 300 μL of freshly prepared primary antibody working solution (MyHC, 1:200) to each well, and incubate overnight at 4 °C in the dark;
- (5)
Discard the primary antibody working solution, and rinse with 1 × PBS decolorizing shaker 3–4 times, 5 min/time; add 300 μL of freshly prepared secondary antibody working solution (Goat Anti-Rabbit IgG (H + L)) to each well, 1:1000), incubate at 37 °C in the dark for 60 min;
- (6)
Discard the secondary antibody working solution and rinse with 1 × PBS destaining shaker 3–4 times, 5 min/time;
- (7)
Add 300 μL of DAPI working solution to each well, and incubate at room temperature in the dark for 3–5 min; rinse with 1 × PBS decolorizing shaker 3–4 times, 5 min each time, and immediately place it under an inverted fluorescence microscope to take pictures and observe.
2.8.2. MRF Quantification
Given that myogenesis is primarily controlled by MRFs, which include Myogenic Differentiation 1 (
MYOD), Myogenic Factor 5 (
MYF5), Myogenin (
MYOG), and Myogenic factor 6 (
MYF6, also referred to as
MRF4), in the present investigation, all of these MRFs were measured using RT-qPCR according to the procedure outlined in
Section 2.6. The primers used to quantify MRFs were adopted from a previous study [
37].
2.9. Sequencing and Genotyping of Putative NCAPG Promoter Region
Five pairs of primers used to amplify putative
NCAPG promoter region were designed using Primer Premier 5 [
39] (
Table 4). This region spans from the transcription start site to 2000 bp upstream of the transcription start site. Fifty individuals were mixed as a DNA pool with each genomic DNA 50 ng/μL. A total of 11 DNA pools were constructed. Then, PCR was conducted using DNA pools as templates. The detailed PCR protocol can be found in a previous study [
37]. The PCR products were sequenced by Sanger sequencing on an ABI3730 (Tsingke Biotechnology Co., Ltd., Beijing, China). Sanger sequencing results were analyzed to find putative SNPs using Chromas software (Technelysium Pty Ltd., Helensville, Australia). Potential SNPs of each individual were genotyped using iMLDR (Genesky Biotechnologies Inc., Shanghai, China), which is an improved ligase-based multiplex SNP genotyping system. The detailed procedures can be found in a previous study [
41]. The ability of SNPs to change the binding affinity of transcription factors to their binding sites was predicted using a web interface (
https://azifi.tz.agrar.uni-goettingen.de/agreg-snpdb, accessed on 2 October 2023).
2.10. Statistical Analysis
The significance of RT-qPCR results was tested using a t-test (between two groups) or one-way analysis of variance (ANOVA, more than two groups) in SPSS 25.0 (SPSS, Inc., Chicago, IL, USA).
Population genetic parameters, including allele frequencies, minor allele frequency (MAF), expected heterozygosity (He), observed heterozygosity (Ho), polymorphic information content (PIC), and Hardy–Weinberg equilibrium statistic of all SNPs, were calculated using the snpReady R package [
42]. The formulas to calculate these parameters are documented in the manual of snpReady [
42].
Association analysis between SNPs and phenotypes was implemented by using SPSS 25.0 (SPSS, Inc., Chicago, IL, USA) to fit a linear model. The model was as follows:
where Phe is the individual phenotype value, µ is the population mean value, Gnt is the genotype effect, Gnd is the gender effect, and err is the random error. Differences in mean phenotypes among the three genotypes were present in the least square mean value and were tested by using the LSD test.
p < 0.05 denotes significance.
p < 0.01 denotes high significance.
4. Discussion
Several GWAS studies of sheep with a relatively large population size have found that
NCAPG can be used as a candidate gene for sheep growth and development traits such as body weight and body size [
4,
7,
8]. An expression quantitative trait loci (eQTL) study in sheep detected a very low expression level of
NCAPG in the liver and muscle in a 7- to 8-month-old sheep population [
43]. This suggests the expression level of
NCAPG was tissue- or (and) time-specific. Thus, the
NCAPT expression levels in six tissues and three development stages were analyzed, and it was found that
NCAPG is highly expressed in embryotic sheep muscle (
Figure 2A). This is consistent with the results in beef research where the expression level of
NCAPG in the
longissimus dorsi muscle tissue of 135-day-old fetal muscle was significantly higher than the relative expression level of
NCAPG in adult muscle [
25]. Further, the time-series detection analysis of abundance at the cellular level revealed that
NCAPG showed a gradually downregulated expression pattern at different time points after the induction of myoblast differentiation (
Figure 2B). The protein level of
NCAPG found in cattle research [
28] showed a similar expression pattern to our result. All these pieces of evidence suggest that
NCAPG plays different roles in the different stages of the muscle cell development process.
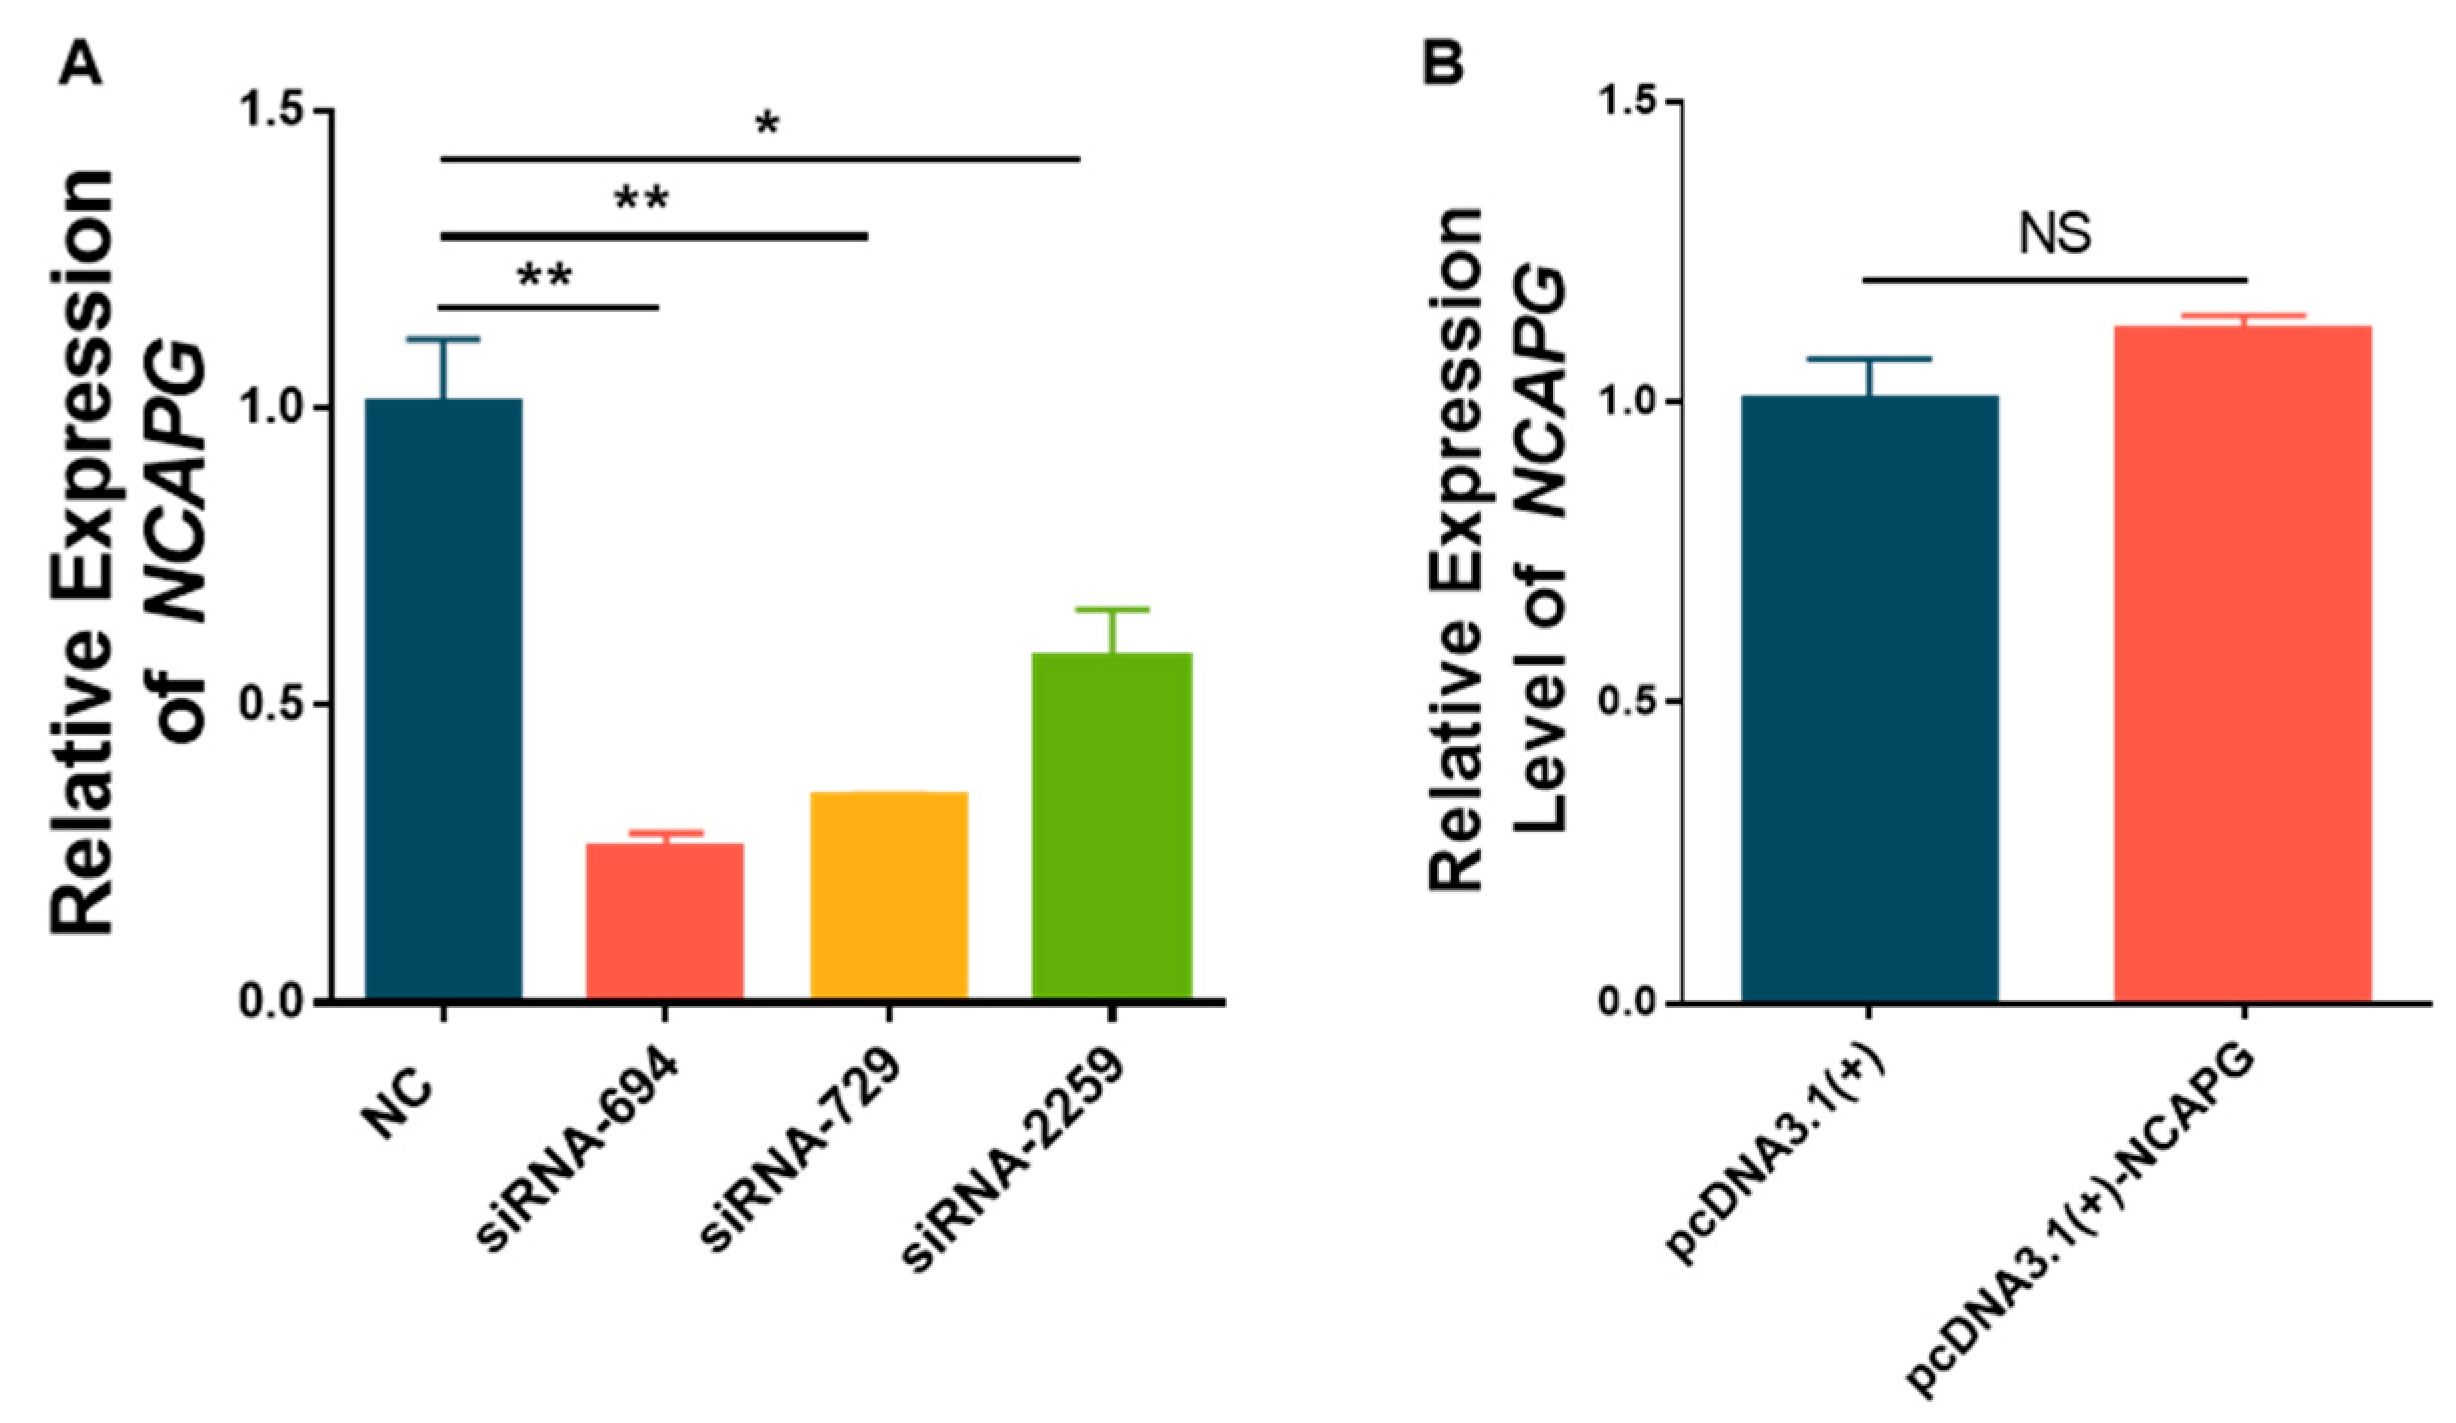
Cell proliferation occurs as a result of the combination of cell growth with regular “G1-S-M-G2” cell cycles to produce many diploid cell progeny. RNA interference at the cellular level was implemented to investigate the role of
NCAPG in myoblast proliferation. In the current study, the results suggest that knocking down
NCAPG expression could inhibit cell proliferation (
Figure 4). This is consistent with the result in cattle research where
NCAPG knockdown prolonged the procession of myoblast mitosis [
28]. In human research,
NCAPG could promote the proliferation of many types of cells, such as hepatocellular carcinoma cells [
44,
45], colorectal cancer cells [
46], and pulmonary artery smooth muscle cells [
47]. All these pieces of evidence suggest that
NCAPG could increase proliferation in various types of cells. Previous research suggests that NCAPG as a mitosis-associated chromosomal condensation protein plays an important role in the appropriate separation of sister chromatids [
48]. In the current study, the number of cells in the S phase was significantly increased and the number of cells in the M phase was increased (not significantly) when
NCAPG was inhibited (
Figure 4). In cattle,
NCAPG inhibition prolonged the prometaphase and metaphase of proliferating myoblasts [
28]. Considering the function conservation of
NCAPG in growth and development traits across mammals [
26], we confidently speculate that
NCAPG regulates proliferation through prometaphase and metaphase. All these pieces of evidence suggest that
NCAPG could increase differentiation in various types of cells.
Differentiation is different from proliferation [
37,
38]. In the current study, two pieces of evidence support the inhibition of
NCAPG inhibiting myogenic differentiation in myoblasts (
Figure 5). A human cancer meta-analysis suggests that
NCAPG has a relationship with cell differentiation [
49]. In cattle,
NCAPG inhibited myogenic differentiation in myoblasts [
28]. All these pieces of evidence suggest that
NCAPG could increase proliferation in various types of cells. Previous studies suggest that chromatin accessibility could regulate embryonic muscle development in pigs [
50] and cattle [
51]. In cattle research, it was found that
NCAPG may adjust chromatin accessibility [
28]. Thus, we speculate that
NCAPG regulates myogenic differentiation by regulating chromatin accessibility.
Screening for SNPs in the putative promoter region of functional genes is an effective way to identify useful genetic markers for animal breeding. In this study, all identified SNPs in the promoter region of
NCAPG were associated with at least one growth and development trait (
Table 6 and
Table S2). Consistent with the results in sheep research, a number of effects of SNPs located in the promoter regions on growth [
35,
52], carcass [
34,
53], meat quality [
34,
53], and reproductive traits [
54,
55] were reported. Our finding is also consistent with the results from other livestock species showing that
SNPs found in the promoter region are significantly associated with economically important traits [
56,
57,
58,
59]. SNPs in the promoter region may influence promoter activity, transcription factor binding, DNA methylation, and histone modifications [
60]. For example, an SNP in the
NR5A2 promoter region could regulate litter size in Hu sheep by increasing the promoter activity [
55]. Similar research has reported that a novel SNP in the
IGF1 promoter region could regulate the litter size of Yunshang black goats by increasing transcription-promoting activity [
59]. Thus, these five SNPs may regulate the expression of
NCAPG and influence sheep growth and development by adjusting the activity of the promoter.


 ,
, 


