4.1. Environmental Variables inside the Pig House
The PM
2.5 concentrations in this experiment were close to those reported in previous studies [
20] and exceeded the limit of 35 μg·m
−3 in the Ambient Air Quality Standard (GB3095-2012) issued by the Ministry of Environmental Protection in China. During the spring season, because the pig house had a low density of pigs and a ventilation level ranging from 6.4 to 47.0 m
3·h
−1, PM
2.5 concentrations close to 200 were not reached, as reported by Shang et al. [
21]. However, it should be noted that the latest PM
2.5 limit proposed by the World Health Organization (WHO) has been lowered from 25 to 10 μg·m
−3, indicating that even low concentrations of PM
2.5 can be hazardous to humans and animals.
The environmental variables were higher during the day than at night, which may be related to the higher temperature and the more frequent activity of pigs during the day than at night. Some studies have found that PM concentrations in pig houses are significantly affected by pig activity [
22,
23]. When the pigs were fed or frightened, their activity increased and PM concentration increased significantly. Additionally, as this experiment was carried out in spring, the diurnal temperature changes outside the house had a direct impact on indoor temperature and microbial activity. Higher temperatures led to an increase in microbial activity and pollutant emissions, such as ammonia, and negatively affected air quality [
24]. In addition, during the monitoring period, the concentration of PM
2.5 at high altitude (1.7 m) were significantly higher than that at low altitude (0.6 m). This may be attributed to the light mass of PM
2.5, which is more easily suspended in the air than coarse particles. Understanding the diurnal changes of the environmental parameters, such as PM
2.5, in the pig house can help regulate the environment in the pig house more precisely.
Inorganic secondary ions, represented by NH
4+ and NO
3−, can be used as marker substances for identifying the production of secondary particles from air pollutants such as ammonia (NH
3) and nitrogen oxides (NO
x) in the house. This process takes place through a series of chemical reactions between acidic and alkaline gases as precursors, and has been detected in the air environment in several scenarios in recent years [
25,
26]. The content of NH
4+ and NO
3− detected during the day were significantly higher than that at night (
p < 0.05), which was related to increased pig activity during the day and poorer air quality in the house. Although Roumeliotis et al. [
27] found that more than 50% of PM
2.5 in European chicken houses was derived from secondary particles, the proportion of water-soluble ions in PM
2.5 in the pig house in this study was very low. This suggests that the PM
2.5 in this environment was predominantly produced directly by some substances in the house.
4.2. Airborne Microbial Varies and Network Interaction
The α diversity showed that compared with airborne fungi, the airborne bacteria in the pig house seemed to be more abundant and have a more complex community structure. Yan et al. found that bacteria accounted for more than 90% of PM
2.5 microbial components in pig houses using metagenomic technology, which was consistent with the findings of this study [
28]. Eisenlöffel et al. [
29] measured the concentration of airborne bacteria in a pig house to be 2.2–5.2 × 10
5 colony-forming units (CFU)/m
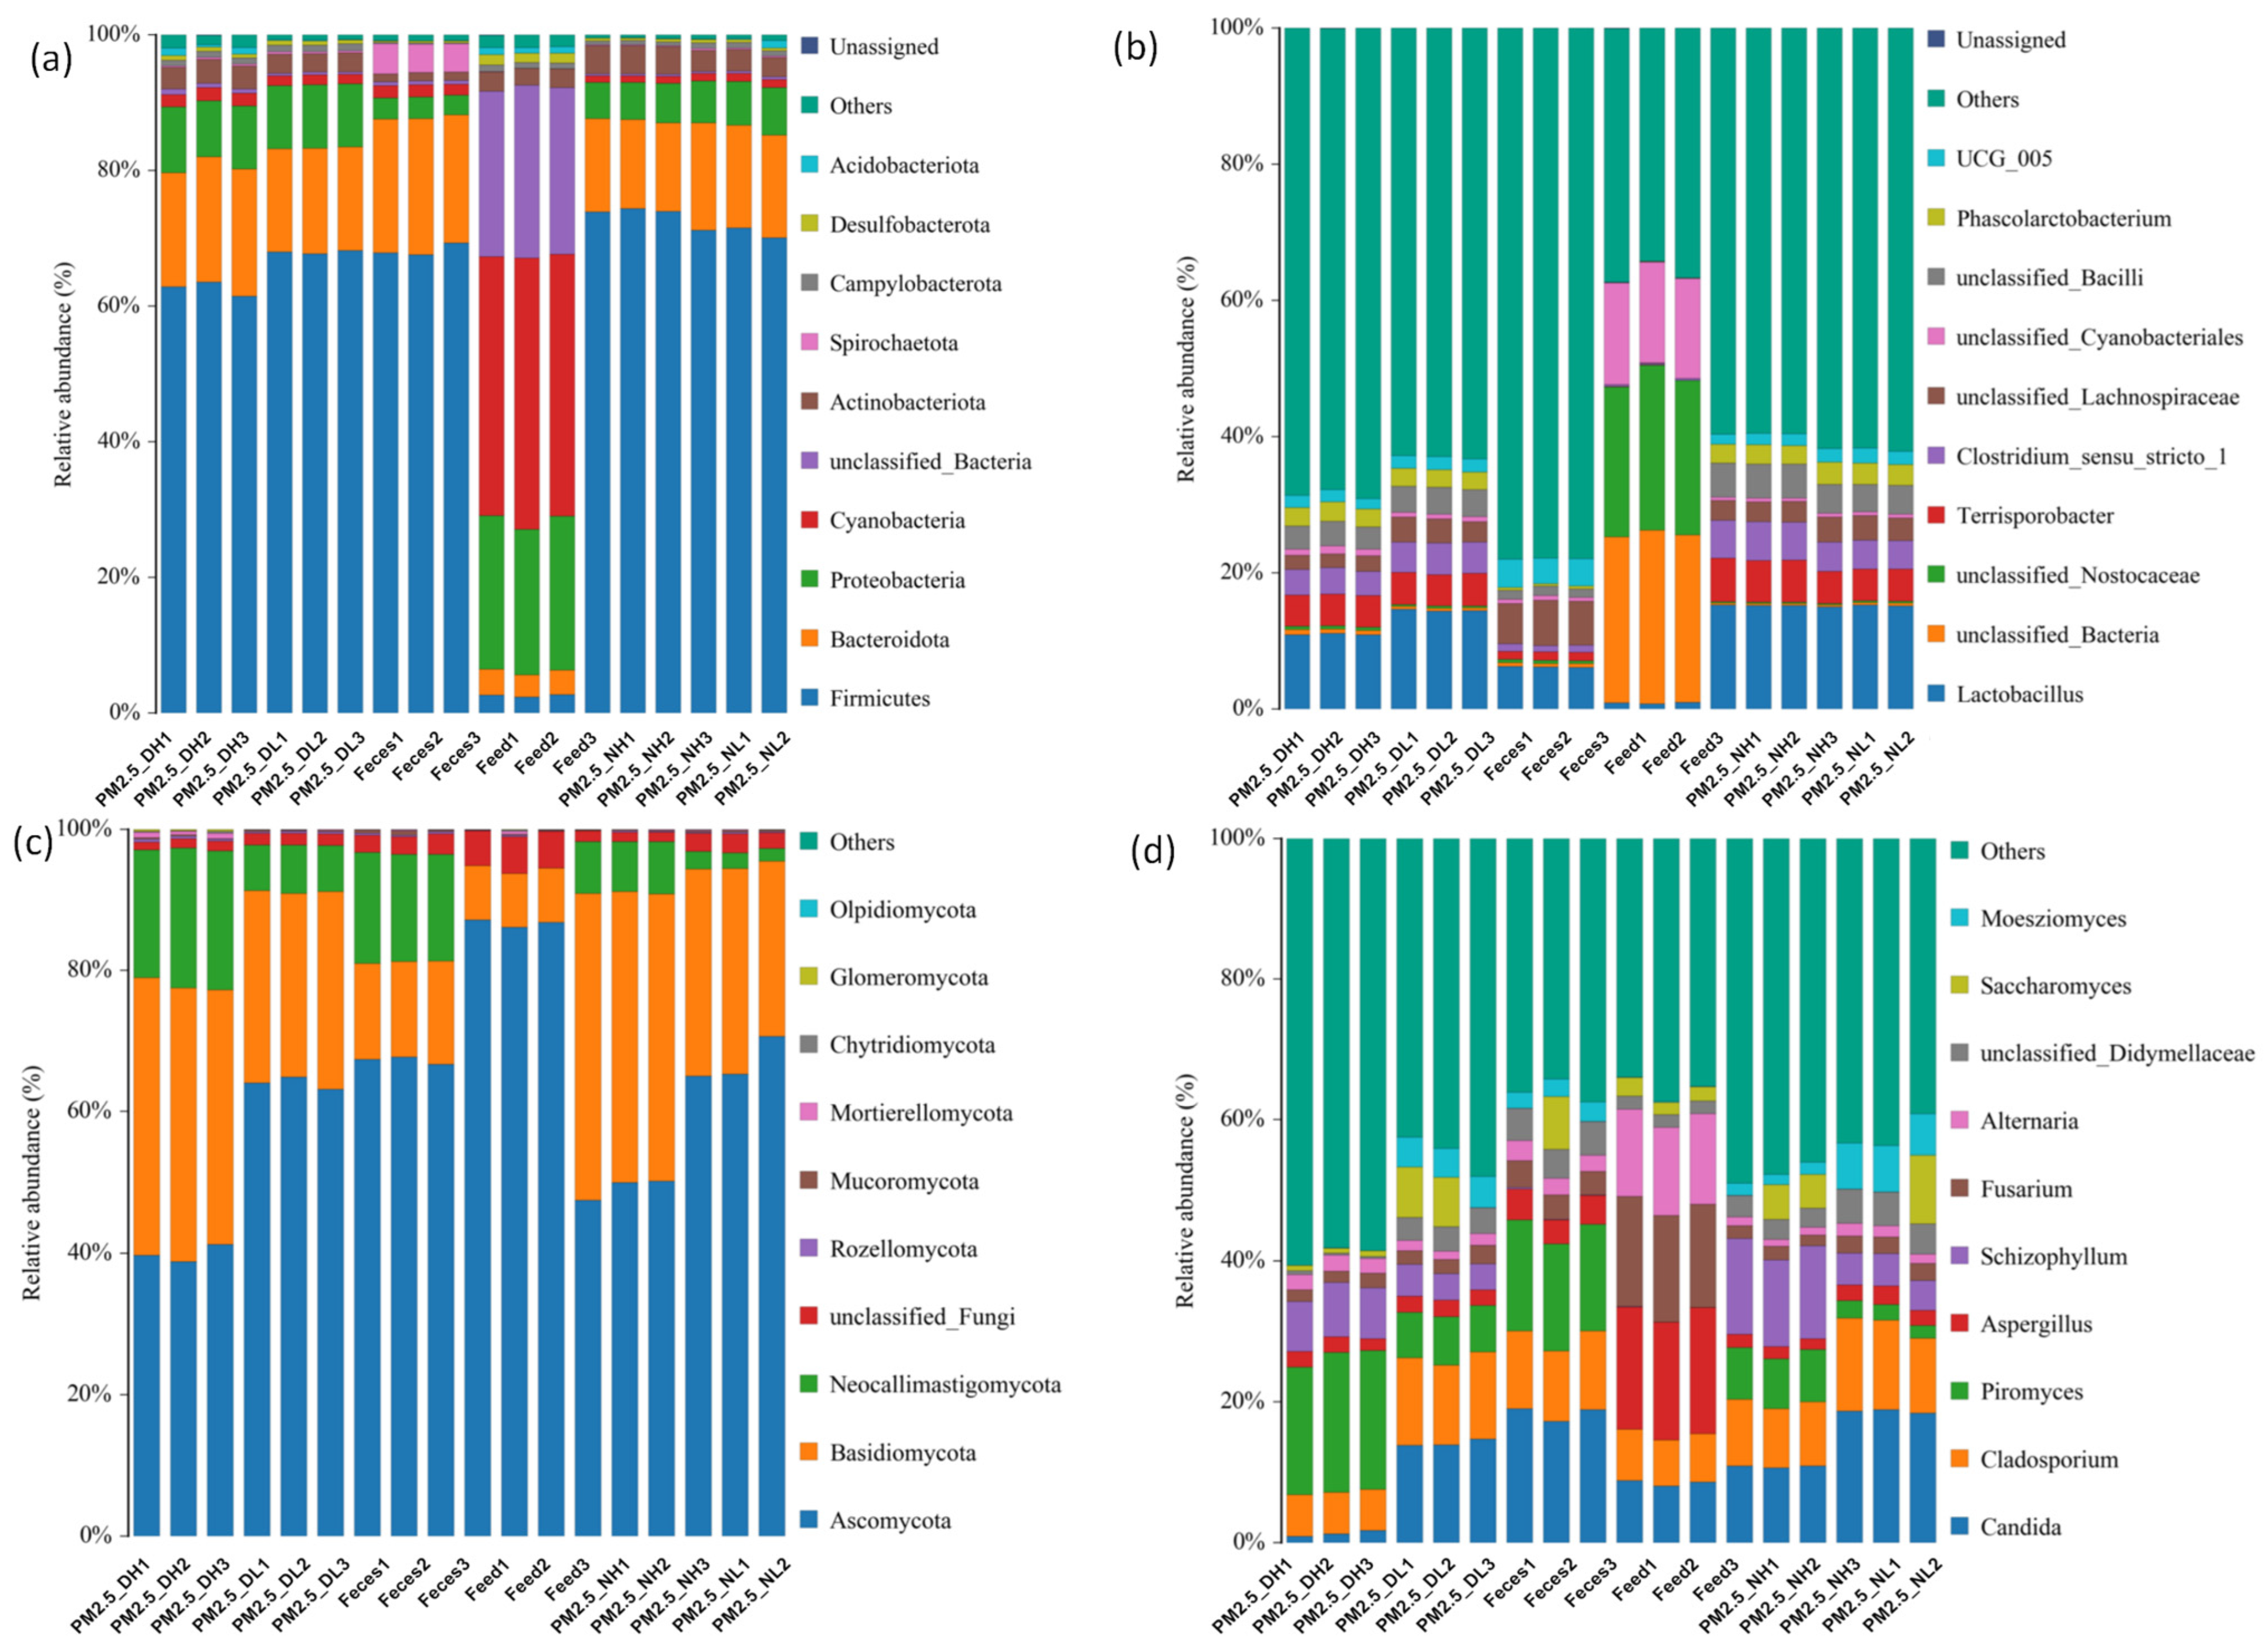
3. In the composition of of phylum level airborne microorganisms,
Firmicutes was the most dominant bacterial phylum, which was consistent with previous research conducted in piggeries [
30,
31]. Conversely, some studies have reported that the most abundant phylum in pig farms bioaerosols is
Proteobacteria rather than
Firmicutes [
32]. This discrepancy may be caused by the collection of samples from the external environment surrounding the piggery, because Du et al. [
33] believed that
Proteobacteria was the most abundant bacterial phylum in residential areas, and its proportion was greatly different from that of the PM
2.5 in piggeries. Therefore, the composition of airborne microorganisms in pig houses may be affected by the point locations where the samples are collected. The point locations outside the pig house may vary in many ways depending on the external environment, whereas the airborne microbial community structure inside the pig house is relatively stable.
Lactobacillus and
Acinetobacter are the most noteworthy bacteria in the generic microbial composition.
Lactobacillus has the highest abundance among the identified bacteria, and is commonly found in nature. It rarely causes diseases and plays an important role in intestinal health of pigs. Branched chain fatty acids (BCFAs) produced by
Atopostipes have an important influence on dietary digestion [
34]. In contrast,
Acinetobacter is the most harmful to health among the identified potential pathogens. Tang et al. [
35] identified
Acinetobacter,
Streptococcus,
Escherichia-Shigella, and
Pseudomonas as the pathogenic bacteria, in both PM
2.5 and the respiratory tract of pigs.
Acinetobacter can easily cause respiratory tract infection, bacteremia, meningitis, urogenital tract wound and skin infection while the body’s resistance weakens or skin damage occurs [
36].
Acinetobacter has strong adhesion ability and grows easily in humid environments. It has been found many times in breeding environments in the past reports [
37]. As far as fungi are concerned, there are many kinds of
Candida, but only a few of them can cause diseases to humans, and
Candida albicans is the most common one. Attention should be paid to the aflatoxins produced by Aspergillus flavus among potential sensitizing fungi; they have been classified as Class 1 carcinogens by the Cancer Research Institute of the WHO, and can damage human and animal liver tissues. In severe cases, they can lead to liver cancer and even death.
Due to the diurnal variation and height, the microbial composition of the four types of PM
2.5 samples showed significant differences (Adonis;
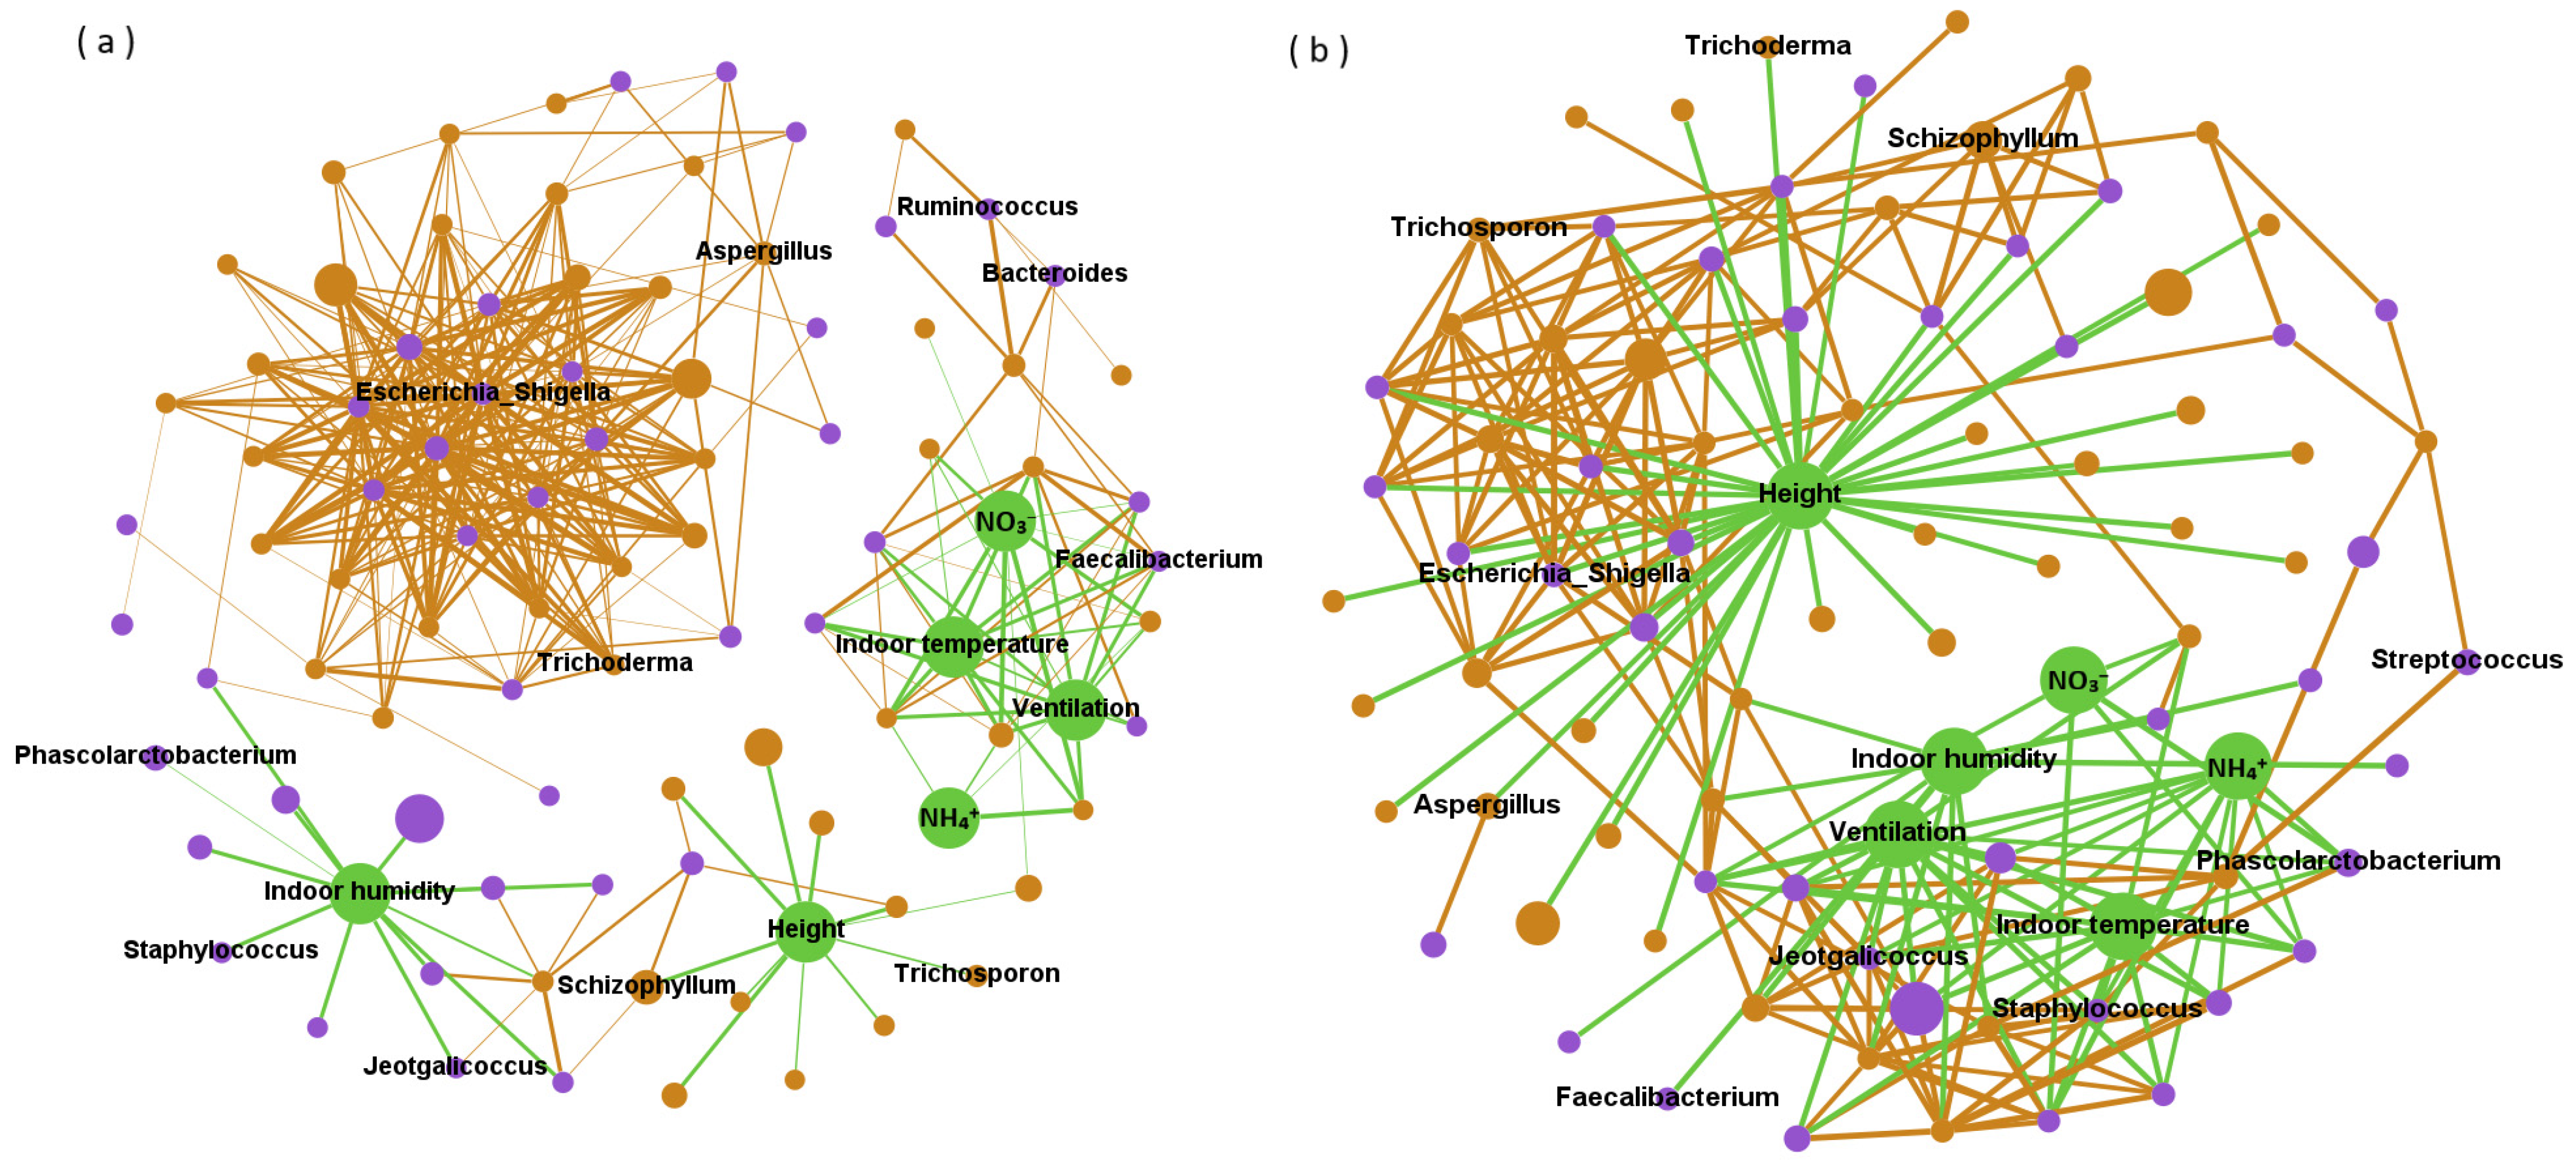
p < 0.01). However, the specific effects of altitude, daytime and night on airborne microorganisms remain unclear, possibly due to the complex effects of environment on microbial communities. Network analysis has revealed that certain indicators such as temperature and altitude are positively correlated with some factors, but negatively correlated with others. Combinations such as intersymbiosis, co-colonization and niche overlap make bacteria and fungi coexist under various interactions [
38,
39]. In this study, we found a positive correlation between bacteria and microbial community, which was consistent with the results reported by Ma et al. [
5] Microorganisms in PM
2.5 have strong coagulation and modularization characteristics. Compared with fungi, bacteria have more complex interactions, especially in positive correlation networks. There are 10 kinds of bacteria that can directly affect other microorganisms to a higher degree, while 3 kinds of fungi can negatively affect many kinds of microorganisms directly. As for environmental factors, they mainly indirectly affect microbial abundance. Fungal spores in the air will be affected by short-term temperature changes, vertical heat flow and mechanical agitation [
40]. In addition, a humid environment is more conducive to microbial growth, and NO
3− is considered as a nutrient for bacterial growth and metabolic activities, so they are mainly positively correlated. Airborne microorganisms in piggeries have temporal and spatial variations, but environmental effects may differ across different genera. The interaction of bacteria in airborne microorganisms is mainly synergistic.
4.3. Traceability Analysis
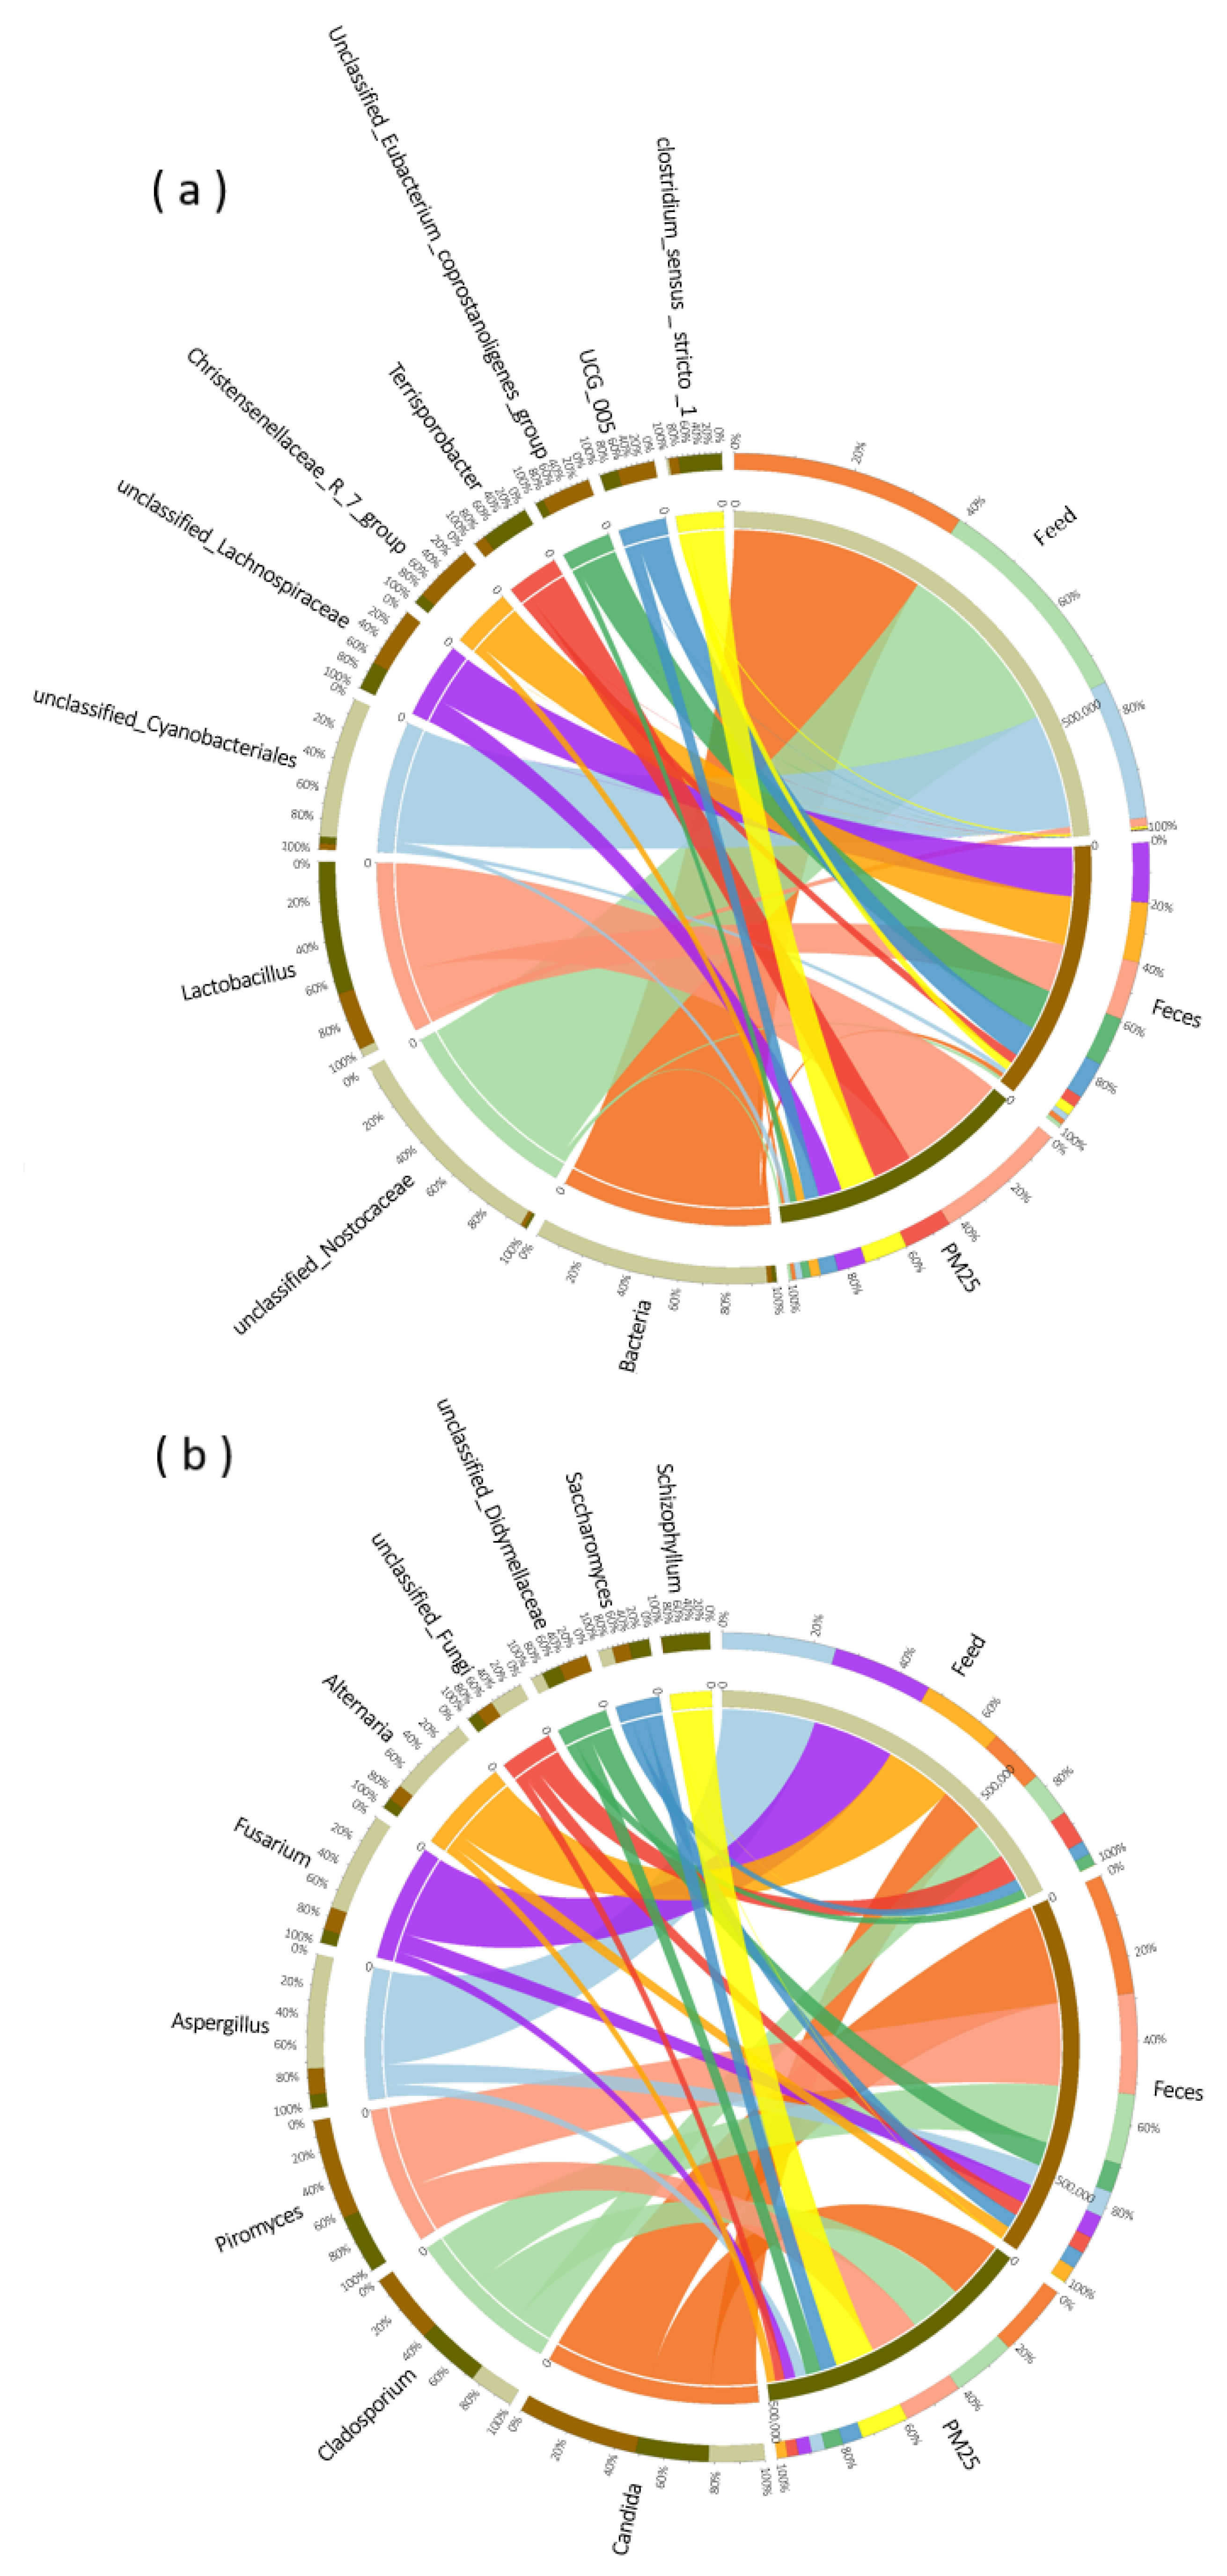
In this study, the microbial compositions of these three groups were compared. The compositions of dominant bacteria and fungi in feed and PM
2.5 were very different, contradicting the previous view that feed is the main source of PM
2.5 in piggeries [
41]. The microbial composition of PM
2.5 was consistent with that reported previously, and most of the microbial composition in feed was from animals, while most of the microbial composition in feed was from plants. The possible reason may be the formula feed is widely used in pig feed now, which is mainly composed of energy feed, protein feed and premix. The energy feed and protein feed as the main body of the formula mostly use plant raw materials such as corn, soybean meal, and rapeseed meal. Secondly, the nutritional components of feed itself, the production process, the content of additives and other aspects may also affect its microbial composition to a certain extent [
42]. The bacterial composition of feces was similar to that of PM
2.5 and both of them had the highest relative abundance of
Lactobacillus, a kind of bacterium which can colonize the intestinal tract of pigs [
43]. Thus, the relative abundance of
Lactobacillus in feces increase continuously, which may be the main reason why
Lactobacillus in feces was much higher than that in feed. Moreover, except
Schizophyllum, other fungi in feces were similar to PM
2.5 samples. To sum up, the microbial community structure of PM
2.5 and feces were similar, while the feed seemed to be very different.
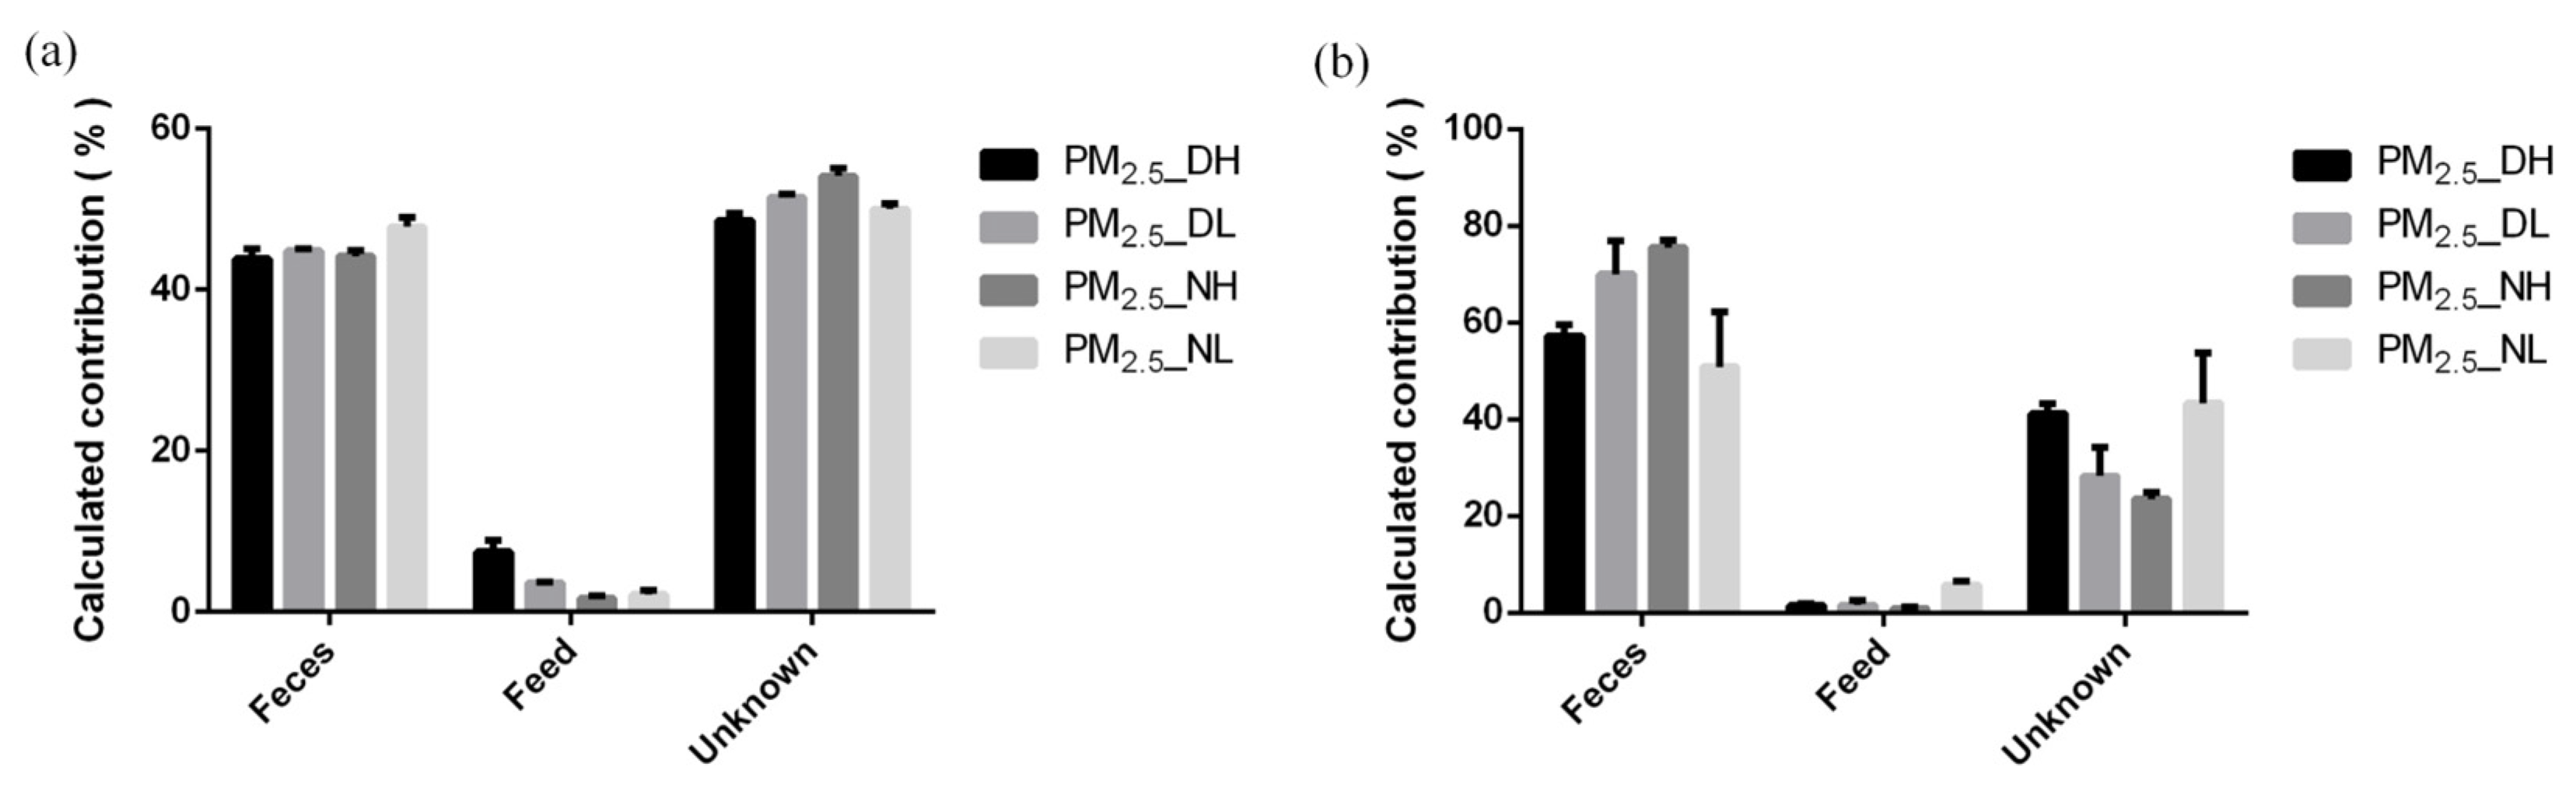
Further calculations by SourceTracker showed that the fecal source of PM
2.5 in the air of the closed pig house was much more than feed. SourceTracker works by modeling environment samples as mixed sinks of several sources. It then assigns all the OTUs in the environmental sink sample to one source and classifies an OTU as “Unknown” if it cannot be assigned to a source. In this study, the unknown source of the PM
2.5 microbial community accounted for a large proportion, and the taxa of the unknown source may come from unidentified sources in the piggery, such as external air, soil, pig dander and hair, etc. [
44], and may also include the air protozoan microbial community in the piggery. The SourceTracker method has limitations in identifying the sources with similar bacterial communities [
45] and needs to be further optimized in its running speed and result accuracy. To enhance the reliability of SourceTracker’s proportional prediction, RSD was calculated by 5 independent SourceTracker runs. The source with the largest proportion and the smallest RSD value indicates higher confidence, such as the fecal source of PM
2.5 samples with a height of 1.7 m collected at night. For the feed source for this sample, the program shows greater variability in quantifying low source contributors. SourceTracker may only predict the presence of a low proportion of sources and cannot quantify a low proportion of source inputs. RSD values of all predicted sources in all PM
2.5 samples were less than 100%, indicating consistent results when applying the SourceTracker setting of this experiment.


