Article

Stress-Dependent Permeability of Naturally Micro-Fractured Shale

1
Chengdu Center of Geological Survey, China Geological Survey, Chengdu 610082, China
2
GFZ German Research Centre for Geosciences, Telegrafenberg, 14473 Potsdam, Germany
3
Key Laboratory for Sedimentary Basin and Oil and Gas Resources, Ministry of Natural Resources, Chengdu 610081, China
4
School of Geoscience and Technology, Southwest Petroleum University, Chengdu 610500, China
*
Author to whom correspondence should be addressed.
Geosciences 2022, 12(4), 150; https://doi.org/10.3390/geosciences12040150
Submission received: 25 February 2022 / Revised: 19 March 2022 / Accepted: 25 March 2022 / Published: 27 March 2022
(This article belongs to the Section Geomechanics)

Abstract

:
The permeability characteristics of natural fracture systems are crucial to the production potential of shale gas wells. To investigate the permeability behavior of a regional fault that is located within the Wufeng Formation, China, the gas permeability of shale samples with natural micro-fractures was measured at different confining pressures and complemented with helium pycnometry for porosity, computed micro-tomographic (µCT) imaging, and a comparison with well testing data. The cores originated from a shale gas well (HD-1) drilled at the Huayingshan anticline in the eastern Sichuan Basin. The measured Klinkenberg permeabilities are in the range between 0.059 and 5.9 mD, which roughly agrees with the permeability of the regional fault (0.96 mD) as estimated from well HD-1 productivity data. An extrapolation of the measured permeability to reservoir pressures in combination with the µCT images shows that the stress sensitivity of the permeability is closely correlated to the micro-fracture distribution and orientation. Here, the permeability of the samples in which the micro-fractures are predominantly oriented along the flow direction is the least stress sensitive. This implies that tectonic zones with a large fluid potential gradient can define favorable areas for shale gas exploitation, potentially even without requirements for hydraulic fracture treatments.

1. Introduction

Shale formations are expected to provide a large amount of potential for the current and future energy supply. Shale permeability is commonly less than 0.1 mD [1,2,3], which normally requires hydraulic fracturing to achieve economic shale gas production by creating fracture networks [4]. Fractures often dominate or at least favor fluid flow in the subsurface [5]. Fracture permeability in shale is not only crucial to understanding the production of hydrocarbons during their exploitation [6], but is also beneficial for understanding hydrocarbon migration in shale strata and the enrichment of shale gas [6]. Macro-fractures have been widely studied previously to gain insight into their transport properties under different pressure conditions [7,8,9,10]. Most of the laboratory investigations, however, were based on artificially generated fractures [2,6,11]. Shale is a type of fracture-prone rock [12], in which natural micro-fractures may exist due to tectonic stress or diagenesis [13]. Such micro-fractures in or connected to a fault may play an important role in shale gas enrichment and exploitation because they constitute the pathways along which adsorbed gases migrate [4,14]. Most previous studies were focused on natural micro-fractures distributed randomly within shale strata [15]. As shales often show a large amount of hydraulic anisotropy at the microscale [16], a correlation between the rock microstructure and its flow properties needs to be elucidated. Laboratory-derived permeability is commonly lower than that found in the field, which requires fractures acting as flow conduits to be postulated [17]. Additionally, there is no general agreement on whether and where natural fractures independently contribute to shale gas production [12].
Within the past six years, it was found that a regional fault in the Wufeng Formation is stable over the Middle–Upper Yangtze (MUY) [18]. The regional fault in this formation is commonly observed in the laminar siliceous shale section (LSS) at both the core and the limbs of the folds in the MUY. It is mainly composed of a damage or fracture zone that is commonly parallel to the strata and stable over an entire outcrop with a thickness of 0.3–1.5 m (Figure 1A), which is obviously different from local faults (e.g., in the Longmaxi Formation). Both on the upper and lower plane, the fracture zone is in abrupt contact with normal strata, which also is obviously different from common faults and fractures in shale strata (Figure 1A). The fracture zone in this slip layer is mainly composed of fault breccia and fault gouge and, according to the cleavage in the fault gouge, was formed by shear stress. The fabric of the fracture zone is very complex and differs locally. In general, this layer is mainly composed of fault gouge at the limb of the fold, in which the LSS is mainly composed of calcareous siliceous shale. In contrast, at the core of the fold, the fracture zone is composed of fault breccia and disengaged shale layers intersected by vertical fractures and interlayered with other disengaged layers in which the LSS is mainly composed of siliceous shale.
This regional fault likely acts as a hydrocarbon migration pathway in the shale gas target layer (i.e., the Wufeng–Longmaxi Formation). In this formation, well HD-1 was drilled into the core of the Huayingshan anticline located in the eastern Sichuan Basin, China [18]. The natural shale gas flow in well HD-1 yields a daily production of more than 3 × 10³ m3 and its payback period is shorter than that in ordinary shale gas wells with previous hydraulic fracture treatments [19]. This indicates that shale gas in China has the potential to be exploited without hydraulic fracturing, which, to date, has constituted a bottleneck for the shale gas industry worldwide in terms of pollution [20], investments [21], and the possibility of induced seismicity [22]. The permeability of intact shale in the Wufeng Formation is commonly less than 0.01 mD [18] and thus negligible, whereas it amounts to as much as 217 mD when the shale is fractured [23]. Hence, the permeability of natural fractures in shale is crucial to evaluating the economic potential of shale gas exploitation without the requirement of hydraulic fracture treatments. In this work, the permeability of naturally fractured core samples from well HD-1 was investigated to understand the permeability characteristics and the shale gas migration ability of the associated regional fault.

2. Materials and Sample Preparation

All shale samples used in this study originated from cores recovered from well HD-1 (Figure 1B) at a depth between 1312 and 1333 m. They relate either to the largest total gas content (BTGC) layer (Samples 4, 20, and 26) or to the main production (MP) layer (all other shale samples). The shale cores are composed of quartz, feldspar, calcite, pyrite, and clay at variable contents, as specified in [18]. Cores from the MP layer are dominated by quartz in the range of 85.0 wt% to 89.6 wt%. Veins filled with precipitated minerals can be observed in the cores, indicating that the micro-fractures have developed in the reservoir and constitute migration pathways for fluid flow on geological time scales [24]. Sample 8 is a porous sandstone sample without fractures, which was used for reference and comparison purposes, particularly related to the pressure dependence of permeability in the naturally micro-fractured shale samples. This Rotliegend sample originated from a quarry near Flechtingen, Germany and contains 59 wt% quartz, 8 wt% feldspar, 6 wt% illite, 5 wt% rock fragments, and approximately 20 wt% cement [25,26].
Considering that regional faults are commonly parallel to the strata, the samples were drilled perpendicular to the original direction of the cores using liquid nitrogen. The well is nearly vertical at the site and, thus, the samples are oriented sub-horizontally, i.e., in parallel, to the reservoir section. Larger pre-existing fractures through the original core section were not sampled to minimize the risk of sample decomposition. Instead, samples were taken on apparently intact pieces containing fractures at the micro to the sample scale. All samples were prepared in a cylindrical shape with a diameter of 30 mm and a length of 40 mm and protected with a Fluorinated Ethylene Propylene (FEP) heat shrink tube (Figure 1B).

3. Experimental and Analytical Procedures

3.1. Porosity and Permeability

Before the porosity measurements, all samples were kept in a vacuum drying oven at 60 °C for four days to minimize the residual water content, which, however, was unknown. The porosity of the samples was then determined with a helium pycnometer (Micromeritics AccuPyc 1330). The shale samples were measured with the jackets and the bulk volume was corrected accordingly. The porosity can be calculated from the measured solid volume (effective) (Table 1).
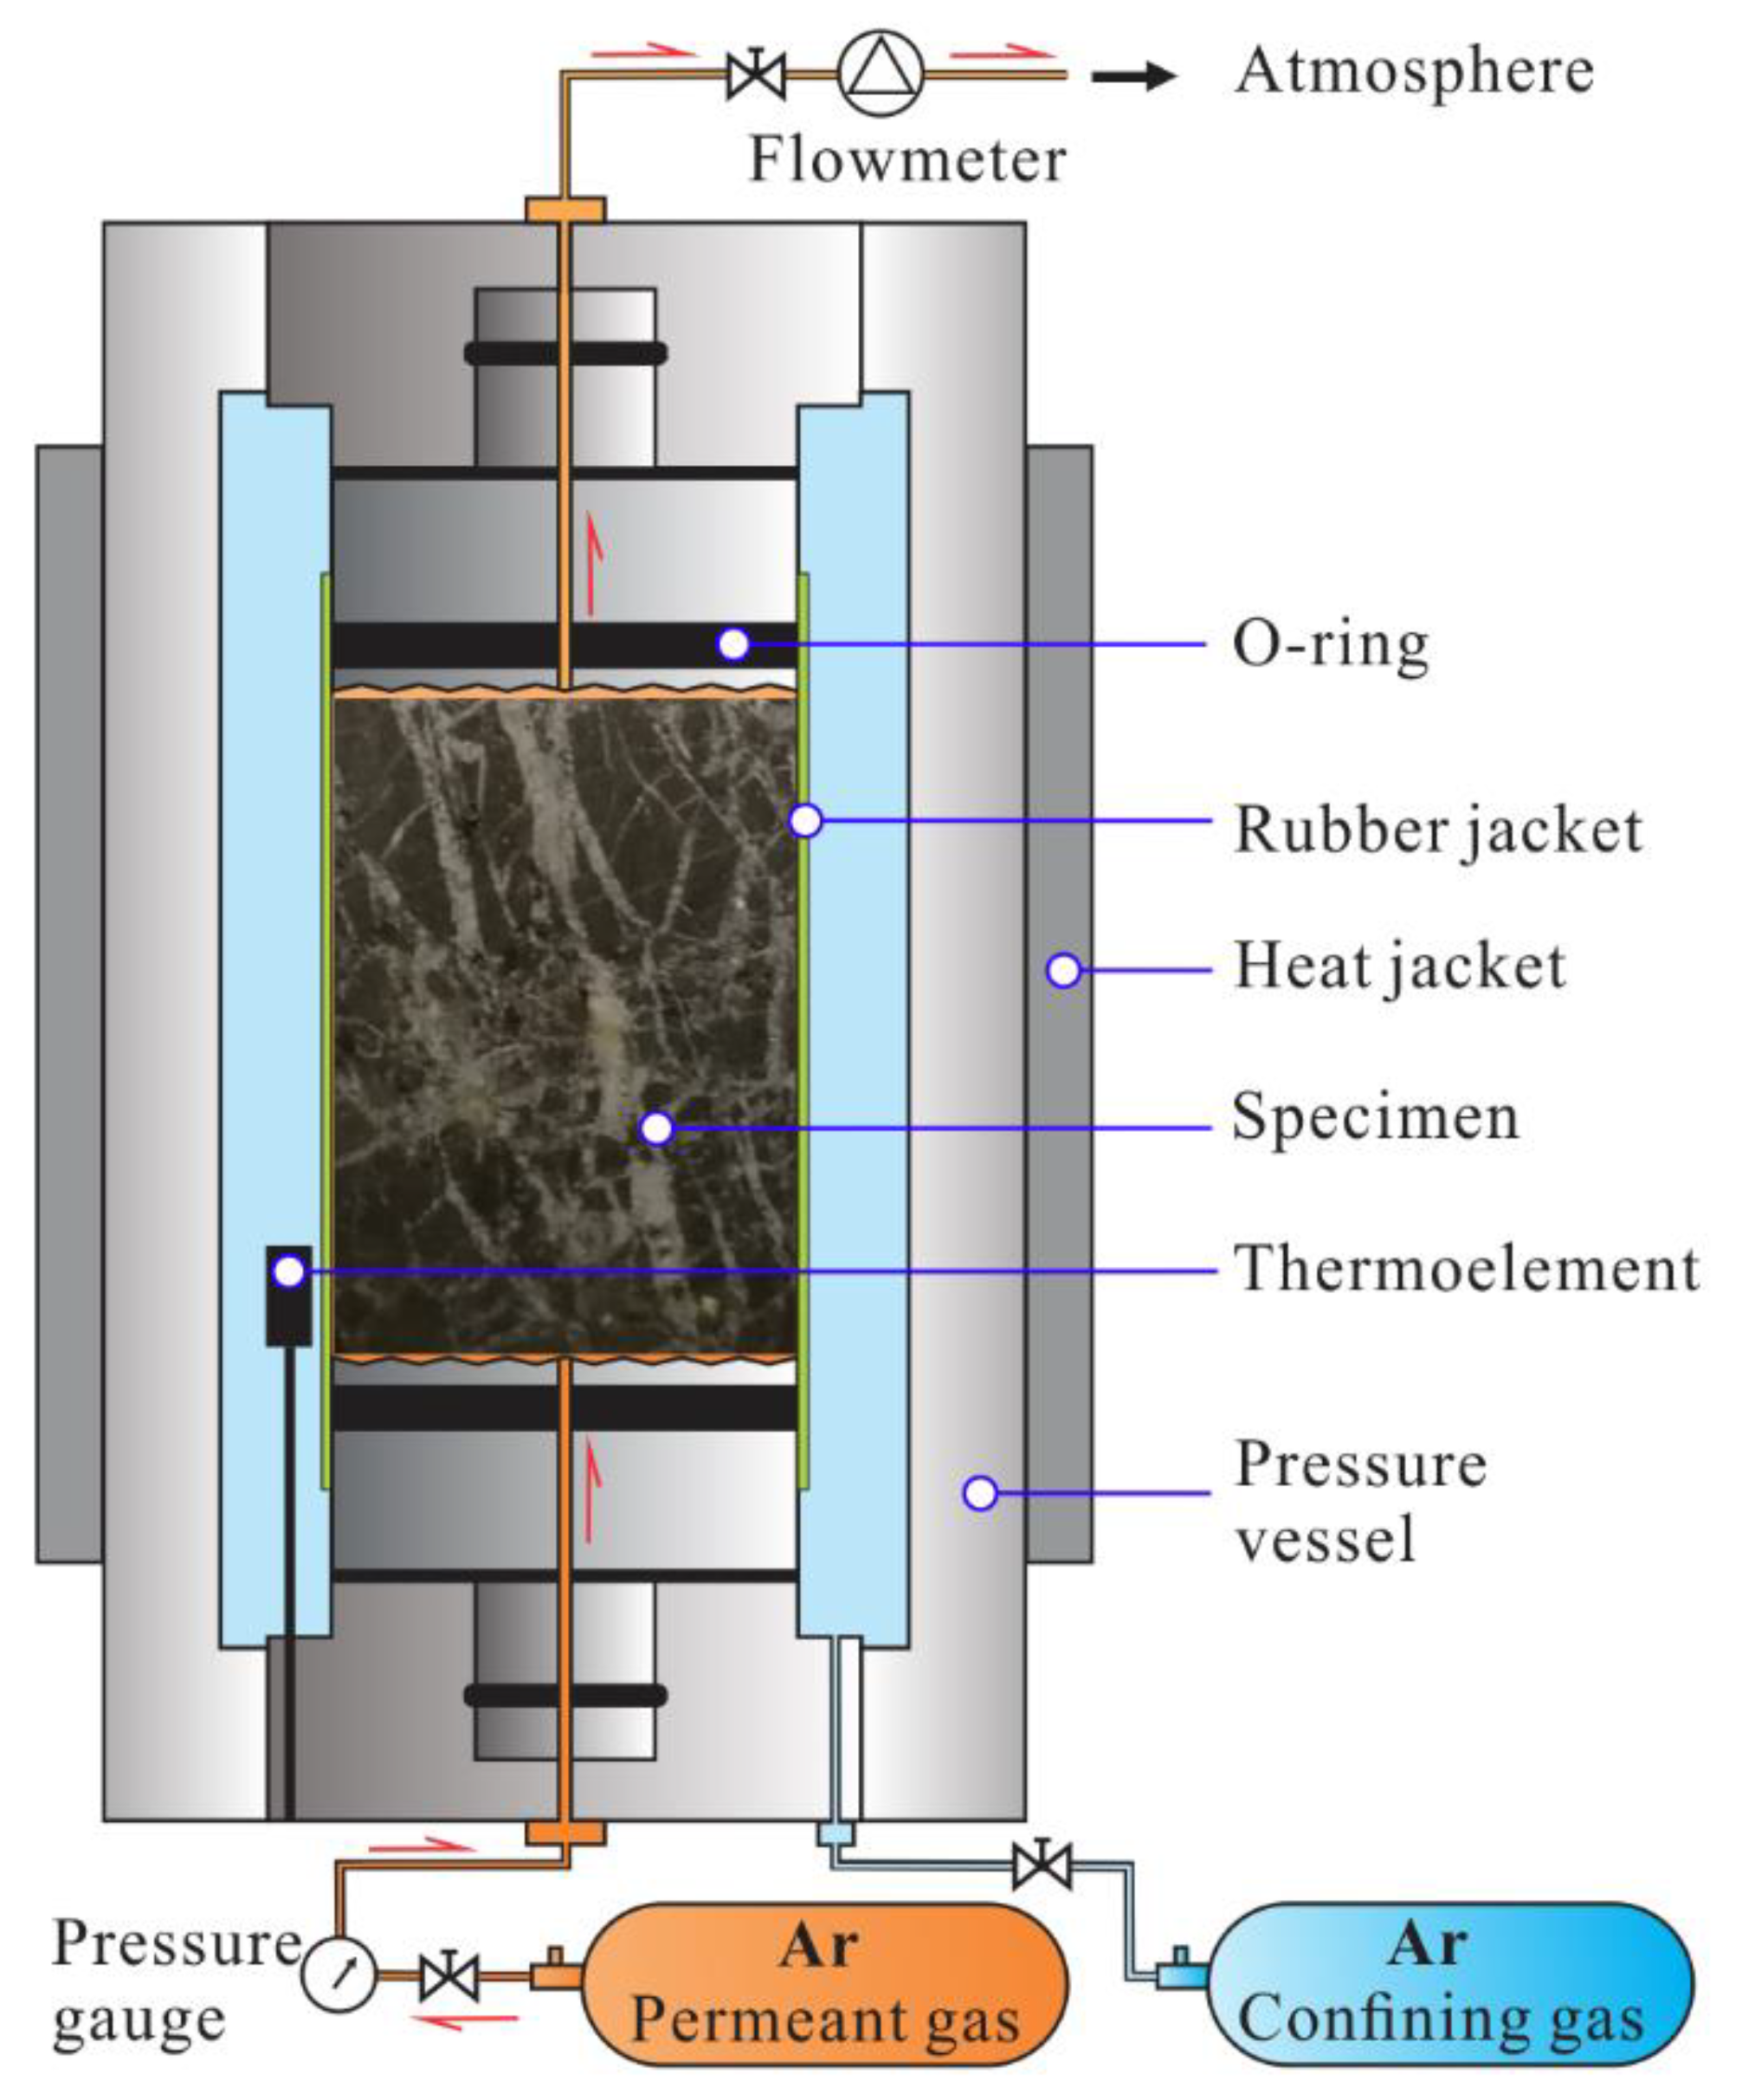
Due to the content of clay minerals in shales, permeability measurements with shale are always performed with inert gases to avoid any potential fluid–rock interactions (e.g., clay swelling) [3,14,27,28,29,30]. Permeability was measured under hydrostatic pressure conditions with a gas permeameter (Figure 2). It should be noted that the confining pressure gas enters the slit between the fixed vessel parts and the plugs that hold the sample up to the smaller O-ring that disconnects the confining pressure from the pore pressure system. Consequently, a small area of the sample’s end faces is not fully pressurized and the pressure state is only approximately hydrostatic. Argon was used as both the confining pressure medium and the pore fluid. The temperature was held constant at 50 ± 1 °C to simulate the approximate thermal state in the reservoir. Flow was initiated by applying a constant fluid pressure upstream, keeping the downstream side of the sample at atmospheric pressure. The confining pressure was increased from 4 to 10 MPa in steps of 1 MPa. The choice of the highest confining pressure was motivated by technical limitations and not by the reservoir conditions found in situ. As outlined further below, an empirical extrapolation of the experimental data toward higher pressures was then performed. At each confining pressure level, the (absolute) upstream pore pressure was increased from 0.2 to about 1.3 MPa in 8 steps and the respective resulting flow rate was measured with flow meters downstream. As confining pressure is increased, permeability typically decreases as the cross-sectional area of the void space (i.e., pores and/or cracks) effective for flow is reduced. To evaluate hydrocarbon migration and trapping during the burial history, it is also valuable to measure permeability during the unloading sequence to investigate any possible departure from the respective starting value. Therefore, stepwise unloading was applied to Samples 2, 8, and 16 to investigate the reversibility of permeability changes.
The steady-state method for measuring permeability is based on a constant pressure gradient and the resulting constant gas flow rate. Gas permeability (kg) was calculated according to [31]:
k g = 2 µ L Q A ( P down P up 2 P down 2 ) ,
where µ is the viscosity of argon at 50 °C (24.6 μPa·s), L is the specimen length, A is the cross-sectional area of the sample, Q is the measured flow rate, and Pup and Pdown are the respective (absolute) pore pressures at the upstream and downstream (i.e., atmospheric pressure; 0.1 MPa) ends of the specimen, respectively.
Intrinsic permeability is a measure of the mobility of a fluid within a porous material that is related solely to the pore geometry of the rock (e.g., porosity, pore shape, pore connectivity, and pore-size distribution) and is independent of the properties of the fluid. As is well known [31] and also evident from the present results, the permeability to gas of a porous medium decreases as the pore-pressure differential increases at all confining pressures. The gas pressure-dependent permeability mainly originates from gas slip on the solid pore walls. This phenomenon is called the Klinkenberg effect [27,32,33]. The permeability to gas (i.e., argon) as a function of the inverse of the average pore pressure, 1/Pav, where Pav = (Pup + Pdown)/2, is often found to be a linear correlation and the (apparent or Klinkenberg) permeability of a rock to a liquid, e.g., water, k can be derived from:
k g = k ( 1 + b P av ) ,
where b is the so-called Klinkenberg slip factor.
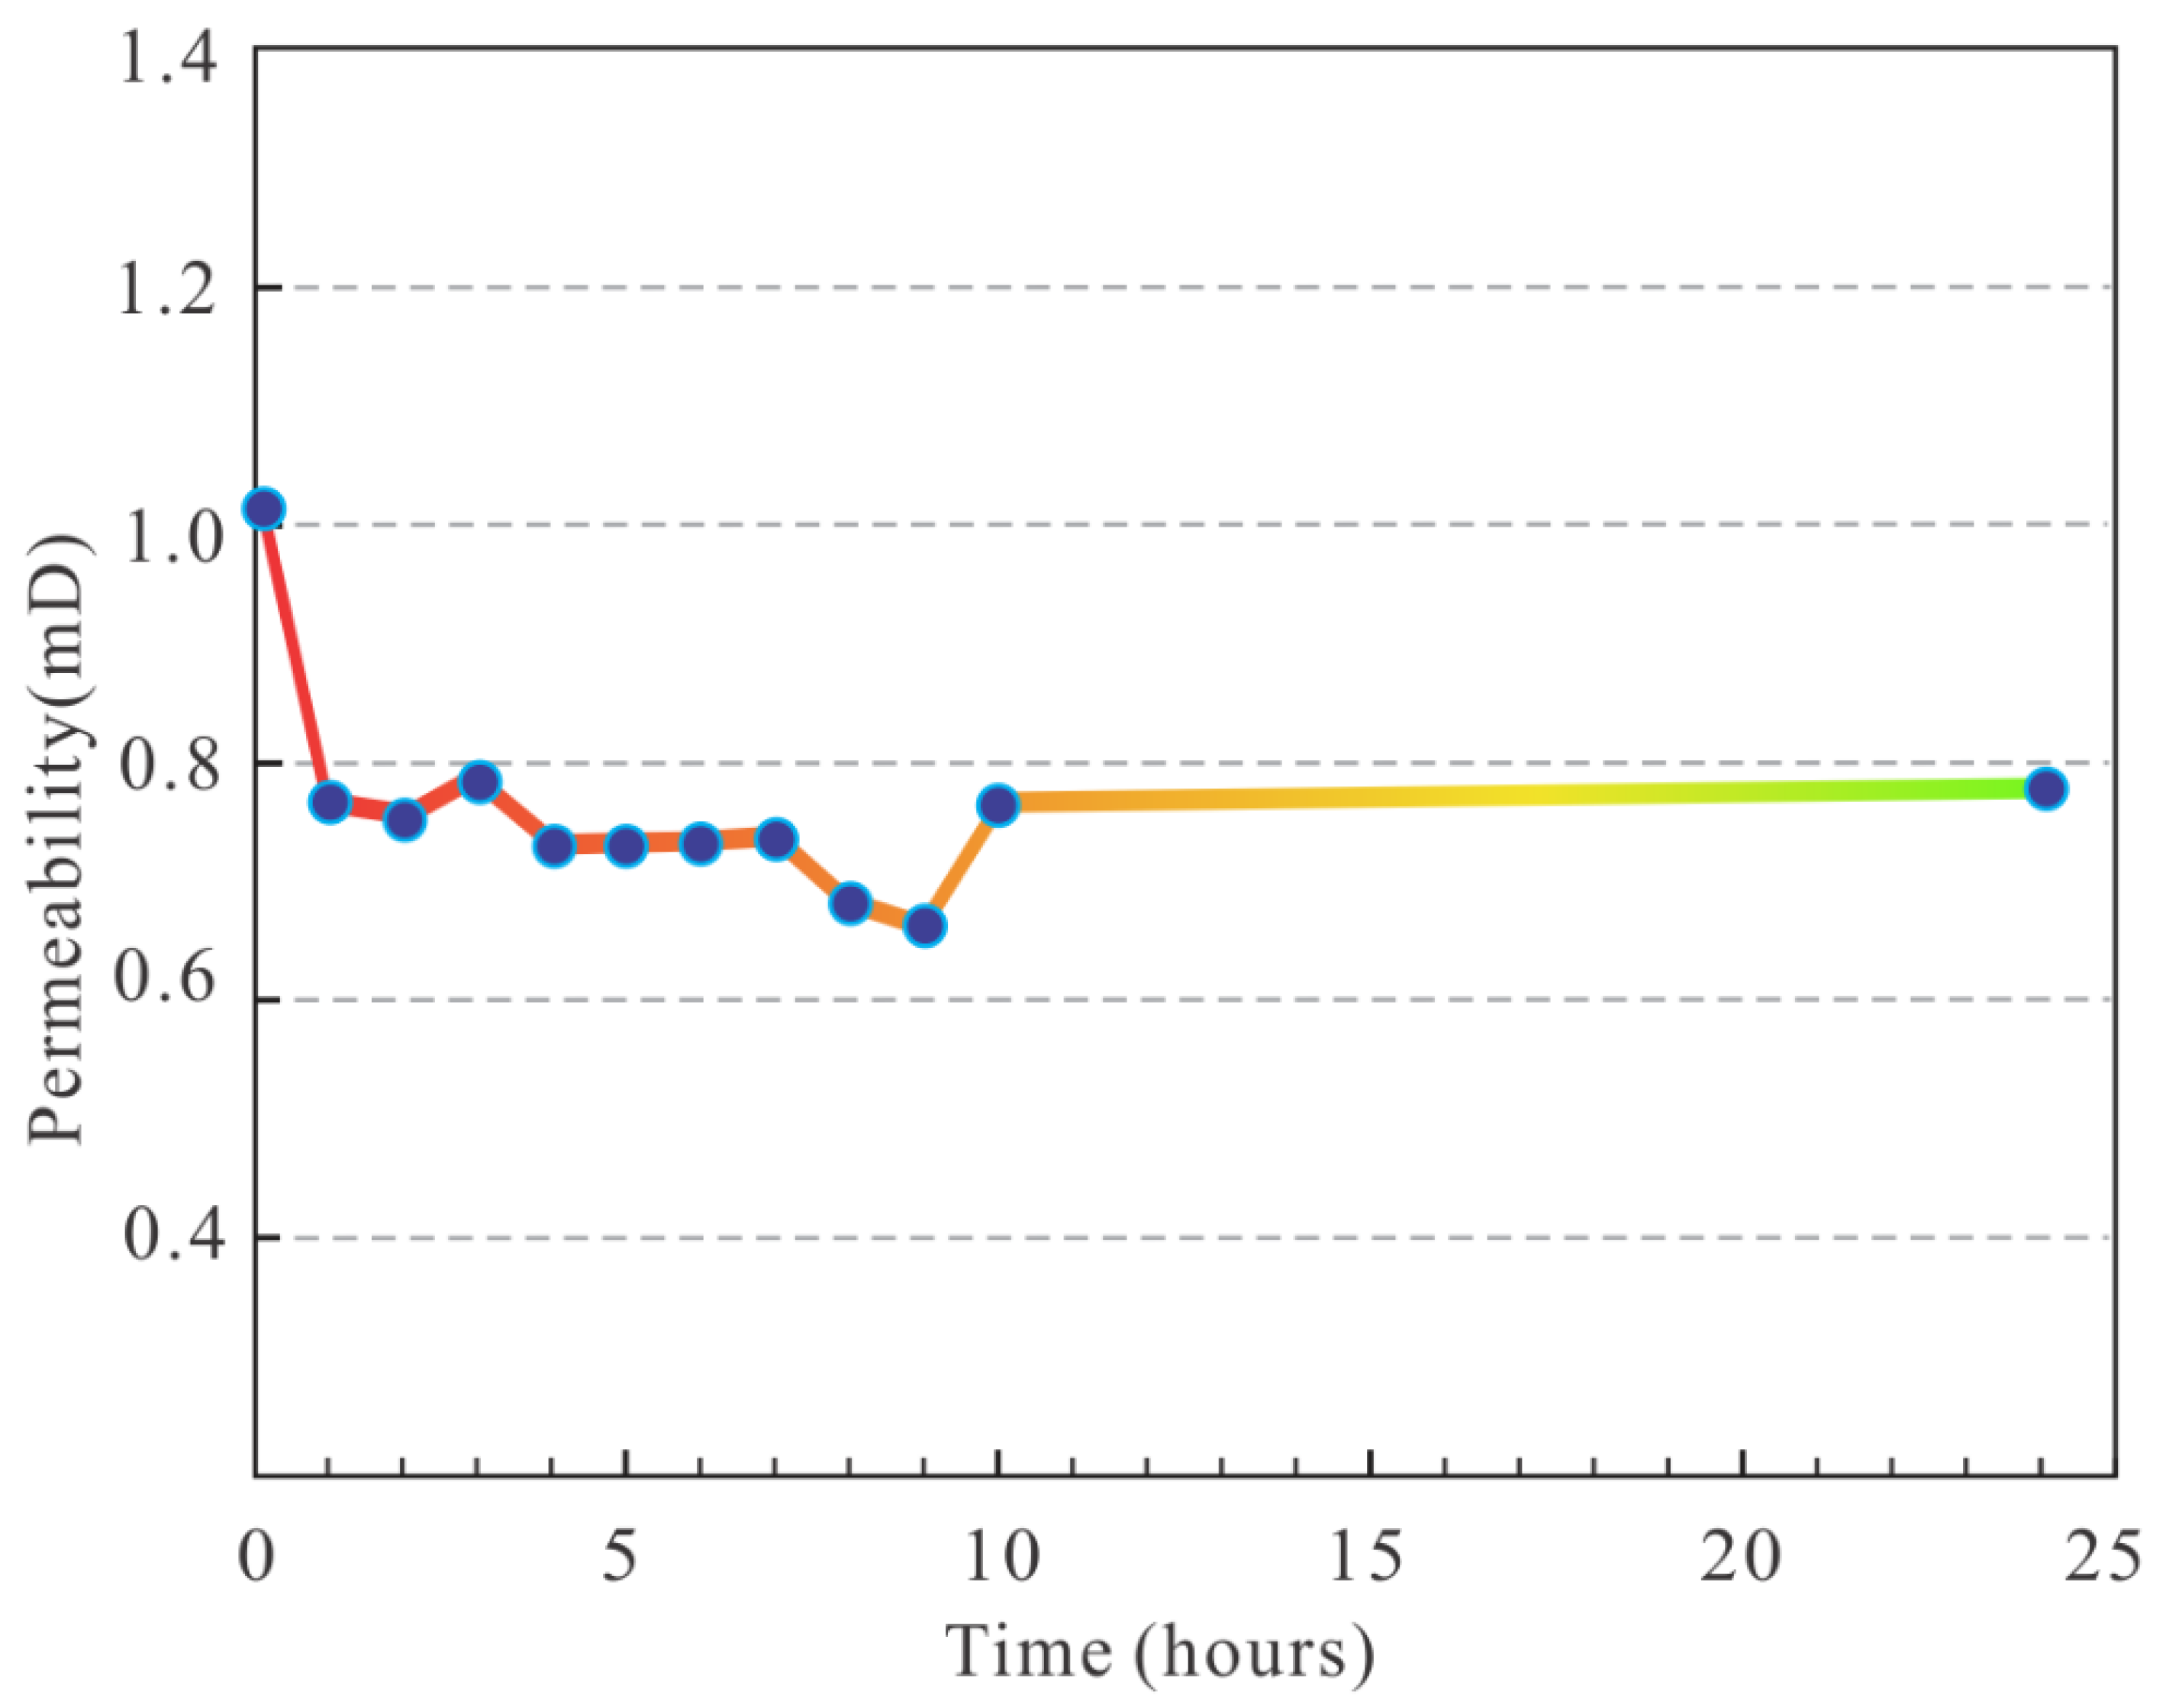
To assess any time influence of confining pressure on the permeability of the samples, Sample 19 was used as a reference. The confining pressure was first increased from 4 to 10 MPa as indicated above and was then kept constant for 24 h. During the first 10 h, the permeability was measured every hour and then again after 24 h. This showed that the permeability decreased by approximately 20% during the first hour but remained more or less constant afterwards (Figure 3), where the slight scattering of data points should relate to analytical uncertainty. Consequently, all samples underwent the same confining pressure sequence and, in particular, were held at 10 MPa for one hour before unloading. It should be noted that any such permeability–time relation will be stress dependent. Higher confining pressures than the ones applied here may yield different creep behavior from the fracture void space, resulting in different time spans to reach a steady state.

3.2. Microstructural Observations

To investigate the correlation between sample microstructure and measured permeability, X-ray computed micro-tomographic (µCT) scans were performed with all shale samples, and Samples 1, 2, and 16 (Figure 1B) were further evaluated as references for three distinct types of fracture microstructure. Sample 1 represents all samples with a low-angle fracture oblique in the cross-section but not connected to the top and bottom sample ends. Sample 2 represents those samples with a high-angle fracture connected to the sample’s top and bottom ends. Finally, Sample 16 represents all other samples with several but mostly isolated low-angle fractures as well as pores.
The µCT scans were performed with a laboratory CT system (GE Phoenix nanotom m 180) dedicated to analyzing small samples at a resolution of 20 µm. The samples were scanned over 360° at an exposure time of 120 ms for each step, yielding 1600 images. A 3D reconstruction of each shale sample was obtained using Avizo Fire 8.1. Subsequently, a quantitative analysis of the pore or micro-fracture lengths and widths was conducted on the rendered volumes in Avizo by assigning different grayscale values to the microstructural features of interest. The pore throat connectivity was qualitatively determined based on the grayscale values of different segmentations [34].

4. Results

4.1. Porosity

The porosity of the shale samples as measured by helium pycnometry is lower than 5%, ranging from 1.3% to 4.2% (Table 1). Although some fractures can be observed in the samples, the porosity is close to that in shale samples without fractures, such as in the BTGC layer, where the porosity ranges from 2.0% to 3.9% at a depth of 1313.8 m to 1321.5 m in well HD-1 [18]. In particular, even though some fractures and pores are apparent in Samples 2 and 16 (Figure 1B), these samples are very dense with porosities lower than 2.0%. The porosity of the sandstone sample (Sample 8) is 13.5% and thus evidently much higher than that of all shale samples.

4.2. Gas and Klinkenberg Permeabilities

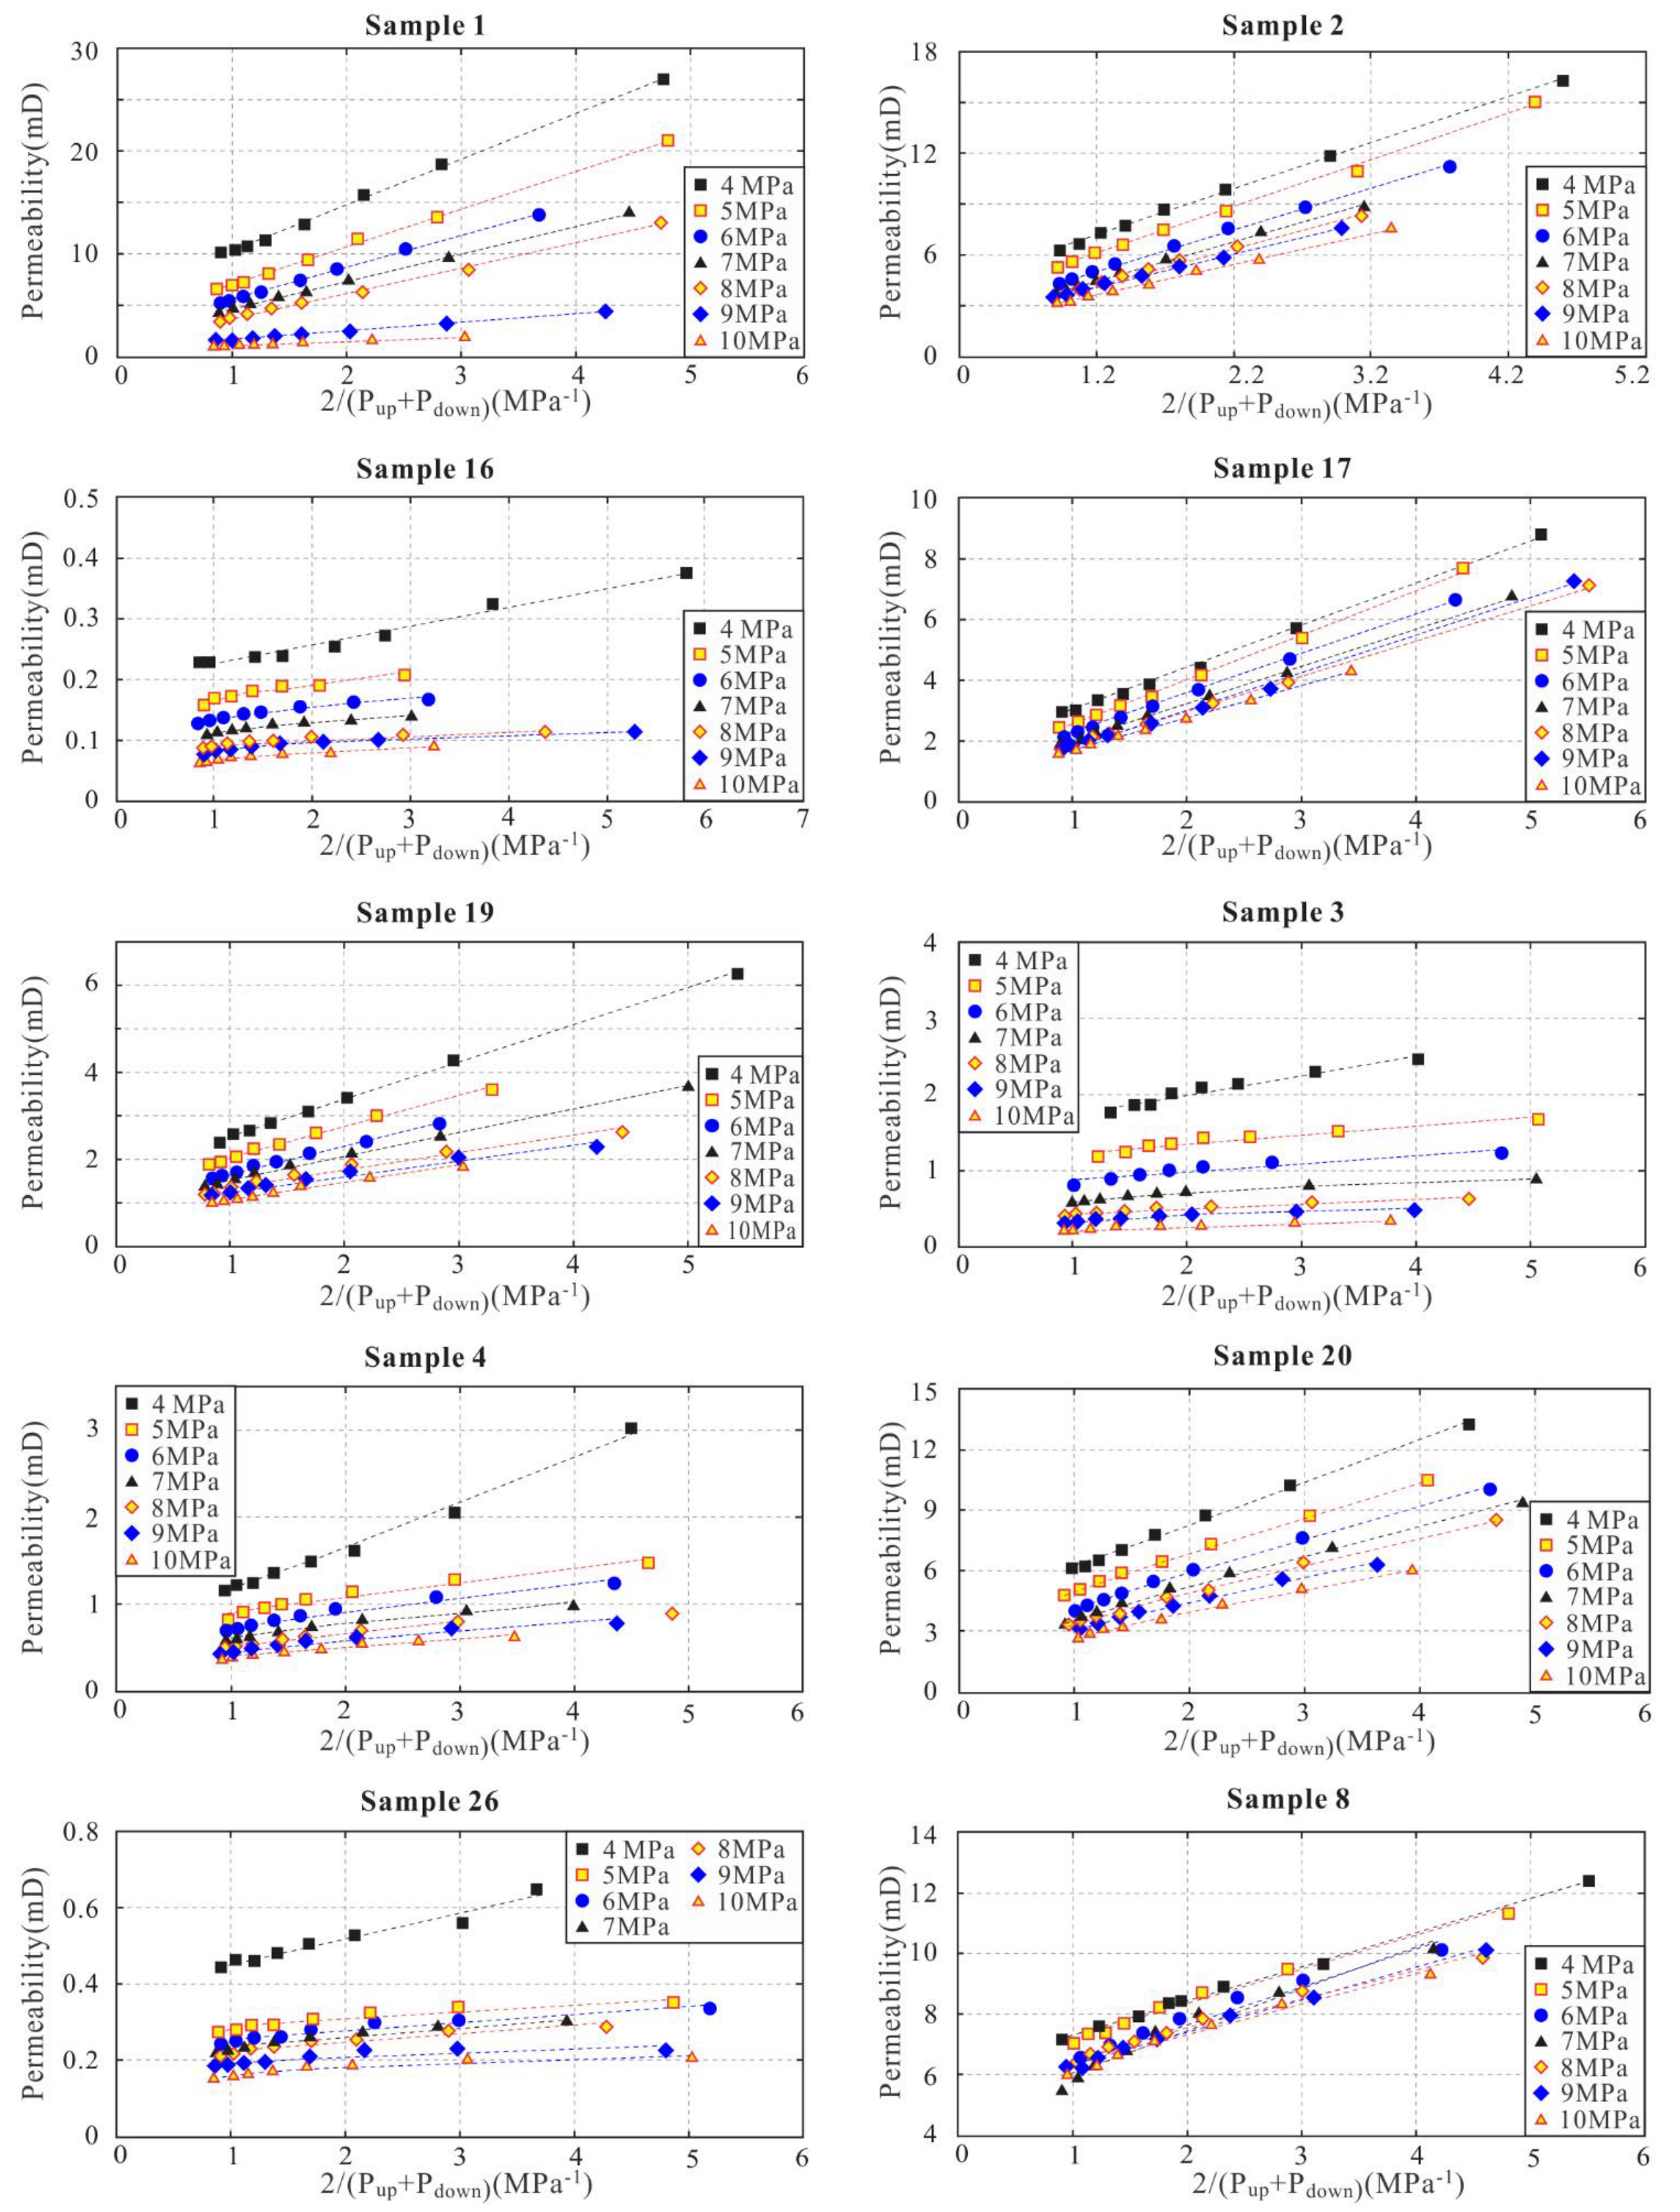
The measured gas permeabilities of the shale samples ranged from 0.064 to 26.9 mD, as documented in Appendix A and shown in Figure 4. Sample 1 contains one diagonally oriented fracture through its entire length yielding the highest permeability of 26.9 mD at a confining pressure of 4 MPa. In contrast, Sample 16 has some pores on one end and some smaller fractures on its other end displaying the lowest measured permeability of 0.064 mD at a confining pressure of 10 MPa. Although some of the micro-fractures in the samples are partially filled by veins, the permeability of the samples with fractures is still higher than that of samples without fractures, such as those measured in the BTGC layer at a depth of 1313.8 m to 1321.5 m in well HD-1 [18].
The Klinkenberg (apparent liquid) permeability of the samples derived from the measured gas permeability and Equation (2) ranges between 0.059 and 5.9 mD (Appendix A), which is obviously lower than the corresponding gas permeability. In particular, the gas permeability is much higher than the corresponding Klinkenberg permeability under both low pore and confining pressure conditions. This indicates that the Klinkenberg effect is obvious in both the tested shale and sandstone samples, which implies that this effect should be considered when evaluating gas flow in shale strata.

4.3. Stress-Dependent Permeability

The laminar siliceous shales in the Wufeng Formation are characterized by a shear strength of 33.6–46.9 MPa, a compressive strength of 90.0–137.0 MPa, and a Young’s modulus of 17.9–35.0 GPa at confining pressures ranging from 0 to 25 MPa [35,36]. As the present tests were performed under comparatively low hydrostatic pressure conditions and also in the absence of deviatoric stresses, it is reasonable to assume that no additional cracks or fractures were formed in the rock samples during the experiments.
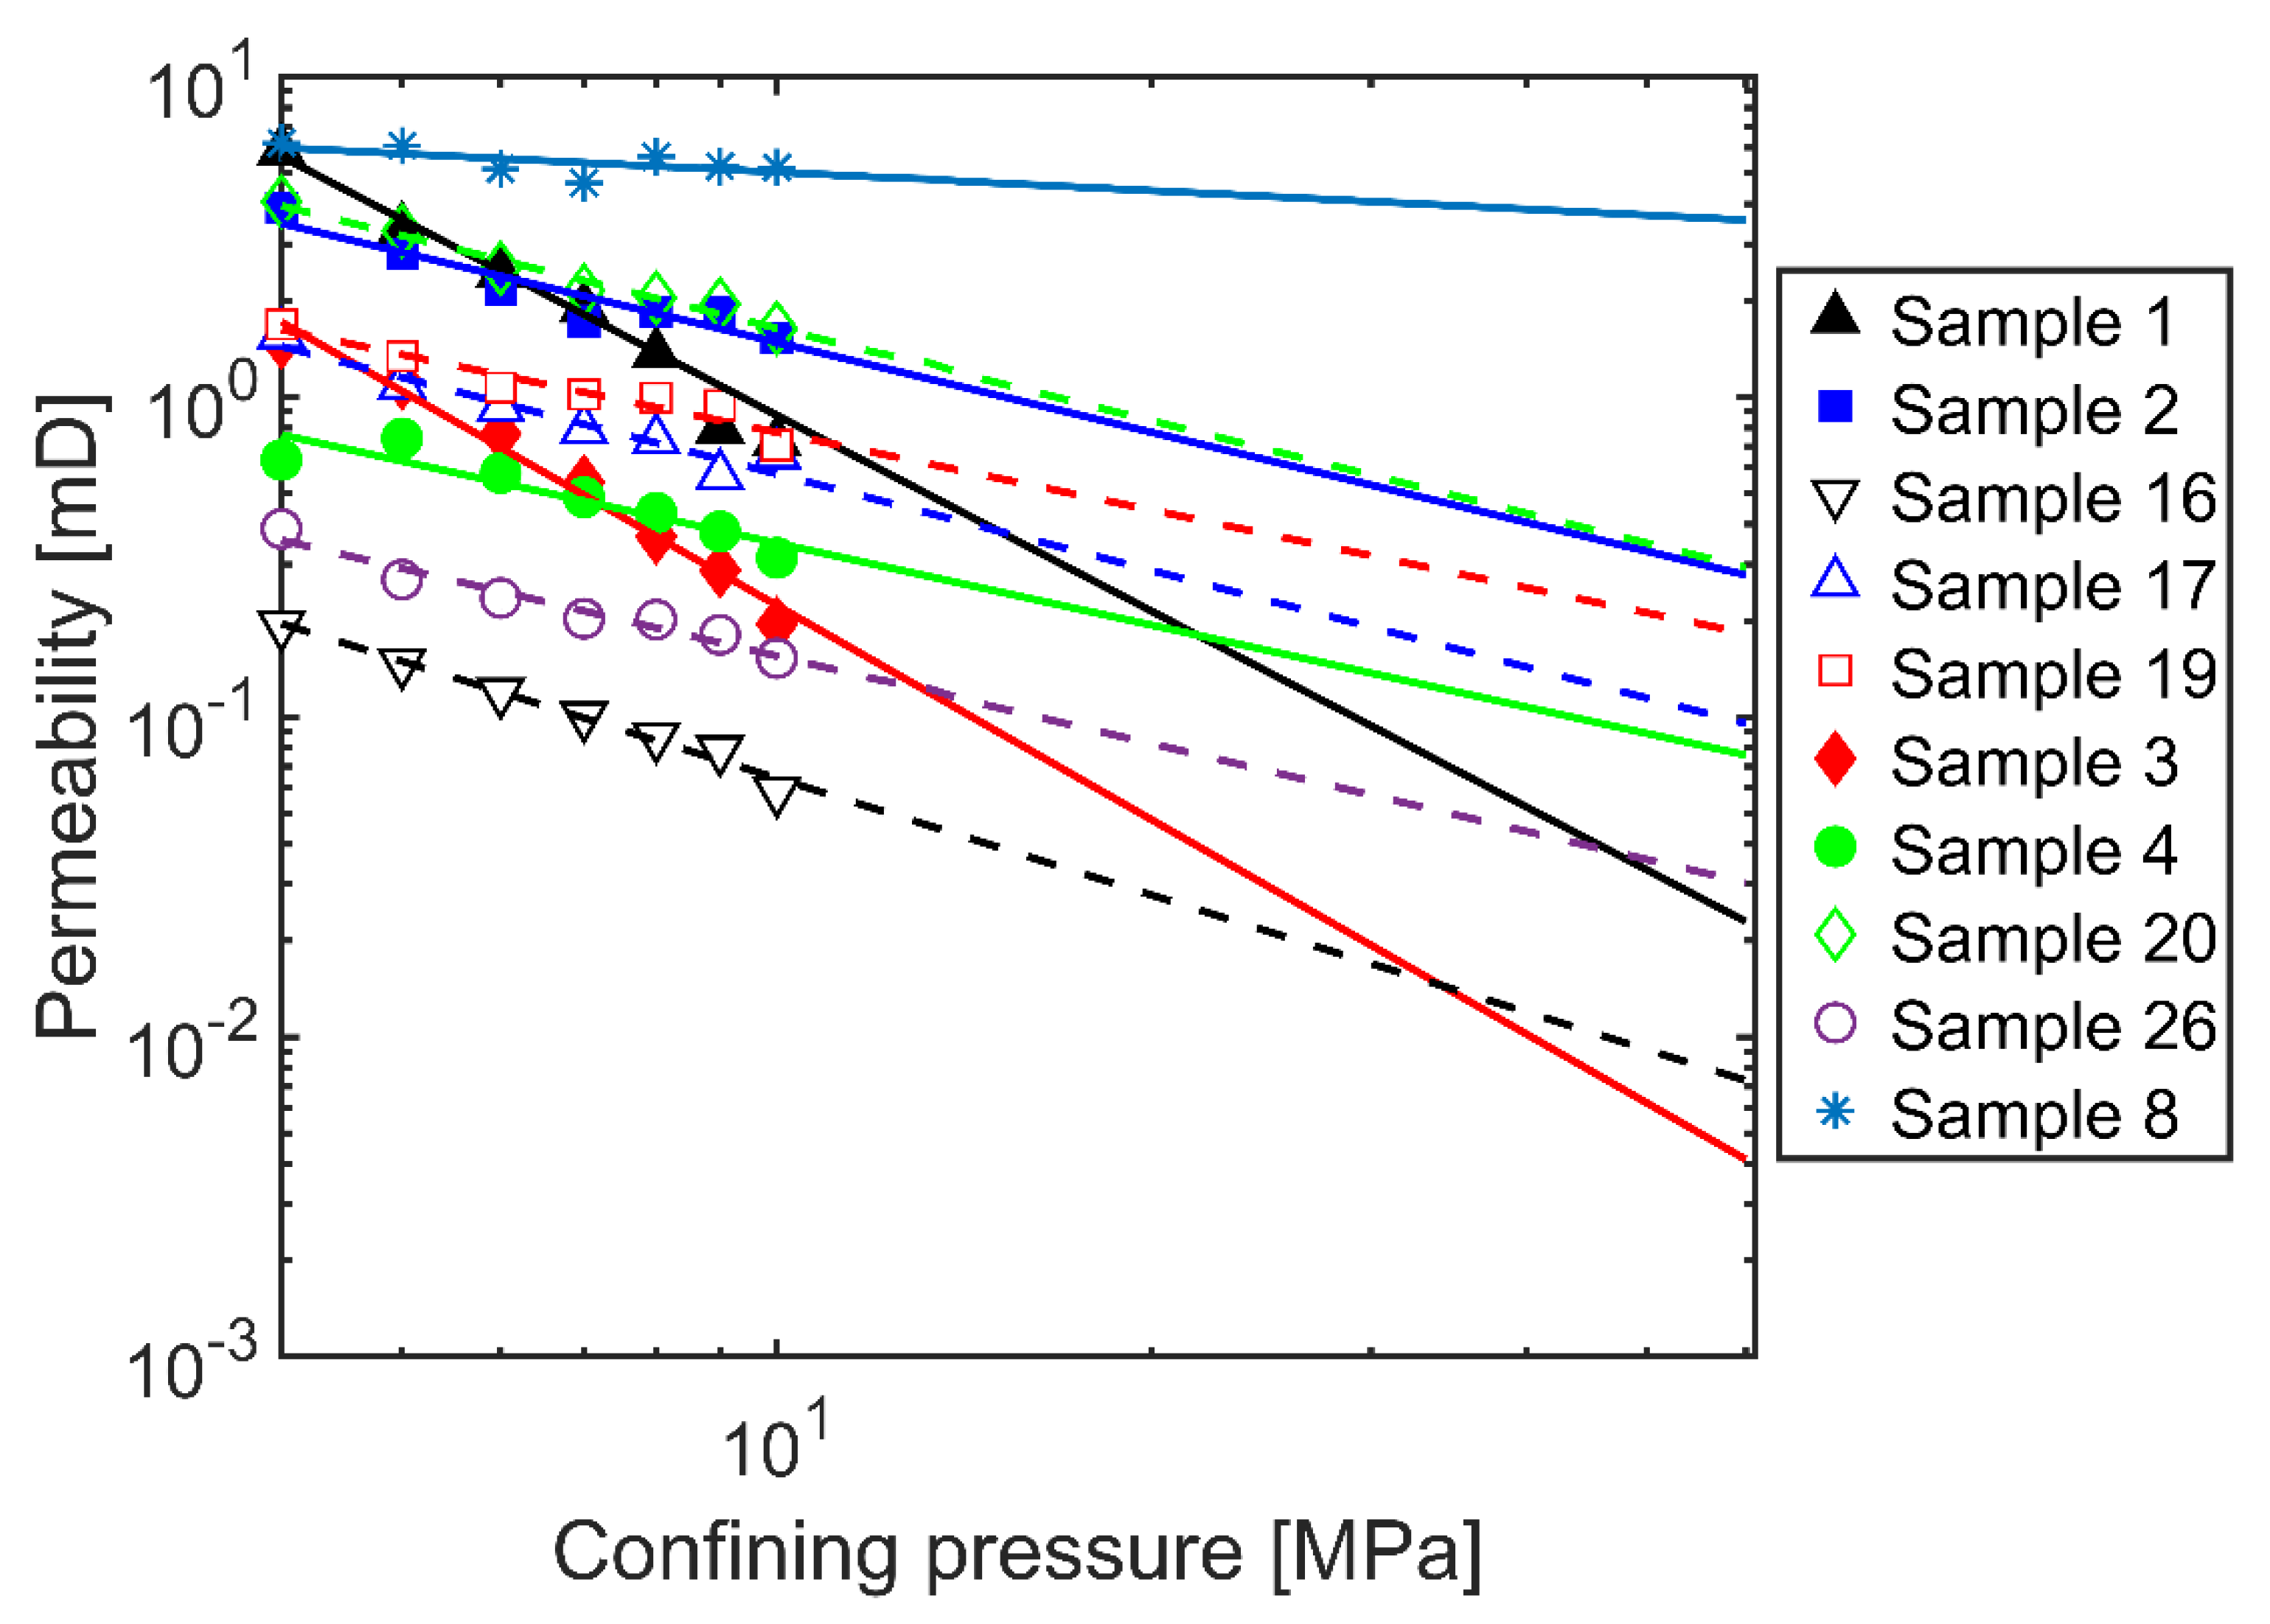
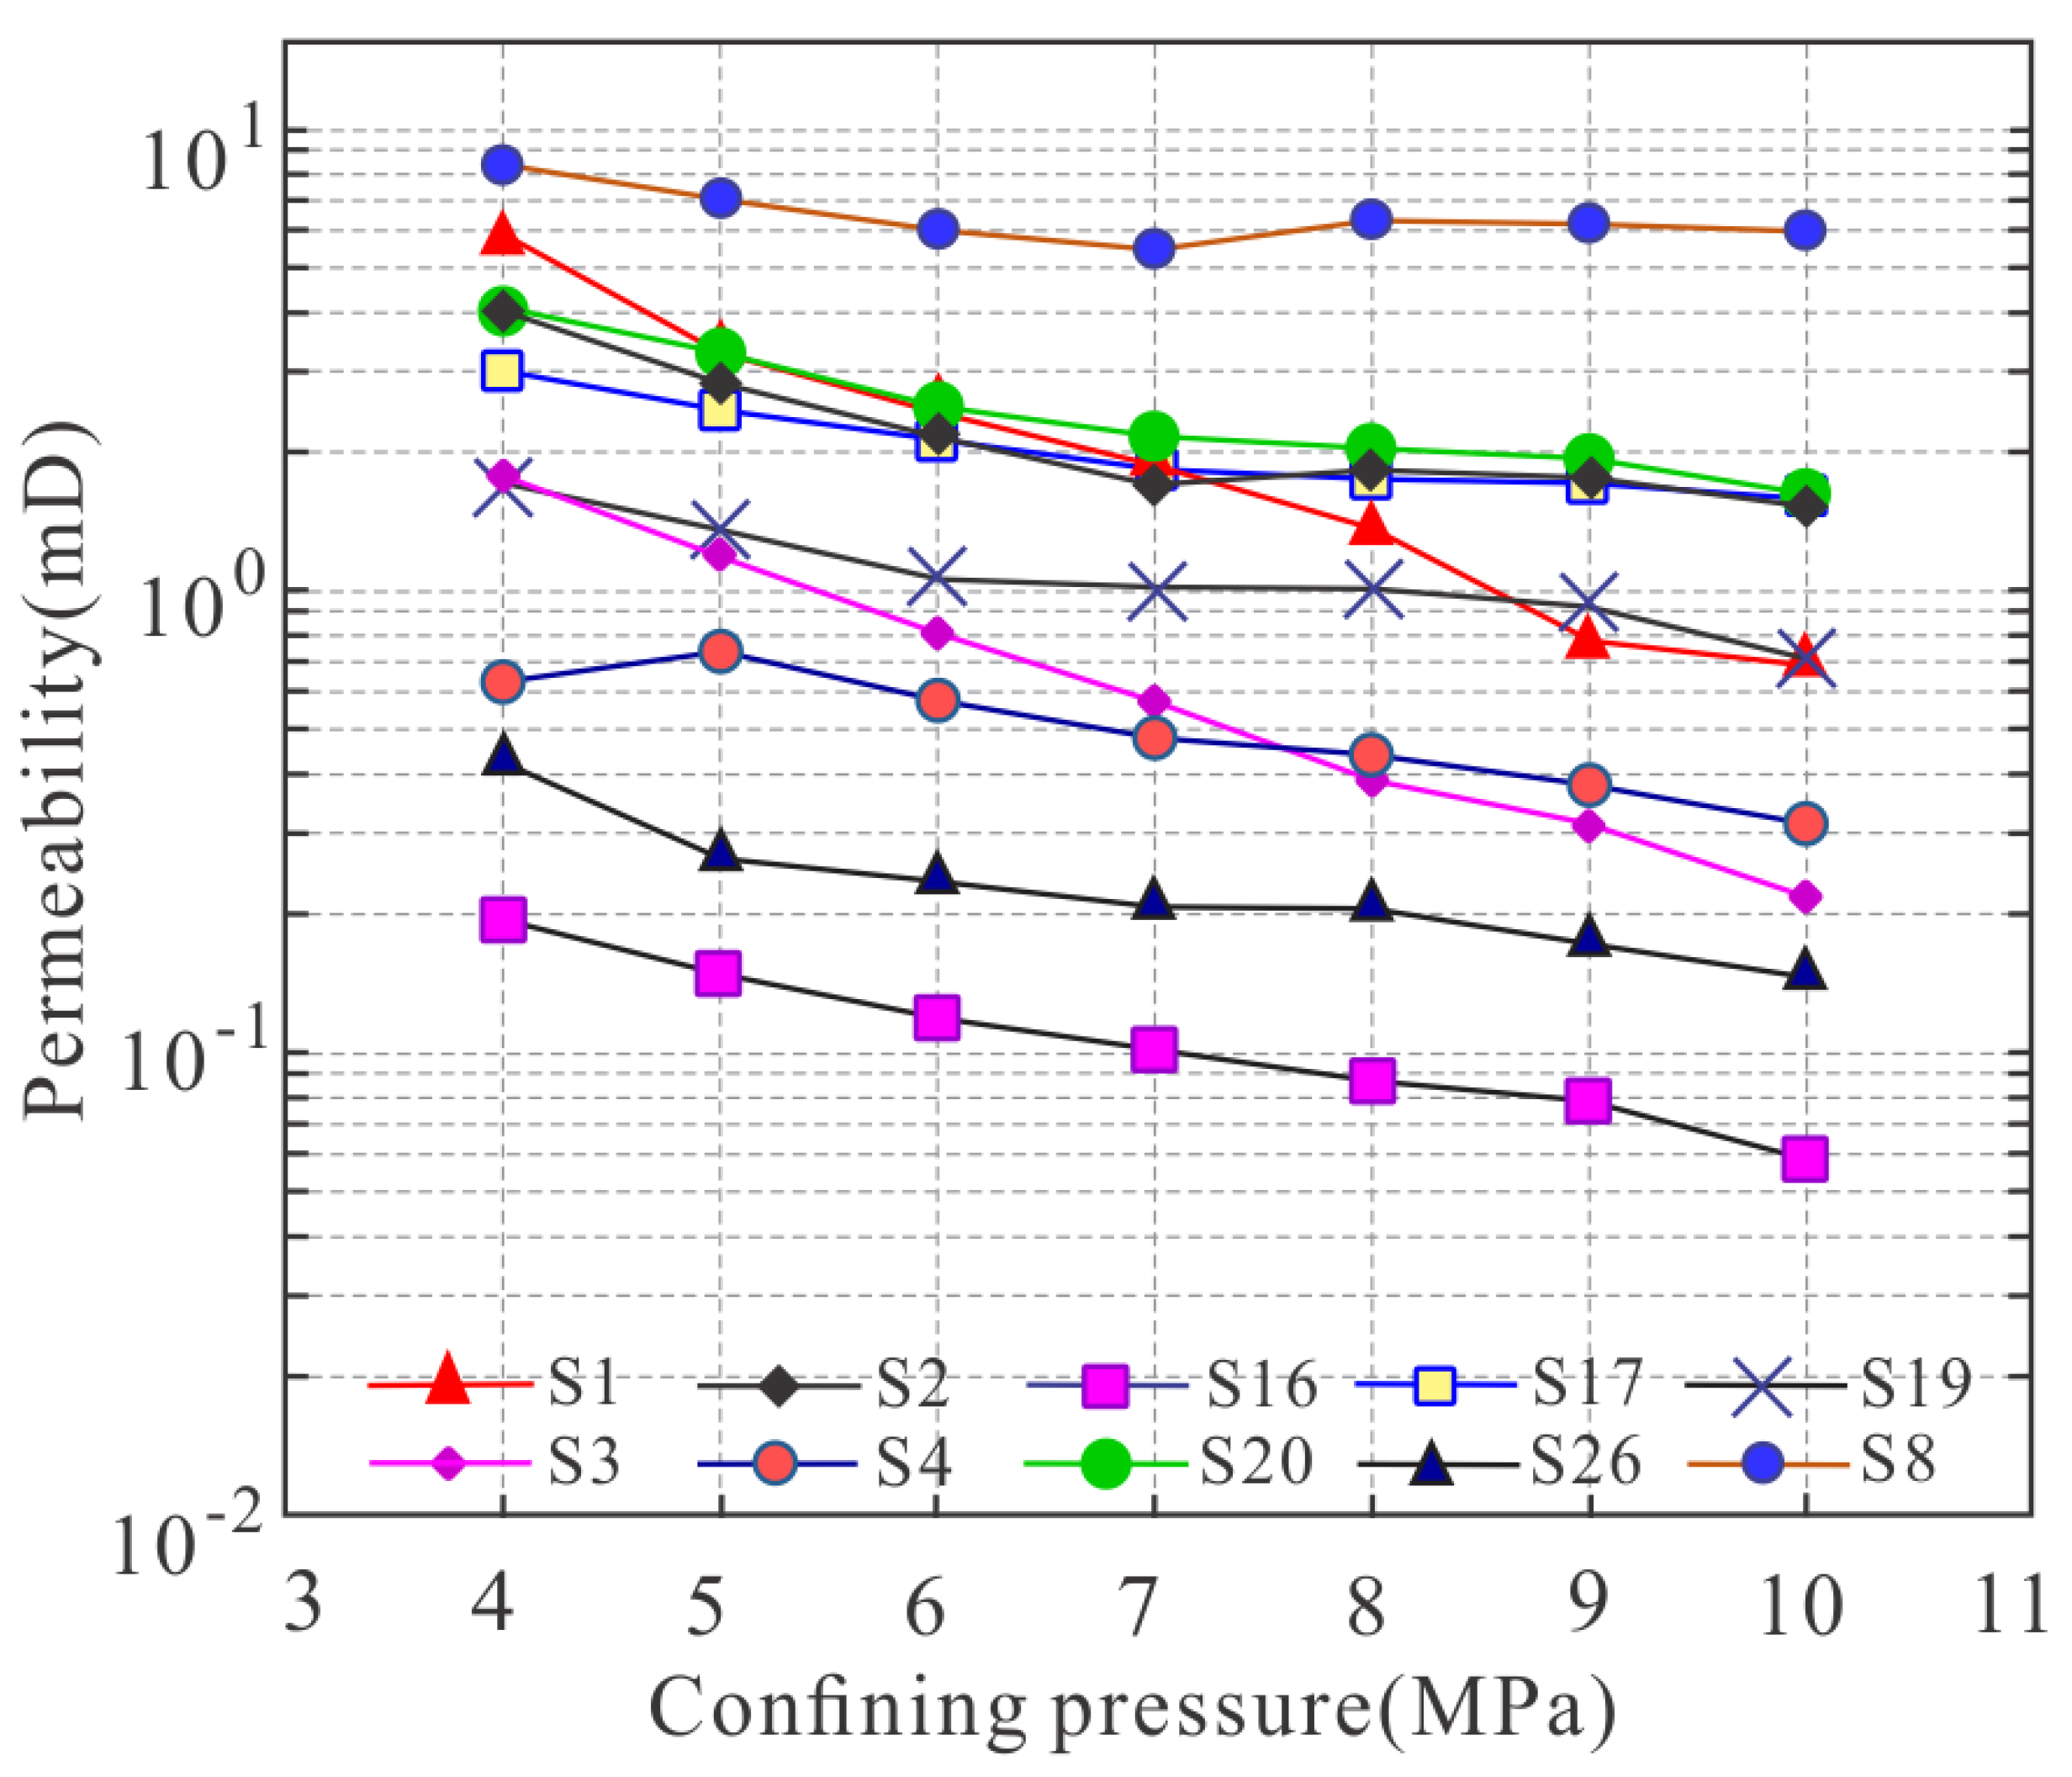
Although the pore microstructure of the rock is rather stable at lower pore and confining pressures, the micro-fracture apertures may be very sensitive to pressure changes. Hence, the stress sensitivity of the fractures dominates the stress-dependent permeability of the samples. The results show that the permeability of the micro-fractured shale samples decreases by at least 50% as the confining pressure is increased from 4 to 10 MPa (Figure 5; Table 2). In contrast, the permeability of the porous sandstone sample (Sample 8) containing no apparent sample scale fractures decreases by only 16% in the same confining pressure range. However, at lower confining pressures up to approximately 7 MPa the trend in the permeability decrease is similar to the one for the shale samples. This points to the existence of grain-scale microcracks in this rock that readily close at low confining pressures, after which the permeability decrease is controlled by the compression of the rounded pores. Any possible non-monotonic trend in the graphs in Figure 5 reflects analytical scattering.
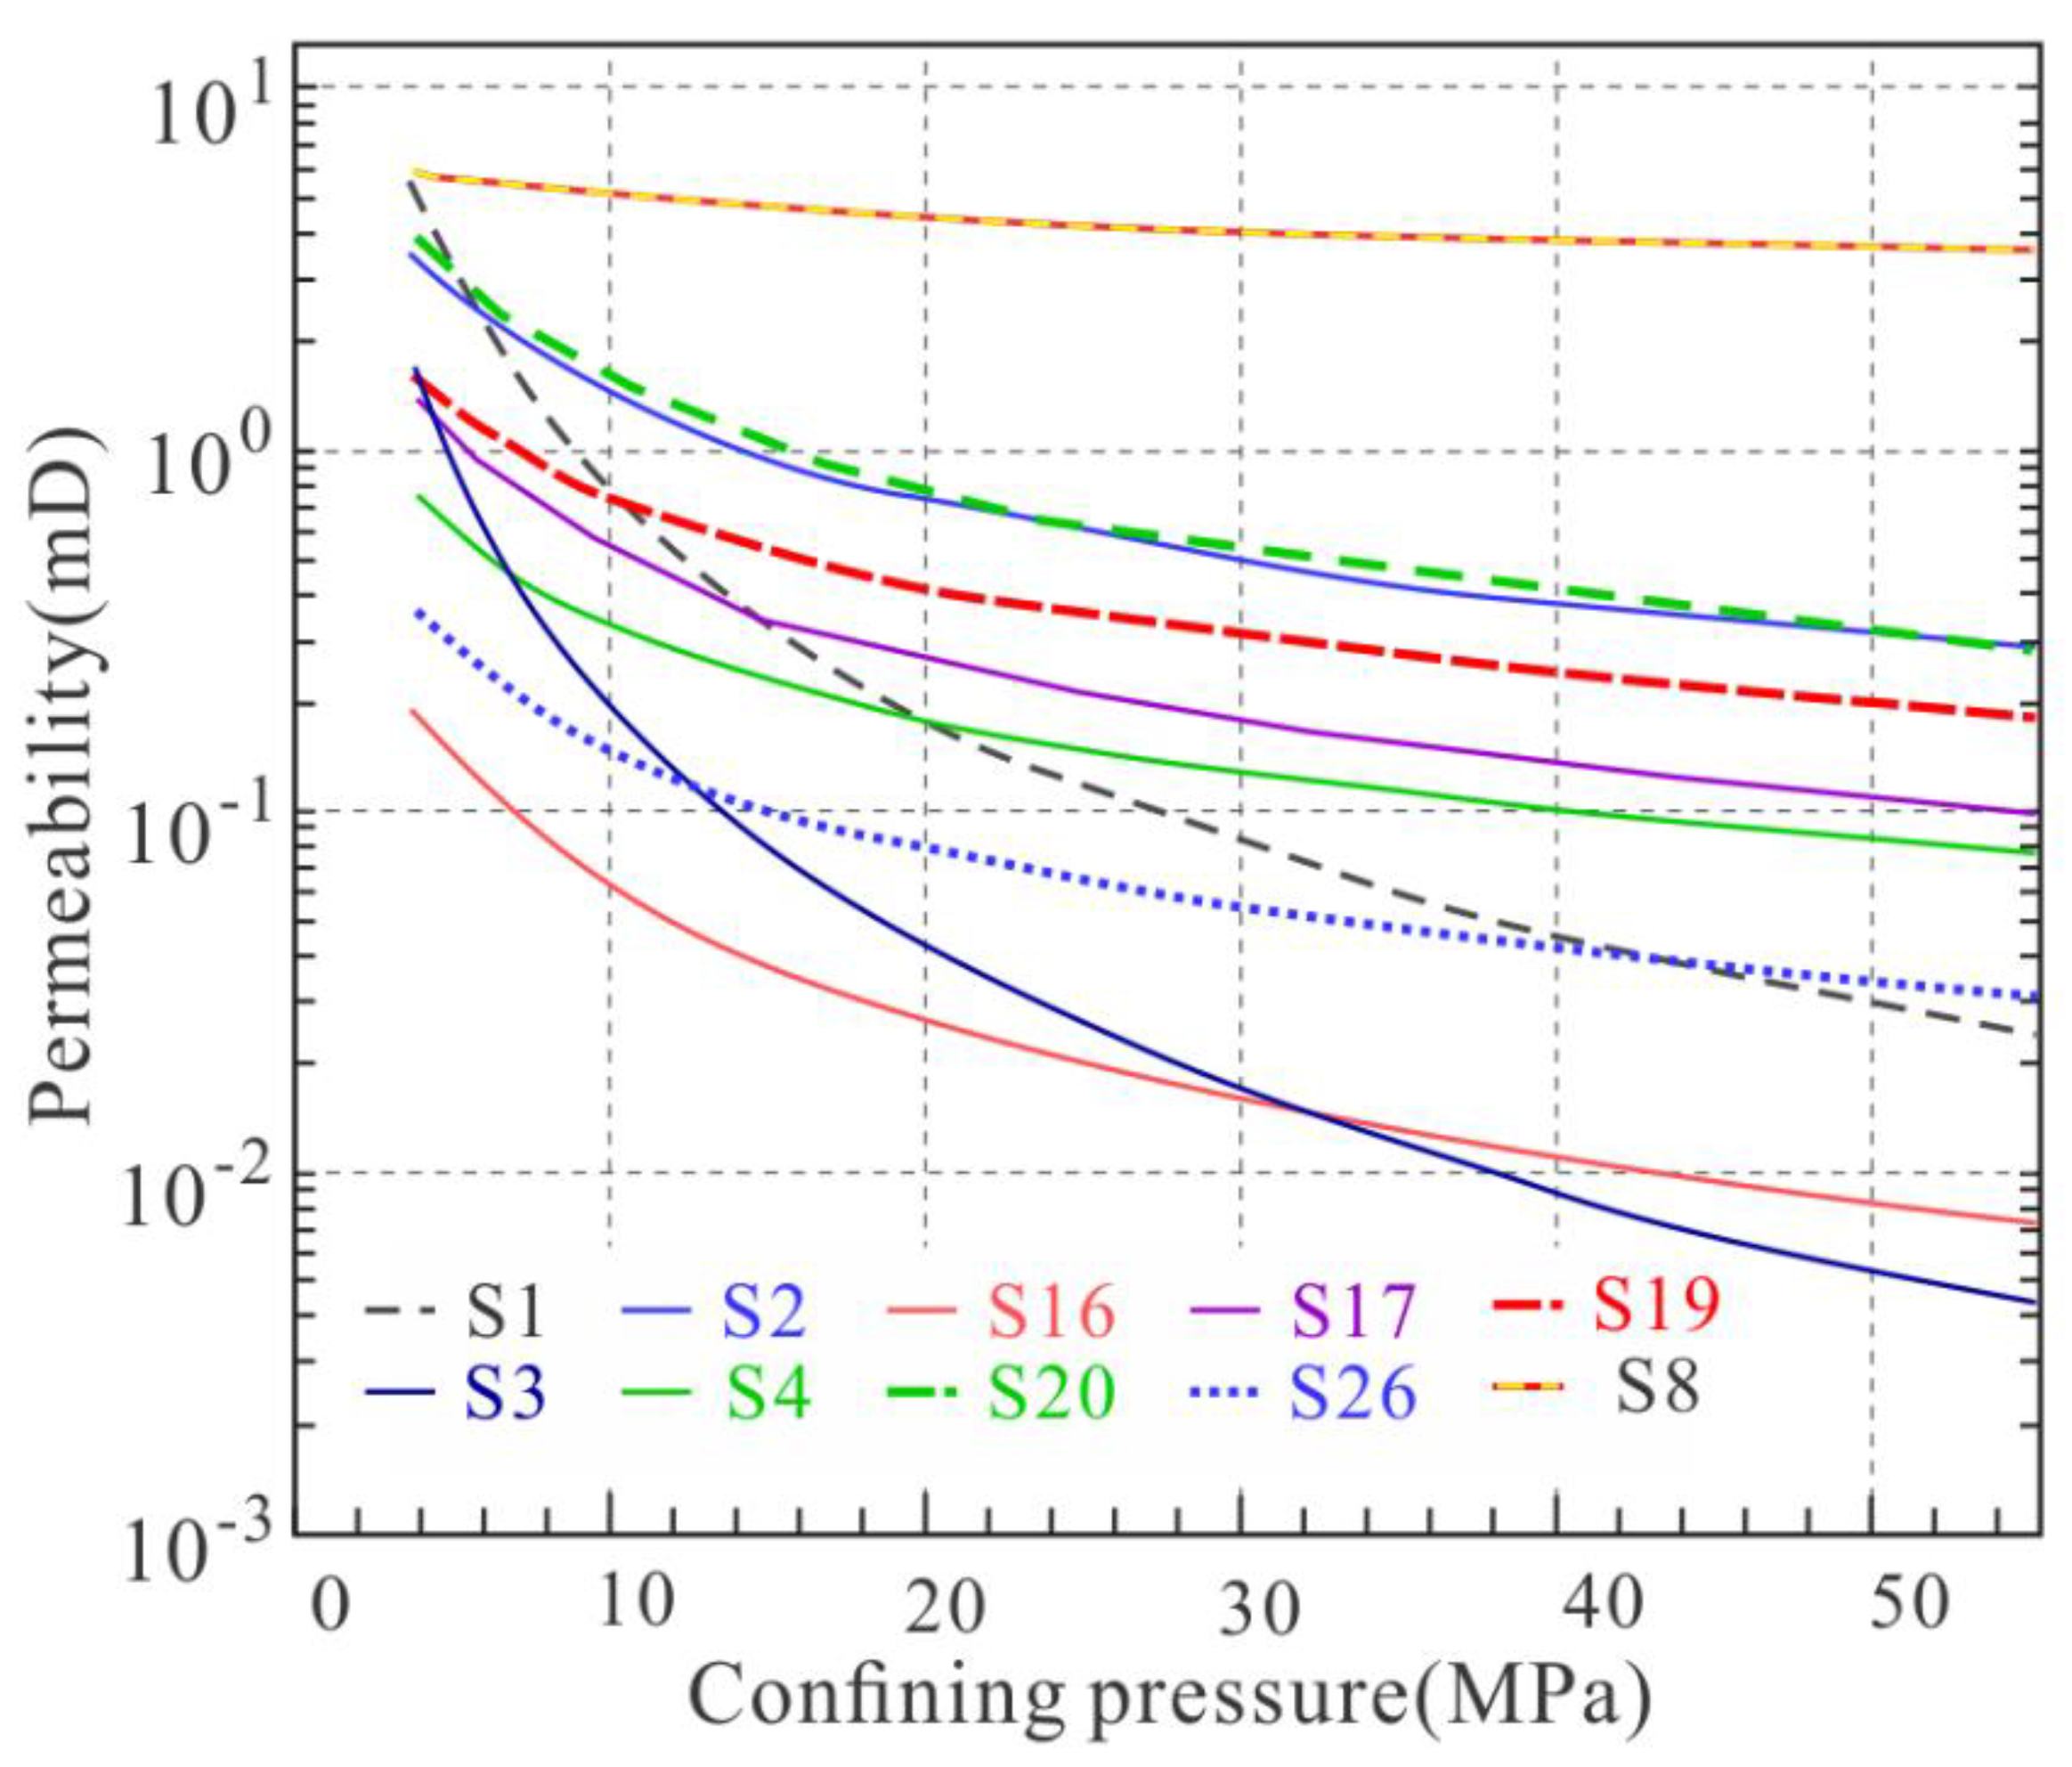
To further investigate the confining pressure dependence of permeability on reservoir conditions, the sample-dependent data-based functional relationships between permeability and confining pressure were empirically extrapolated from 10 to 60 MPa using power functions (Figure 6; Table 2; Appendix B). Although the maximum lithostatic pressure at the site of well HD-1 is only approximately 35 MPa, the choice of a higher extrapolation pressure is motivated by the fact that the studied reservoir layer in the Wufeng Formation is stable over the Middle–Upper Yangtze and its burial history can extend to formation pressures as high as 60 MPa, such as those evidenced in well L203 in Luzhou City, Sichuan Province, China.
As a result, the sample permeability decreases by more than 80% when the confining pressure increases from 4 to 35 MPa. In particular, the pre-existing micro-fractures likely tend to close in Sample 3, where the permeability is predicted to decrease by 99%. However, the permeability of the sandstone sample (Sample 8) would only decrease by 36.3%, again indicating a high confining pressure sensitivity of the micro-fractured shale samples. When the confining pressure further increases from 35 to 60 MPa, the permeability would decrease by about another 0.6% to 7.0% relative to the permeability at a confining pressure of 4 MPa. Overall, this indicates a decrease in the pressure sensitivity of the permeability with an increase in the confining pressure, being very obvious at pressures below approximately 16 MPa.
In Appendix B, the data displayed in Figure 6 are plotted again on a log-log scale, yielding a linear dependency (Figure A1). In addition, the experimental data are shown in this figure, evidencing the reasonable quality of the correlations. Moreover, we tested whether power functions would fit the data better than exponential ones (e.g., [37,38]). This indeed proved to be the case for all but two samples, although it should be mentioned that the differences in the respective correlation coefficients (R2) are small.
It is evident that the accuracy of the extrapolated permeability values using power functions can only be evaluated by actually performing measurements. This was not possible in the present case. However, the correlation coefficient in the explored pressure range is larger than 0.9, which suggests that the extrapolated values are reasonable. Moreover, the permeability of the micro-fractured rock is controlled by the dominant fracture orientation relative to the stress field within the reservoir and the mechanical properties of the (usually stronger) upper and lower strata. Under hydrostatic stress conditions, as in the present experiments, the measured permeability values will likely be lower compared with the ones to be expected in situ.

4.4. Reversibility of Permeability upon Unloading

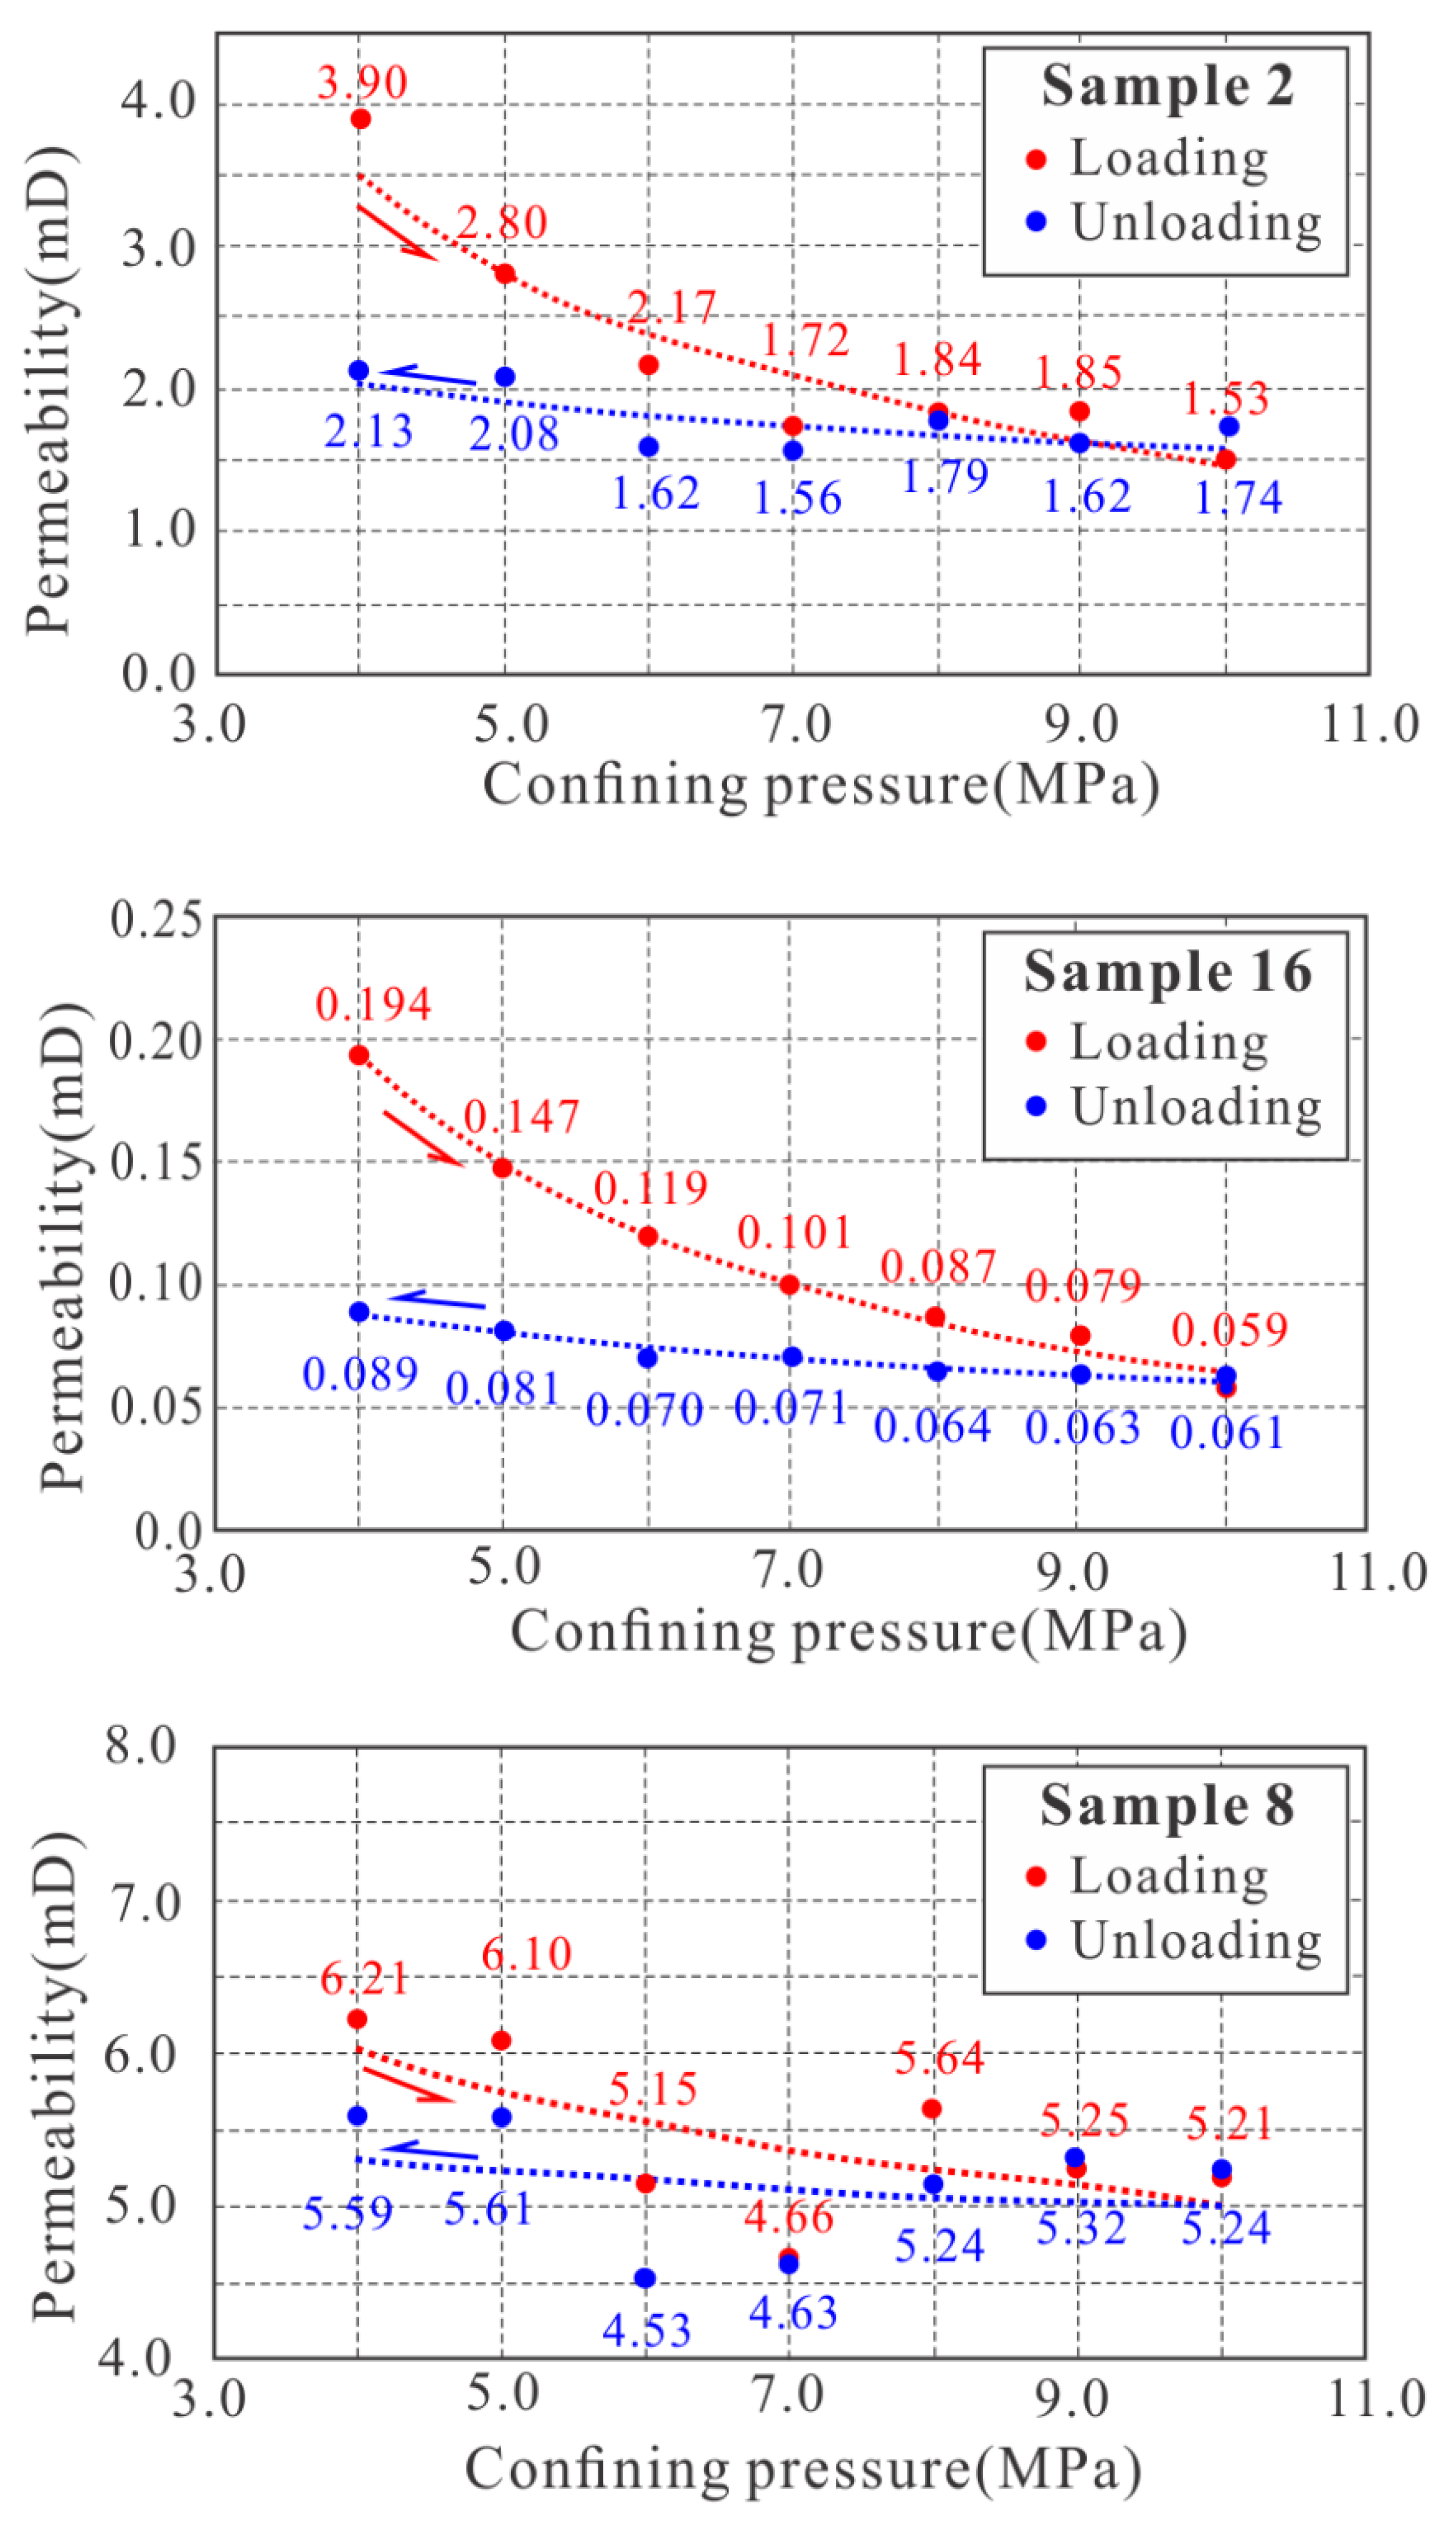
Sample 2 (Figure 7) represents a micro-fractured shale sample of comparatively high permeability. When the confining pressure is increased from 4 to 10 MPa, the permeability gradually decreases from 3.9 to 1.5 mD, i.e., by about 61%. Maintaining the confining pressure constant at 10 MPa for one hour (Section 3.1) yields no resolvable permeability change within the resolution limits. When the confining pressure is decreased from 10 to 4 MPa, the permeability is only recovered to approximately 50% of its starting value. Such hysteretic behavior has also been observed for other types of rock (e.g., crystalline rock [39]). The same trend, both qualitatively and quantitatively, also applies to Sample 16 (Figure 7), representing a micro-fractured shale sample of comparatively low permeability. The permeability hysteresis is less pronounced for the porous and unfractured sandstone sample (Sample 8; Figure 7), and the recovery deficit is only about 10%. Overall, this indicates partially irreversible permeability damage during loading–unloading sequences that can be rather substantial when micro-fractures are present in the rock as compared with a purely porous one.

5. Discussion

5.1. Stress Sensitivity of the Micro-Fractures

As was shown in Section 4.3, the stress sensitivity of permeability differs between samples. In Figure 8, µCT images of three selected samples are shown, i.e., Sample 1 (Figure 8A), Sample 2 (Figure 8B), and Sample 16 (Figure 8C). The fracture distribution and orientation in all other shale samples can be associated with one of the following three categories. Sample 1 (similarly, Sample 3) displays a diagonal fracture, which was found to be the most stress-sensitive fracture type. Here, a permeability decrease by 88% was observed as the confining pressure was increased from 4 to 10 MPa, indicating that at 10 MPa, this fracture likely was closed (Figure 8A). Although the permeability of Sample 2 at a confining pressure of 4 MPa was only about 66.5% of that of Sample 1, it was more than two times higher than that of Sample 1 at a confining pressure of 10 MPa. Thus, when the confining pressure was increased from 4 to 10 MPa, the permeability decrease was lower than 60% in Sample 2, which is characterized by a fracture that connects both sample ends and is oriented subparallel to its axis (Figure 8B). A similar fracture geometry can be found in Samples 4, 19, 20, and 26. In this type of fracture, an elevation of pore pressure may partly counterbalance the effect of confining pressure, reducing the overall stress sensitivity.
In some of the shale samples (i.e., Sample 16 (Figure 8C) and Sample 17), there are several micro-fractures, which, however, are only partly connected to the sample ends. The fluid flow here occurs along both fractures and connected pores between them. This sample microstructure constitutes an intermediate case in permeability stress sensitivity (Table 2), where connected micro-fractures tend to partly close as the confining pressure is increased.
It can be concluded that all fracture types found in the present shale samples are sensitive to changes in stress but to different degrees (Table 2). In the case where single fractures are roughly oriented along the flow direction, their stress sensitivity is the lowest. In contrast, when single fractures are oriented obliquely to the flow direction, their stress sensitivity is very pronounced. The reason for this may be that these fractures indeed connect the sample ends but only partly or weakly (Figure 8A), where increasing the confining pressure more readily cuts off the dominant flow path. An intermediate case of stress sensitivity exists where multiple micro-fractures of random orientation are connected to form flow paths.
When comparing the three microstructure categories with the empirical exponents in the power law functions listed in Appendix B, one notices a rough correlation. Sample 1-type specimens show exponents around 2.1, Sample 2-type ones have exponents around 0.9, and Sample 16-type specimens yield exponents of about 1.1. This implies that, despite the empiricism, the exponents may have some physical meaning regarding the microstructure–stress sensitivity correlations of the samples. Given the weak statistical significance of the number of samples, this will, however, require further emphasis in future studies.

5.2. Implications for Fractured Shale Formations

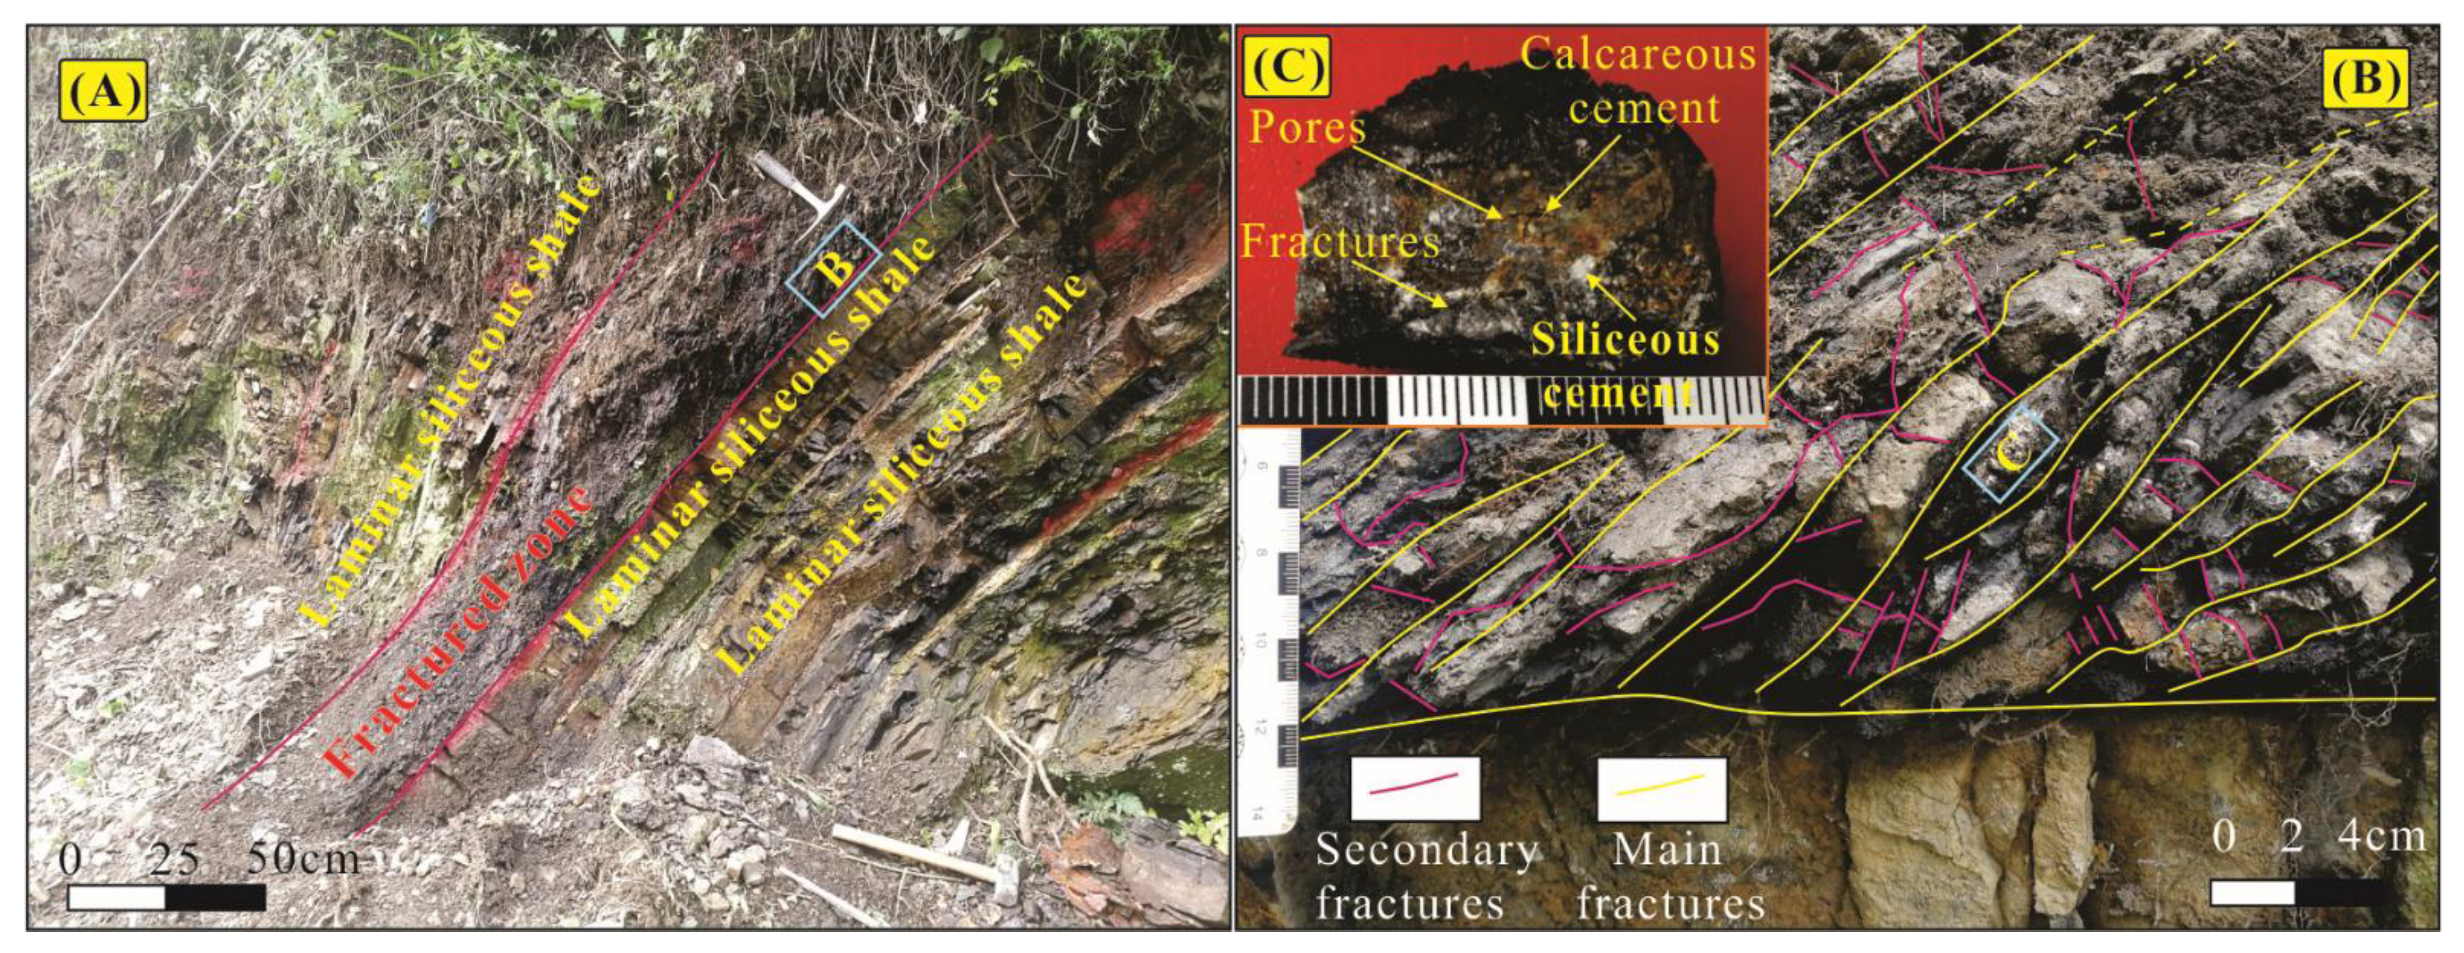
In outcrops of the Wufeng Formation, the damage or fracture zone is mainly composed of fault breccia and fault gouge (Figure 9A). Obviously, the fracture density in this zone is higher than in the adjacent layers, and, in contrast to the main fractures, the orientation of secondary fractures is rather random (Figure 9B). As mentioned before (Section 1), the fracture zone was formed by shear stress where the shear displacement decreases from the limb to the core of the fold. Fractures are mainly oriented obliquely with respect to the upper and lower layers in the limb of the fold, whereas their orientation is mainly perpendicular in the core of the fold. A few fractures and pores can also be observed in the fault breccia (Figure 9C), indicating that flow paths exist at multiple scales within the fracture zone, where calcareous and siliceous cements are indicative of previous water flow.
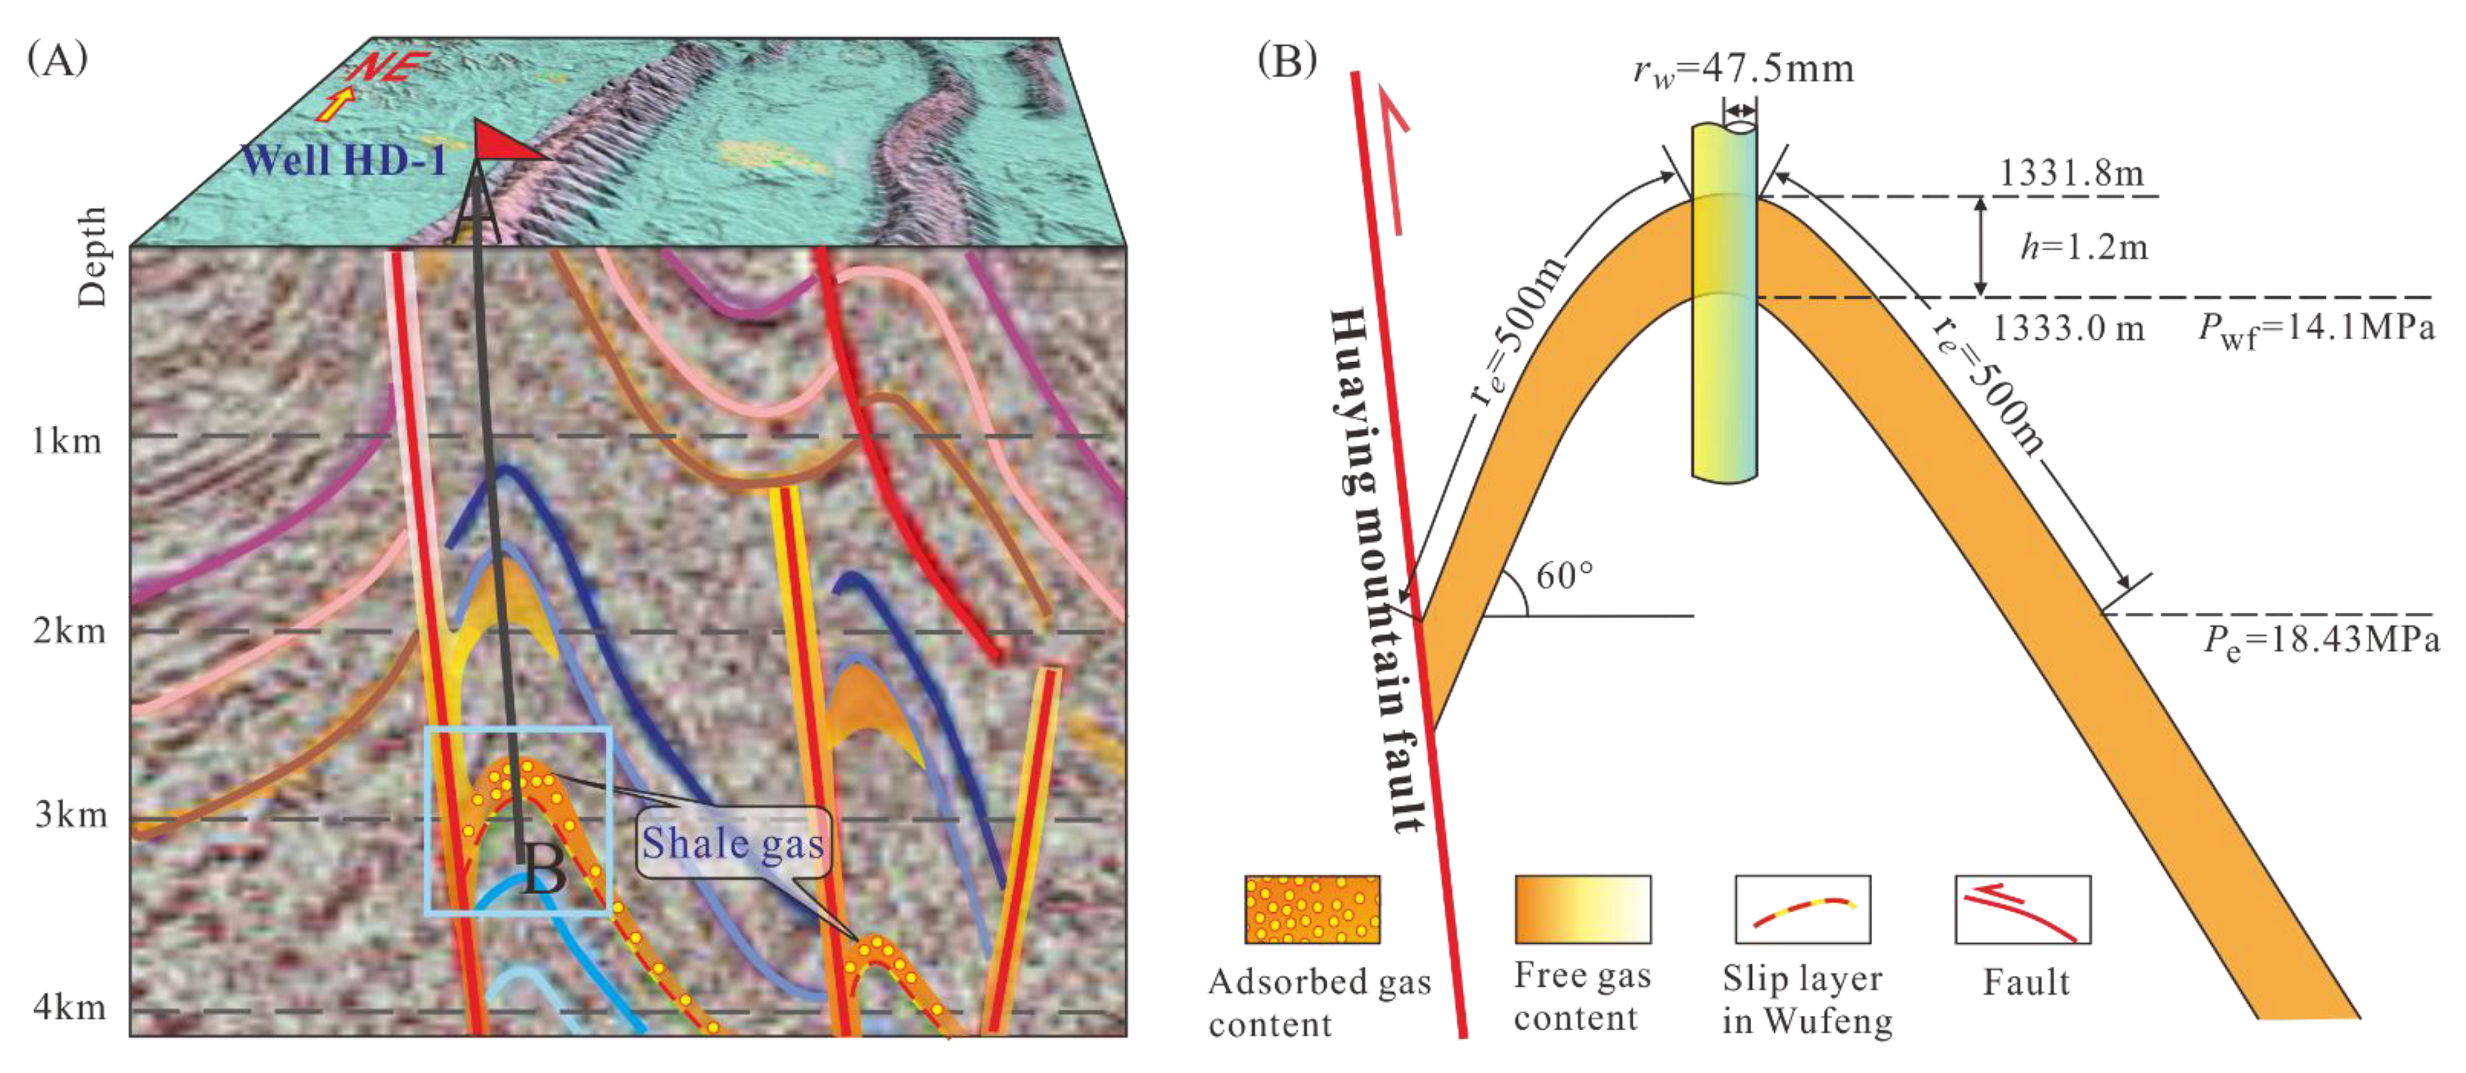
To evaluate potential differences between the present experimental results and the in situ reservoir properties, we derived the permeability k of the main production (MP) layer in well HD-1 based on its productivity using the empirical correlation [40]:
k = q sc T μ Z ln 0.472 r e r w 774.6 h   ( P e 2 P wf 2 ) ,
where qsc is the volume of gas produced daily at the wellhead under the standard atmospheric pressure (m3/d), T is the absolute temperature of the production layer (K), k is the permeability of the stratum (10−3 μm2), μ is the viscosity of the gas (µPa·s), Pwf is the fluid pressure at the bottom of the well (MPa), Pe is the fluid pressure at the edge of the stratum (MPa), h is the thickness of the stratum (m), re is the drainage radius of the well (m), rw is the radius of the borehole (m), and Z is the natural gas deviation coefficient, where Z is 0.94 in the northeastern Sichuan Basin [40]. The gas deviation coefficient (also termed the compressibility factor) describes the deviation of a real gas from ideal gas behavior. It is defined as the ratio of the molar volume of a particular gas to the molar volume of an ideal gas at the same temperature and pressure.
As mentioned before, well HD-1 was drilled into the core of the Huayingshan anticline (Figure 10A). The well is 1386 m deep, and a conservative estimate of the daily gas production is 3 × 10³ m3 (qsc = 3 × 10³ m3/d [18,19]). The borehole diameter is 9.5 × 10⁻² m (rw = 4.75 × 10⁻² m). The production layer is located at a depth of 1331.8 m to 1333.0 m (h = 1.2 m). The temperature of the production layer is 34.2 °C (T = 307.35 K). The pressure coefficient is approximately 1.06 [18,19] within the fracture zone, yielding a Pwf = 14.1 MPa. The produced gas is mainly composed of methane. The viscosity of the methane, µ, under these conditions is 17.01 µPa·s. A conservative estimate of the drainage radius of well HD-1 is 500 m (re = 500 m). The dip angle of the stratum is approximately 60° (Figure 10B). The burial of the edge of the stratum is located about 433 m deeper than the bottom of the fracture layer. The pressure at the edge of the stratum (Pe), therefore, is approximately 18.4 MPa.
The permeability of the fracture layer was then calculated from Equation (3), yielding 0.96 mD, which is about two times the average permeability (0.47 mD) of the tested shale samples at a confining pressure of 14.1 MPa (Table 2). Interestingly, the estimated permeability of the fractured reservoir section is close to the predicted permeability of Sample 2 at a confining pressure of 14.1 MPa (Table 2), which may yield insights into the permeability characteristics of this fractured shale gas reservoir when extrapolated to greater depths. For example, at a confining pressure of 35 MPa, this would result in a permeability of the fracture zone of 0.46 mD, which still is much higher than that of unfractured shale strata [41]. According to the images of the core samples in Figure 1B, the single micro-fracture in Sample 2 (Figure 8B) is oriented sub-horizontally and perpendicular to the well direction. In combination with the observed weak stress sensitivity of this fracture type, the latter may define the favorable direction of gas migration in this fractured shale stratum. It should be noted that this evaluation is based on the steady-state inflow performance relationship (IPR; Equation (3)) for single-phase gas flow. This comes with a number of uncertainties and limitations, where the actual reservoir properties may violate the assumptions of this IPR. Particularly, this relates to the steady-state requirement for gas flow, the thickness of the pay zone, and the style of flow in a fractured reservoir.
As was mentioned before, the hydrodynamic pressure within the fracture zone is slightly higher than the hydrostatic pressure, yielding a pressure coefficient of 1.06 [18,19]. Overall, this indicates that the fracture zone not only has a comparatively high permeability, allowing for the effective transfer of fluid pressure, but also that the so-induced pore pressure increase may favorably counterbalance the negative effect of confining pressure on permeability to some degree (Section 5.1). In summary, fractured shale strata possessing a large fluid potential gradient, such as that found in the shoulder of anticlines, are promising locations for economic production of shale gas, probably even without the requirement of hydraulic fracture treatments.

6. Conclusions

Gas permeability measurements performed as a function of confining pressure on micro-fractured samples from shale gas well HD-1 drilled into the Wufeng Formation, China, yielded the following conclusions:
  • The porosity of the damage zone is similar to that of shale strata without fractures and in the range from 1.3% to 4.2%. There is no obvious correlation between the porosity and the permeability of the fractured shale;
  • The gas permeability, as measured, ranges between 0.064 and 26.9 mD and scales linearly with the inverse mean pore pressure, yielding the corresponding Klinkenberg permeabilities. The Klinkenberg permeabilities differ between samples, both regarding their absolute values and their confining pressure characteristics;
  • The permeability of all micro-fractured shale samples is very sensitive to stress (confining pressure) changes in comparison with a porous sandstone sample tested in addition. The measured decrease in permeability was found to be up to 88% in the pressure range between 4 and 10 MPa. The extent of this stress-dependent permeability reduction is closely correlated with the fracture distribution and orientation as evidenced by µCT imaging. Fractures oriented in the direction of the reservoir’s fluid potential gradient display the weakest stress sensitivity, yielding the highest permeability at the in situ pressure;
  • The permeability of the regional fault due to the drilling of well HD-1 is approximately 0.96 mD, as estimated from well productivity data. This roughly agrees with the average permeability of the shale samples tested in this study under elevated pressures and indicates that a micro-fractured reservoir exists at depth. Moreover, the permeability of the naturally micro-fractured shale is significantly higher than that of intact shales; and
  • The shoulder of anticlines with large fluid potential gradients thus can define favorable drilling targets for the economic exploitation of shale gas, probably even without the need for hydraulic fracture treatments. Here, the production rate and the payback period can certainly be improved by an appropriate choice of drilling technology and a defined exploitation strategy.

Author Contributions

J.H.: experiment, data evaluation, conceptualization, methodology, and writing of the original draft manuscript. J.W.: supervision. Q.Y.: project administration. C.C.: experiment and data evaluation. H.M.: experiment, data evaluation, supervision, and reviewing and editing of the manuscript. All authors have read and agreed to the published version of the manuscript.

Funding

This study was funded by the National Natural Science Foundation of China (Grant No. 41772126) and the China Geological Survey (Grant Nos. DD20190524 and DD20221661).

Data Availability Statement

All data related to this publication will be provided by the first or the corresponding author on request.

Acknowledgments

The authors are grateful to Tanja Ballerstedt, GFZ Potsdam, for assistance with experiments. The constructive comments from the two anonymous reviewers are greatly appreciated.

Conflicts of Interest

The authors declare no conflict of interest. The funders had no role in the design of the study, in the collection, analyses, or interpretation of data, in the writing of the manuscript; or in the decision to publish the results.

Appendix A

Table A1. All permeability results with parameters as defined in the main text.
Pc4 MPa5 MPa6 MPa7 MPa8 MPa9 MPa10 MPa
S1kgk (mD)Pav (MPa)b (MPa)k (mD)Pav (MPa)b (MPa)k (mD)Pav (MPa)b (MPa)k (mD)Pav (MPa)b (MPa)k (mD)Pav (MPa)b (MPa)k (mD)Pav (MPa)b (MPa)k (mD)Pav (MPa)b (MPa)
26.9170.21 20.9930.21 13.7820.27 14.0470.22 13.0650.21 4.4230.23 1.8660.33
18.7290.35 13.5080.36 10.4350.40 9.5610.35 8.3450.33 3.2280.35 1.5920.45
15.7380.46 11.4350.48 8.5310.52 7.4460.49 6.3710.47 2.4800.49 1.3930.62
12.9090.61 9.4270.60 7.4140.63 6.2490.61 5.3030.62 2.2030.62 1.2490.73
11.3240.78 8.0950.76 6.2850.80 5.8990.71 4.7020.74 2.0160.72 1.1890.84
10.7790.88 7.3000.91 5.8460.91 5.0760.85 4.1670.88 1.7980.85 1.1320.94
10.3750.97 6.9991.00 5.4051.03 4.6800.99 3.8361.02 1.6691.00 1.0471.08
10.1771.11 6.5621.16 5.2001.11 4.2201.12 3.5541.10 1.4641.16 1.0381.19
k5.860b0.763.366b1.102.436b1.281.896b1.431.363b1.770.793b1.070.723b0.53
S2kg16.3250.22 15.0750.23 11.2340.27 8.8880.32 8.3290.32 7.6170.33 7.1890.30
11.8520.34 10.9850.32 8.8390.37 7.3220.42 6.5660.45 5.8690.47 5.6970.42
9.8800.47 8.6370.47 7.5900.46 5.7710.59 5.6870.56 5.3400.56 5.0250.52
8.7010.59 7.4970.59 6.5670.57 4.9570.73 5.1250.64 4.8170.66 4.2540.63
7.7240.71 6.6280.72 5.4720.75 4.4900.84 4.8160.72 4.3260.79 3.8760.76
7.3210.81 6.1450.85 5.0100.86 4.1560.94 4.3750.81 3.9310.91 3.5640.88
6.6770.93 5.6100.98 4.5620.98 3.9151.03 4.0440.94 3.6701.05 3.3040.99
6.2551.07 5.3241.09 4.2971.08 3.7111.11 3.7541.05 3.5341.14 3.2051.10
k3.894b0.702.800b0.982.170b1.121.723b1.341.837b1.141.848b1.041.534b1.17
S16kg0.3760.17 0.2090.34 0.1670.31 0.1400.33 0.1120.23 0.1150.19 0.0890.31
0.3260.26 0.1910.48 0.1630.41 0.1340.42 0.1100.34 0.1010.37 0.0780.46
0.2720.37 0.1920.59 0.1560.53 0.1300.52 0.1060.50 0.0980.47 0.0770.59
0.2540.45 0.1890.59 0.1480.68 0.1260.63 0.1000.62 0.0950.60 0.0750.73
0.2390.59 0.1810.72 0.1430.77 0.1200.76 0.0980.74 0.0910.73 0.0730.86
0.2380.71 0.1730.85 0.1370.92 0.1170.85 0.0940.88 0.0860.86 0.0690.96
0.2291.06 0.1701.00 0.1331.06 0.1130.97 0.0901.03 0.0840.99 0.0651.09
0.2281.18 0.1591.12 0.1281.21 0.1101.08 0.0881.13 0.0791.13 0.0641.19
k0.193b0.160.147b0.150.119b0.140.101b0.140.087b0.080.079b0.090.058b0.17
S17kg8.8060.20 7.6600.23 6.6370.23 6.7770.21 7.0670.18 7.2560.19 4.3080.29
5.7090.34 5.4030.33 4.6970.35 4.2380.35 3.9250.35 3.7130.37 3.3210.39
4.4140.47 4.1870.47 3.6870.48 3.4910.45 3.2450.45 3.1070.47 2.7430.50
3.8490.60 3.4520.59 3.1560.59 2.8340.61 2.5970.60 2.5860.60 2.3470.61
3.5330.70 3.1720.71 2.7880.71 2.5000.72 2.2550.76 2.2270.74 2.1410.72
3.3610.82 2.8650.83 2.4700.85 2.2770.84 2.0930.87 1.9970.88 1.8680.87
2.9950.98 2.6480.96 2.2950.96 2.0710.97 1.8820.99 1.8341.03 1.7460.98
2.9701.11 2.4591.14 2.1221.08 1.9001.11 1.7971.10 1.7421.11 1.6091.15
k1.563b0.901.088b1.350.924b1.420.789b1.560.734b1.550.568b2.160.659b1.60
S19kg6.2800.18 3.6230.30 2.8230.35 3.6480.20 2.6330.23 2.2900.24 1.8490.33
4.2760.34 3.0150.44 2.4080.46 2.5500.35 2.1840.35 2.0390.33 1.5900.45
3.4350.50 2.6300.57 2.1390.59 2.1560.49 1.8800.48 1.7300.49 1.3810.62
3.1210.60 2.3460.70 1.9480.72 1.8590.66 1.6700.64 1.5620.60 1.2380.73
2.8440.74 2.2510.83 1.8540.83 1.6950.83 1.5090.81 1.4210.76 1.1690.84
2.6640.86 2.0620.96 1.7070.95 1.5610.97 1.3950.99 1.3280.87 1.1190.94
2.5790.98 1.9431.09 1.6301.08 1.4361.15 1.2261.18 1.2251.01 1.0381.08
2.3831.11 1.8881.23 1.5691.19 1.3881.27 1.2181.28 1.1471.15 1.0161.19
k1.686b0.511.339b0.531.066b0.581.018b0.520.993b0.390.939b0.370.707b0.55
S3kg2.4620.25 1.6830.20 1.2370.21 0.8850.20 0.6240.22 0.4790.25 0.3350.26
2.2950.32 1.5180.30 1.1050.37 0.8050.33 0.5810.32 0.4420.34 0.3090.34
2.1440.41 1.4430.39 1.0390.47 0.7270.50 0.5300.45 0.4160.49 0.2830.47
2.0900.47 1.4240.47 0.9990.54 0.6970.58 0.5060.58 0.3970.57 0.2700.57
2.0200.54 1.3620.54 0.9510.63 0.6640.68 0.4690.69 0.3620.71 0.2570.73
1.8640.60 1.3080.60 0.8940.76 0.6200.81 0.4350.83 0.3500.84 0.2390.88
1.8600.65 1.2490.69 0.8940.76 0.5940.92 0.4150.98 0.3300.96 0.2291.01
1.7710.75 1.1920.81 0.8081.00 0.5731.01 0.3931.08 0.3131.09 0.2191.10
k1.488b0.171.107b0.110.766b0.140.540b0.140.366b0.170.287b0.180.195b0.20
S4kg3.0230.22 1.4870.22 1.2470.23 0.9850.25 0.8960.21 0.7940.23 0.6280.29
2.0470.34 1.2810.34 1.0790.36 0.9220.33 0.8000.34 0.7260.34 0.5720.38
1.6190.48 1.1510.48 0.9420.52 0.8200.47 0.6980.47 0.6170.48 0.5560.47
1.4910.59 1.0680.61 0.8660.62 0.7490.59 0.6280.61 0.5800.60 0.4950.56
1.3660.73 1.0040.70 0.8150.73 0.6910.71 0.6030.69 0.5400.71 0.4630.68
1.2460.84 0.9610.78 0.7580.85 0.6340.86 0.5440.84 0.5010.84 0.4330.84
1.2210.95 0.9100.90 0.7190.95 0.6010.95 0.5150.96 0.4620.98 0.4021.00
1.1581.06 0.8181.02 0.6901.04 0.5791.04 0.4851.05 0.4331.10 0.3791.08
k0.635b0.810.741b0.230.578b0.280.485b0.280.434b0.240.380b0.270.314b0.31
S20kg13.2830.23 10.4560.25 10.0040.22 9.3810.20 8.4500.21 6.3270.27 6.0020.25
10.2560.35 8.6980.33 7.6190.34 7.1550.31 6.3910.33 5.5750.36 5.0340.34
8.7370.47 7.3150.46 6.0450.49 5.8950.43 5.0120.46 4.7480.46 4.2930.44
7.7970.59 6.4460.57 5.4610.59 5.0910.55 4.6590.56 4.2500.54 3.5500.57
7.0750.71 5.8640.71 4.8930.71 4.3420.71 3.8320.72 3.9640.64 3.1930.70
6.5000.83 5.4620.82 4.5600.80 3.9020.84 3.7020.84 3.6910.72 3.1290.80
6.2090.91 5.0700.96 4.2590.90 3.6440.94 3.5000.94 3.3660.83 2.8950.88
6.1121.02 4.8451.09 4.0050.99 3.3931.06 3.3641.05 3.1410.95 2.7600.97
k4.067b0.523.295b0.542.521b0.662.147b0.702.040b0.681.943b0.641.637b0.69
S26kg0.6460.27 0.3510.21 0.3360.19 0.3040.25 0.2880.23 0.2270.21 0.2040.20
0.5590.33 0.3400.33 0.3060.33 0.2880.36 0.2780.34 0.2290.34 0.2020.33
0.5300.48 0.3250.45 0.3000.44 0.2700.46 0.2570.47 0.2240.46 0.1890.49
0.5070.60 0.3090.58 0.2810.59 0.2550.60 0.2500.59 0.2090.59 0.1820.60
0.4800.71 0.2930.73 0.2600.70 0.2460.72 0.2350.73 0.1930.76 0.1710.74
0.4600.83 0.2920.85 0.2580.83 0.2340.89 0.2290.85 0.1900.89 0.1640.86
0.4640.96 0.2810.96 0.2500.96 0.2251.04 0.2160.97 0.1871.02 0.1580.98
0.4431.09 0.2741.12 0.2451.09 0.2191.15 0.2121.10 0.1811.15 0.1511.18
k0.391b0.170.268b0.070.235b0.090.203b0.140.201b0.110.180b0.070.153b0.08
S8kg12.3720.18 11.3280.21 10.0710.24 10.1320.24 9.8360.22 10.1320.22 9.2920.24
9.6440.31 9.4870.35 9.1020.33 8.7100.36 8.7340.33 8.5420.32 8.3420.35
8.8690.43 8.7130.47 8.5340.41 7.9380.47 7.8410.47 7.9720.42 7.6690.45
8.4520.51 8.2070.57 7.8480.52 7.3680.58 7.3990.55 7.1760.58 7.1660.58
7.9280.63 7.7320.69 7.3460.62 6.8410.69 7.1060.65 6.8760.70 6.7090.71
7.6030.81 7.3950.78 6.8630.73 6.2850.84 6.9430.76 6.5520.82 6.3410.83
7.1541.11 7.3200.88 6.4510.83 5.9210.96 6.6880.87 6.2190.92 6.2470.95
8.3260.54 7.0631.00 6.0400.97 5.4971.10 6.3930.96 6.2381.06 6.0251.05
k6.209b0.186.098b0.185.151b0.244.658b0.305.637b0.175.255b0.205.207b0.20

Appendix B

Correlations used to generate the graphs displayed in Figure 6 and tabulated numerical values (Table A2) of the predicted Klinkenberg permeability k in steps of 1 MPa confining pressure Pc.
S1: 
k = 94.449 P c 2.033
S2: 
k = 12.709 P c 0.934
S16: 
k = 1.0531 P c 1.214
S17: 
k = 5.7673 P c 1.002
S19: 
k = 4.8658 P c 0.807
S3: 
k = 37.426 P c 2.225
S4: 
k = 2.4765 P c 0.851
S20: 
k = 14.973 P c 0.961
S26: 
k = 1.2591 P c 0.91
S8: 
k = 7.8322 P c 0.192
Table A2. Predicted Klinkenberg permeability k in steps of 1 MPa confining pressure Pc.
Confining Pressure (MPa)Permeability k (mD)
S1S2S16S17S19S3S4S20S26S8
4.05.639 3.482 0.196 1.438 1.622 1.712 0.761 3.951 0.357 6.002
5.03.583 2.827 0.149 1.150 1.355 1.042 0.630 3.189 0.291 5.750
6.02.473 2.384 0.120 0.958 1.170 0.695 0.539 2.676 0.247 5.552
7.01.808 2.064 0.099 0.821 1.033 0.493 0.473 2.308 0.214 5.390
8.01.378 1.822 0.084 0.718 0.927 0.366 0.422 2.030 0.190 5.254
9.01.084 1.632 0.073 0.638 0.843 0.282 0.382 1.813 0.170 5.137
10.00.875 1.479 0.064 0.574 0.774 0.223 0.349 1.638 0.155 5.034
11.00.721 1.353 0.057 0.522 0.717 0.180 0.322 1.495 0.142 4.942
12.00.604 1.248 0.052 0.478 0.668 0.149 0.299 1.375 0.131 4.861
13.30.490 1.134 0.046 0.431 0.615 0.118 0.274 1.273 0.122 4.786
14.10.435 1.073 0.042 0.407 0.587 0.104 0.261 1.177 0.113 4.712
15.00.384 1.013 0.039 0.382 0.558 0.090 0.247 1.109 0.107 4.657
16.00.337 0.954 0.036 0.358 0.530 0.078 0.234 1.043 0.101 4.599
17.00.298 0.901 0.034 0.337 0.505 0.068 0.222 0.984 0.096 4.546
18.00.265 0.854 0.032 0.319 0.482 0.060 0.212 0.931 0.091 4.496
19.00.237 0.812 0.030 0.302 0.461 0.053 0.202 0.884 0.086 4.450
20.00.214 0.774 0.028 0.287 0.443 0.048 0.193 0.841 0.082 4.406
21.00.194 0.740 0.026 0.273 0.426 0.043 0.186 0.803 0.079 4.365
22.00.176 0.708 0.025 0.261 0.410 0.039 0.178 0.768 0.076 4.327
23.00.161 0.680 0.023 0.249 0.395 0.035 0.172 0.736 0.073 4.290
24.00.148 0.653 0.022 0.239 0.382 0.032 0.166 0.706 0.070 4.255
25.00.136 0.629 0.021 0.229 0.370 0.029 0.160 0.679 0.067 4.222
26.00.125 0.606 0.020 0.220 0.358 0.027 0.155 0.654 0.065 4.190
27.00.116 0.585 0.019 0.212 0.347 0.024 0.150 0.631 0.063 4.160
28.00.108 0.566 0.018 0.205 0.337 0.023 0.145 0.609 0.061 4.131
29.00.100 0.547 0.018 0.198 0.328 0.021 0.141 0.589 0.059 4.103
30.00.094 0.530 0.017 0.191 0.319 0.019 0.137 0.570 0.057 4.076
31.00.088 0.514 0.016 0.185 0.311 0.018 0.133 0.552 0.055 4.051
32.00.082 0.499 0.016 0.179 0.303 0.017 0.130 0.536 0.054 4.026
33.00.077 0.485 0.015 0.174 0.295 0.016 0.126 0.520 0.052 4.002
34.00.073 0.472 0.015 0.168 0.288 0.015 0.123 0.505 0.051 3.980
35.00.069 0.459 0.014 0.164 0.282 0.014 0.120 0.491 0.050 3.958
36.00.065 0.447 0.014 0.159 0.275 0.013 0.117 0.478 0.048 3.936
37.00.061 0.436 0.013 0.155 0.269 0.012 0.115 0.466 0.047 3.916
38.00.058 0.425 0.013 0.151 0.264 0.011 0.112 0.454 0.046 3.896
39.00.055 0.415 0.012 0.147 0.258 0.011 0.110 0.443 0.045 3.876
40.00.052 0.405 0.012 0.143 0.253 0.010 0.107 0.432 0.044 3.857
41.00.050 0.396 0.012 0.140 0.248 0.010 0.105 0.422 0.043 3.839
42.00.047 0.387 0.011 0.136 0.243 0.009 0.103 0.412 0.042 3.821
43.00.045 0.379 0.011 0.133 0.239 0.009 0.101 0.403 0.041 3.804
44.00.043 0.371 0.011 0.130 0.234 0.008 0.099 0.394 0.040 3.787
45.00.041 0.363 0.010 0.127 0.230 0.008 0.097 0.386 0.039 3.771
46.00.039 0.356 0.010 0.124 0.226 0.007 0.095 0.378 0.039 3.755
47.00.038 0.349 0.010 0.122 0.222 0.007 0.094 0.370 0.038 3.740
48.00.036 0.342 0.010 0.119 0.218 0.007 0.092 0.363 0.037 3.725
49.00.035 0.335 0.009 0.117 0.215 0.006 0.090 0.356 0.036 3.710
50.00.033 0.329 0.009 0.114 0.211 0.006 0.089 0.349 0.036 3.696
51.00.032 0.323 0.009 0.112 0.208 0.006 0.087 0.342 0.035 3.682
52.00.031 0.317 0.009 0.110 0.205 0.006 0.086 0.336 0.035 3.668
53.00.029 0.312 0.008 0.108 0.202 0.005 0.084 0.330 0.034 3.654
54.00.028 0.306 0.008 0.106 0.199 0.005 0.083 0.324 0.033 3.641
55.00.027 0.301 0.008 0.104 0.196 0.005 0.082 0.318 0.033 3.629
56.00.026 0.296 0.008 0.102 0.193 0.005 0.081 0.313 0.032 3.616
57.00.025 0.291 0.008 0.100 0.190 0.005 0.079 0.308 0.032 3.604
58.00.025 0.286 0.008 0.099 0.187 0.004 0.078 0.302 0.031 3.592
59.00.024 0.282 0.007 0.097 0.185 0.004 0.077 0.298 0.031 3.580
60.00.023 0.278 0.007 0.095 0.182 0.004 0.076 0.293 0.030 3.568
Figure A1. Power law correlations between permeability and confining pressure (as in Figure 6) on a log-log scale together with the measured permeability data for the different samples.
Geosciences 12 00150 g0a1

References

  1. Vazquez, O.; Mehta, R.; Mackay, E.; Linares-Samaniego, S.; Jordan, M.; Fidoe, J. Post-frac Flowback Water Chemistry Matching in a Shale Development. In SPE International Oilfield Scale Conference and Exhibition; Society of Petroleum Engineers: Aberdeen, UK, 2014; pp. 658–668. [Google Scholar]
  2. Zhang, X.M.; Shi, W.Z.; Hu, Q.H.; Zhai, G.Y.; Wang, R.; Xu, X.; Xu, Z.; Meng, F.; Liuet, Y. Pressure-dependent fracture permeability of marine shales in the Northeast Yunnan area, Southern China. Int. J. Coal Geol. 2019, 214, 103237. [Google Scholar] [CrossRef]
  3. Heller, R.; Vermylen, J.; Zoback, M. Experimental investigation of matrix permeability of gas shales. AAPG Bull. 2014, 98, 975–995. [Google Scholar] [CrossRef]
  4. Padin, A.; Tutuncu, A.N.; Sonnenberg, S. On the mechanisms of shale microfracture propagation. In Proceedings of the SPE Hydraulic Fracturing Technology Conference, The Woodlands, TX, USA, 4–6 February 2014; OnePetro: New York, NY, USA, 2014. [Google Scholar]
  5. Crandall, D.; Moore, J.; Gill, M.; Stadelman, M. CT scanning and flow measurements of shale fractures after multiple shearing events. Int. J. Rock Mech. Min. Sci. 2017, 100, 177–187. [Google Scholar] [CrossRef]
  6. Carey, J.W.; Lei, Z.; Rougier, E.; Mori, H.; Viswanathan, H. Fracture-permeability behavior of shale. J. Unconv. Oil Gas Resour. 2015, 11, 27–43. [Google Scholar] [CrossRef]
  7. Rutter, E.H.; Mecklenburgh, J. Influence of Normal and Shear Stress on the Hydraulic Transmissivity of Thin Cracks in a Tight Quartz Sandstone, a Granite, and a Shale. J. Geophys. Res. Solid Earth 2018, 123, 1262–1285. [Google Scholar] [CrossRef] [Green Version]
  8. Cheng, C.; Milsch, H. Hydromechanical Investigations on the Self-propping Potential of Fractures in Tight Sandstones. Rock Mech. Rock Eng. 2021, 54, 5407–5432. [Google Scholar] [CrossRef]
  9. Rutter, E.; Mecklenburgh, J. Hydraulic conductivity of bedding-parallel cracks in shale as a function of shear and normal stress. Geol. Soc. London Spéc. Publ. 2017, 454, 67–84. [Google Scholar] [CrossRef]
  10. Frash, L.P.; Carey, J.W.; Lei, Z.; Rougier, E.; Ickes, T.; Viswanathan, H.S. High-stress triaxial direct-shear fracturing of Utica shale and in situ X-ray microtomography with permeability measurement. J. Geophys. Res. Solid Earth 2016, 121, 5493–5508. [Google Scholar] [CrossRef]
  11. Li, W.F.; Frash, L.P.; Welch, N.J.; Carey, J.W.; Meng, M.; Wigand, M. Stress-dependent fracture permeability measurements and implications for shale gas production. Fuel 2021, 290, 119984. [Google Scholar] [CrossRef]
  12. Gale, J.F.; Laubach, S.E.; Olson, J.E.; Eichhuble, P.; Fall, A. Natural Fractures in shale: A review and new observations. AAPG Bull. 2014, 98, 2165–2216. [Google Scholar] [CrossRef]
  13. Ougier-Simonin, A.; Renard, F.; Boehm, C.; Vidal-Gilbert, S. Microfracturing and microporosity in shales. Earth-Sci. Rev. 2016, 162, 198–226. [Google Scholar] [CrossRef] [Green Version]
  14. Sakhaee-Pour, A.; Bryant, S.L. Gas permeability of shale. SPE Reserv. Eval. Eng. 2012, 15, 401–409. [Google Scholar] [CrossRef]
  15. Luo, Y.; Xia, B.; Li, H.; Hu, H.; Wu, M.; Ji, K. Fractal permeability model for dual-porosity media embedded with natural tortuous fractures. Fuel 2021, 295, 120610. [Google Scholar] [CrossRef]
  16. Ma, L.; Slater, T.; Dowey, P.J.; Yue, S.; Rutter, E.; Taylor, K.G.; Lee, P.D. Hierarchical integration of porosity in shales. Sci. Rep. 2018, 8, 11683. [Google Scholar] [CrossRef] [PubMed]
  17. Bredehoeft, J.D.; Neuzil, C.E.; Milly, P.C.D. Regional Flow in the Dakota Aquifer: A Study of the Role of Confining Layers; Water Supply Paper 2237; US Government Printing Office: Alexandria, VA, USA, 1983.
  18. He, J.L.; Wang, J.; Yu, Q.; Liu, W.; Ge, X.Y.; Yang, P.; Wang, Z.; Lu, J. Pore structure of shale and its effects on gas storage and transmission capacity in well HD-1 eastern Sichuan Basin, China. Fuel 2018, 226, 709–720. [Google Scholar] [CrossRef]
  19. He, J.; Wang, J.; Yu, Q.; Liu, W.; Ge, X.; Gou, Q.; Qiu, Z. The discovery of exogenous type shale gas and its application to the hydrocarbon exploration. Acta Pet. Sin. 2018, 39, 12–22. [Google Scholar]
  20. Zeng, G.; Chen, M.; Zeng, Z. Shale gas: Surface water also at risk. Nature 2013, 499, 154. [Google Scholar] [CrossRef]
  21. Yu, W.; Sepehrnoori, K. Optimization of Multiple Hydraulically Fractured Horizontal Wells in Unconventional Gas Reservoirs. J. Pet. Eng. 2013, 2013, 151898. [Google Scholar]
  22. Schultz, R.; Atkinson, G.; Eaton, D.W.; Gu, Y.J.; Kao, H. Hydraulic fracturing volume is associated with induced earthquake productivity in the Duvernay play. Science 2018, 359, 304–308. [Google Scholar] [CrossRef] [Green Version]
  23. Guo, T.; Zhang, H. Formation and enrichment mode of Jiaoshiba shale gas field, Sichuan Basin. Pet. Explor. Dev. 2014, 41, 31–40. [Google Scholar] [CrossRef]
  24. Zeng, W.; Zhang, J.; Ding, W.; Zhao, S.; Zhang, Y.; Liu, Z.; Jiu, K. Fracture development in Paleozoic shale of Chongqing area (South China). Part one: Fracture characteristics and comparative analysis of main controlling factors. J. Southeast Asian Earth Sci. 2013, 75, 251–266. [Google Scholar] [CrossRef]
  25. Reinicke, A. Mechanical and Hydraulic Aspects of Rock-Proppant Systems: Laboratory Experiments and Modelling Approaches. Ph.D. Thesis, GFZ, Potsdam, Germany, October 2011. [Google Scholar]
  26. Cheng, C.; Milsch, H. Permeability variations in illite-bearing sandstone: Effects of temperature and NaCl fluid salinity. J. Geophys. Res. Solid Earth 2020, 125, e2020JB020122. [Google Scholar] [CrossRef]
  27. Firouzi, M.; Alnoaimi, K.; Kovscek, A.; Wilcox, J. Klinkenberg effect on predicting and measuring helium permeability in gas shales. Int. J. Coal Geol. 2014, 123, 62–68. [Google Scholar] [CrossRef]
  28. Letham, E.; Bustin, R. Klinkenberg gas slippage measurements as a means for shale pore structure characterization. Geofluids 2016, 16, 264–278. [Google Scholar] [CrossRef]
  29. Li, J.; Sultan, A.S. Klinkenberg slippage effect in the permeability computations of shale gas by the pore-scale simulations. J. Nat. Gas Sci. Eng. 2017, 48, 197–202. [Google Scholar] [CrossRef] [Green Version]
  30. Li, Z.; Ripepi, N.; Chen, C. Using pressure pulse decay experiments and a novel multi-physics shale transport model to study the role of Klinkenberg effect and effective stress on the apparent permeability of shales. J. Pet. Sci. Eng. 2020, 189, 107010. [Google Scholar] [CrossRef]
  31. Tanikawa, W.; Shimamoto, T. Comparison of Klinkenberg-corrected gas permeability and water permeability in sedimentary rocks. Int. J. Rock Mech. Min. Sci. 2009, 46, 229–238. [Google Scholar] [CrossRef] [Green Version]
  32. Klinkenberg, L. The Permeability of Porous Media to Liquids and Gases. In Drilling and Production Practice; OnePetro: New York, NY, USA, 1941. [Google Scholar]
  33. Orlander, T.; Milsch, H.; Fabricius, I.L. Comparison of gas, Klinkenberg, and liquid permeability of sandstone: Flow regime and pore size. AAPG Bull. 2021, 105, 1383–1403. [Google Scholar] [CrossRef]
  34. Rist, U.; Günes, H. Qualitative and quantitative characterization of a jet and vortex actuator. In Proceedings of the 7th Ercoftac SIG33 Workshop, Genova, Italy, 16–18 October 2008; pp. 16–18. [Google Scholar]
  35. Dou, C.; Tang, X.; Xiang, K.; Sun, B.; Yan, L. Elastic and electrical properties of shales from Qiongzhusi and Longmaxi Formation. Lithol. Reserv. 2016, 28, 111–116. [Google Scholar]
  36. Yang, H.; Shen, R.; Fu, L. Composition and mechanical properties of gas shale. Pet. Drill. Technol. 2013, 41, 31–35. [Google Scholar]
  37. David, C.; Wong, T.-F.; Zhu, W.; Zhang, J. Laboratory measurement of compaction-induced permeability change in porous rocks: Implications for the generation and maintenance of pore pressure excess in the crust. Pure Appl. Geophys. 1994, 143, 425–456. [Google Scholar] [CrossRef]
  38. David, C.; Wassermann, J.; Amann, F.; Lockner, D.A.; Rutter, E.H.; Vanorio, T.; Amann Hildenbrand, A.; Billiotte, J.; Reuschlé, T.; Lasseux, D.; et al. KG²B, a collaborative benchmarking exercise for estimating the permeability of the Grimsel granodiorite–Part 1: Measurements, pressure dependence and pore-fluid effects. Geophys. J. Int. 2018, 215, 799–824. [Google Scholar] [CrossRef]
  39. Meng, M.; Frash, L.P.; Li, W.; Welch, N.J.; Carey, J.W.; Morris, J.; Neupane, G.; Ulrich, C.; Kneafsey, T. Hydro-mechanical measurements of sheared crystalline rock fractures with applications for EGS Collab Experiments 1 and 2. J. Geophys. Res. Solid Earth 2022, 127, e2021JB023000. [Google Scholar] [CrossRef]
  40. Zuo, X.; He, S.M.; Huang, Z.; Fan, X.l.; Xiao, R. Research on Productivity Prediction for Vertical Well Completion Method in East Sichuan Gas Reservoir. J. Drill. Prod. Techenol. 2006, 29, 64. [Google Scholar]
  41. Zou, C.; Yang, Z.; Guosheng, Z.; Hou, L.; Zhu, R.; Tao, S.; Yuan, X.; Dong, D.; Wang, Y.; Guo, Q.; et al. Conventional and unconventional petroleum “orderly accumulation”: Concept and practical significance. Pet. Explor. Dev. 2014, 41, 14–30. [Google Scholar] [CrossRef]
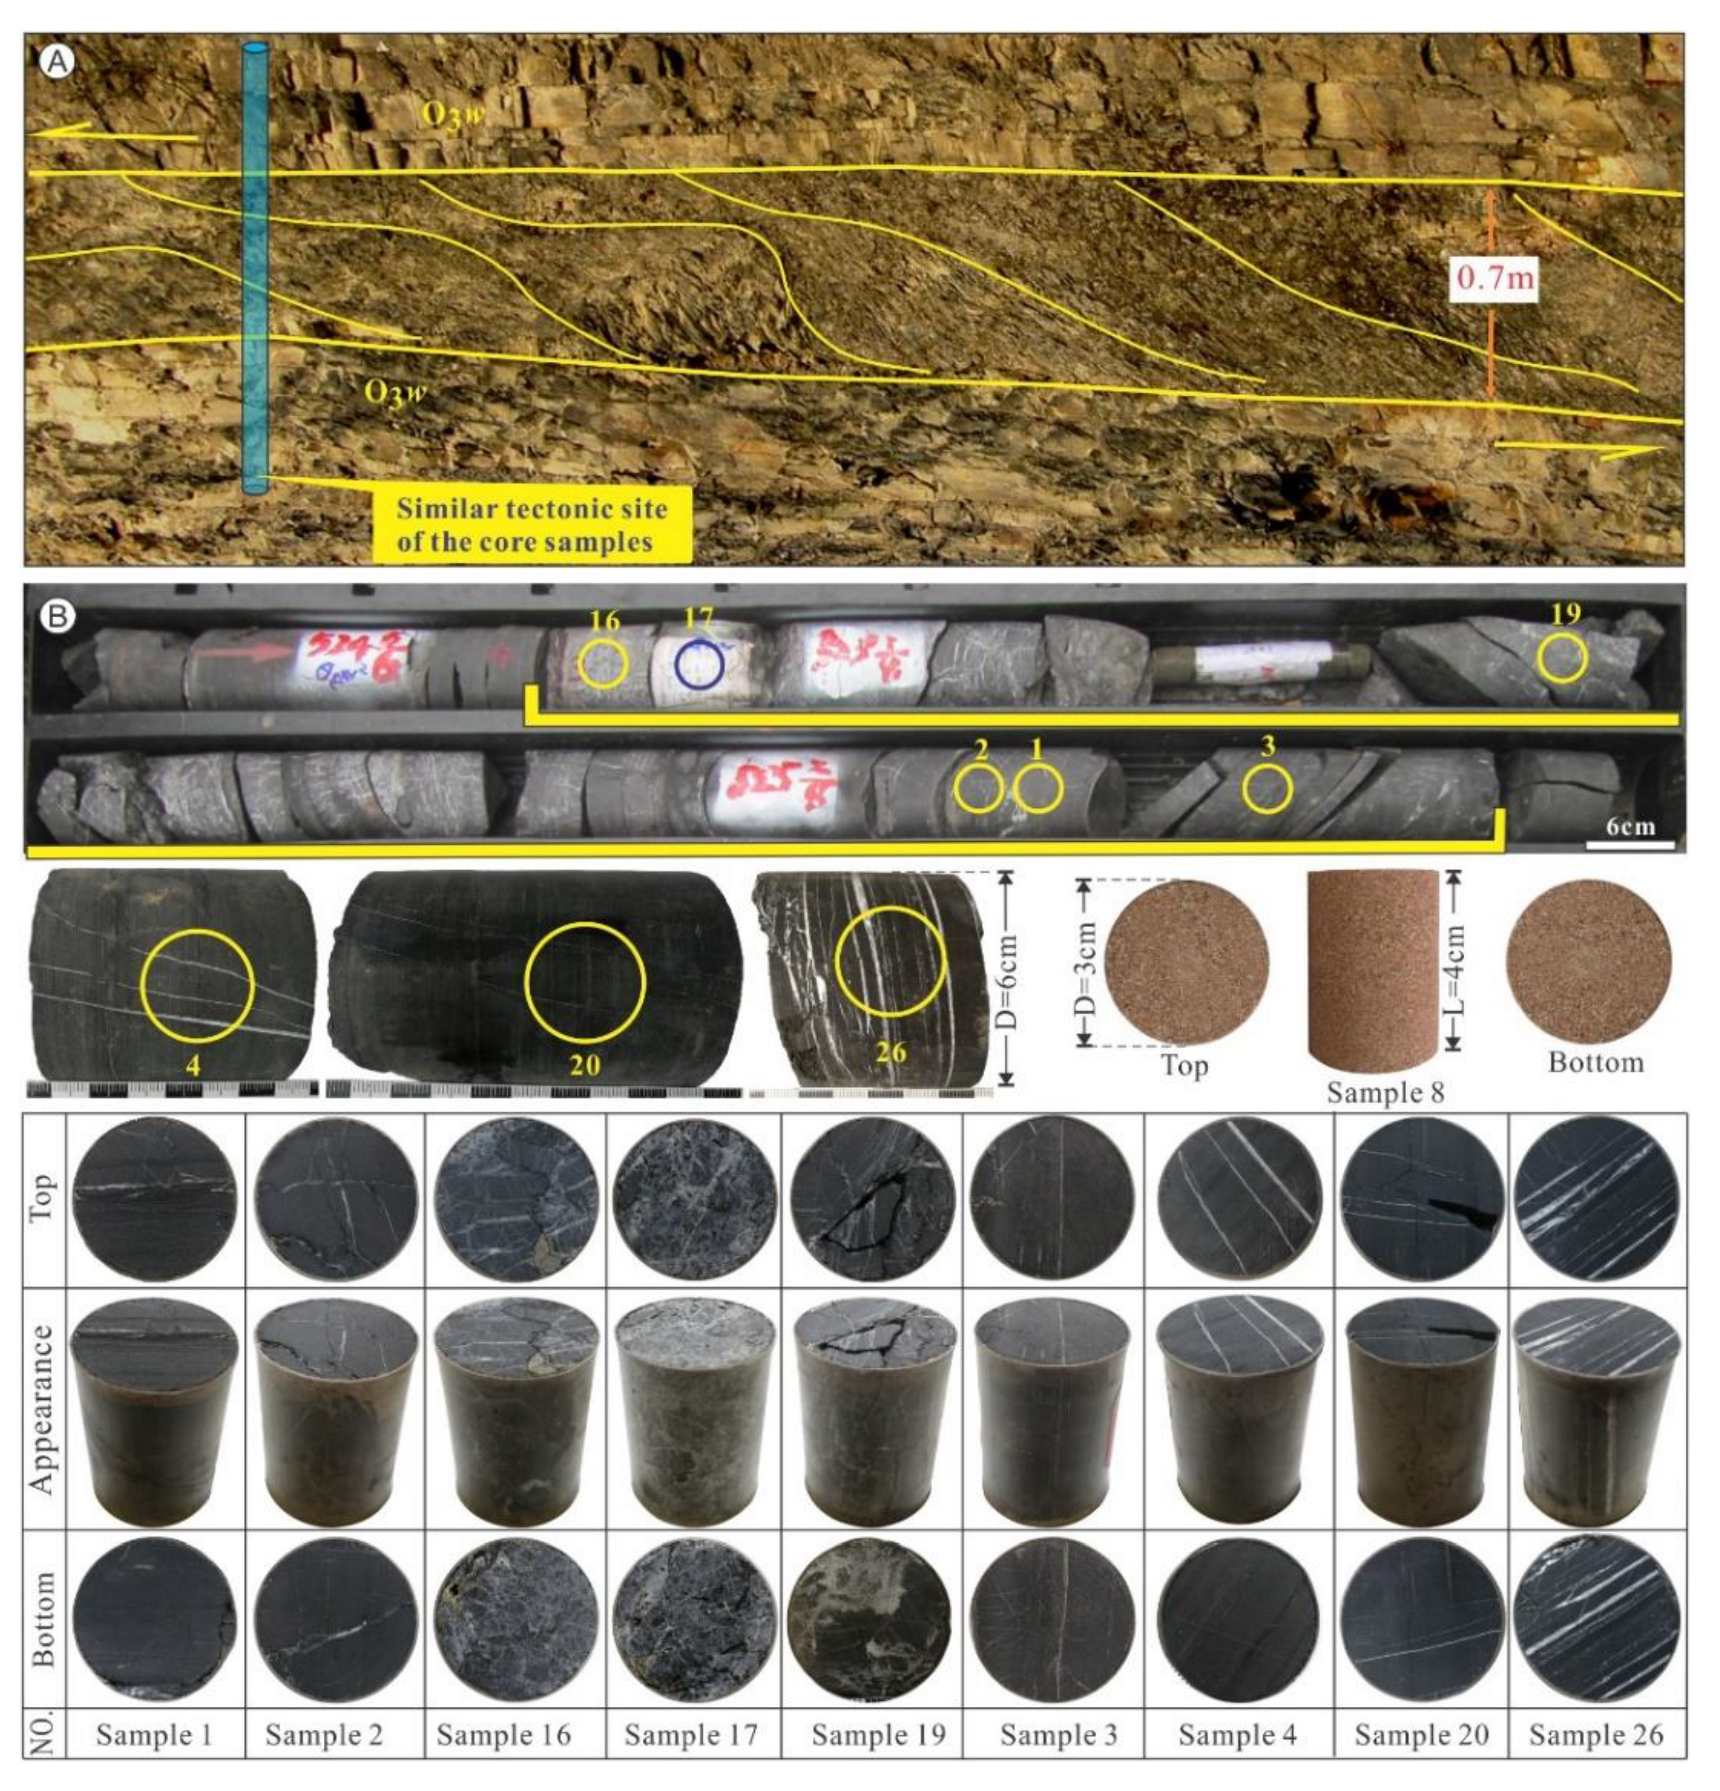
Figure 1. (A) Outcrop of a regional fault in shale strata in Chongqing municipality constituting a similar tectonic site to that of the core samples from well HD-1 used in this study; (B) images of well HD-1 cores and the 10 (i.e., 9 shale and 1 sandstone) samples used for permeability testing.
Geosciences 12 00150 g001
Figure 2. Schematic of the flow-through apparatus used in this study (not to scale). Both hydrostatic confining pressure and fluid flow were applied using argon gas. The flow rate corresponding to the applied upstream pore pressure was measured with flow meters downstream at atmospheric pressure. The pressure vessel was heated externally, and temperature was measured internally with a thermocouple.
Geosciences 12 00150 g002
Figure 3. Permeability as a function of time for Sample 19 at a constant confining pressure (10 MPa) to assess any possible time dependence of sample permeability during loading–unloading cycles.
Geosciences 12 00150 g003
Figure 4. Gas permeability as a function of the inverse mean pore pressure (1/Pav) at different confining pressures. The linear fits parameterize Equation (2), yielding the apparent liquid (Klinkenberg) permeability k and the Klinkenberg slip factor b.
Geosciences 12 00150 g004
Figure 5. Klinkenberg permeability as a function of confining pressure for all tested samples, yielding a higher sensitivity of the micro-fractured shale samples to pressure changes as compared with the porous and unfractured sandstone (Sample 8).
Geosciences 12 00150 g005
Figure 6. Predicted correlations (Appendix B) between permeability and confining pressure based on the measured data shown in Figure 4 and listed in Appendix A.
Geosciences 12 00150 g006
Figure 7. Klinkenberg permeability as a function of confining pressure during loading–unloading sequences for Samples 2, 16, and 8. Overall, the permeability shows hysteretic behavior and different degrees of permeability recovery depending on whether (Samples 2 and 16) or not (Sample 8) micro-fractures are present in the rock.
Geosciences 12 00150 g007
Figure 8. Extracted pores and fractures based on the reconstructed 3D µCT models of Samples 1 (A), 2 (B), and 16 (C). The colors indicate the distribution characteristics of the flow channels in the fractures (red), the connected flow paths (blue), and the void space of rounded pores (green). Different fracture distributions are evident in the images, including single fractures oriented diagonally (A) or subparallel (B) to the flow direction as well as multiple micro-fractures with a random orientation (C).
Geosciences 12 00150 g008
Figure 9. Fabric of the fracture zones in the Wufeng Formation. (A) Fracture zones are interlayered with laminar siliceous shale; (B) the orientation of the main fractures is obviously controlled by shear stress, whereas the secondary fractures are oriented randomly; (C) fault breccia containing some pores and fractures that are partially sealed by siliceous and calcareous cements.
Geosciences 12 00150 g009
Figure 10. Geological characteristics in the surroundings of well HD-1. (A) Projection of well HD-1 in the seismic section showing the location of well HD-1 in association with the core of the Huayingshan anticline; (B) geometrical and physical parameters defining the reservoir section of well HD-1 used for estimating the in situ permeability from Equation (3).
Geosciences 12 00150 g010
Table 1. Summary of the measured sample porosities.
Sample NumberDiameter (mm)Length 1 (mm)Length 2 (mm)Apparent Volume (cm3)Jacket Weight (g)Jacket Density (g/cm3)Jacket Volume (cm3)He-Tested Volume (cm3)Porosity (%)
dl1l2VaWjρjVjVtΦ
Sample 130.72 40.95 41.08 30.40 1.83 2.15 0.85 29.31 3.70
Sample 230.74 39.57 39.63 29.39 1.68 2.15 0.78 29.01 1.32
Sample 1630.79 40.73 40.77 30.34 1.73 2.15 0.81 29.93 1.41
Sample 1730.78 40.78 40.78 30.34 1.73 2.15 0.81 29.11 4.18
Sample 1930.78 40.72 40.64 30.27 1.73 2.15 0.80 29.27 3.38
Sample 330.73 40.57 40.58 30.09 1.72 2.15 0.80 29.32 2.65
Sample 430.64 41.38 41.49 30.55 1.76 2.15 0.82 29.64 3.07
Sample 2030.70 40.63 40.55 30.05 1.72 2.15 0.80 28.91 3.88
Sample 2630.78 41.51 41.45 30.86 1.76 2.15 0.82 30.17 2.33
Sample 830.02 40.06 40.06 28.35 0.00 -0.00 24.53 13.47
where, Va = π·(d/2)2·(l1 + l2)/2, Vj = Wj/ρj, Φ = 100·(VaVt)/(VaVj).
Table 2. Measured and predicted Klinkenberg sample permeabilities at various confining pressures.
SampleS1S2S16S17S19S3S4S20S26S8
k (4 MPa) (mD) (Tested)5.860 3.895 0.194 1.563 1.686 1.488 0.635 4.067 0.390 6.209
k (10 MPa) (mD) (Tested)0.723 1.534 0.059 0.659 0.707 0.195 0.314 1.637 0.153 5.207
k (14.1 MPa) (mD) (Predicted)0.435 1.073 0.042 0.407 0.587 0.104 0.261 1.177 0.113 4.712
k (35 MPa) (mD) (Predicted)0.069 0.459 0.014 0.164 0.282 0.014 0.120 0.491 0.050 3.958
k (60 MPa) (mD) (Predicted)0.023 0.278 0.007 0.095 0.182 0.004 0.076 0.293 0.030 3.568
Tested damping ratio (4–10 MPa)87.66%60.62%69.59%57.84%58.09%86.88%50.57%59.75%60.90%16.14%
Predicted damping ratio (4–35 MPa)98.82%88.21%92.75%89.53%83.29%99.08%81.08%87.92%87.30%36.26%
Predicted damping ratio (4–60 MPa)99.61%92.87%96.23%93.90%89.18%99.72%88.04%92.80%92.22%42.53%
Publisher’s Note: MDPI stays neutral with regard to jurisdictional claims in published maps and institutional affiliations.