Multicriteria Analysis of Innovation Ecosystems and the Impact of Human Capital and Investments on Brazilian Industries

 , ,
, ,  ,
,  and
and
Abstract
:1. Introduction
2. Materials and Methods
2.1. Data
2.2. Evaluation Structure of the PROMETHEE II Method
2.3. Application of the PROMETHEE II Method in Innovation Ecosystems
3. Results and Discussion
3.1. Descriptive Statistics
3.2. Multicriteria Analysis with PROMETHEE II
3.3. Research Implications
4. Conclusions
Author Contributions
Funding
Institutional Review Board Statement
Informed Consent Statement
Data Availability Statement
Acknowledgments
Conflicts of Interest
References
- Arruda, Mauro, Roberto Vermulm, and Sandra Hollanda. 2006. Inovação Tecnológica No Brasil: A Indústria Em Busca Da Competitividade Global. São Paulo: Associação Nacional de Pesquisa e Desenvolvimento das Empresas Inovadoras (ANPEI). [Google Scholar]
- Becheikh, Nizar, Réjean Landry, and Nabil Amara. 2006. Lessons from Innovation Empirical Studies in the Manufacturing Sector: A Systematic Review of the Literature from 1993–2003. Technovation 26: 644–64. [Google Scholar] [CrossRef]
- Behzadian, Majid, Reza Baradaran Kazemzadeh, Amir Albadvi, and Mohammad Aghdasi. 2010. PROMETHEE: A comprehensive literature review on methodologies and applications. European Journal of Operational Research 200: 198–215. [Google Scholar] [CrossRef]
- Berndt, Ana Clara, Giancarlo Gomes, and Felipe Mendes Borini. 2024. Exploring the antecedents of frugal innovation and operational performance: The role of organizational learning capability and entrepreneurial orientation. European Journal of Innovation Management 27: 1704–22. [Google Scholar] [CrossRef]
- Boehm, Anna Luise, Bjoern Michalik, Nikolaus Schmidt, and Dirk Basten. 2014. Innovate on purpose—Factors contributing to innovation in IT outsourcing. Paper presented at Annual Hawaii International Conference on System Sciences, Waikoloa, HI, USA, January 6–9; pp. 3245–54. [Google Scholar] [CrossRef]
- Brans, Jean-Pierre, and Ph Vincke. 1985a. A Preference Ranking Organisation Method: (The PROMETHEE Method for Multiple Criteria Decision-Making). Management Science 31: 647–56. [Google Scholar] [CrossRef]
- Brans, Jean-Pierre, and Ph Vincke. 1985b. Note—A Preference Ranking Organisation Method. Management Science 31: 647–56. [Google Scholar] [CrossRef]
- Brown, Ross. 2016. Mission impossible? Entrepreneurial universities and peripheral regional innovation systems. Industry and Innovation 23: 189–205. [Google Scholar] [CrossRef]
- Caliari, Thiago, Philipe Scherer Mendes, Márcia Rapini, and Camila Tolentino. 2021. Technological Cumulativeness and Innovation in Brazilian Manufacturing Industry: Evidences from Brazilian Innovation Surveys 2008, 2011, and 2014. Journal of the Knowledge Economy 12: 876–98. [Google Scholar] [CrossRef]
- Carvalho, Larissa Pinon de, Thiago Poleto, Camila Carvalho Ramos, Fernando de Assis Rodrigues, Victor Diogho Heuer de Carvalho, and Thyago Celso Cavalcante Nepomuceno. 2023. Predictors of Digital Competence of Public University Employees and the Impact on Innovative Work Behavior. Administrative Sciences 13: 131. [Google Scholar] [CrossRef]
- Chouaibi, Jamel. 2021. Innovation and Financial Performance in Manufacturing Companies: An Empirical Study Tunisian. Journal of the Knowledge Economy 12: 1870–90. [Google Scholar] [CrossRef]
- Cirani, Claudia Brito Silva, José Jaconias da Silva, Adalberto Ramos Cassia, and Samara de Carvalho Pedro. 2021. Innovation dynamics in the Brazilian industrial sector: Scenario and reflexions. Innovation & Management Review 18: 145–63. [Google Scholar] [CrossRef]
- Confederação Nacional da Indústria. 2010. Mobilização Empresarial Pela Inovação: Manual de Orientação Aos Núcleos. Brasília. Available online: https://static.portaldaindustria.com.br/media/filer_public/5e/a8/5ea84f7e-d93d-4fd6-b722-9fd15ba3bd59/20121126110024247265a.pdf (accessed on 3 March 2024).
- Damanpour, Fariborz. 1991. Organizational innovation: A meta-analysis of effects of determinants and moderators. Academy of Management Journal 34: 555–90. [Google Scholar] [CrossRef]
- Dankwah, Justice Boateng, Sayibu Ibrahim Nnindini, and Zakari Bukari. 2024. Innovation orientation and firms’ financial performance: The moderating role of new product development. Cogent Business & Management 11: 2292525. [Google Scholar] [CrossRef]
- da Silva Rabêlo, Olivan, and Andrea Sales Soares de Azevedo Melo. 2019. Drivers of multidimensional eco-innovation: Empirical evidence from the Brazilian industry. Environmental Technology 40: 2556–66. [Google Scholar] [CrossRef] [PubMed]
- De Carvalho, Victor Diogho Heuer, Jaime Vinicius Araujo Cirilo, Felippe Rocha P. Menezes de Barros, and Thyago Celso Cavalcante Nepomuceno. 2020. Multicriteria Assessment of the Creative-Innovative Potential of Brazilian Cities. Paper presented at 2020 International Conference on Decision Aid Sciences and Application (DASA), Online, November 8–9; Piscataway: IEEE, pp. 1047–51. [Google Scholar] [CrossRef]
- De Carvalho, Victor Diogho Heuer, Thiago Poleto, and Ana Paula Cabral Seixas. 2018. Information technology outsourcing relationship integration: A critical success factors study based on ranking problems (P.γ) and correlation analysis. Expert Systems 35: e12198. [Google Scholar] [CrossRef]
- De Carvalho, Victor Diogho Heuer, Thiago Poleto, Thyago Celso Cavalcante Nepomuceno, and Ana Paula Paula Cabral Seixas Costa. 2022. A study on relational factors in information technology outsourcing: Analyzing judgments of small and medium-sized supplying and contracting companies’ managers. Journal of Business & Industrial Marketing 37: 893–917. [Google Scholar] [CrossRef]
- de Moraes Silva, Diego R., Nicholas S. Vonortas, and André T. Furtado. 2023. Barriers as moderators in the innovation process. Science and Public Policy 50: 633–54. [Google Scholar] [CrossRef]
- de Oliveira, Carlos Eduardo. 2023. Incidência da inovação organizacional dos setores da indústria com base na PINTEC. International Journal of Innovation 11: e23121. [Google Scholar] [CrossRef]
- de Oliveira, Juliana Albuquerquer Saliba, Leonardo Fernando Cruz Basso, Herbert Kimura, and Vinicius Amorim Sobreiro. 2018. Innovation and financial performance of companies doing business in Brazil. International Journal of Innovation Studies 2: 153–64. [Google Scholar] [CrossRef]
- Drucker, Peter F. 1998. The discipline of innovation. Harvard Business Review 76: 149–57. [Google Scholar] [CrossRef]
- Dziallas, Marisa, and Knut Blind. 2019. Innovation indicators throughout the innovation process: An extensive literature analysis. Technovation 80–81: 3–29. [Google Scholar] [CrossRef]
- Etzkowitz, Henry. 1998. The norms of entrepreneurial science: Cognitive effects of the new university–industry linkages. Research Policy 27: 823–33. [Google Scholar] [CrossRef]
- Fischer, Bruno Brandão, Affonso Amaral Dalla Libera, Gustavo Cascardi, Rodrigo Debus Soares, and Tania Nunes da Silva. 2009. O processo de gestão da inovação no ambiente industrial: Estudo comparativo entre práticas na produção em série e na produção on demand. RACE—Revista de Administração, Contabilidade e Economia 8: 33–58. [Google Scholar]
- Gök, Osman, and Sinem Peker. 2017. Understanding the links among innovation performance, market performance and financial performance. Review of Managerial Science 11: 605–31. [Google Scholar] [CrossRef]
- Guimarães, Julio Cesar Ferro de, Eliana Andrea Severo, Eric Charles Henri Dorion, François Coallier, and Pelayo Munhoz Olea. 2016. The use of organisational resources for product innovation and organisational performance: A survey of the Brazilian furniture industry. International Journal of Production Economics 180: 135–47. [Google Scholar] [CrossRef]
- Guney, Yilmaz, Elvis Hernandez-Perdomo, and Claudio M Rocco. 2020. Does relative strength in corporate governance improve corporate performance? Empirical evidence using MCDA approach. Journal of the Operational Research Society 71: 1593–618. [Google Scholar] [CrossRef]
- Guo, Wen-Chung, Shin-Rong Shiah-Hou, and Wei-Jer Chien. 2012. A study on intellectual capital and firm performance in biotech companies. Applied Economics Letters 19: 1603–8. [Google Scholar] [CrossRef]
- Han, Sang Yun, and Sung Joo Bae. 2014. Internalization of R&D outsourcing: An empirical study. International Journal of Production Economics 150: 58–73. [Google Scholar] [CrossRef]
- Husin, Mohamad Nazri, Abdul Rauf Khan, Nadeem Ul Hassan Awan, Francis Joseph H Campena, Fairouz Tchier, and Shahid Hussain. 2024. Multicriteria decision making attributes and estimation of physicochemical properties of kidney cancer drugs via topological descriptors. edited by Nguyen, V.T.T. PLoS ONE 19: e0302276. [Google Scholar] [CrossRef]
- IBGE—Instituto Brasileiro de Geogragrafia e Eestatística. 2024. PINTEC—Pesquisa de Inovação. Available online: https://www.ibge.gov.br/estatisticas/multidominio/ciencia-tecnologia-e-inovacao/9141-pesquisa-de-inovacao.html (accessed on 3 March 2024).
- Instituto de Pésquisa Economica Aplicada. 2013. Nota Técnica: Análise Dos Dados Da PINTEC 2011. Rio de Janeiro: Instituto de Pésquisa Economica Aplicada. [Google Scholar]
- Jacoski, Claudio Alcides, Caroline Dallacorte, Beno Nicolau Bieger, and Moacir Francisco Deimling. 2014. Análise Do Desem-penho Da Inovação Regional - Um Estudo de Caso Na Indústria. Review of Administration and Innovation—RAI 11: 71. [Google Scholar] [CrossRef]
- Kannebley, Sergio, Geciane S. Porto, and Elaine Toldo Pazello. 2005. Characteristics of Brazilian innovative firms: An empirical analysis based on PINTEC—Industrial research on technological innovation. Research Policy 34: 872–93. [Google Scholar] [CrossRef]
- Karasakal, Esra, Utkan Eryılmaz, and Orhan Karasakal. 2022. Ranking using PROMETHEE when weights and thresholds are imprecise: A data envelopment analysis approach. Journal of the Operational Research Society 73: 1978–95. [Google Scholar] [CrossRef]
- Kostopoulos, Konstantinos, Alexandros Papalexandris, Margarita Papachroni, and George Ioannou. 2011. Absorptive capacity, innovation, and financial performance. Journal of Business Research 64: 1335–43. [Google Scholar] [CrossRef]
- Kowalski, Mauro, Roberto Carlos Bernardes, Leonardo Gomes, and Felipe Mendes Borini. 2024. Microfoundations of dynamic capabilities for digital transformation. European Journal of Innovation Management. ahead-of-print. [Google Scholar] [CrossRef]
- Lazzarotti, Fábio, Rosilene Marcon, and Rodrigo Bandeira-de-Mello. 2015. Recursos para Inovação e Desempenho: Uma Análise da Invariância de Mensuraçãoe Firmas de Setores de Alta Intensidade Tecnológica, no Brasil. Review of Administration and Innovation—RAI 11: 33. [Google Scholar] [CrossRef]
- Liu, Xianliang, and Yunfei Liu. 2024. Sensitivity analysis of the parameters for preference functions and rank reversal analysis in the PROMETHEE II method. Omega 128: 103116. [Google Scholar] [CrossRef]
- Lu, Qinli, and Henry Chesbrough. 2022. Measuring open innovation practices through topic modelling: Revisiting their impact on firm financial performance. Technovation 114: 102434. [Google Scholar] [CrossRef]
- McManus, Concepta, Abilio Afonso Baeta Neves, Antonio Gomes Souza Filho, Arthur Antonio Silva Rosa, Carlos Henrique Carvalho, Denise Maria Guimarães Freire, Maria Clorinda Soares Fioravant, Sonia Nair Báo, Isac Almeida de MedeirosIsac, José Alexandre Diniz-Filho, and et al. 2022. Assessment of the Brazilian postgraduate evaluation system. Frontiers in Education 7: 1036108. [Google Scholar] [CrossRef]
- McManus, Concepta, Abilio Afonso Baeta Neves, Carlos Henrique Carvalho, Antonio Gomes Souza Filho, Denise Maria Guimarães Freire, Maria Clorinda Soares Fioravanti, Sônia Nair Báo, Isac Almeida de Medeiros, José Alexandre Diniz Filho, Bruno Lourenço Diaz, and et al. 2023. Considerations for continued expansion of the Brazilian post-graduate system. Frontiers in Education 8: 987200. [Google Scholar] [CrossRef]
- Mir, Sumira, Shamim Ahmad Shah, Mohammad Shafi Bhat, Saima Akhter, Farzana Ahad, Huma Rashid, and Peer Jeelani. 2024. Disaster risk assessment of educational infrastructure in mountain geographies using PROMETHEE-II. International Journal of Disaster Risk Reduction 107: 104489. [Google Scholar] [CrossRef]
- Moreira, Gabriel Gomes, Robério José Rogério dos Santos, Victor Diogho Heuer de Carvalho, Francisco José Peixoto Rosário, and Agnaldo José dos Santos. 2024. Potential for Frugal Innovation in a Brazilian Regional System: A Study Based on a Multicriteria Approach. Societies 14: 95. [Google Scholar] [CrossRef]
- Moreira, Marina Figueiredo, and Eduardo Raupp de Vargas. 2015. Indução de Inovações em Serviços: Qual o Papel das Compras Governamentais? Revista Gestão & Tecnologia 15: 186. [Google Scholar] [CrossRef]
- OECD, and Eurostat. 2005. Oslo Manual, 3rd ed. Paris: OECD. [Google Scholar] [CrossRef]
- Porter, Michael E. 1991. Towards a dynamic theory of strategy. Strategic Management Journal 12: 95–117. [Google Scholar] [CrossRef]
- Roy, Bernard. 1996. Multicriteria Methodology for Decision Aiding. Dordrecht: Kluwer Academic Publishers. [Google Scholar] [CrossRef]
- Santos, David Ferreira Lopes, Leonardo Fernando Cruz Basso, and Herbert Kimura. 2012. A estrutura da capacidade de inovar das empresas brasileiras: Uma proposta de construto. Review of Administration and Innovation—RAI 9: 103–28. [Google Scholar] [CrossRef]
- Santos, David Ferreira Lopes, Leonardo Fernando Cruz Basso, and Herbert Kimura. 2018. The trajectory of the ability to innovate and the financial performance of the Brazilian industry. Technological Forecasting and Social Change 127: 258–70. [Google Scholar] [CrossRef]
- Santos, Juliana Bonomi. 2019. Knowledge-intensive business services and innovation performance in Brazil. Innovation & Management Review 17: 58–74. [Google Scholar] [CrossRef]
- Satarova, Begaiym, Tuba Siddiqui, Hassan Raza, Navid Abbasi, and Sultan Kydyrkozha. 2023. A Systematic Review of ‘The Performance of Knowledge Organizations and Modelling Human Action’. Socioeconomic Analytics 1: 56–77. [Google Scholar] [CrossRef]
- Schumpeter, Joseph Alois. 1934. The Theory of Economic Development. Cambridge: Harvard University Press. [Google Scholar]
- Silva, Thalles André Cabral, Victor Diogho Heuer de Carvalho, Robério José Rogério dos Santos, Thiago Poleto, and Thyago Celso Cavalcante Nepomuceno. 2023. Elicitation of Key Factors to Support Information Technology Outsourcing in Technological Innovation Hubs: Applying a Multicriteria Analytical Framework. Information 14: 169. [Google Scholar] [CrossRef]
- Spinosa, Luiz Marcio, Rosana Silveira Reis, and Marcos Muller Schlemm. 2021. Brazil’s Innovation Ecosystems: The Role of Cultural Factors. In The Palgrave Handbook of Workplace Innovation. Edited by Adela McMurray, Nuttawuth Muenjohn and Chamindika Weerakoon. Cham: Springer International Publishing, pp. 581–95. [Google Scholar] [CrossRef]
- Taques, Fernando Henrique, Manuel G. López, Leonardo F. Basso, and Nelson Areal. 2021. Indicators used to measure service innovation and manufacturing innovation. Journal of Innovation & Knowledge 6: 11–26. [Google Scholar] [CrossRef]
- Tavares, João Marcos Hausmann. 2024. The financing of innovation policies in Brazil between 1999 and 2016: Political economy, institutions and financial cycles. Innovation and Development 14: 89–110. [Google Scholar] [CrossRef]
- Teixeira, Aurora A. C. 2007. Excesso de incentivos à inovação na presença de consumidores sofisticados: Um modelo de progresso tecnológico endógeno com capital humano. Estudos Econômicos (São Paulo) 37: 585–633. [Google Scholar] [CrossRef]
- Wang, Weizhong, Yi Wang, Yu Chen, Muhammet Deveci, Seifedine Kadry, and Witold Pedrycz. 2024. Analyzing the barriers to resilience supply chain adoption in the food industry using hybrid interval-valued fermatean fuzzy PROMETHEE-II model. Journal of Industrial Information Integration 40: 100614. [Google Scholar] [CrossRef]
- Zanello, Giacomo, Xiaolan Fu, Pierre Mohnen, and Marc Ventresca. 2016. The Creation and Diffusion of Innovation in Developing Countries: A Systematic Literature Review. Journal of Economic Surveys 30: 884–912. [Google Scholar] [CrossRef]

| Indicator | Description | Objectives | Process |
|---|---|---|---|
| Spending by companies on innovation (BRL) | Spending on innovative activities includes internal research and development (R&D) activities and external R&D procurement, as well as other activities. | Maximize | Input |
| Postgraduate (%) | Percentage of workers with postgraduate degrees in the workforce by sector as a proportion of the overall number of workers employed. | Maximize | Input |
| Graduation (%) | Percentage of workers in the workforce with a bachelor’s degree by sector as a proportion of the overall number of workers employed. | Maximize | Input |
| Net revenue (BRL) | Net revenue from sales of products in each sector. | Maximize | Output |
| Percentage share of new or substantially improved products in total domestic sales (%) | Refers to the proportion of a company’s domestic sales attributed to new or substantially improved products. | Maximize | Output |
| Inputs (Years) | Outputs (Years) | ||
|---|---|---|---|
| Model 1 | 2011 |  | 2014 |
| Model 2 | 2014 | | 2017 |
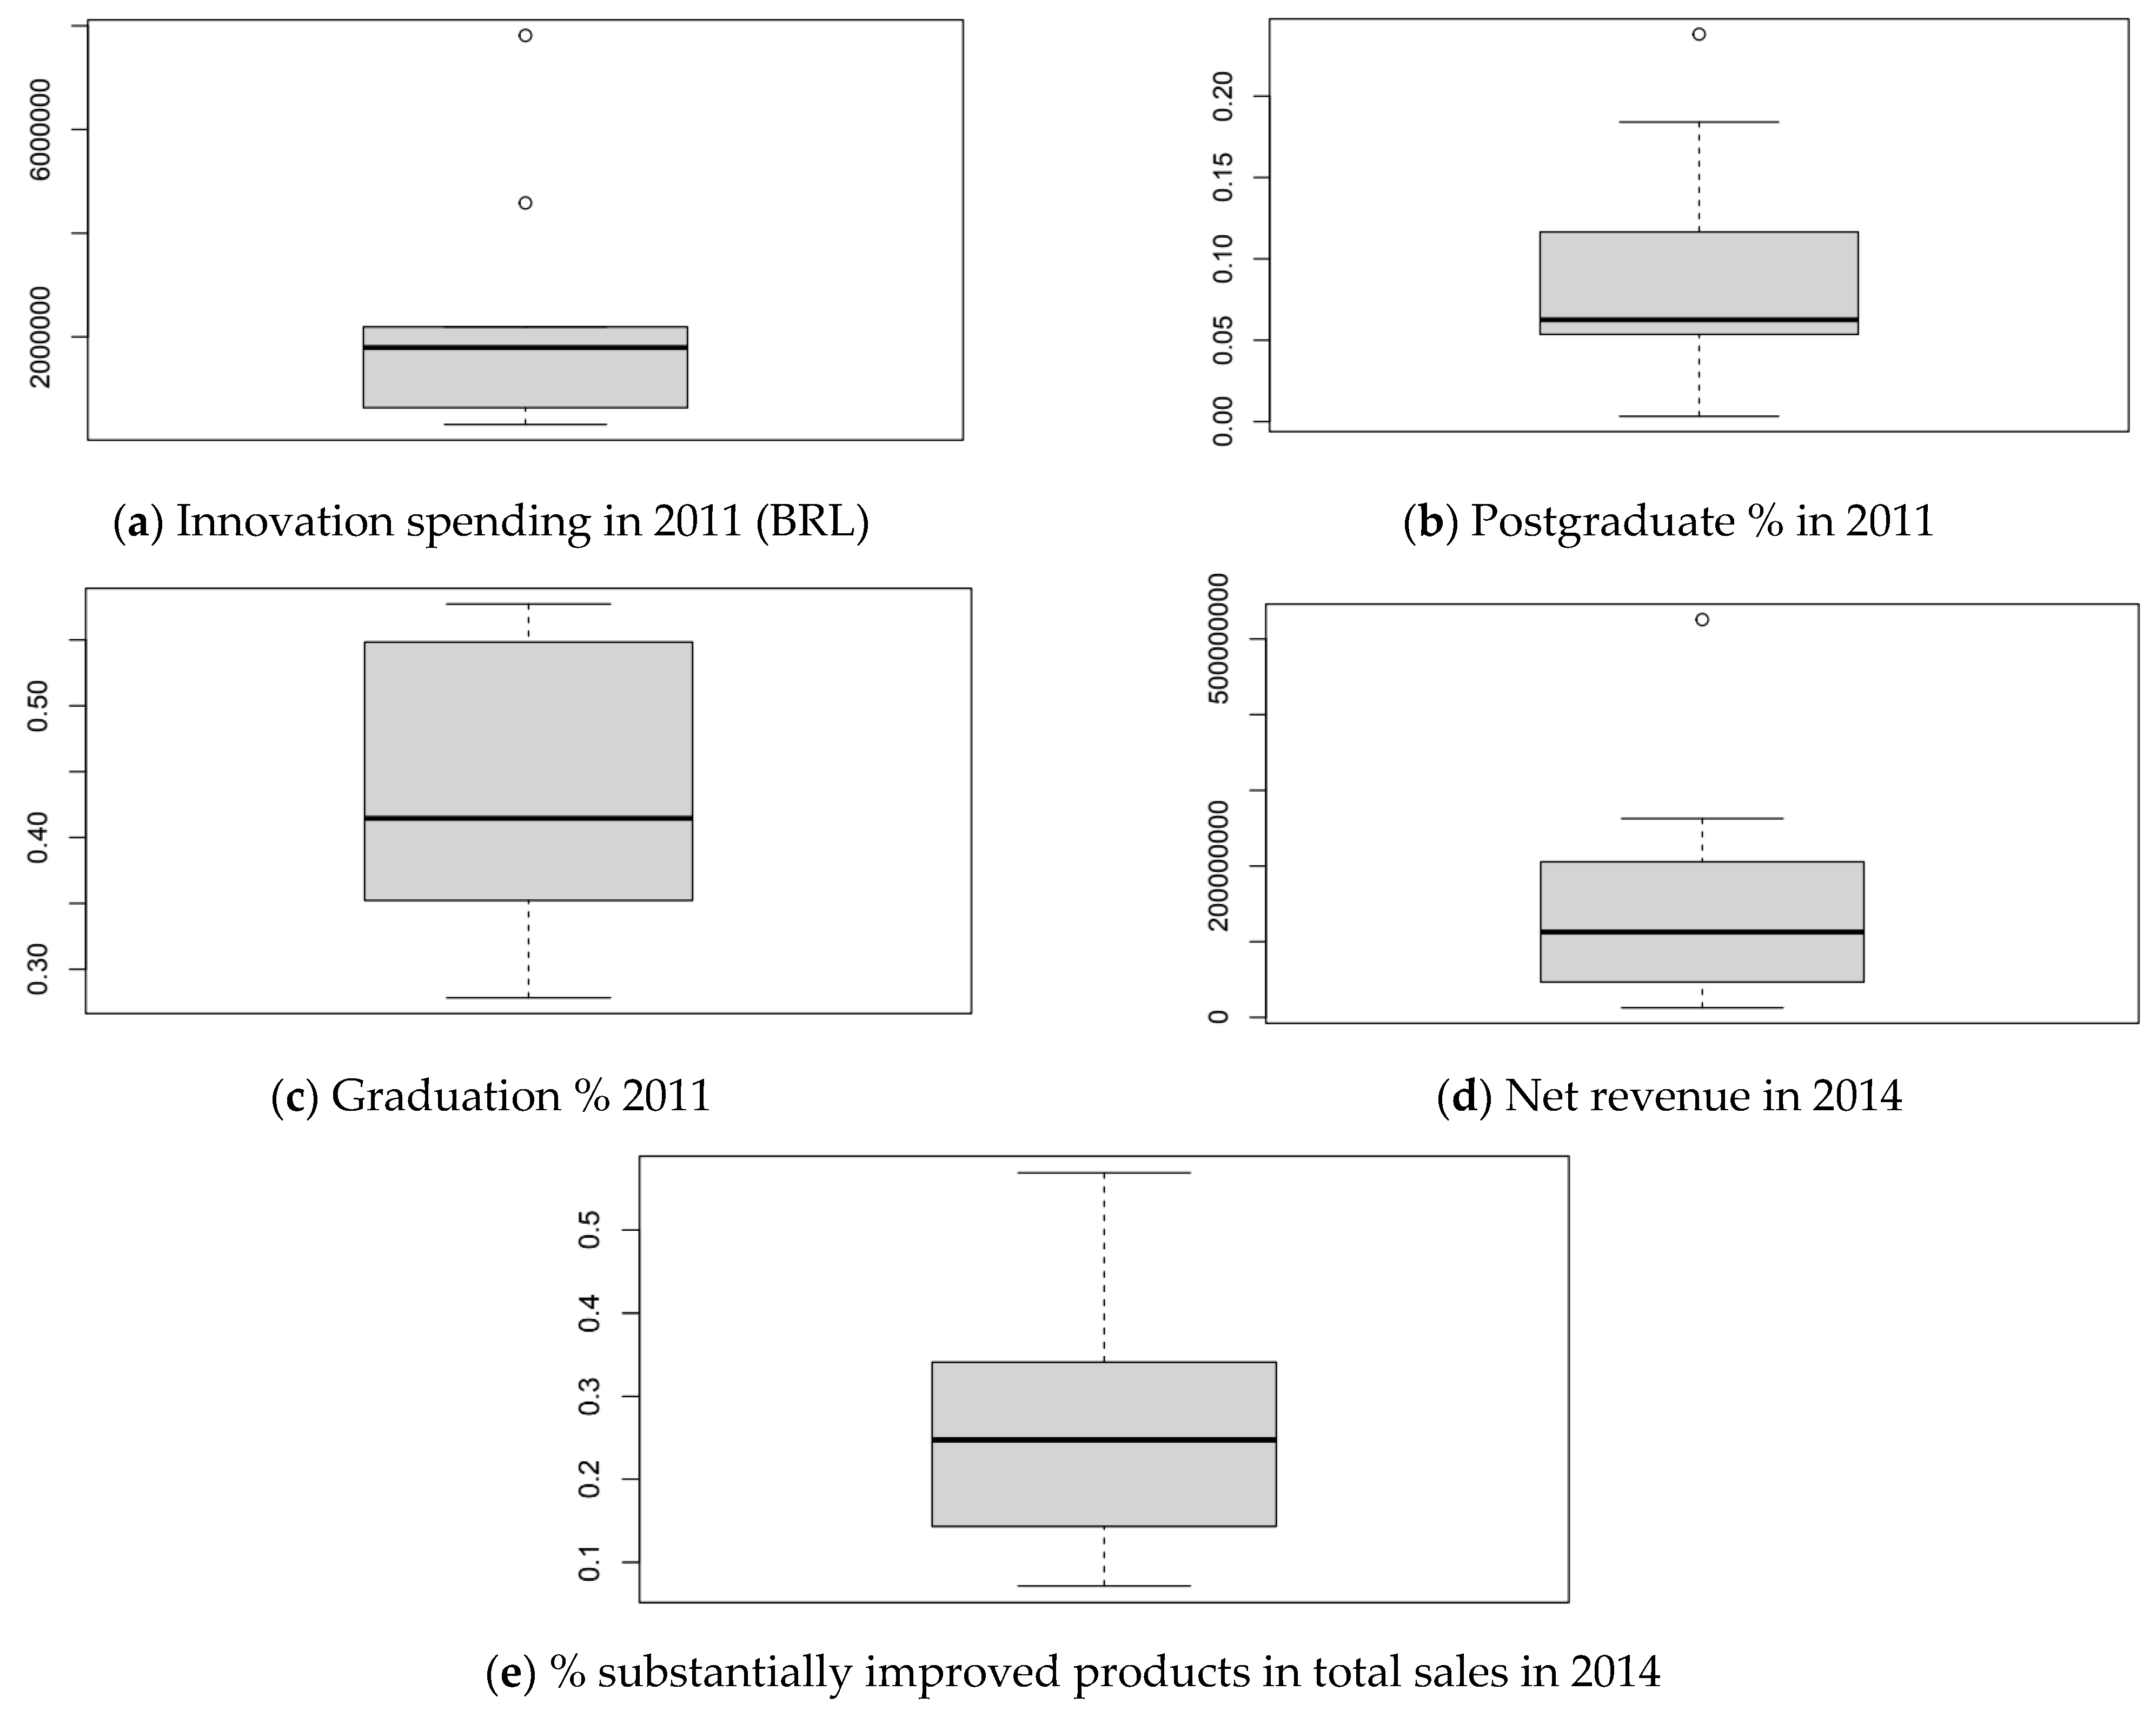
| Innovation Spending in 2011 (BRL) | Postgraduate % in 2011 | Graduation % in 2011 | Net Revenue in 2014 | % of Substantially Improved Products in Total Sales in 2014 | |
|---|---|---|---|---|---|
| Max | 7,814,360.57 | 23.81 | 58 | 525,606,581.00 | 57 |
| Q3 | 2,188,277.02 | 11.02 | 52 | 186,762,263.82 | 34 |
| Average | 2,266,535.66 | 9.09 | 43 | 150,243,708.98 | 27 |
| Median | 1,793,904.56 | 6.25 | 41 | 112,821,141.50 | 25 |
| Q1 | 667,002.92 | 5.37 | 35 | 53,669,513.00 | 16 |
| Min | 310,073.74 | 0.32 | 28 | 12,719,474.00 | 7 |
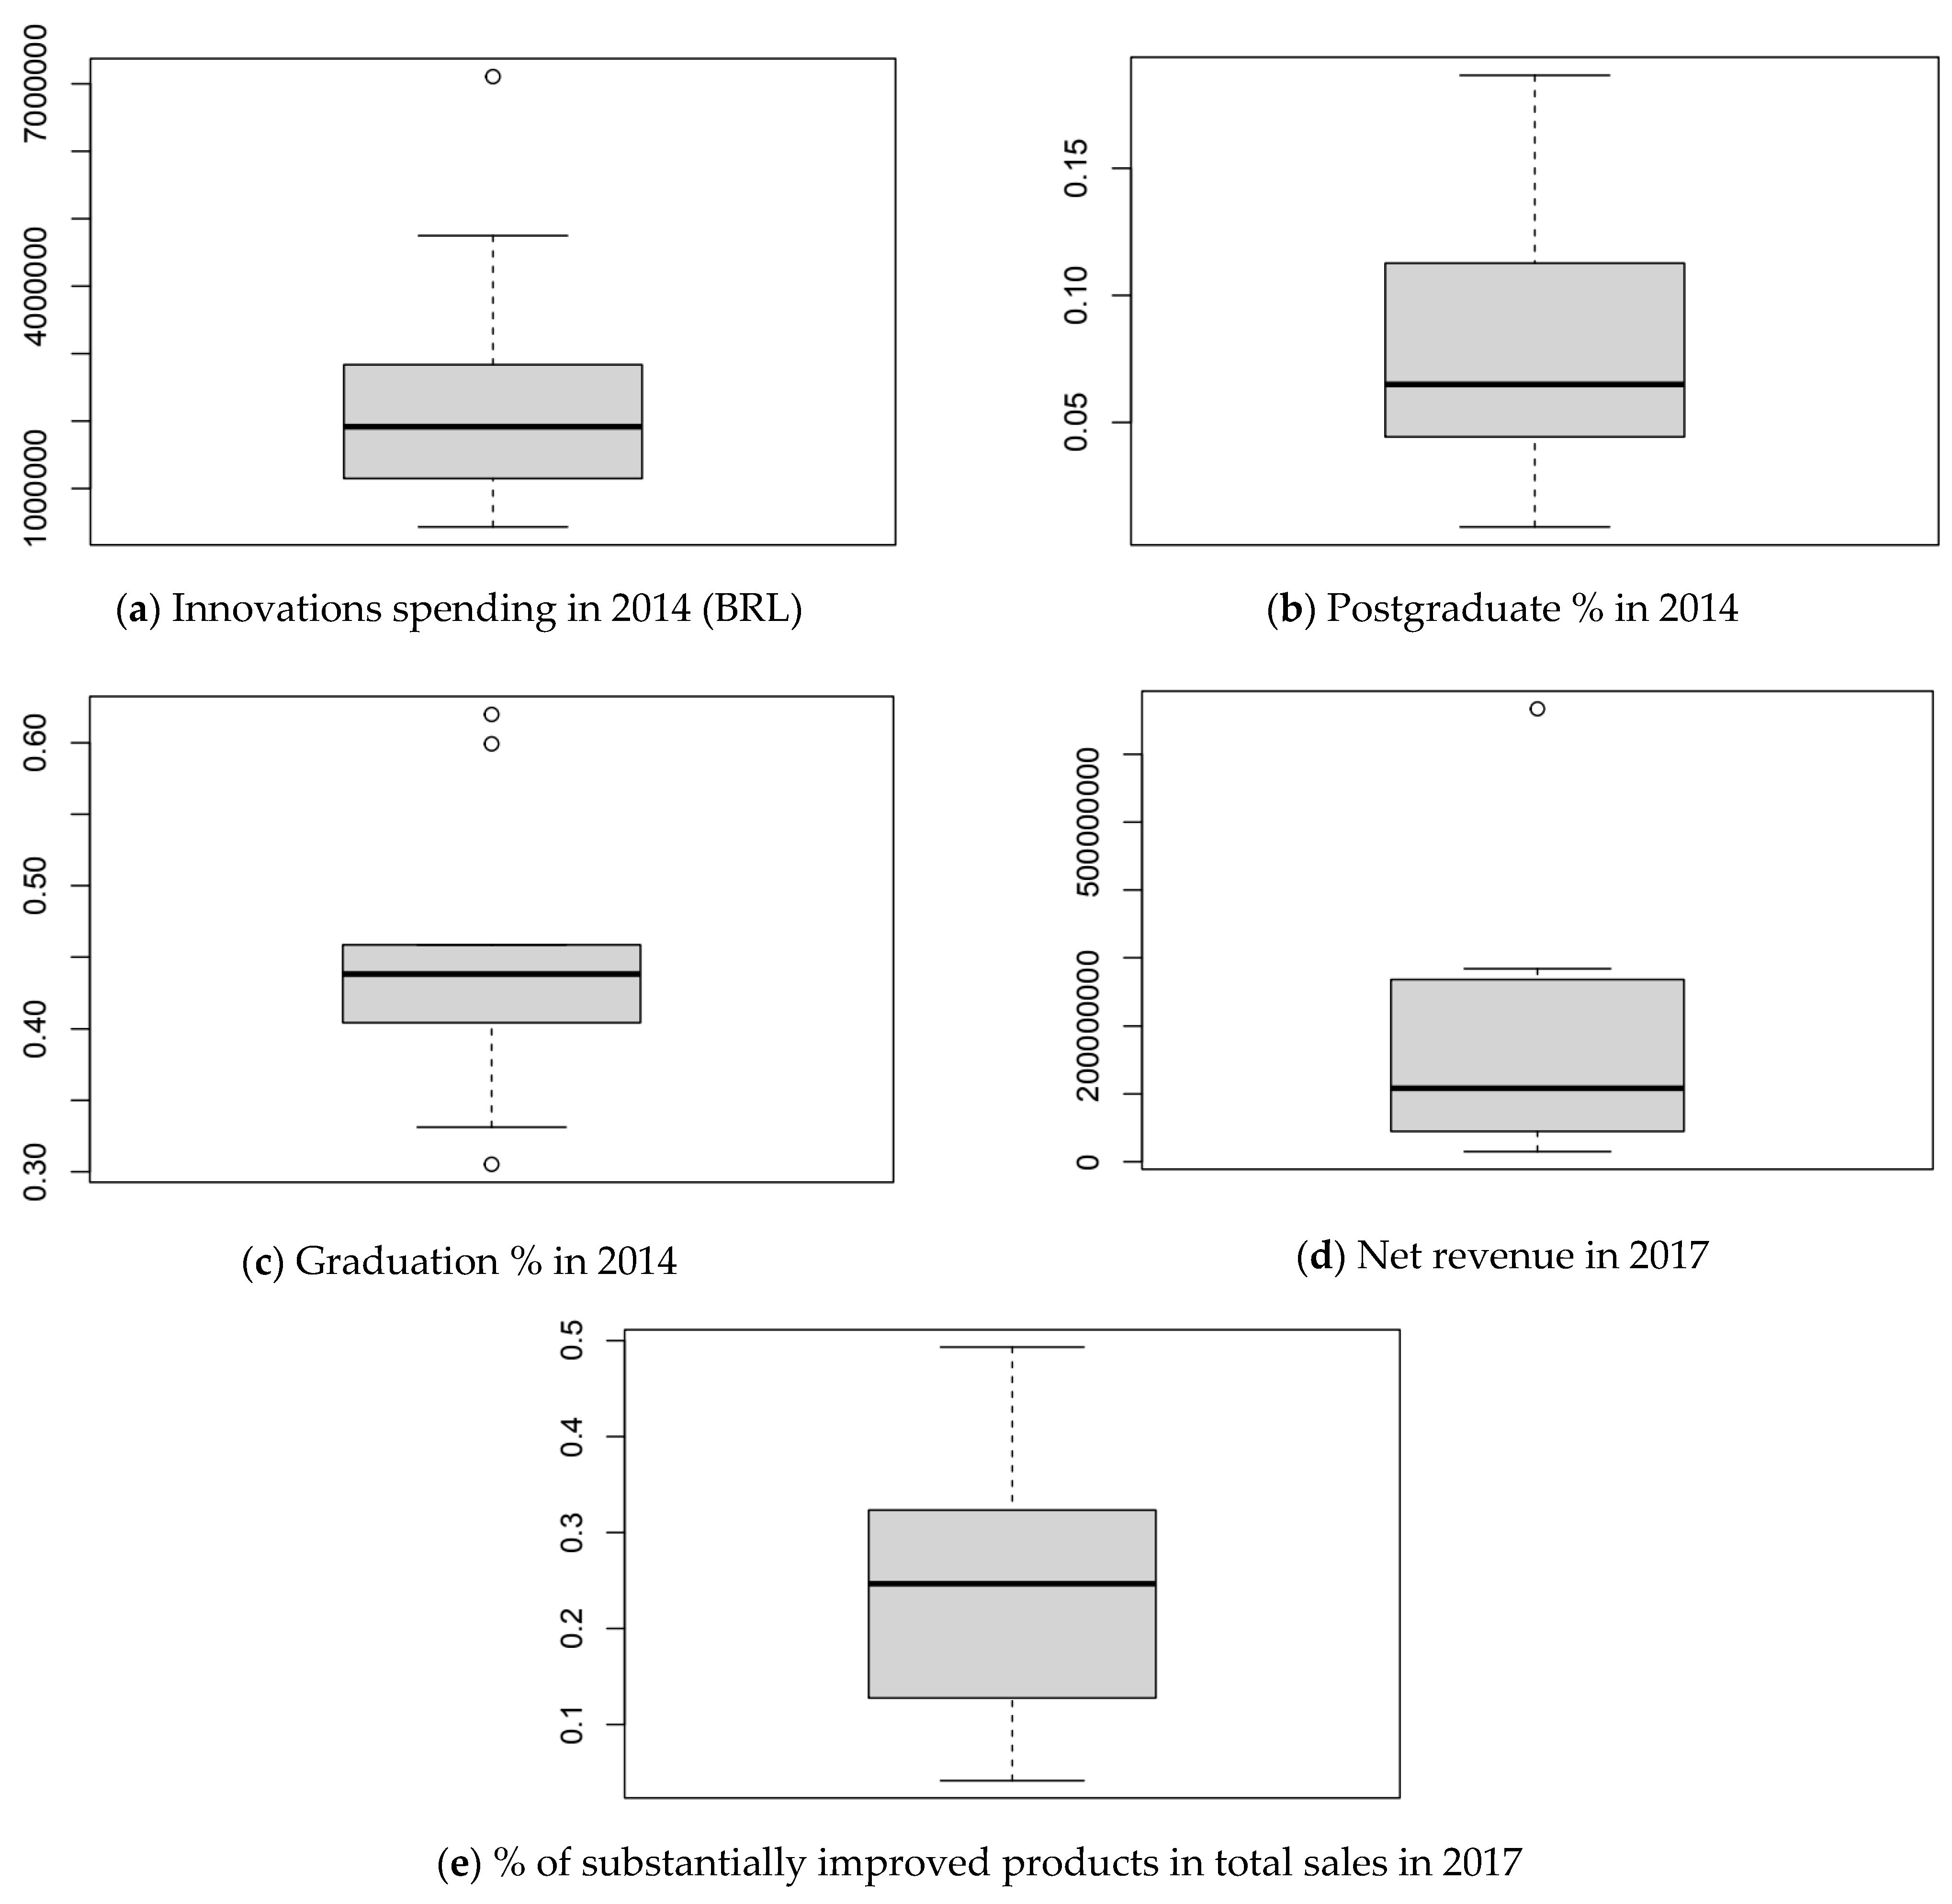
| Innovation Spending in 2014 | Postgraduate % in 2014 | Graduation % in 2014 | Net Revenue in 2017 | % of Substantially Improved Products in Total Sales in 2017 | |
|---|---|---|---|---|---|
| Max | 7,106,515.74 | 19 | 62 | 667,024,159.16 | 49 |
| Q3 | 2,671,620.21 | 11 | 46 | 234,590,278.51 | 31 |
| Average | 2,424,906.16 | 8 | 45 | 172,447,090.56 | 24 |
| Median | 1,916,461.74 | 6 | 44 | 108,317,788.62 | 25 |
| Q1 | 1,151,547.33 | 5 | 41 | 51,853,713.97 | 14 |
| Min | 430,415.76 | 1 | 31 | 14,972,712.33 | 4 |
| Ranking | Sector | Net Flow | Output Flow | Input Flow |
|---|---|---|---|---|
| 1st | Manufacture of chemical products | 0.5556 | 0.7778 | 0.2222 |
| 2nd | Manufacture of food products | 0.3778 | 0.6889 | 0.3111 |
| 3rd | Electricity and gas | 0.2444 | 0.6222 | 0.3778 |
| 4th | Custom software development | 0.0667 | 0.5333 | 0.4667 |
| 5th | Manufacture of machinery and equipment | 0.0000 | 0.4889 | 0.4889 |
| 5th | Manufacture of electrical materials | 0.0000 | 0.4889 | 0.4889 |
| 7th | Extractive industries | −0.1111 | 0.4444 | 0.5556 |
| 8th | Manufacture of rubber and plastic products | −0.1556 | 0.4222 | 0.5778 |
| 8th | Customizable software development | −0.1556 | 0.4222 | 0.5778 |
| 10th | Manufacture of clothing and accessories | −0.8222 | 0.0889 | 0.9111 |
| Positive Criteria | Sectors | Negative Criteria |
|---|---|---|
| 1st—Manufacture of chemical products | |
| 2nd—Manufacture of food products |
|
| 3rd—Electricity and gas |
|
| 4th—Custom software development |
|
| 5th—Manufacture of machinery and equipment |
|
| 6th—Manufacture of electrical materials |
|
| 7th—Extractive industries |
|
| 8th—Manufacture of rubber and plastic products |
|
| 9th—Customizable software development |
|
| 10th—Manufacture of clothing and accessories |
|
| Ranking | Sector | Net Flow | Output Flow | Input Flow |
|---|---|---|---|---|
| 1st | Manufacture of chemical products | 0.6444 | 0.8000 | 0.1556 |
| 2nd | Manufacture of food products | 0.5556 | 0.7556 | 0.2000 |
| 3rd | Customizable software development | 0.0889 | 0.5333 | 0.4444 |
| 4th | Manufacture of electrical materials | 0.0667 | 0.5333 | 0.4667 |
| 5th | Electricity and Gas | 0.0222 | 0.5111 | 0.4889 |
| 6th | Manufacture of machinery and equipment | 0.0000 | 0.4889 | 0.4889 |
| 7th | Extractive industries | −0.1111 | 0.4444 | 0.5556 |
| 8th | Custom software development | −0.1778 | 0.4000 | 0.5778 |
| 9th | Manufacture of rubber and plastic products | −0.3111 | 0.3333 | 0.6444 |
| 10th | Manufacture of clothing and accessories | −0.7778 | 0.1111 | 0.8889 |
| Positive Criteria | Sectors | Negative Criteria |
|---|---|---|
| 1st—Manufacture of chemical products | |
| 2nd—Manufacture of food products |
|
| 3rd—Customizable software development |
|
| 4th—Manufacture of electrical materials |
|
| 5th—Electricity and gas |
|
| 6th—Manufacture of machinery and equipment |
|
| 7th—Extractive industries |
|
| 8th—Custom software development |
|
| 9th—Manufacture of rubber and plastic products |
|
| 10th—Manufacture of clothing and accessories |
|
| 2011–2014 | |||||
|---|---|---|---|---|---|
| Sectors | Spending by Companies on Innovation (BRL) | Postgraduate (%) | Graduation (%) | Net Revenue (BRL) | Percentage Share of New or Substantially Improved Products in Total Domestic Sales (%) |
| 1st—Manufacture of chemical products | + | + | + | + | + |
| 2nd—Manufacture of food products | + | + | − | + | − |
| 3rd—Electricity and gas | − | + | + | + | − |
| 4th—Custom software development | − | + | + | − | + |
| 5th—Manufacture of machinery and equipment | + | − | + | − | + |
| 6th—Manufacture of electrical materials | + | − | − | + | + |
| 7th—Extractive industries | − | + | − | + | − |
| 8th—Manufacture of rubber and plastic products | + | − | − | − | − |
| 9th—Customizable software development | + | + | − | + | − |
| 10th—Manufacture of clothing and accessories | − | − | − | − | − |
| 2014–2017 | |||||
| Sectors | Spending by Companies on Innovation (BRL) | Postgraduate (%) | Graduation (%) | Net Revenue (BRL) | Percentage Share of New or Substantially Improved Products in Total Domestic Sales (%) |
| 1st—Manufacture of chemical products | + | + | + | + | + |
| 2nd—Manufacture of food products | + | + | + | + | − |
| 3rd—Customizable software development | − | − | + | − | + |
| 4th—Manufacture of electrical materials | + | + | + | − | + |
| 5th—Electricity and gas | − | + | − | + | − |
| 6th—Manufacture of machinery and equipment | + | − | − | + | + |
| 7th—Extractive industries | − | + | − | + | − |
| 8th—Custom software development | − | − | + | − | + |
| 9th—Manufacture of rubber and plastic products | + | − | − | − | − |
| 10th—Manufacture of clothing and accessories | − | − | − | − | − |
Disclaimer/Publisher’s Note: The statements, opinions and data contained in all publications are solely those of the individual author(s) and contributor(s) and not of MDPI and/or the editor(s). MDPI and/or the editor(s) disclaim responsibility for any injury to people or property resulting from any ideas, methods, instructions or products referred to in the content. |
© 2024 by the authors. Licensee MDPI, Basel, Switzerland. This article is an open access article distributed under the terms and conditions of the Creative Commons Attribution (CC BY) license (https://creativecommons.org/licenses/by/4.0/).
Share and Cite
Silva Neto, A.R.; Silva, M.G.G.d.; Taques, F.H.; Poleto, T.; Nepomuceno, T.C.C.; Carvalho, V.D.H.d.; Monte, M.B.d.S. Multicriteria Analysis of Innovation Ecosystems and the Impact of Human Capital and Investments on Brazilian Industries. Adm. Sci. 2024, 14, 241. https://doi.org/10.3390/admsci14100241
Silva Neto AR, Silva MGGd, Taques FH, Poleto T, Nepomuceno TCC, Carvalho VDHd, Monte MBdS. Multicriteria Analysis of Innovation Ecosystems and the Impact of Human Capital and Investments on Brazilian Industries. Administrative Sciences. 2024; 14(10):241. https://doi.org/10.3390/admsci14100241
Chicago/Turabian StyleSilva Neto, Antonio Reinaldo, Miguel Gustavo Gomes da Silva, Fernando Henrique Taques, Thiago Poleto, Thyago Celso Cavalcante Nepomuceno, Victor Diogho Heuer de Carvalho, and Madson Bruno da Silva Monte. 2024. "Multicriteria Analysis of Innovation Ecosystems and the Impact of Human Capital and Investments on Brazilian Industries" Administrative Sciences 14, no. 10: 241. https://doi.org/10.3390/admsci14100241