1. Introduction
Passive mode-locked laser generating ultrashort pulse (USP) is now exceedingly essential for diverse applications in fundamental science, material processing, and medical treatment [
1,
2]. Nanomaterial saturable absorber (SA) based fiber laser has developed into a potential technology as nanomaterials exhibit excellent optical properties, including broadband optical response, fast relaxation, and high nonlinearity [
3,
4]. Till now, several types of pulse shapes have been demonstrated, such as conventional soliton (CS), dissipative soliton (DS), and noise-like pulse (NLP) [
5,
6,
7,
8,
9,
10,
11,
12]. Among them, CS with a hyperbolic secant temporal profile generated in the anomalous dispersion regime is practically useful in optical soliton communications [
13]. NLP with sub-pulses in different phases and amplitudes generated in normal or anomalous dispersion regime has potential applications in optical coherence imaging and micro-machining process [
14]. DS with linear chirp and high pulse energy that is compressible into high peak power and narrow pulse duration is in demand in nonlinear optics [
15].
Since applications may not only require a particular type of USP but also their combinations in one period, switching the operation states of USP from each other in a single fiber laser is critical. From a fundamental point of view, USP can be regulated by the nonlinear absorption of SA, namely, the saturable absorption effect (SAE) and reverse absorption effect (RAE) arisen from the third-order susceptibility under the incident light field [
16,
17,
18,
19]. Their differences lie in the reduction of absorption at high intensities for SAE whereas RAE increases. SAE is also a process of filling near the stages of the conduction and valance bands which is cataloged as accumulative nonlinearity [
20]. In contrast, RAE is an instantaneous nonlinearity (e.g., two-photon absorption effect) that is always triggered in relatively high intensity compared to SAE [
21]. The correlation between SA properties and USP behaviors has been revealed in several studies. For instance, H. Xu et al. reported the reduction of USP pulse duration with increasing SA modulation depth, indicating the stabilization and regulation of SAE on the USP behaviors [
18]. Q. Wang et al. achieved the transformation between DS and NLP in a CNT-SA fiber laser operating in normal dispersion regime, owing to the trigger of RAE in higher pump power and the restriction on further USP peak power increasing [
22]. The switch between DS and DS resonance using RAE is also possible in the normal dispersion regime. These indicate a nanomaterial-based SA with RAE in relatively low intensity can switch the USP operation states in a fiber laser oscillator.
Recent advance on nanoscience has offered a wide range of selection for such saturable absorber, from the classical graphene [
20], carbon nanotubes (CNT) [
23], topological insulators [
24], black phosphorus [
25], transition-metal dichalcogenides [
26,
27], to more recent MXene and bismuthene [
28,
29]. Among these, CNT possesses a two-photon absorption (TPA) effect to respond to RAE in high peak power conditions, as well as a substantial nonlinear scattering loss from its quasi-one-dimensional cylindrical nanostructure. Based on both nonlinear effects, CNT is highly competitive to introduce RAE into one fiber laser system with relatively low peak power [
30,
31]. Introducing RAE through CNT-SA into a fiber laser is practical to transform the USP operation states between CS and NLP that has never been explored. To properly integrate CNT-SA in a fiber laser, side polishing and tapered fiber integration methods are both utilized in the evanescent field, which decays exponentially to interaction distances [
32,
33,
34]. Comparatively, the SA integration method with free-standing polymers is more suitable since it acts directly on the laser and enhances the RAE in relative low peak power conditions [
35].
In this article, we demonstrated the production of conventional soliton and noise-like pulse with monolayer and bilayer CNT-SAs in an Er-doped fiber laser in anomalous dispersion regime, for the first time. The saturable absorption effect and reverse absorption effect enabled the transformation of USP operation states. Further numerical simulations verified the essential correlation between nonlinear behaviors and operation state transformations.
2. Experimental Results
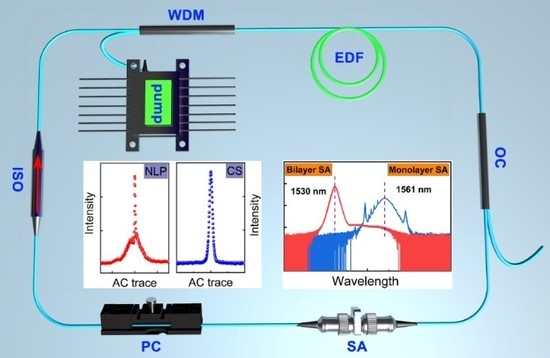
Figure 1 is the schematic of the passively mode-locked Er-doped fiber laser based on CNT-SA. The laser implements a ring cavity configuration, using Er-doped fiber (Liekki, Er110-4/125, 30 cm, nLIGHT, Vancouver, Wash., USA) as the gain medium. A 980 nm laser diode was used as the pump source through a wavelength division multiplexer (WDM, 980/1550 nm, Connet, Shanghai, China). Laser operation direction was ensured by a polarization-independent isolator (PI-ISO, 1550 nm, Connet, Shanghai, China). Cavity polarization and intra-cavity birefringence were regulated by a polarization controller (PC, Connet, Shanghai, China). Output power was controlled by the 10% intensity fiber output coupler (OC, Connet, Shanghai, China). CNT/PVA hybrid film as a SA was assembled between two fiber ferrules by the sandwiching structure. For CNT-SA preparation, single-wall carbon nanotube powder was purchased from XFNANO, and polymer fabrication method was similar to previously reported [
36]. The cavity length and net cavity dispersion were 6.5 m and −0.023 ps
2, respectively.
A stable mode-locking was self-started without adjusting the PC when ML CNT-SA inserted into the flange with a pump power of 40 mW. The pulse characteristics are demonstrated in
Figure 2. The pulse duration is 439 fs with a sech
2-pulse assumption as shown in
Figure 2a. In
Figure 2b, the spectrum is centered at 1560 nm with a 3-dB bandwidth of ~5.3 nm, and the Kelly sideband indicates it is typical conventional soliton. Pulse trains and radio frequency (RF) spectrum are correspondingly illustrated in
Figure 2c,d. The pulse period is 32.5 ns and fundamental frequency is 28.7 MHz, both of which depend on the cavity length and the signal-to-noise ratio (SNR) of the RF spectrum is about 73 dB, which shows the mode-locking is very stable.
The pulse width increases from 439 fs to 628 fs with the increase of pump power. However, limited by the soliton area theory, further increasing the pump power results in the burst of following pulse trains into bound soliton state. These CS behaviors associated with increasing pump power autocorrelation trace (AC) and corresponding spectra evolution are presented in
Figure 3a,b. We notice that the two bound solitons always exhibit fixed, discrete temporal separations, and the phase difference is always about π where the interaction optical spectra own a dip in the center of the spectra, as shown in
Figure 3b3.
In order to confirm the feasibility to switch pulse operation states by significantly changing the SA parameters, we assembled the bilayer CNT-SA in the flange without other modifications. Typical pulse duration and optical spectrum generated by BL CNT-SA are demonstrated in
Figure 4a,b. Intriguingly, the spectrum has a triangle shape and the Kelly sideband is not observed. The measured AC trace changes from sech
2-shape to NLP shape whose AC trace has a unique characteristic of a narrow spike on top of the broad pedestal. The NLP spike widths remain nearly unchanged at 1.75 ps with increasing pump power (inset of
Figure 4c) while NLP pedestals broaden from 15 ps to 98 ps. The NLP spectra are centered at 1531 nm as a triangle shape and the 3-dB bandwidth gradually broadens with higher power in
Figure 4d. The above results prove the ability to transform the pulse operation states in an Er-doped fiber laser by changing CNT-SA parameters.
We first performed a balanced intensity scan twin-detected method (I-scan) to distinguish the correlation between CNT-SA parameters and output characteristics, where the CS generated, abovementioned, was set as a seed laser and injected into an amplifier. Detailed configurations are demonstrated in
Figure 5. The amplified laser was set as a test source of the I-scan technique to acquire the same intracavity power scale of the CNT-SA mode-locked fiber laser generated. The pulse duration associated with optical spectrum of the amplifier was kept identical in the ML CNT-SA mode-locked fiber laser. Transmittance curves functioned with peak power using ML and BL CNT-SA are shown in
Figure 6 and fitted by the saturable absorption formula:
where
T represents the transmission,
αns is the non-saturable loss coefficient,
α is the modulation depth,
β is reverse absorption coefficient,
Isat is the saturable intensity, and
I is the incident laser intensity. By fitting the experimental data, the estimated ML CNT-SA modulation depth is about 3.1%,
Isat is 50 kW, and
αns is 41.5%, respectively. The estimated BL CNT-SA modulation depth is about 4.7%,
Isat is 38 kW,
β is 2.68 × 10
−4 W
−1, and
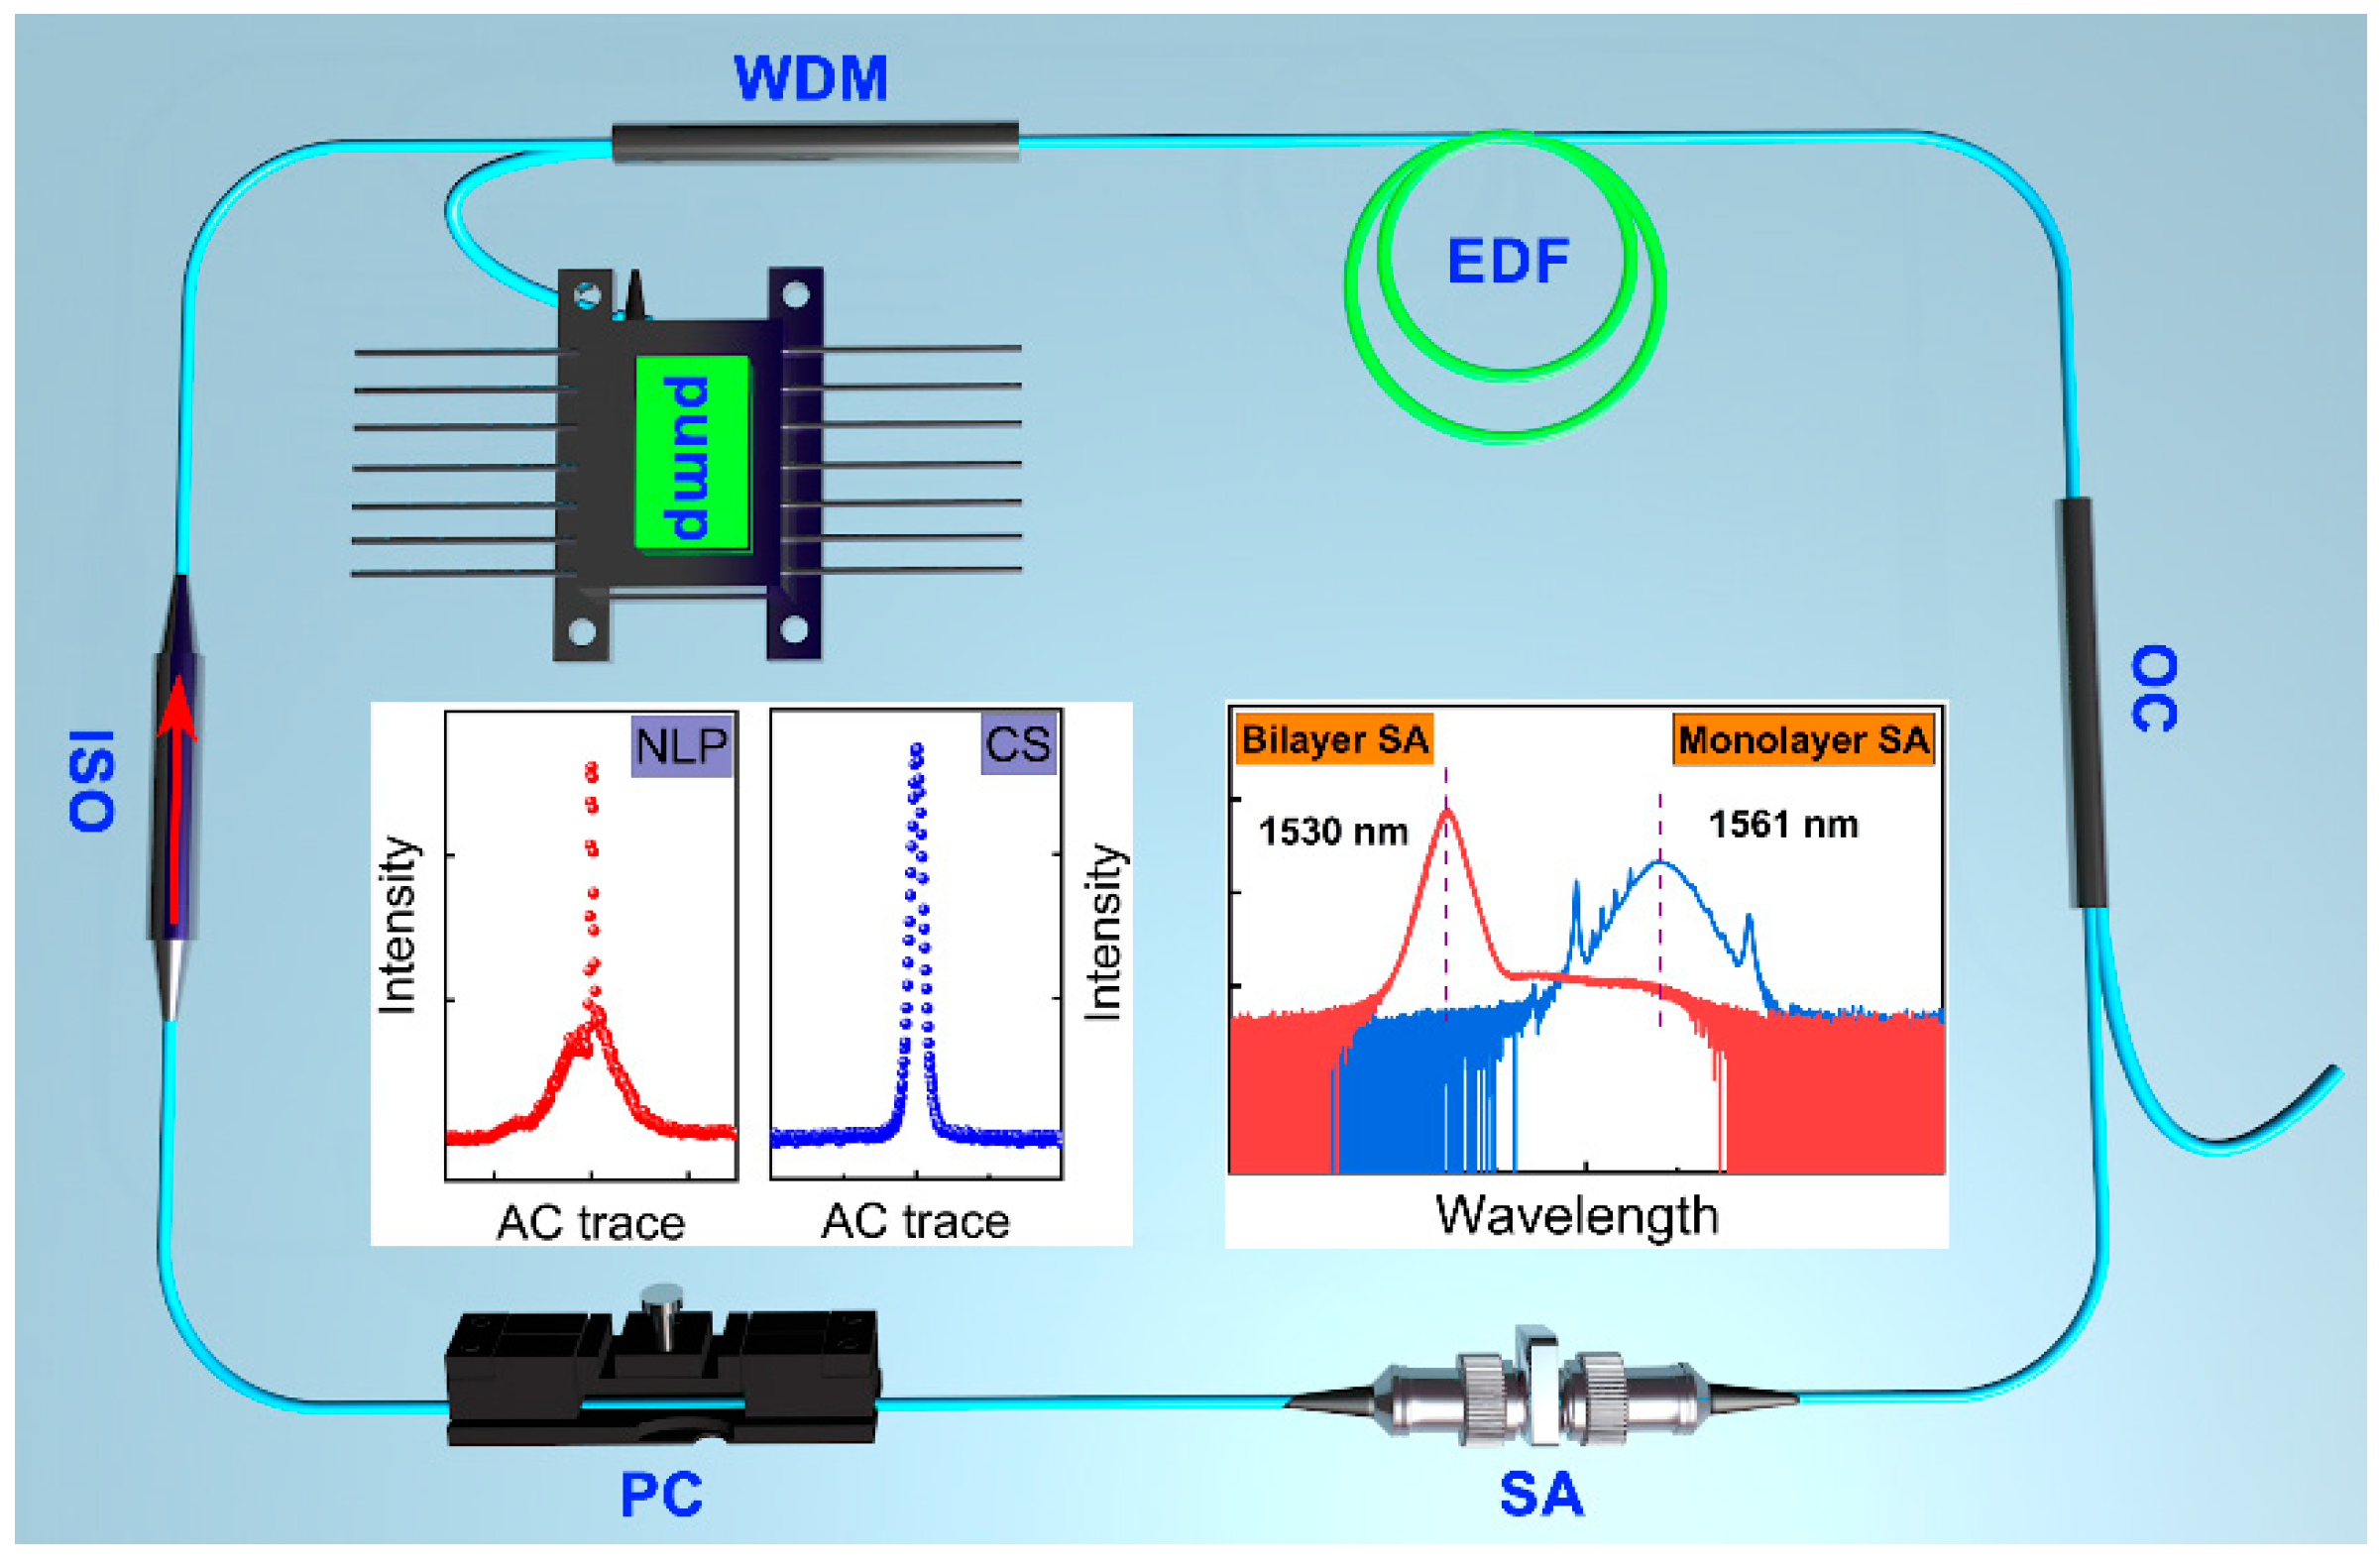
αns is 61%, respectively. These results indicate different modulation depths and linear losses in the ML and BL CNT-SA configurations. Specifically, BL CNT-SA owns the ability to introduce reverse absorption coefficient into the laser cavity, whereas ML CNT-SA does not. The reasons can be concluded that single-wall CNT has large scattering loss than other nanomaterials, thus enhancing the nonlinear scattering loss with more CNTs. Meanwhile, the two-photon absorption effect of single-wall CNT will also excite reverse absorption coefficient. Both are considered as primary factors leading to the transformation from CS to NLP with BL CNT-SA setup. To be honest, polyvinyl alcohol (PVA) has a relatively lower thermal threshold compared to CNT nanomaterial, high peak power pulses may degrade the PVA polymer hence decreasing the laser transmittance ratio. These mechanisms of CNT polymer matrix may give an inspection of why ML-CNT and BL-CNT could respond to different transmittance curves in experiments. To decrease the possibility of PVA degradation, long time CS and NLP output stabilities were tested in experimental as shown in
Figure 7a,b.
3. Simulation Results
From above experimental data, we conclude a saturable absorber with lower modulation depth and no reverse absorption enables the generation of CS, where a saturable absorber with larger loss and reverse absorption leads to NLP. This provides the tunability of pulse-type in one laser system by modifying the SA parameters.
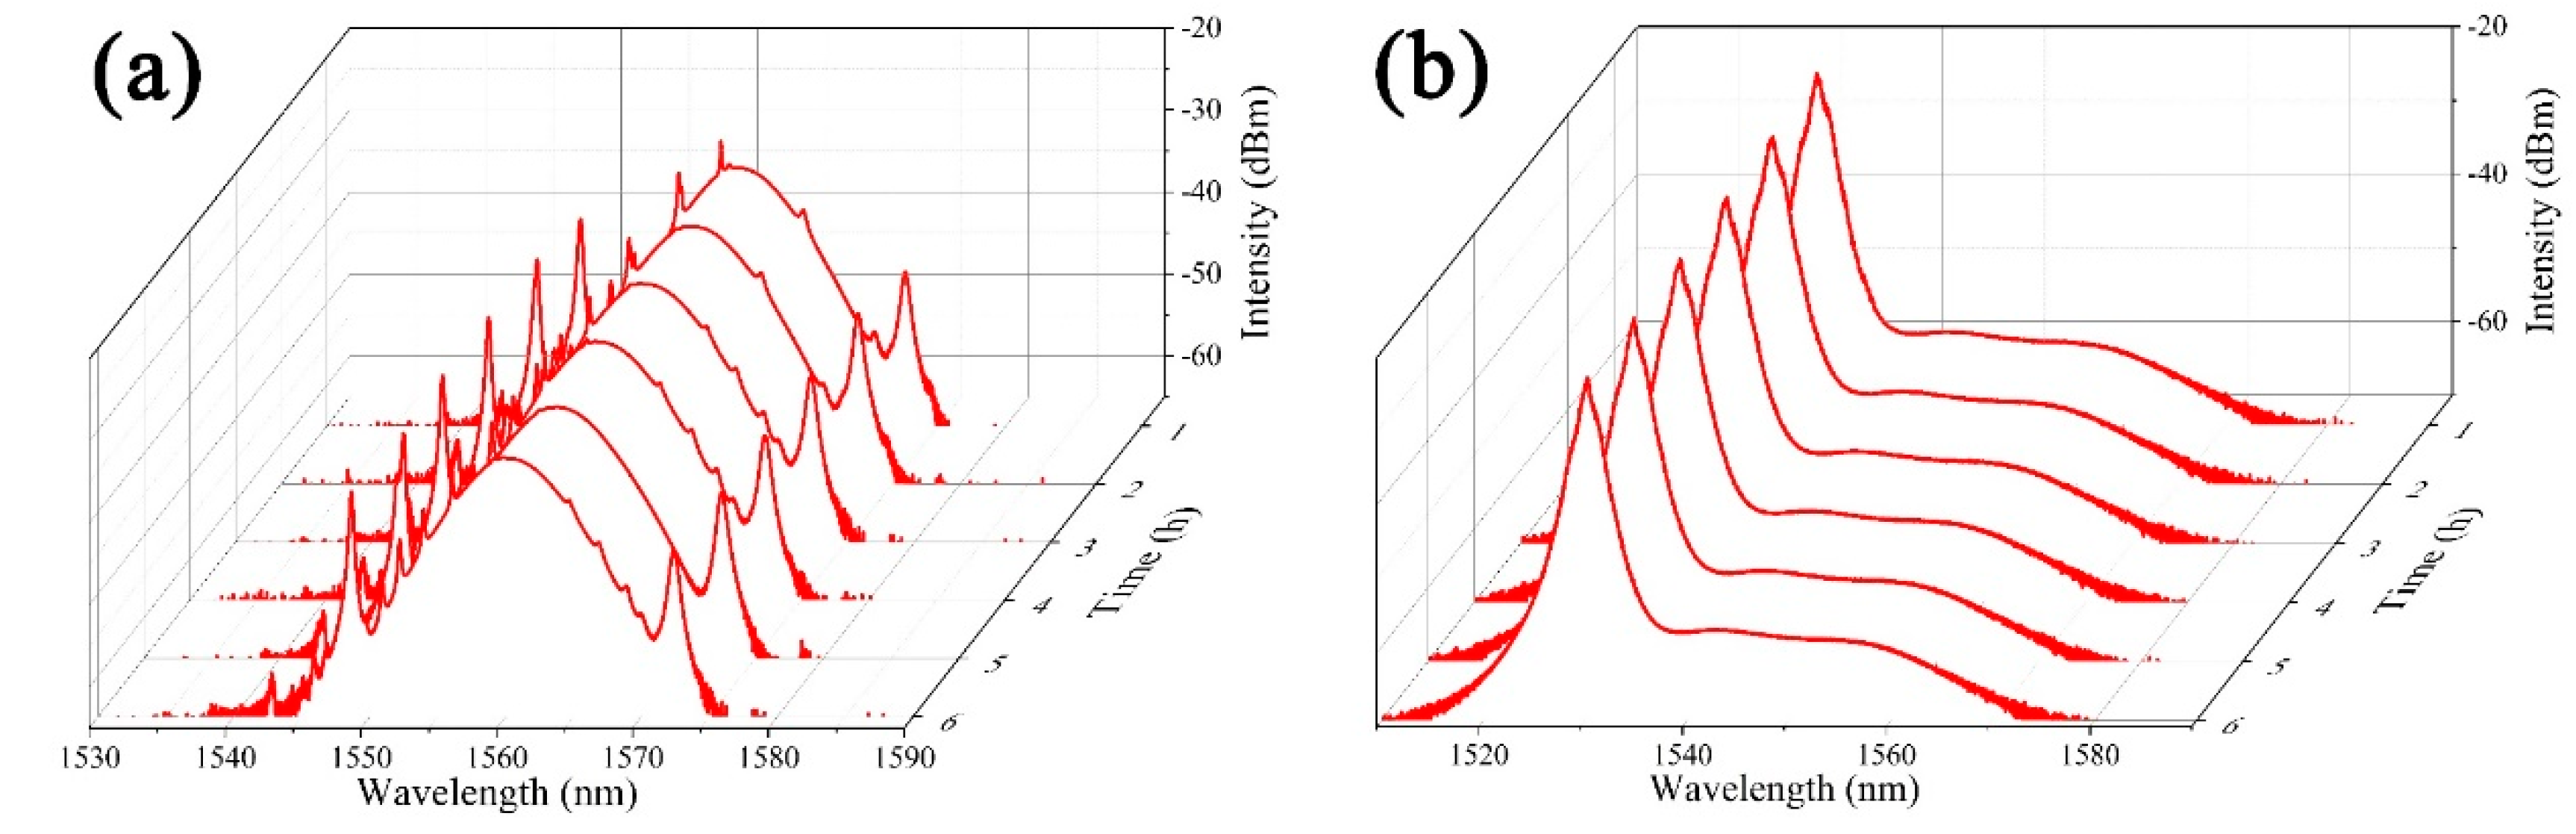
A simulation was then conducted to explain the influence of the SA parameters on laser performance. The simplified numerical model of cavity setup is shown in
Figure 8 with a piece of Er-doped gain fiber (EDF), three segments of single-mode fiber (SMF1, SMF2, and SMF3), an optical coupler (OC), a wavelength division multiplexer (WDM), and a saturable absorber (SA). The cavity parameters in simulation are estimated from experimental data which were shown in
Table 1, including the same cavity length, relative position of each device, and the same net cavity dispersion. Saturable coefficient and reverse absorption coefficient are described by the transmittance function in Equation (1). To simulate the transformation of pulse operation states in the fiber laser, coherently coupled nonlinear Schrödinger equation (NLSE) including dispersion, nonlinearity, gain, and loss was used as the master equation to describe the pulse propagation in the fiber system (Equations (2) and (3)).
where A denotes the slow varying amplitude of the pulse envelope, z is the propagation distance, t is the pulse local time. β
2 and γ are group velocity dispersion (GVD) and fiber nonlinear coefficient. g, g
0, and Ωg denote gain function, small-signal gain coefficient, and gain bandwidth in Equations (2) and (3), respectively. Such simulation can provide insights on the evolution of laser performance with SA parameters and explain the experimental pulse operation states transformation.
It should be mentioned that the positions of Kelly sidebands in the optical spectrum reflect the cavity dispersion, despite that the positions of these soliton sidebands could be slightly affected by the amount of chirp acquired by the pulse [
37,
38]. The total cavity dispersion is estimated by the following Equation (4) with experimentally observed parameters, including the central wavelength, the first-order Kelly sideband separation, Δλ
1 = 4.0 nm, and the soliton pulse width t = 439 fs,
where N is an integer, D is the average cavity dispersion parameter, L is the fiber length. The estimated total cavity dispersion is 0.03 ps nm
−1. The total cavity dispersion comprises the fiber dispersion and the material dispersion from ML and BL CNT-SA. Thereafter, the material dispersion from CNT polymer could be roughly deduced as:
Variable parameters including β
2, g
0,
, I
sat, and β were set as −12.2 ps
2/km, 15 m
−1, 0.15, 50 W, and 0 W
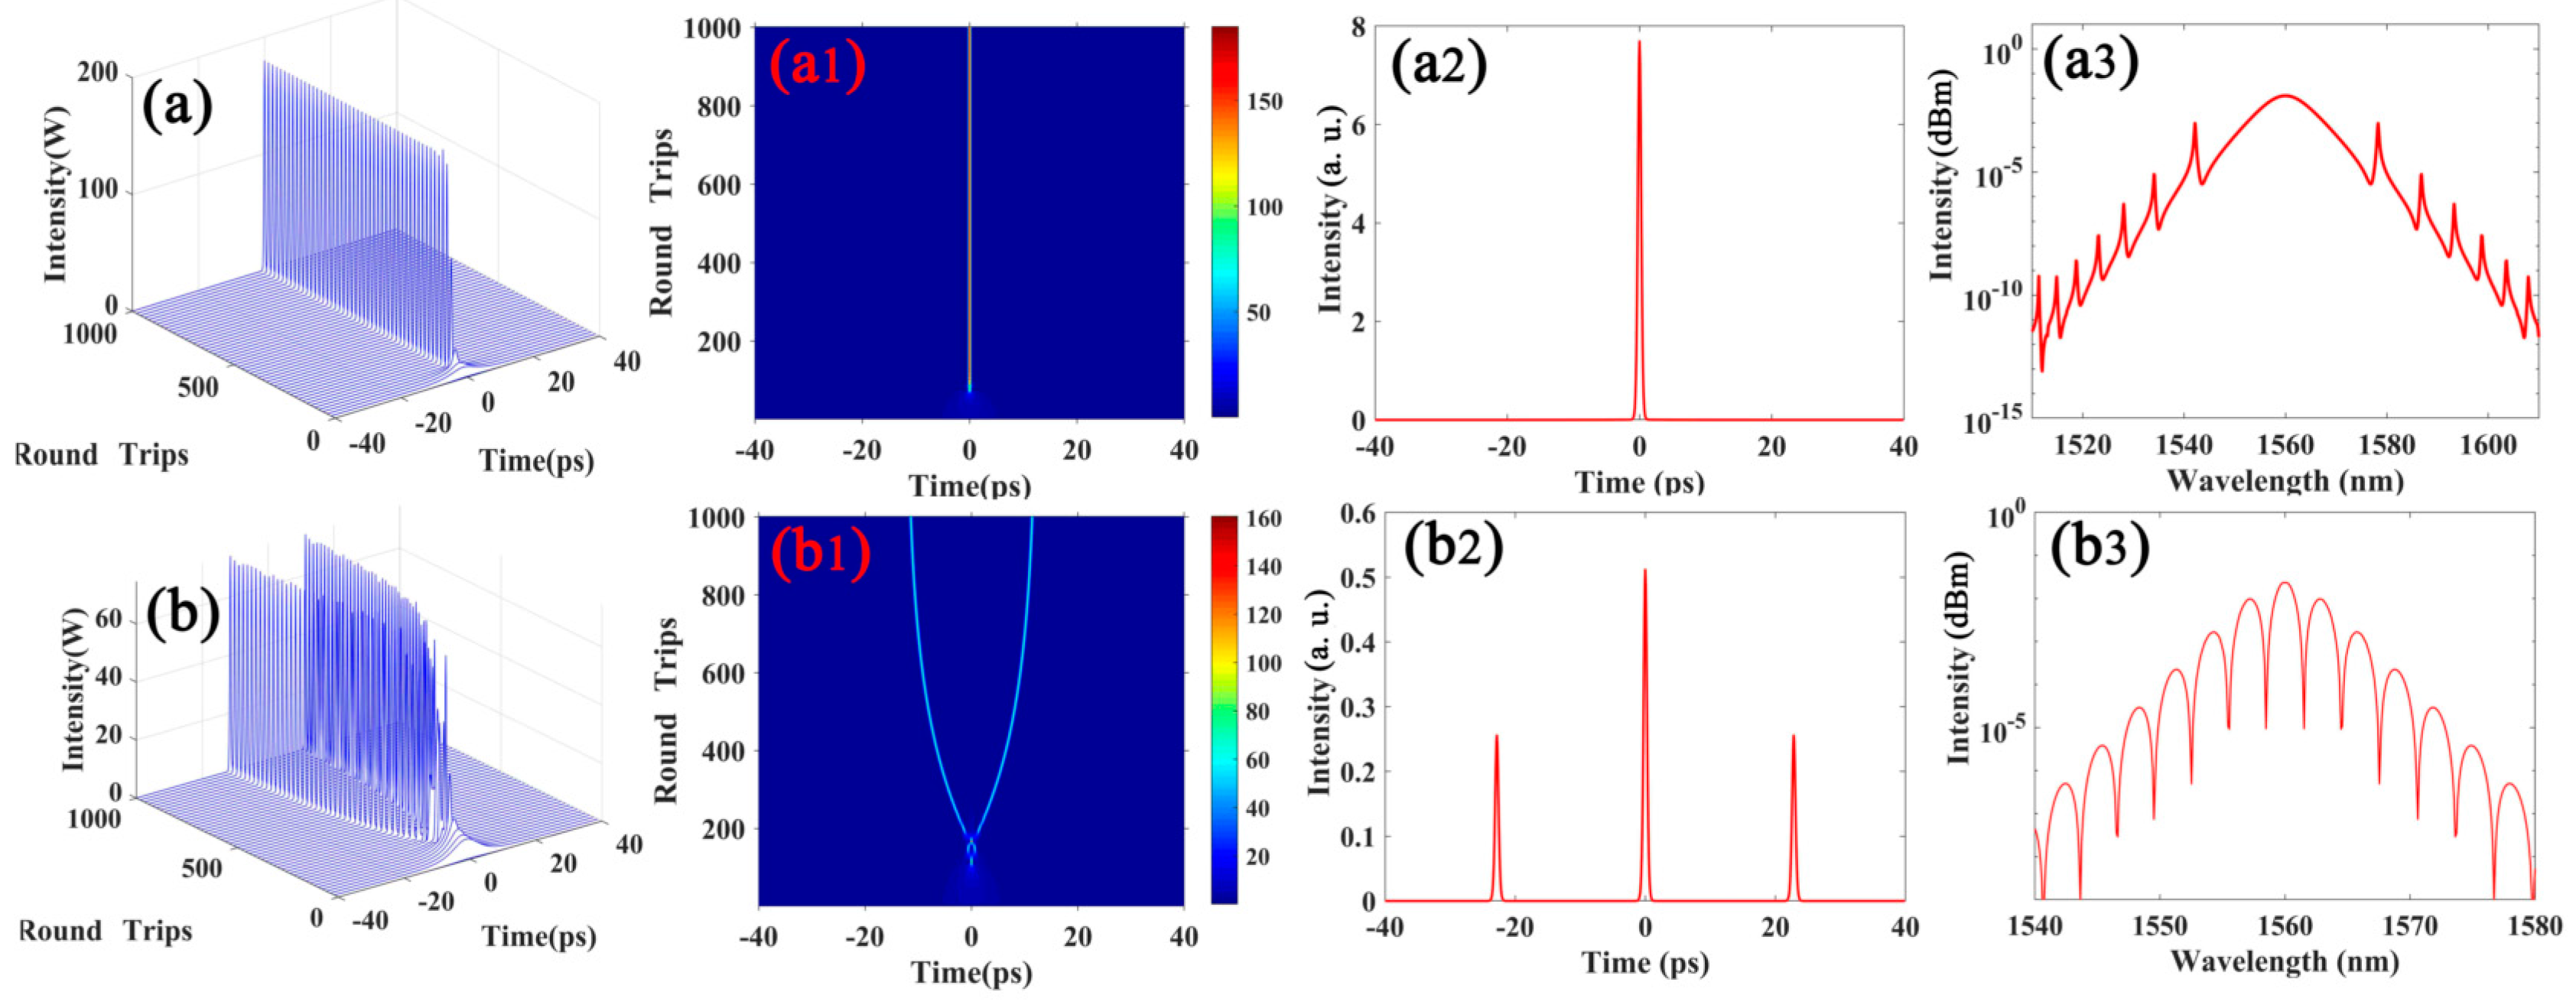
−1 to simulate the CS formation process, while the initial pulse condition was set as 10 ps chirp-free pulse and the ML CNT-SA parameters were used. Stable CS can be generated in the simulation in
Figure 9a. The time domain evolution, AC trace and spectrum of the generated CS are shown in
Figure 9a1–a3, respectively. Increasing the value of gain coefficient g
0 to 20 m
−1 results in splitting of single pulse split into two (so-called two-bound soliton state) in
Figure 9b. The corresponding pulse information including the evolution map, AC trace, and optical spectrum of two-bound soliton are presented in
Figure 9b1–b3, respectively. These simulated results indicated that SA with saturable absorption effect could induce the formation of CS pulse.
To simulate the BL CNT-SA, two primary factors should be considered: the introduction of reverse absorption coefficient (β was set as 0.0015 W
−1) and higher value of normal dispersion (−0.3D from Equation (5)). Stable mode-locking NLP pulse evolution generated in the fiber laser is demonstrated in
Figure 10, with various gain coefficients (g
0 = 70 W
−1, 100 W
−1, and 150 W
−1, respectively). By increasing the gain coefficient from 70 to 150 W
−1, the NLP envelope broadens while the NLP spike remains nearly unchanged. These simulation results are in accordance with experimental results, illustrating the critical effect of reverse absorption in the NLP pulse operation state formation.
4. Discussion
The evolutions of pulse envelope and chirp, together with the corresponding optical spectra and SA transmittance curves, were carefully studied in
Figure 11 to reveal the influence of reverse absorption coefficient on the NLP formation process. Numerical simulation of the NLP formation process in different roundtrips was depicted in four typical stages: (a) pulse amplifying, (b) peak power clamping, (c) pulse instability, and (d) NLP envelope stability. First, in stage a, the initial pulse is amplified in the first 11th roundtrips with a gaussian shape in
Figure 11a, where its peak power is not sufficient to trigger the reverse absorption regime. In stage b, the next 12th to 140th roundtrips revolution, the pulse time domain is narrowed down by anomalous dispersive effect and the SA saturable absorption modulation, showing a typical broadened optical spectrum from SPM in
Figure 11b3. The enhanced peak power in the SA transmittance curves triggers off the reverse absorption regime, rising the peak power clamping effect. In stage c, further narrowing pulse induces a significant increase in peak power, which induces the pulse time domain instability in
Figure 11c1 in return. The SA transmittance curves record tiny pulse generation in pulse envelope, and the parasitic tiny pulse further enhances the single pulse shape instability and bursts into noise like pulse regime. Finally, in stage d, the NLP pulse time domain gradually broadens to decrease high nonlinearity from SPM and reverse absorption effect, as a balance among the SPM, dispersion, saturable absorption, and reverse absorption effects in this laser system. The final evolution state exhibits a rectangle shape pulse with free chirp as shown in
Figure 11d1. The above simulation results demonstrate the ability of reverse absorption to switch the pulse state from single pulse to NLP through restricting the peak power infinite increase in the anomalous dispersion regime.
The NLP envelope characteristics are directly corresponding to the reverse absorption mechanism. To figure out the relationship between NLP characteristics and reverse absorption effect, the variations of intracavity NLP features (including pulse energy, peak power, and pulse duration) are analyzed in
Figure 12. In one round intracavity trip, the pulse energy increases from the EDF component then decreases through the OC and SA components. The remaining SMF component has no energy consumption. Under this situation, the peak power largely increases through EDF and monotonically increases through the OC and SA consumption components. It is clear that the SA component with reverse absorption is mainly responsible for the decrease in the intracavity peak power. Compared to the intracavity peak power evolution, the pulse duration evolution is slightly monotonically decreased through the whole position in cavity except for the EDF component. To further reveal their relationships on the NLP pulse characteristics, the comparisons in pulse energy, peak power, and pulse duration with modified relative gain coefficient and reverse absorption coefficient are provided in
Figure 12. Increasing the gain coefficient from 70 to 150 m
−1 with identical reverse absorption coefficient (0.0015 W
−1) leads to linearly increased pulse energies and pulse durations with nearly unchanged peak powers. Increasing the reverse absorption coefficient with identical gain coefficient (100 m
−1) produces nearly unchanged pulse energies compared to the variations in modifying the gain coefficients, together with linearly decreased peak powers and monotonically increased pulse durations in
Figure 12. These indicate that the reverse absorption can balance the intracavity time domain conventional through decreasing the peak power and broaden the pulse duration.
To further explore the noise-like pulse states in various dispersion regimes, the noise-like pulse envelopes associated with the corresponding chirps are recorded in
Figure 13a1–c1. In normal dispersion regime (the net cavity dispersion is 5.702 ps2), it is mainly transmitted in the range of pulse envelope though the disorder of the center of the dissipative soliton by newly generated frequency components. Partially disordered pulse envelopes exhibit noise-like pulse features such as the chaotic distribution of chirps and intensity auto-correlation traces with a spike in the center of pulse, as well as the feature of up-chirp trend distribution in
Figure 13a1. Different from the normal dispersion regime, high peak power excites new pulse envelope in small anomalous dispersions (−1.448 ps2) that consist of chirp-free pulses with same interval in
Figure 13b1. Pulse separation can be achieved with a decreased reverse absorption coefficient in a larger anomalous dispersion regime (−21.688 ps2) in
Figure 13c1. Compared to the small dispersion regime, the junction of two pulses has no interaction meaning that the separated pulses and pulse envelopes are different. The simulation suggests noise-like pulses generated in normal dispersion regime are compressible with an up-chirp distribution trend, whereas noise-like pulses generated in anomalous regime are incompressible.


