Article

Probabilistic Studies on the Shear Strength of Slender Steel Fiber Reinforced Concrete Structures

by
Oladimeji B. Olalusi
1,* and
Panagiotis Spyridis
2,*
1
Structural Engineering & Computational Mechanics Group (SECM), Department of Civil Engineering, University of KwaZulu-Natal, Durban 4041, South Africa
2
Faculty of Architecture and Civil Engineering, Technical University of Dortmund, 44227 Dortmund, Germany
*
Authors to whom correspondence should be addressed.
Appl. Sci. 2020, 10(19), 6955; https://doi.org/10.3390/app10196955
Submission received: 7 September 2020 / Revised: 27 September 2020 / Accepted: 30 September 2020 / Published: 4 October 2020
(This article belongs to the Special Issue Structural Reliability of RC Frame Buildings)

Abstract

:
Shear failure is a brittle and undesirable mode of failure in reinforced concrete structures. Many of the existing shear design equations for steel fiber reinforced concrete (SFRC) beams include significant uncertainty due to the failure in accurately predicting the true shear capacity. Given these, adequate quantification and description of model uncertainties considering the systematic variation in the model prediction and measured shear capacity is crucial for reliability-based investigation. Reliability analysis must account for model uncertainties in order to predict the probability of failure under prescribed limit states. This study focuses on the quantification and description of model uncertainty related to the current shear resistance predictive models for SFRC beams without shear reinforcement. The German (DAfStB) model displayed the lowest bias and dispersion, whereas the fib Model 2010 and the Bernat et al., model displayed the highest bias and dispersion. The inconsistencies observed in the resistance model uncertainties at the variation of shear span to effective depth ratio are a major cause for concern, and differentiation with respect to this parameter is advised. Finally, in line with the EN 1990 semi-probabilistic approach for reliability-based design, the global partial safety factors related to model uncertainties in the shear resistance prediction of SFRC beams are proposed.

1. Introduction

Over the years, the use of steel fiber reinforcements to improve the performance of reinforced concrete (RC) members in shear and tension has been extensively researched. Many studies have demonstrated that the inclusion of steel fiber reinforcements in concrete significantly enhances the tensile, flexural and shear capacity; improves the ductile and post-cracking behaviour and increases the energy absorption properties [1,2,3,4,5,6]. The various investigations conducted in [7,8,9,10,11,12] reported that the inclusion of fiber reinforcements in reinforced concrete beams significantly improves the shear capacity. An experimental study conducted by Rosenbusch and Teutsch [13] revealed that fiber reinforcements could potentially substitute the minimum stirrups required in conventional reinforced concrete members to ensure a ductile failure. The presence of steel fiber reinforcement in concrete enhances shear resistance by resisting and redistributing inclined tensile stresses along the diagonal cracks, improves post cracking resistance capacity and reduces the diagonal crack width and spacing. The reduction in the crack spacing suggests that the inclusion of steel fibers could result in a possible reduction or elimination of the size effect in beams without stirrups, where shear capacity decreases with increasing beam effective depth [8,14,15]. The efficiency of steel fiber reinforcements to increase shear capacity depends on several factors which include the fiber properties, fiber content and bond stress versus slip response of fibers [8]. Other parameters affecting the shear resistance of SFRC beams consist of the effective member depth d , the concrete compressive strength f c , the aggregate size d a g , the shear-span to effective depth a / d , and the longitudinal reinforcement ratio ρ [16]. The a / d has been shown to significantly influence the failure mode and mechanism of reinforced concrete structures [17]. Three patterns of shear failure—diagonal-tension, shear-tension and shear-compression—have generally been observed when steel fiber reinforcements are used in beams with or without stirrup reinforcement [8].
Despite the numerous studies and findings, the behaviour of SFRC beams in shear remains a complex phenomenon that requires further attention. Shear failure poses a crucial safety issue since it may develop swiftly with no prior signs of damage. Consequently, shear design provisions should be reliable and accurate. Numerous design expressions have been introduced in the current design standards [18,19,20] and literature [21]. However, developing a precise and acceptable design formulation for shear capacity of SFRC beams is still an evolving process. A summary of most of the proposed shear design models for SFRC beams without stirrups in current literature and design guidelines can be found in [21]. Majority of the existing shear design formulations are either empirical or semi-empirical based, except for the models based on the Modified Compression Field Theory (MCFT) [22,23], the Dual Potential Capacity Model [24], plasticity-based models [25,26] and the modified Multi-Action Shear Model [27]. The comparison of the various SFRC shear resistance models, as presented in [21,27], indicate the difficulty and complexity of the accurate prediction of shear capacity of SFRC beams. Not only do the resistance predictions of the various procedures differ from each other, but they also vary from the experimentally observed shear strength. Given these disparities, adequate quantification and description of model uncertainties taking into account the differences between the predicted and the measured shear resistance is crucial, especially for reliability-based analysis.
Structural engineering design is performed under a certain degree of inherent uncertainty. The influence of such uncertainties is quantified and accounted for using statistical and probabilistic approaches [28,29]. In reliability analysis, uncertainties must be adequately considered in order to predict the probability of failure under prescribed limit states [29,30]. Uncertainties in structural engineering can be classified into two sources, namely aleatory (inherent random variability) and epistemic [28]. The aleatory uncertainty is due to the natural randomness and intrinsic variability of variables peculiar to a specific structural problem. These are uncertainties that cannot be reduced. Structural variables such as material properties, geometry and loads are treated as aleatory uncertainties. Conversely, epistemic uncertainty is due to limitations in knowledge or data and can be reduced with improved mathematical modelling or increased data collection. The model uncertainty in the mathematical formulation of a relevant limit state is considered as epistemic uncertainty [31].
Model uncertainty is a random variable describing the effects neglected in the representation of the actual structures and the simplifications in the mathematical expressions. Model uncertainty in shear prediction is significant and has been shown to dominate shear reliability performance [30]. The mean (bias) and variability of the model uncertainty are used as inputs in reliability analysis and thus, will affect the reliability performance [30]. Reliability analysis is usually performed based on a particular design situation, i.e., specific geometry, material strength and reinforcement ratio. Thus, trends in the model uncertainty bias or variability may render the overall model uncertainty not to be representative for a specific design situation, which will result in an erroneous evaluation of reliability [30].
It is noted that few studies have characterised the model uncertainties in the shear prediction models for SFRC beams (see Table 1). However, there is a lack of assessment of the consistency of these uncertainties over the range of design situations. Also, the recent developments and studies regarding the shear behaviour of SFRC beams resulted in the development of new and improved analytical formulations [27] and a new database of SFRC beams failing in shear [21]. In view of these developments, detailed treatment and quantification of model uncertainty, including the investigation of its consistency over design ranges are needed. The model uncertainty data can be used for the derivation of suitable global partial safety factors accounting for the systematic effect of model uncertainty.

2. Objectives of the Investigation

This study focuses on the quantification of model uncertainty (model bias and variability) associated to the current shear resistance predictive models for SFRC beams without stirrups and the derivation of the corresponding global partial factors, accounting for the effect of uncertainties, based on a semi-probabilistic methodology. The statistical characterisation of model uncertainties and the assessment of its consistency over the range of design situations are critical objectives, as they have a significant impact on reliability performance. The evaluation is done for three shear predictive models, namely the best estimate (mean value) model of (1) fib Model Code 2010 [20], (2) German guideline (DAfStB) [19], and (3) Bernat et al. [27] mechanical model. A summary of the predictive models, together with the assumptions made, are presented in Section 3.1. The database of experimental observation used for computing the model uncertainty is described in Section 3.2. The mean and design value assessments for the different models are conducted in Section 4. The different model uncertainty statistics were obtained by comparing observed strengths ( V e x p ) from the assembled experimental database to the mean shear predictions ( V p r e d ) obtained from the different models considered for investigation (Section 5). Statistical characterisation of model uncertainty is presented in Section 5. These include statistical evaluation of the derived model uncertainty variables (Section 5.2), assessment of their consistency over the range of design situations (Section 5.3), and selection of appropriate probability distribution (Section 5.4). Subsequently, global partial safety factors for model uncertainty are proposed, using the derived model uncertainty statistics as inputs. The partial factors are obtained using semi probabilistic method (Section 6).

3. Shear Formulations and Experimental Database for SFRC Beams without Shear Reinforcements

3.1. Shear Resistance Formulation

This section presents a summary of the current shear design provisions for SFRC beams without stirrups from design guidelines and recently published literature. The design and mean shear resistance predictions of the different procedures are compared using a database of experimental tests in Section 4.

3.1.1. German Guideline (DAfStB) [19]

The design shear resistance of SFRC beam is obtained as a summation of shear resistance of the concrete contribution and fiber contribution expressed as Equation (1).
V D A f S t B = 0.15 γ c k b w d ( 100 ρ l . f c k ) 1 3 + c f f c t , R u f b w h γ c t f
f c t , R u f = k F f k G f 0.37 f c f I , L 2 f
To obtain the values of f c f I , L 2 f , the expressions in Equation (3) are used [32]. This is also adopted in the assessment conducted in [21]
f s p f c = 0.63 f c u f + 0.288 F f c u f + 0.052 F
where b w and d is the width and effective depth of beam cross-section, respectively. k is the size effect factor. k = 1 + ( 200 d ) 0.5 2 f c t , R u f is the tensile strength of SFRC. ρ l is the reinforcement ratio. k F f is fiber orientation factor taken as 0.5 for shear. f c f I , L 2 f is the post-cracking flexural strength for a deflection of 3.5 mm. A c t f is the effective area expressed as A c t f = b w   m i n ( d ,   1.5 m ) . k G f is the fiber size factor expressed as k G f = 1.0 + 0.5 A c t f 1.7 . c f is the factor accounting for the long-term effects. F is the fiber factor. γ c is the partial factor for concrete taken as 1.5. γ c t f is the partial factor for tensile strength of fiber-reinforced concrete taken as 1.25. h is the height of cross-section.

3.1.2. Model Code 2010 [20]

The design shear resistance of SFRC beams without stirrups is expressed as Equation (4).
V M C 10 = 0.18 k b w d γ c [ 100 ρ l . f c k ( 1 + 7.5 . f F t u f c t k ) ] 1 3
where f c t k is the tensile strength of concrete without fiber, and f F t u is the ultimate tensile strength for the fiber reinforced concrete. Since the information on the tensile strength is not reported in the database considered in this investigation, f F t u is estimated similarly as the German guideline.

3.1.3. Bernat et al. [27] Mechanical Model

The proposed model for estimating the mean shear strength of SFRC beam without stirrups, according to Bernat et al. [27], is expressed as Equation (5).
V B e r n a t   e t   a l . = [ ζ ( 0.84 0.10 σ t u f c t m ) x d + 0.08 + 1.10 σ t u f c t m ] f c t m b w d
The average residual tensile stress σ t u is obtained using Equation (6)
σ t u f c t = 2 η 0 η 1 F
where x is the neutral axis of plain concrete. ζ is the size and slenderness effect factor. η 0 is the fiber orientation factor taken as 0.405. η 1 is the length efficiency factor for fiber

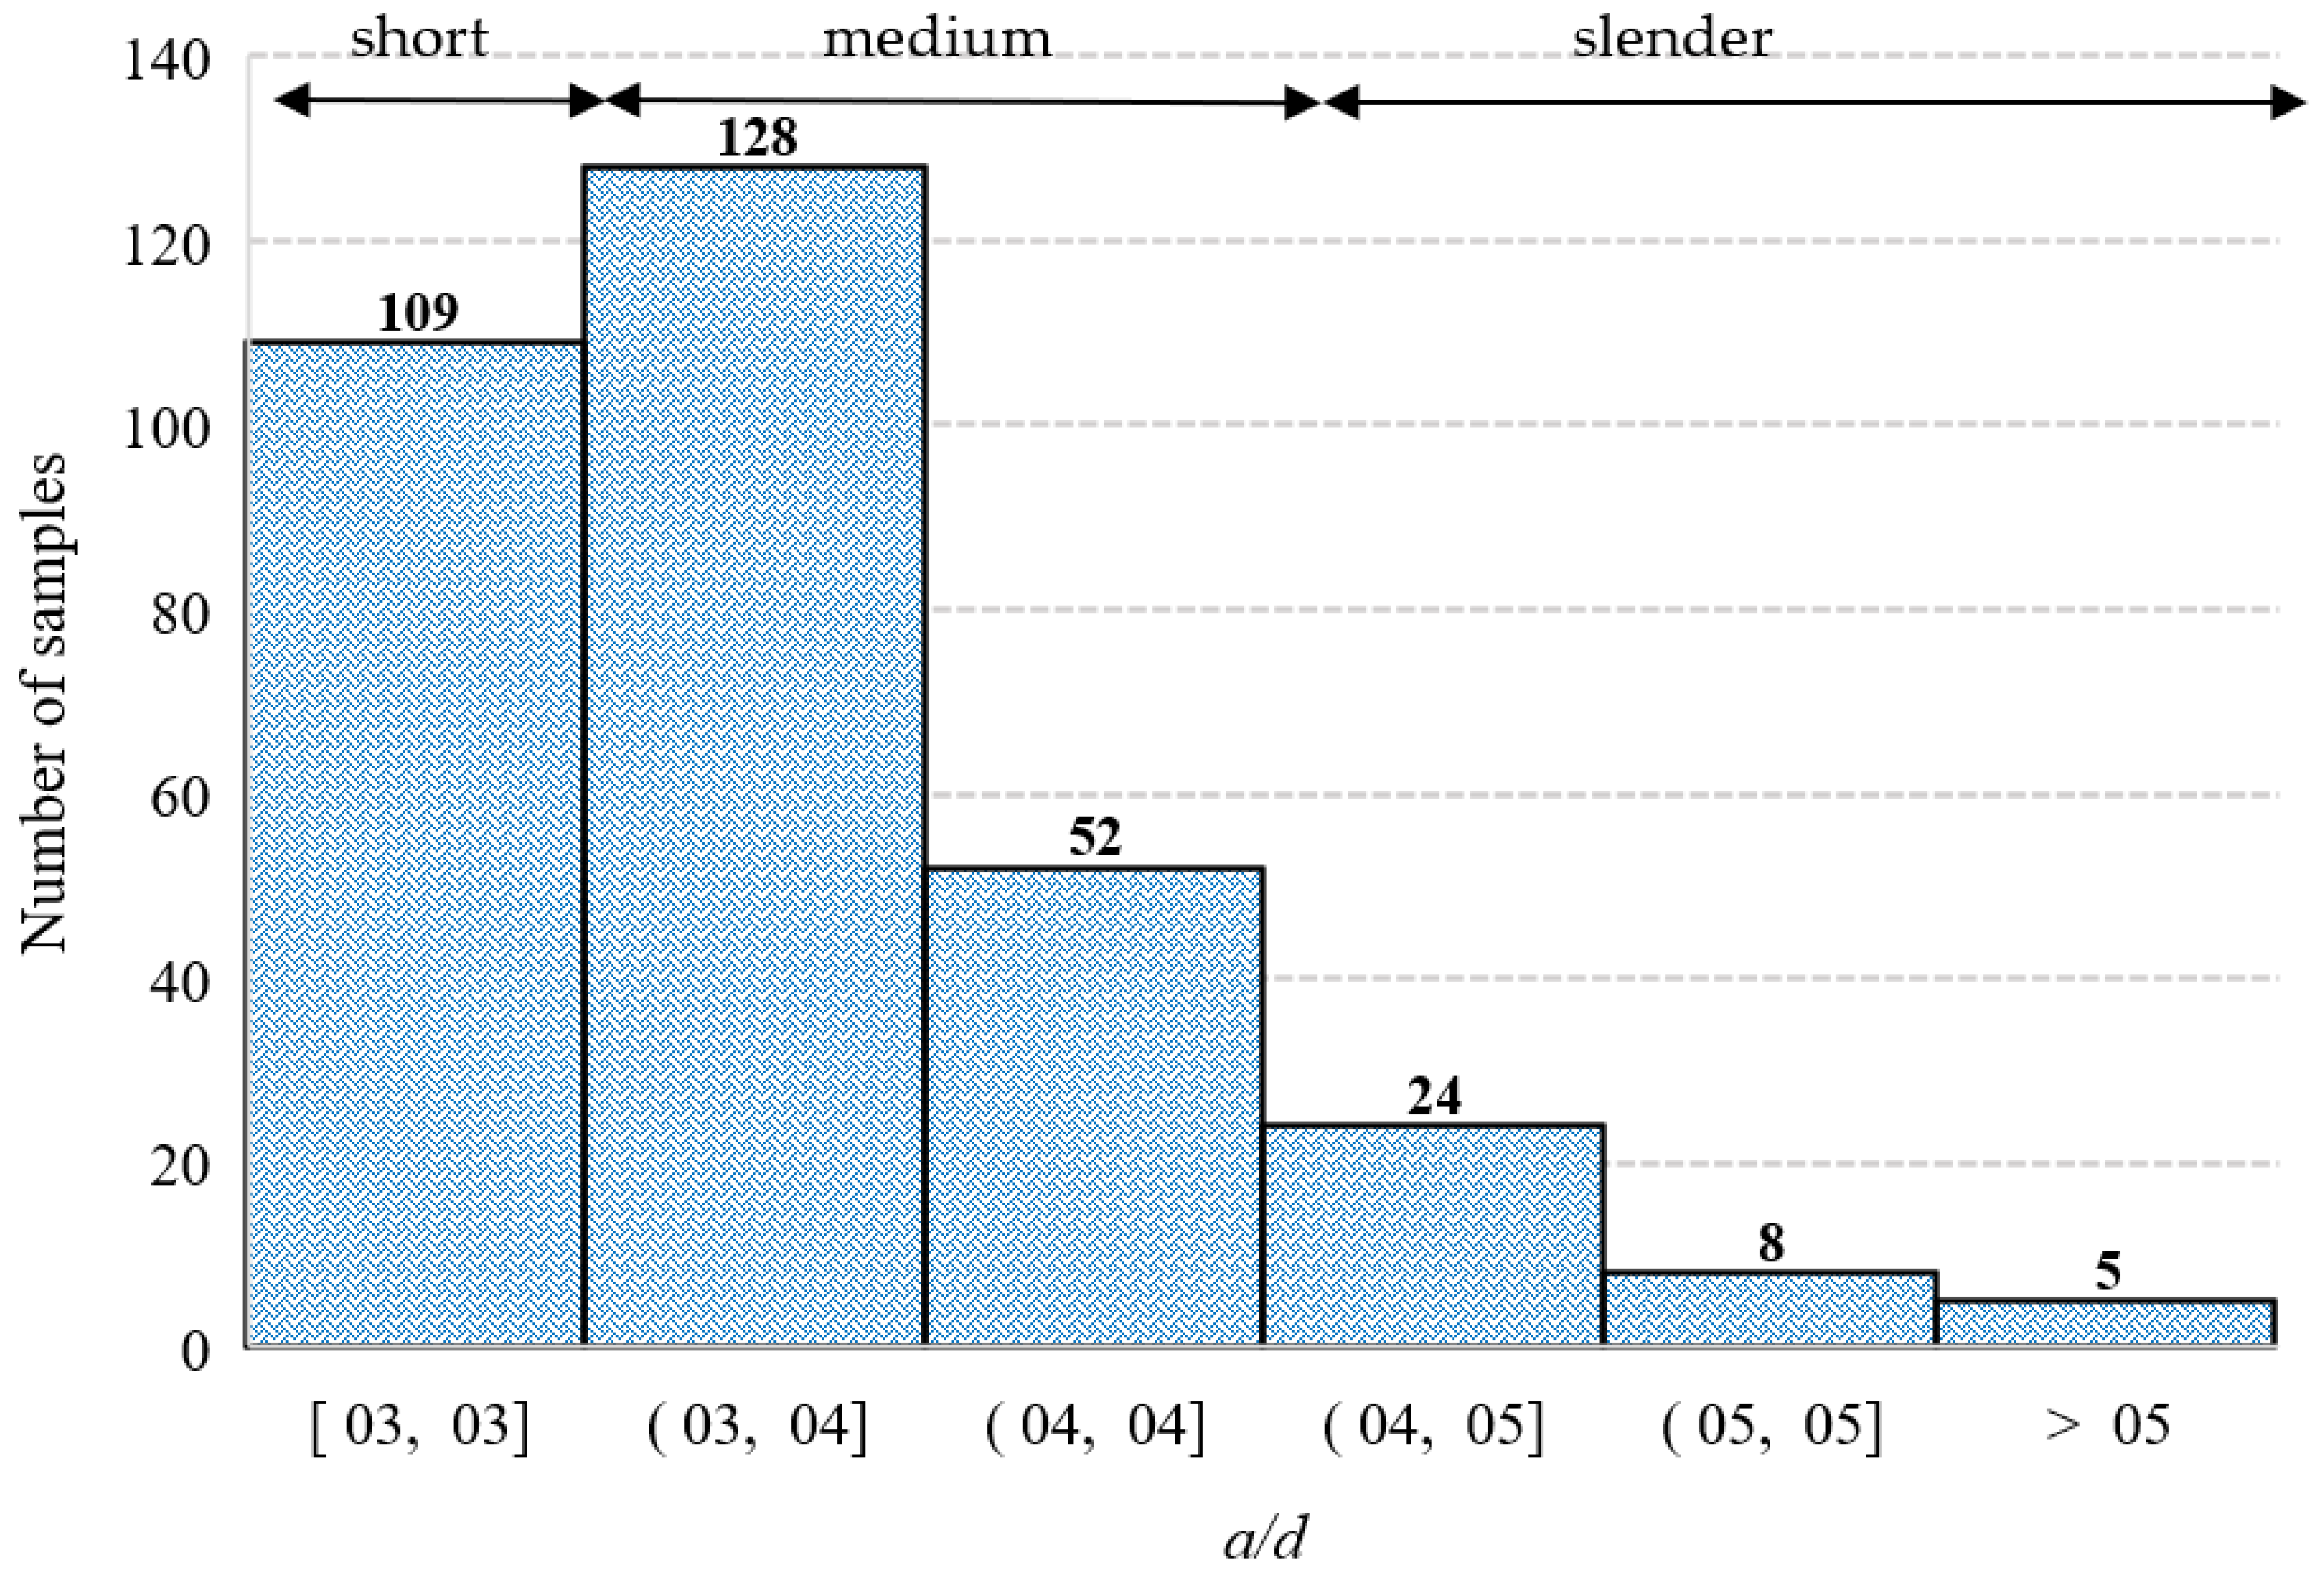
3.2. Experimental Database SFRC Slender Beams

A large database of 488 experimental studies on SFRC beams without stirrups was recently compiled by [21]. From the originally collected 488 experiments, a total of 162 beams with the shear-flexure mode of failure and shear-span to effective depth ratio a / d < 2.5 (non-slender beams) were filtered out, resulting in a subset of 326 experimental tests investigated in this study. The resulting database of 326 experiments was adopted for the analysis conducted in this study. Specimens in the evaluation database consist of slender beams with a flanged and rectangular cross-section.
All the beam specimens in the database failed majorly by shear-compression and diagonal tension and had an a / d ratio greater or equal to 2.5. The experimental database covers a wide variety of shear configurations from small to large geometry and low to high reinforcement. The statistical properties of the main parameters of the evaluation database are presented in Table 2. The main parameters include the shear capacity V R , the a / d ratio, beam effective depth d , beam width b w , longitudinal reinforcement ρ l ratio, concrete strength f c , aggregate size d a , and the steel fiber factor F s f . The steel fiber factor is a function of the percentage volume V f , diameter d f and length of fibers L f (see Equation (7)).
F s f = V f L f d f
The range of parameters of the database corresponds to what can be found in practical design situations. Although data for large beam sizes are few, the dataset is deemed representative of most real applications and of design situations covered by current design provisions.

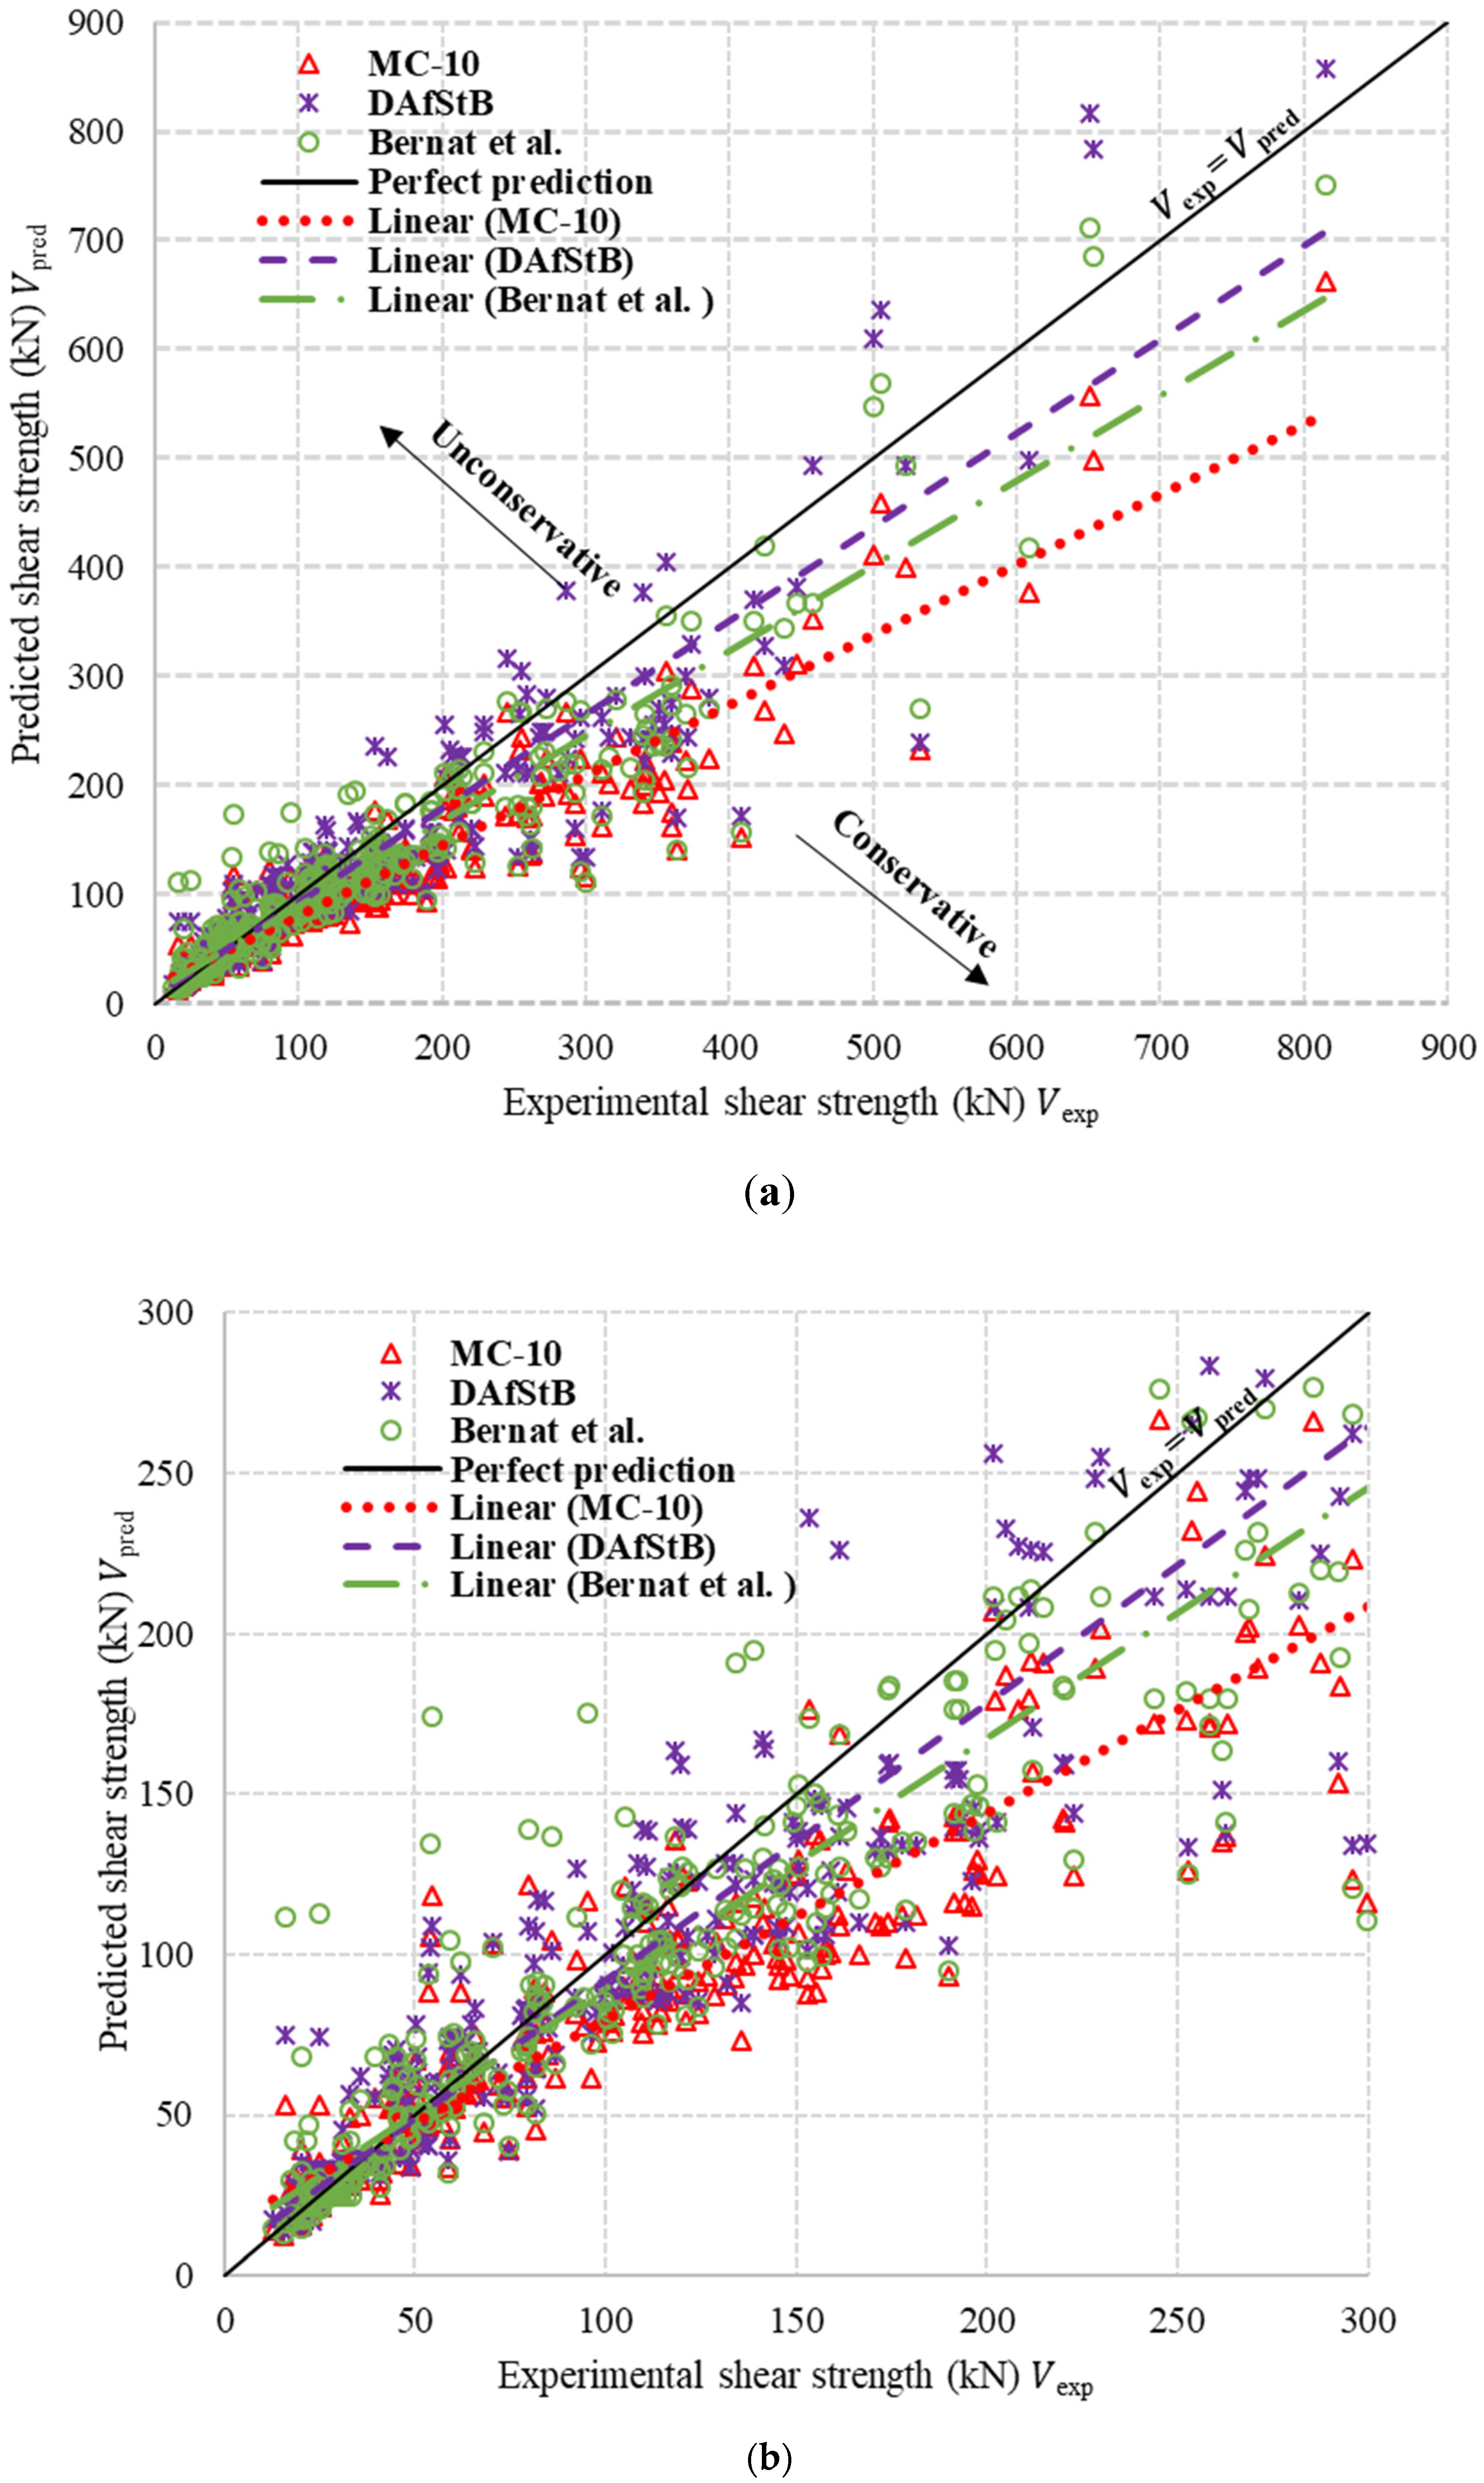
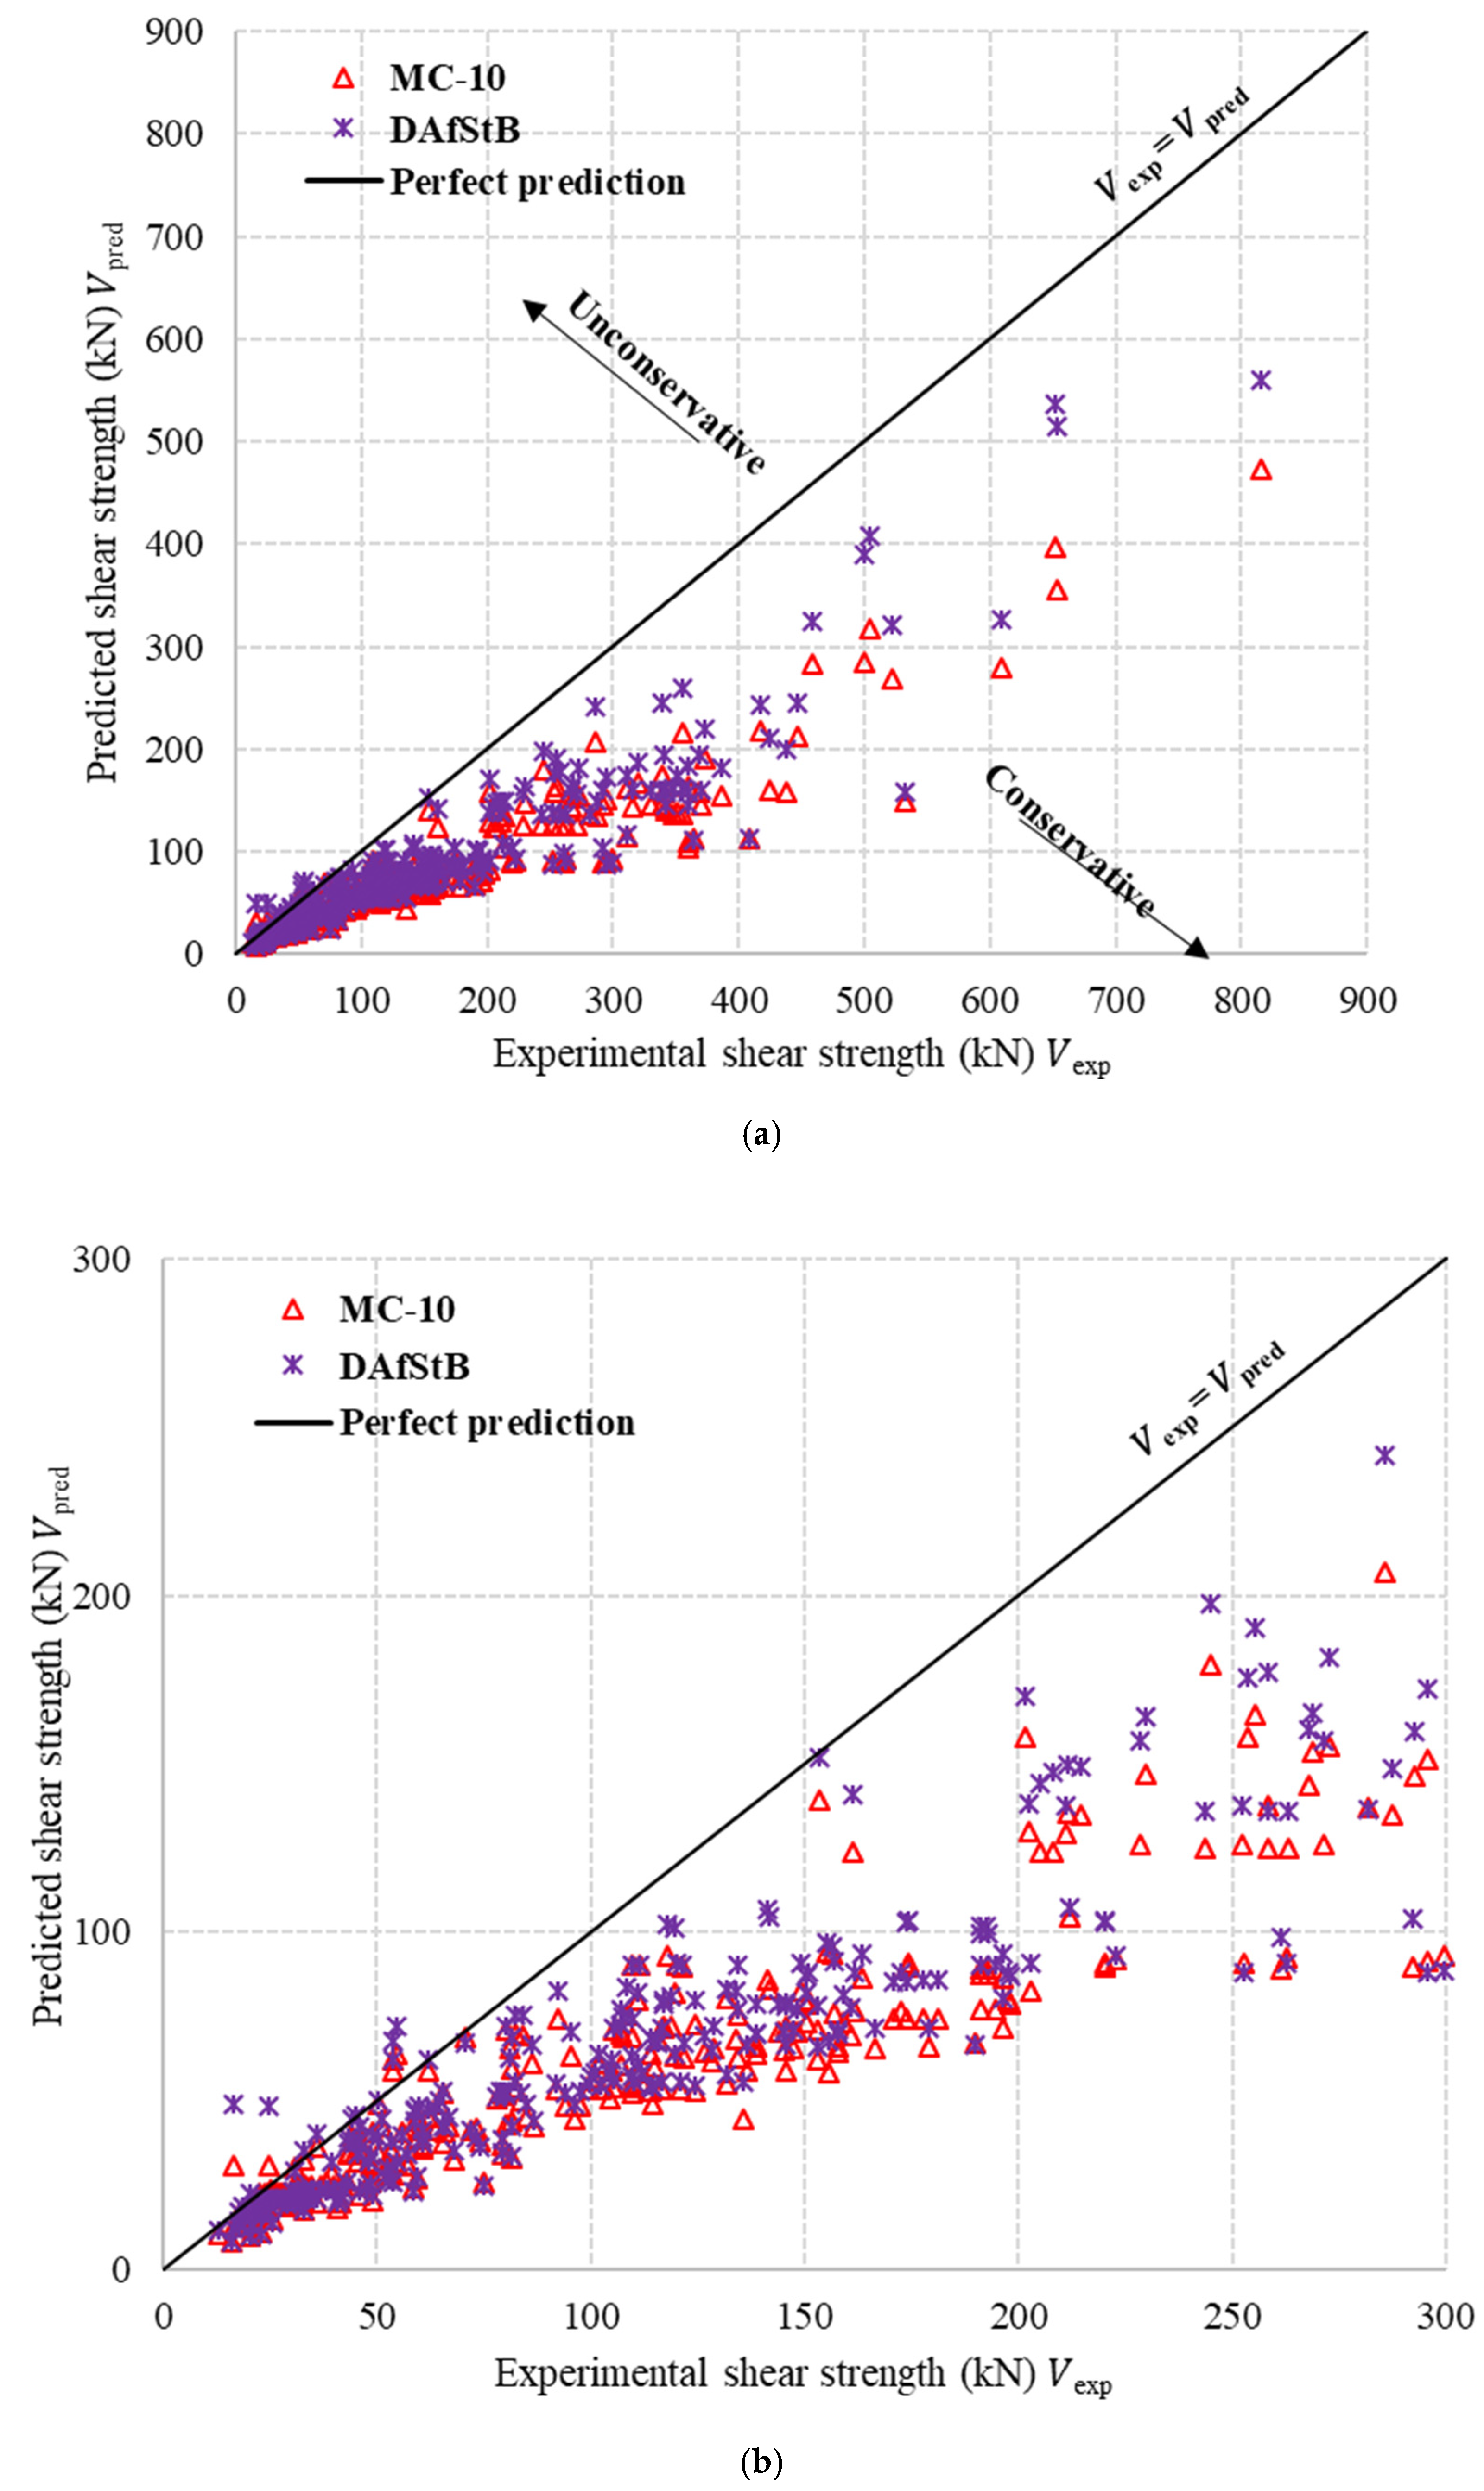
4. Deterministic Performance Assessment of Shear Design Formulations for SFRC Beams

The mean and design shear resistance obtained for MC-10, DAfStB and Bernat et al., models are compared to experimental observations as presented in Figure 1 and Figure 2. The design equations for the various models are presented in Section 2 (Equations (1)–(6)). The mean or best estimate shear resistance predictions are obtained by making all the values of the safety elements or partial factors included in the design equations equal to one, and using the mean values of their material strength (e.g., concrete strength f c m ).
The plot of the correlation between the experimentally observed shear strength V e x p and mean or best estimate shear resistance predictions V p r e d provided by the different procedures is presented in Figure 1. Generally, the predicted capacity by the various resistance models deviate from the ‘perfect line’ (defined as the point where V e x p = V p r e d ). This trend of results agrees with the observation reported in [21,27]. The trend lines of DAfStB and Bernat et al., models are the closest to the ‘perfect line’. MC-10 shear method provided more conservative predictions compared to the other methods.
Figure 2 presents the plot of the design shear resistance predictions from the various design approaches against experimental observations. Bernat et al. [27] model only provides a mean estimate of shear resistance; therefore, it is not considered in the design value assessment. The trend line of MC-10 and DAfStB design capacities, as presented in Figure 2, seems to be reasonably conservative when compared to that of experimental shear capacities. The plots indicate the complexity in predicting the shear capacity of SFRC beams accurately. The resistance predictions from the various procedures differ from each other and also from the experimentally observed shear strength. The shear equations include wide-spread uncertainties due to failure in reflecting the phenomenology of shear resistance accurately. Some of the possible uncertainties include the uncertainty in the basic random variables and the uncertainty associated with the predictive model formulation itself. Given these, quantification of model uncertainties for the different shear models for SFRC beams and subsequent reliability-based performance evaluation is of high significance. This will ensure the effects of uncertainties are adequately taken into account.

5. Quantification of Model Uncertainties in SFRC Shear Resistance Models

5.1. Methodology to Assess the Resistance Model Uncertainties

Model uncertainty is described as the deficiency of a model to accurately represent a physical phenomenon due to lack of comprehension of the phenomenon, conservative assumptions and mathematical simplifications [30,31]. The model uncertainties related to the MC-10, DAfStB and the Bernat et al. [27] shear models are investigated in this section. The model uncertainty assessment is intended to reveal the inherent bias (if there is any) of their mean value/best estimate expression. For this reason, the partial safety factors in the various models are taken as one, and the material strength is simply taken at their mean values when calculating the model uncertainties.
For the predictive models considered in this study, the model uncertainty associated with a single experiment x is obtained as the ratio of the experimental V e x p , to predicted shear strength V p r e d , expressed in Equation (8) [28,30],
U x =   V e x p , V p r e d , x ( X )
where, U x is the model uncertainty for a single beam test x in shear, and X represents the input variables for the predictive model ( a / d , d , b w , ρ l , f c m , d a and F s f ).
The model uncertainty U x , using Equation (8), is obtained for each test in the experimental database presented in Section 3.2, in order to derive the various statistical parameters of model uncertainty, such as the mean, coefficient of variation and standard deviation. A model uncertainty mean value μ U > 1 indicates that the model predicted a lower value of ultimate shear resistance than was measured and thus underpredicts. Conversely, μ U < 1 implies that it overpredicts the actual shear resistance.

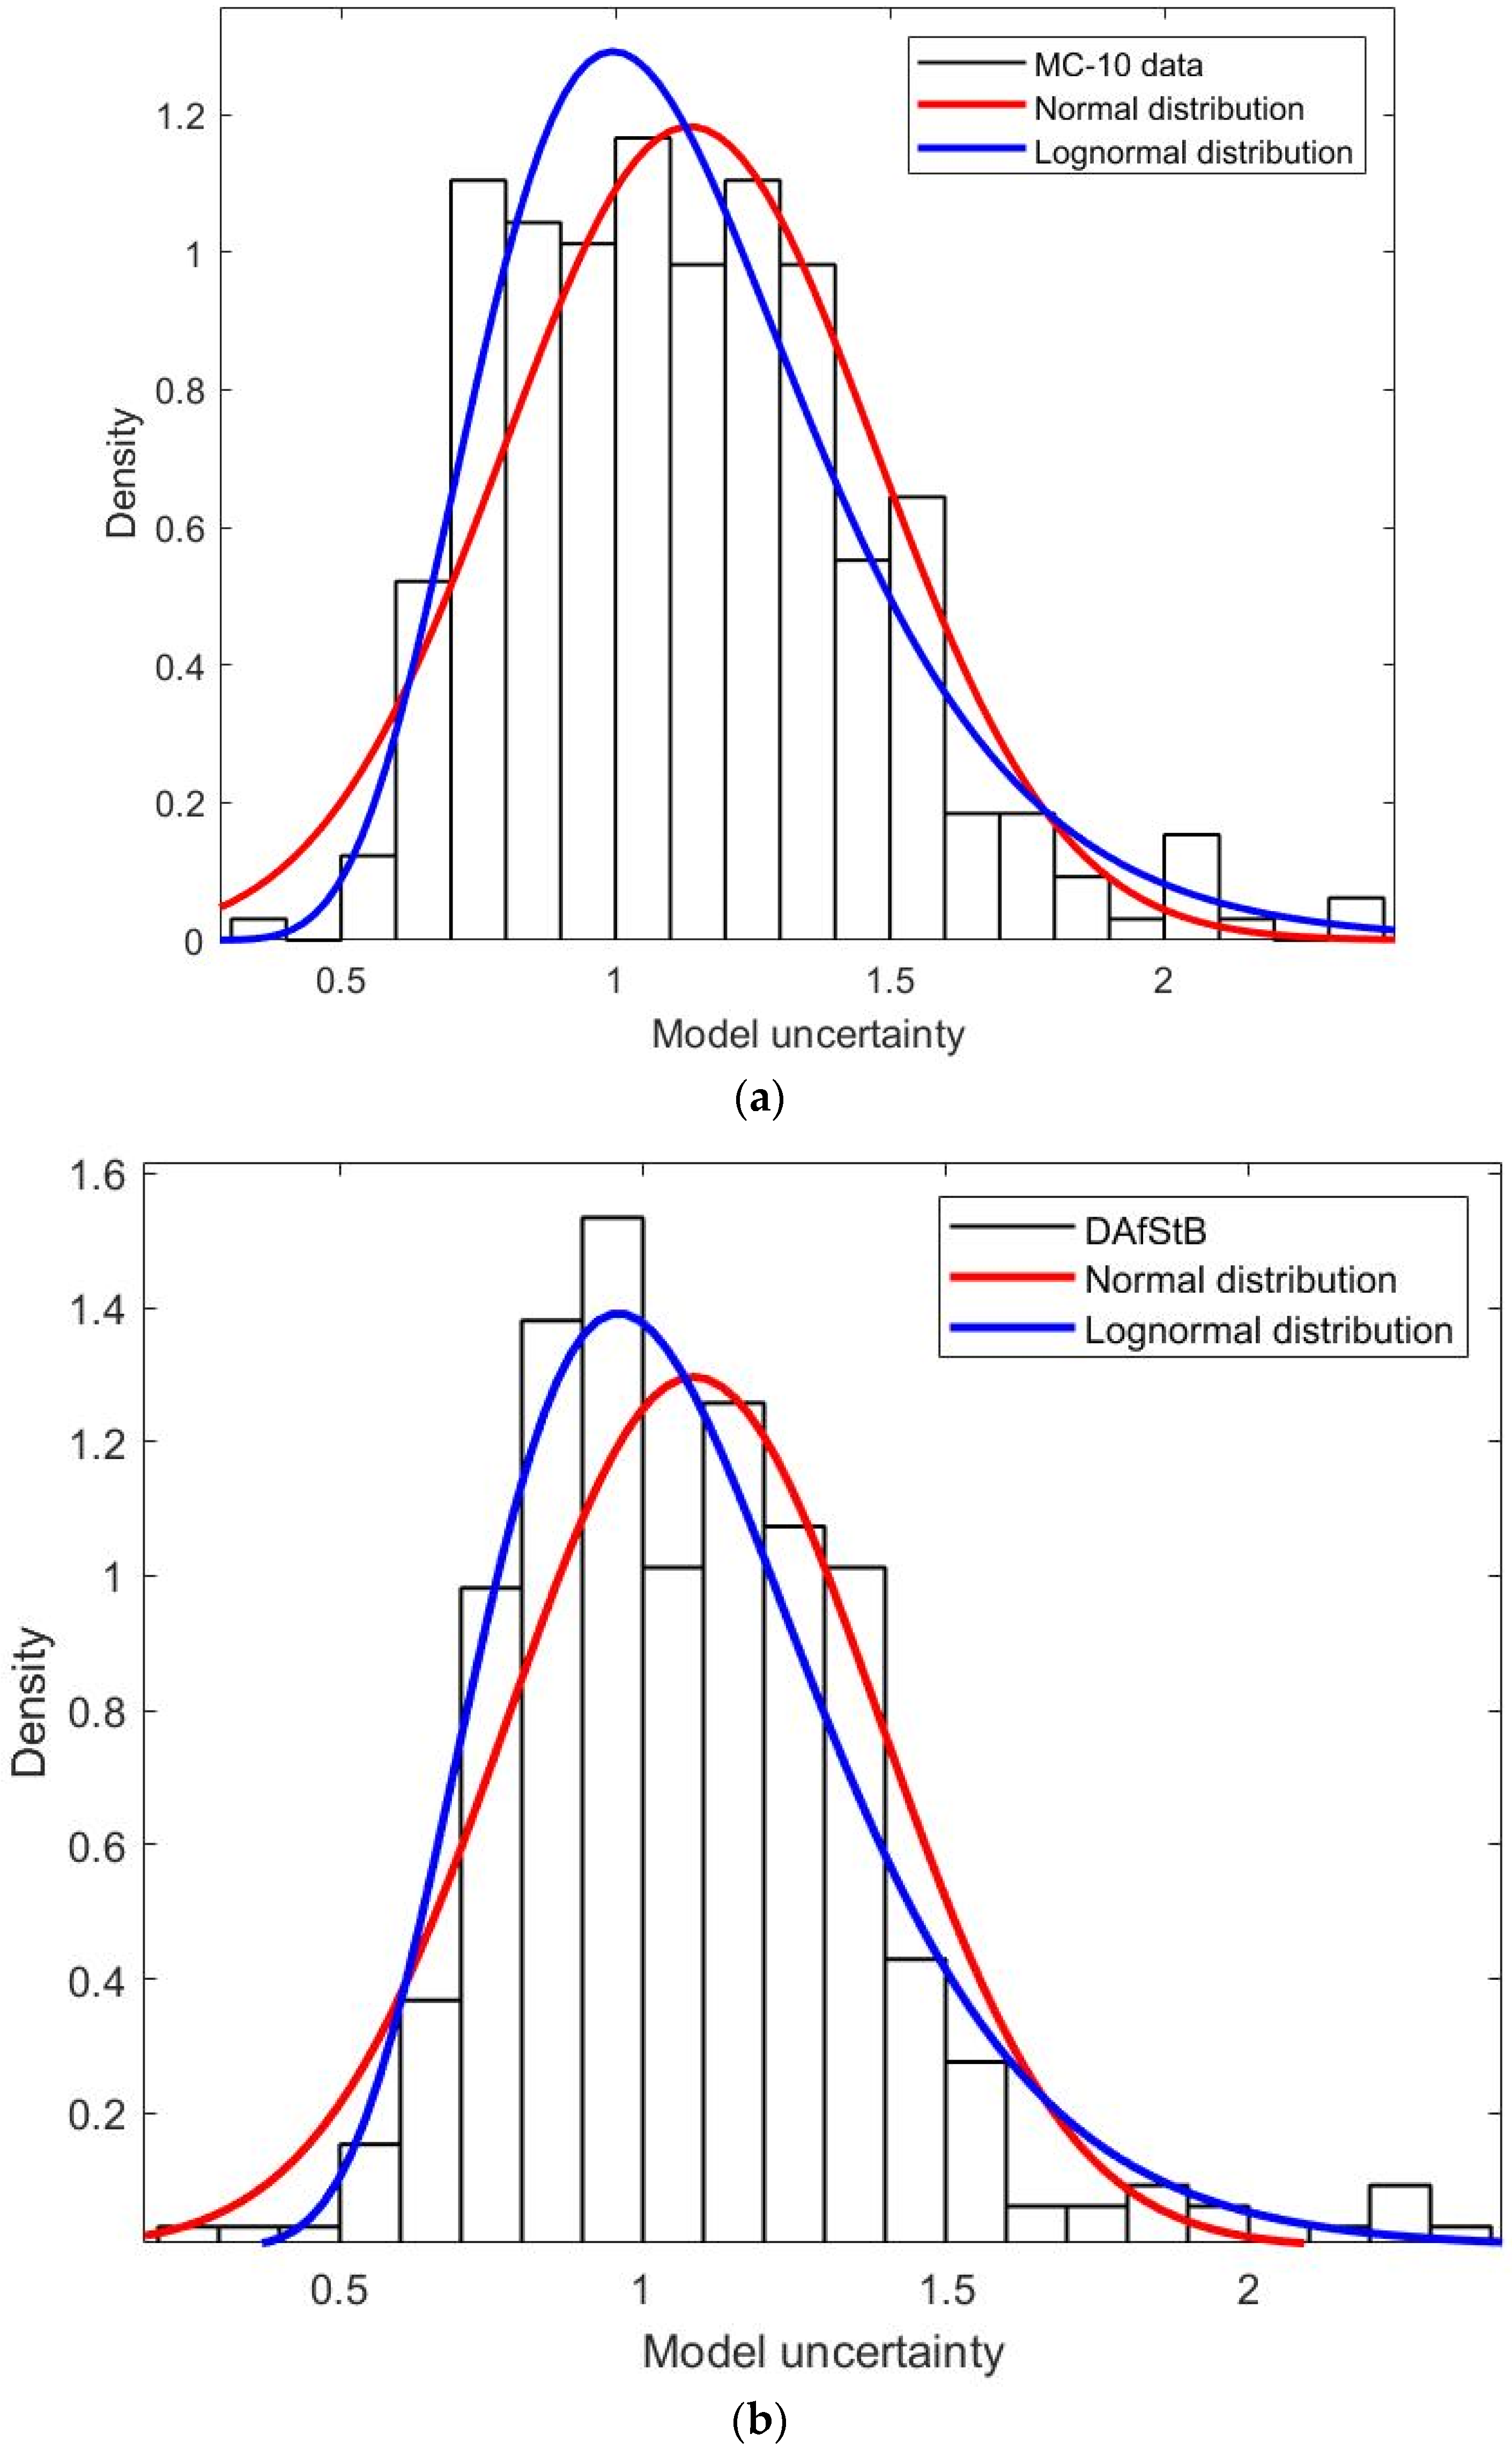
5.2. Statistical Properties of the Model Uncertainty Random Variable

Statistical properties of the model uncertainty variables determined (the mean μ U , standard deviation σ U , coefficient of variation V U , skewness η U , range, minimum value M m i n and maximum value M m a x ), using the experimental database of SFRC slender beams, are presented in Table 3 and Figure 3. The best model is the model with the lowest bias (i.e., mean value closest to 1) and minimum dispersion (standard deviation closest to zero). Such a model is suitable as a probabilistic model for shear reliability analysis
The model uncertainty variable related to the DAfStB model has a mean value of μ U = 1.08 with a conservative bias of 8% (the closest to the optimal value of 1). Concerning dispersion, the model produces the lowest standard deviation of all the models investigated with σ U = 0.31 . MC-10 and Bernat et al., shear model, on the other hand, have the highest mean value of μ U = 1.13 (largest conservative bias) and the most substantial dispersion with σ U = 0.34 . The JCSS [33] recommended a general mean value of μ U = 1.0 and standard deviation of σ U = 0.1 for model uncertainties related to shear failure. The model uncertainty statistics presented in this study are higher than what is suggested by the JCSS [33] but comparable to those obtained by other authors in Table 1. Underprediction of the dispersion of the model uncertainty may result in an overprediction of the associated reliability level. The model uncertainty statistics presented here can serve as inputs in reliability analysis and derivation of partial safety factors for shear resistance uncertainties.

5.3. Assessment of Model Uncertainty Independence and Correlations

The trend in the performance of the various models is investigated by correlating the model uncertainty with model parameters. The correlation coefficients for the relevant parameters are presented in Table 4. As observed from the table, the model uncertainty related to the Bernat et al., model showed weak to moderately weak trend with the major parameters investigated. On the other hand, the MC-10 and DAfStB models showed some correlation of the model uncertainty with the beam effective depth d , the a / d ratio and the reinforcement ratio ρ l , corresponding to unwanted trends in the model uncertainty with these parameters. The a / d ratio is the most influential parameter. The strong decreasing trend of safety bias as the a / d ratio increases, is a cause for concern (Figure 4). It is recommended to differentiate it with respect to this parameter.
Further assessment of this trend is conducted by computing model uncertainty statistics for various subsets of beams with   a / d ratio as presented in Table 5. This is done to quantify the impact of a / d ratio on the model uncertainty bias and variability. The histogram of the shear span to effective depth ratio for the full database showing the different range of a / d ratio is presented in Figure 5. The limits for the different ranges of a / d ratio (short, medium and slender shear span length) as presented in the table and figures are adopted from [34]. Sample sizes are n = 109, 180 and 37 for short, medium and slender shear span length, respectively. The parameter range analyses (see Table 5) conducted indicate that the statistics of the model uncertainty ( μ U , σ U , V U ) decreases with increasing a / d ratio.

5.4. Probabilistic Model for Model Uncertainty

In structural reliability theory, the basic variables such as actions, material properties and geometric data are considered as random variables with appropriate distribution type. One of the major objectives of this investigation is to establish the most appropriate distribution function for the model uncertainties related to the shear resistance models for SFRC beams. The most prevalently used distributions to describe actions, material properties and geometrical data, in reliability investigation, are the normal and lognormal distributions [33,35]. In the current study, only the suitability of the normal and lognormal distribution is investigated in order to achieve an adequate representation of the actual probability distribution for the model uncertainty observations. Also, the skewness coefficients ( η U ) obtained for the models, as presented in Table 3, indicate that the underlying distributions of the derived model uncertainties are closer to what is expected from a positively skewed distribution (such as lognormal).
The type of probability distribution has been shown to play a key role in reliability performance assessment [28,35]. The choice of the appropriate distribution for the model uncertainty variable was evaluated based on the chi-square goodness-of-fit test. The hypothesis that the model uncertainty distribution is similar to the choice of probability distribution (normal or lognormal) is rejected if the significance p-value < 0.05 . The p-value is a measure of the goodness-of-fit, with larger values indicating a better fit. The magnitude of the p-value obtained based on the chi-square goodness of fit test suggests that the lognormal distribution is a better fit with p-value greater than 0.05. Previous studies [28,29] and the Probabilistic Model Code by the Joint Committee on Structural Safety (JCSS) [33] have also recommended the lognormal distribution as the most suitable distribution function for model uncertainty. The model uncertainty theoretical PDF and histogram plots for the models are presented in Figure 6.

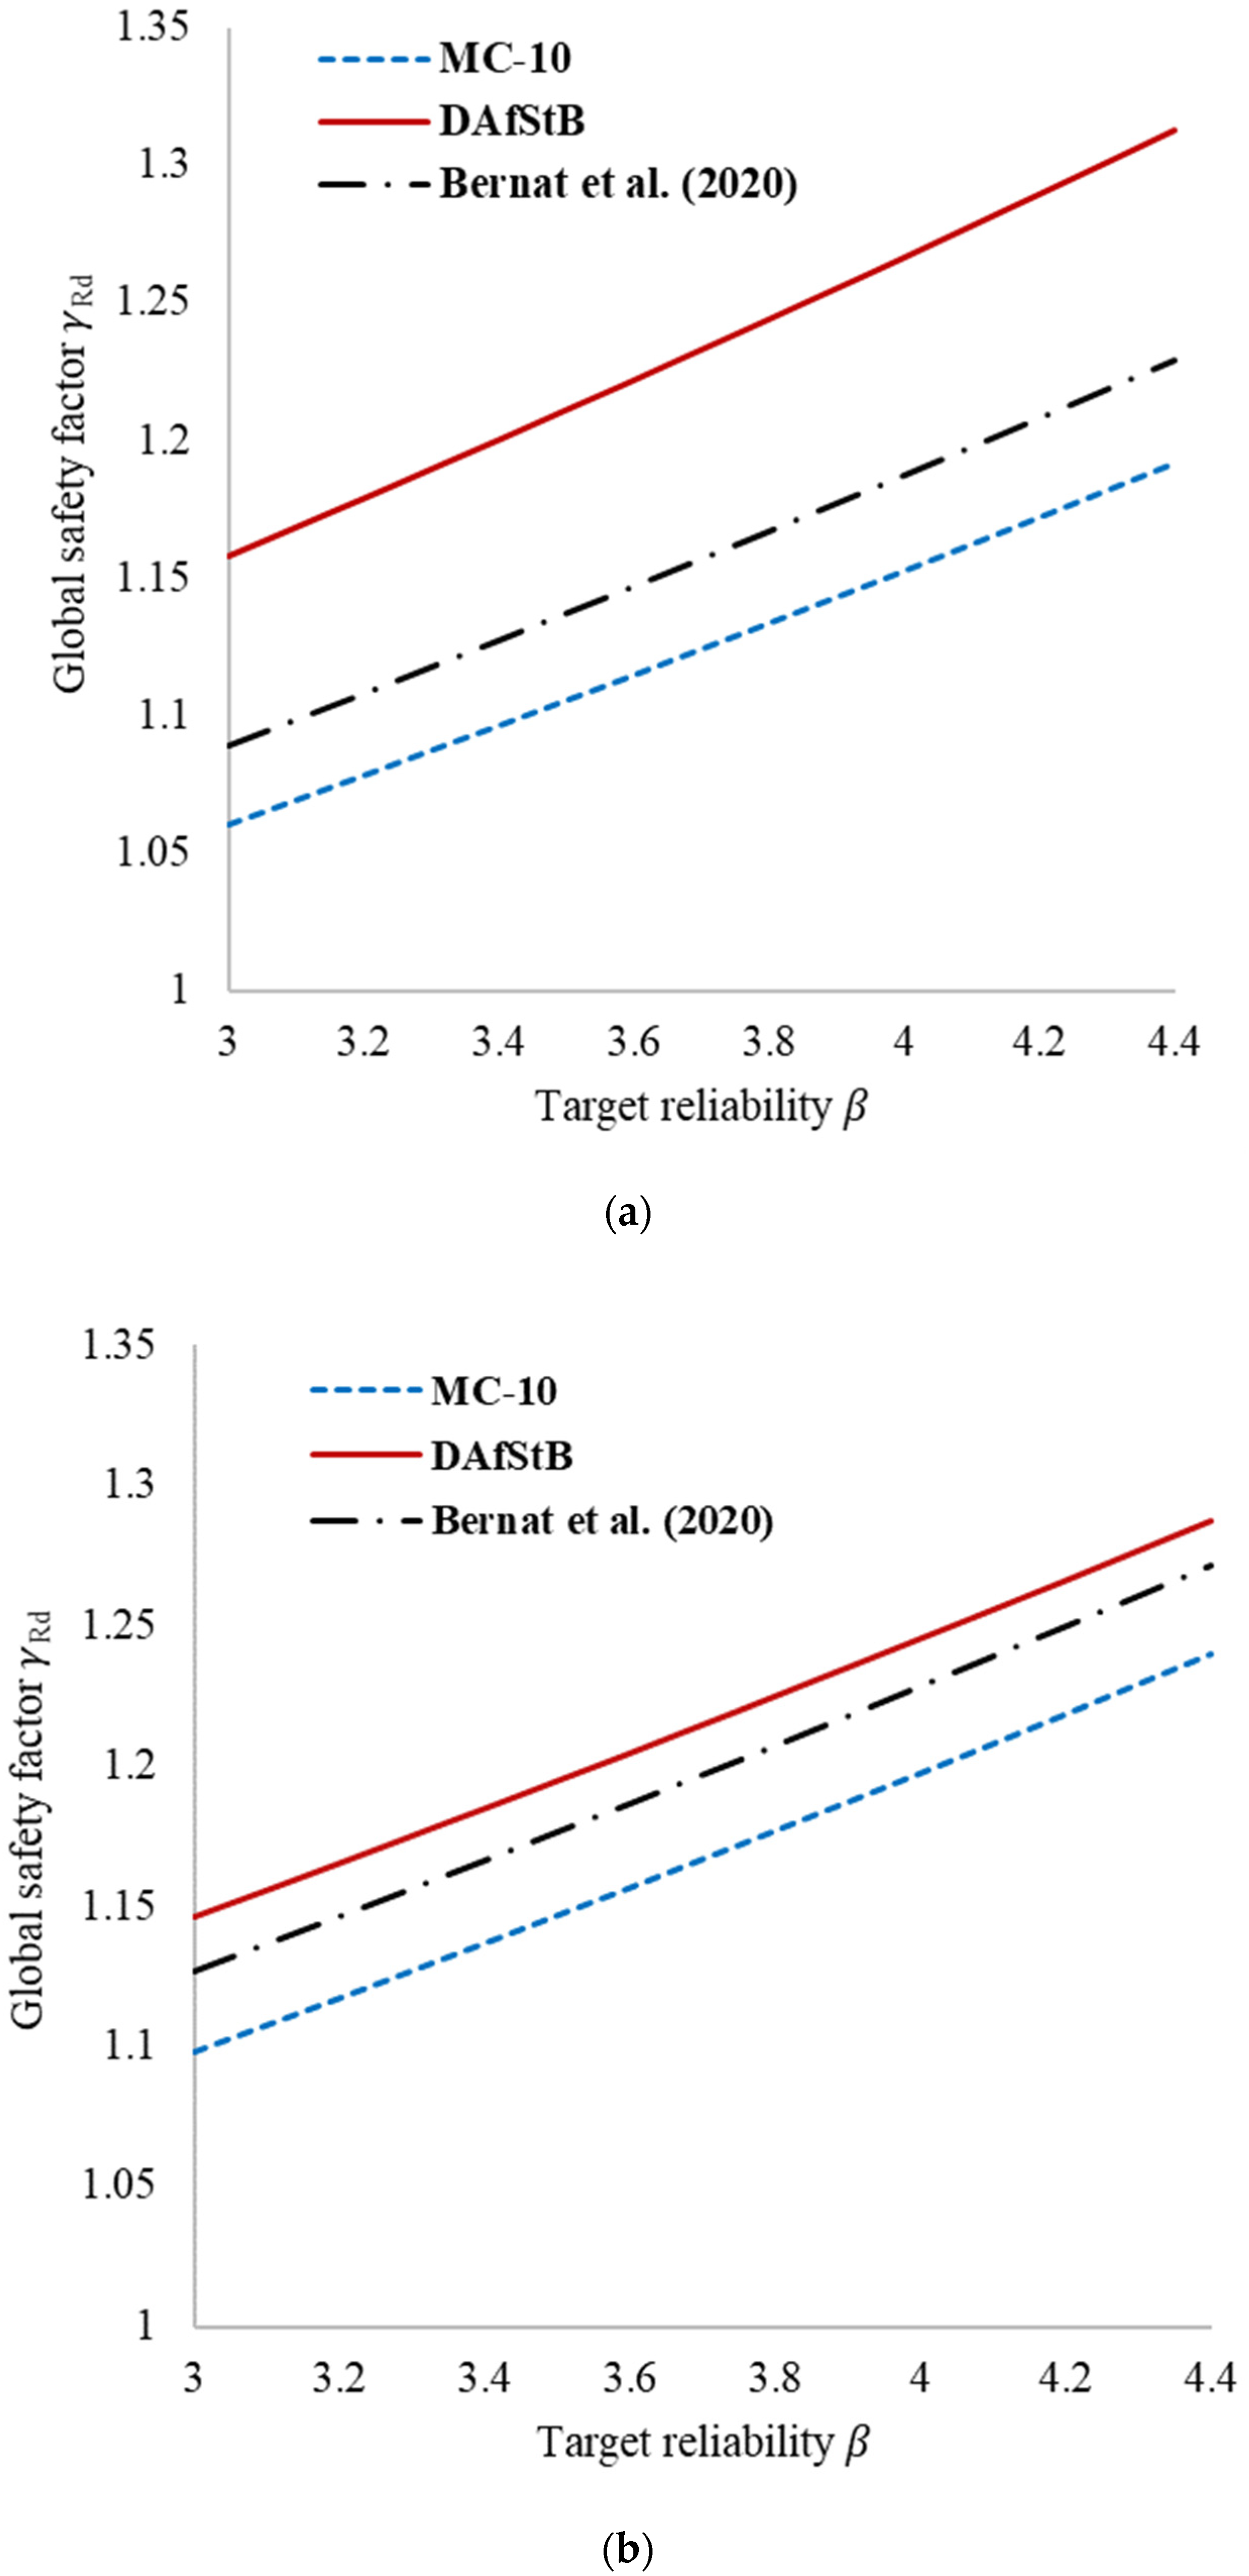
6. Derivation of Partial Safety Factor for Resistance Model Uncertainties

The Eurocode EN 1992-2 [36] and Fib Model Code 2010 [20] recommended various global partial factors γ R d for model uncertainty for nonlinear analysis. In the case of Eurocode, γ R d = 1.06 , whereas for Fib Model Code 2010 γ R d = 1.0 1.1 (for models with zero to high uncertainties). However, various studies [35,37] have shown that these values are inadequate and should be related to the specific failure mode under consideration.
The partial safety factors for model uncertainty related to the MC-10, Bernat et al., and DAfStB are proposed in this section. The global safety assessment of an SFRC structure for the ultimate limit state is performed based on the design requirement that the design action E d is lower than the design structural resistance R d (See Equation (9)) [20,38].
E d < R d
In line with the EN 1990 [38], the partial safety factor γ R d for model uncertainties is generally incorporated into the design equation through the expression in Equation (10) [38].
R d   = R [ η X k γ m ; a d . ] / γ R d
where R d is the design resistance. X k is the characteristic values of the variable. η is a conversion factor appropriate to the material property. γ m is the material property factor. a d is the design geometric parameter. γ R d is global partial factor for resistance.
Based on a lognormal probability distribution, the global partial safety factor representing the resistance model uncertainties γ R d can be obtained from Equation (11) [37]. For the shear predictive models investigated in this study, the probability distribution for the model uncertainty random variables is taken as a lognormal distribution based on the assessment presented in Section 5.4.
γ R d = 1 / [ μ U . e x p . ( α R . β . V U ) ]
where α R denotes the FORM sensitivity factor = 0.8 × 0.4 = 0.32 [38] (0.4 is the factor for non-dominant resistance variable and 0.8 is the sensitivity factor for resistance). β is the target reliability, according to EN 1990. μ U and V U are the mean and coefficient of variation of the model uncertainty random variable, respectively.
Figure 7 and Figure 8 present the variation of the obtained model uncertainty global partial factor γ R d with target reliability β for the various models and the considered parametric range of shear span to effective depth ratio. The range of target reliability presented in the figures covers the target reliabilities for 50 years of design working life period for the ultimate limit states for structures. As shown in the figures, the model uncertainty factor γ R d increases as the target reliability β increases. The recommended model uncertainty partial factor γ R d obtained for the investigated models is presented in Table 6. The recommended value is obtained as the average of the partial safety factors for the range of shear span to effective depth ratio considered.

7. Conclusions

Uncertainties are inevitable in any structural engineering problems. Uncertainties may arise from the properties of the material parameters, random nature of the loadings, imperfect resistance modelling, lack of experience and human factors. Previous studies have shown that the resistance predictions from the existing shear design models for SFRC beams differ from the experimentally observed shear strength. The shear models contain significant uncertainty due to the failure to represent the phenomenology of shear resistance accurately. Proper modelling and description of model uncertainties are critical since model uncertainty significantly influences reliability performance [29,35]. The present study is focused on the quantification of model uncertainty related to the current shear resistance predictive models for SFRC beams without shear reinforcement. The study also presents a systematic derivation of global partial safety factors to account for the effects of model uncertainties in the shear resistance of SFRC beams following the semi-probabilistic approach recommended in EN 1990 for reliability-based design. The models investigated include the best estimate predictive model of (1) fib Model Code 2010, (2) German guideline (DAfStB), and (3) Bernat et al. [27] mechanical model. The model uncertainty statistics were developed by comparing mean predicted shear capacity with experimental capacity. The best model is the model with the lowest bias (i.e., mean value closest to 1), minimum dispersion (standard deviation closest to zero) and milder sensitivities to shear parameters. The following concluding remarks are drawn:
  • The model uncertainty related to the DAfStB model has a mean value of μ M = 1.08 (the closest to the optimal value of 1) and the lowest dispersion ( σ M = 0.31 ) . On the other hand, the MC-10 and Bernat et al., models displayed the highest mean value ( μ M = 1.13 ) (largest conservative bias) and the most substantial dispersion, comparatively.
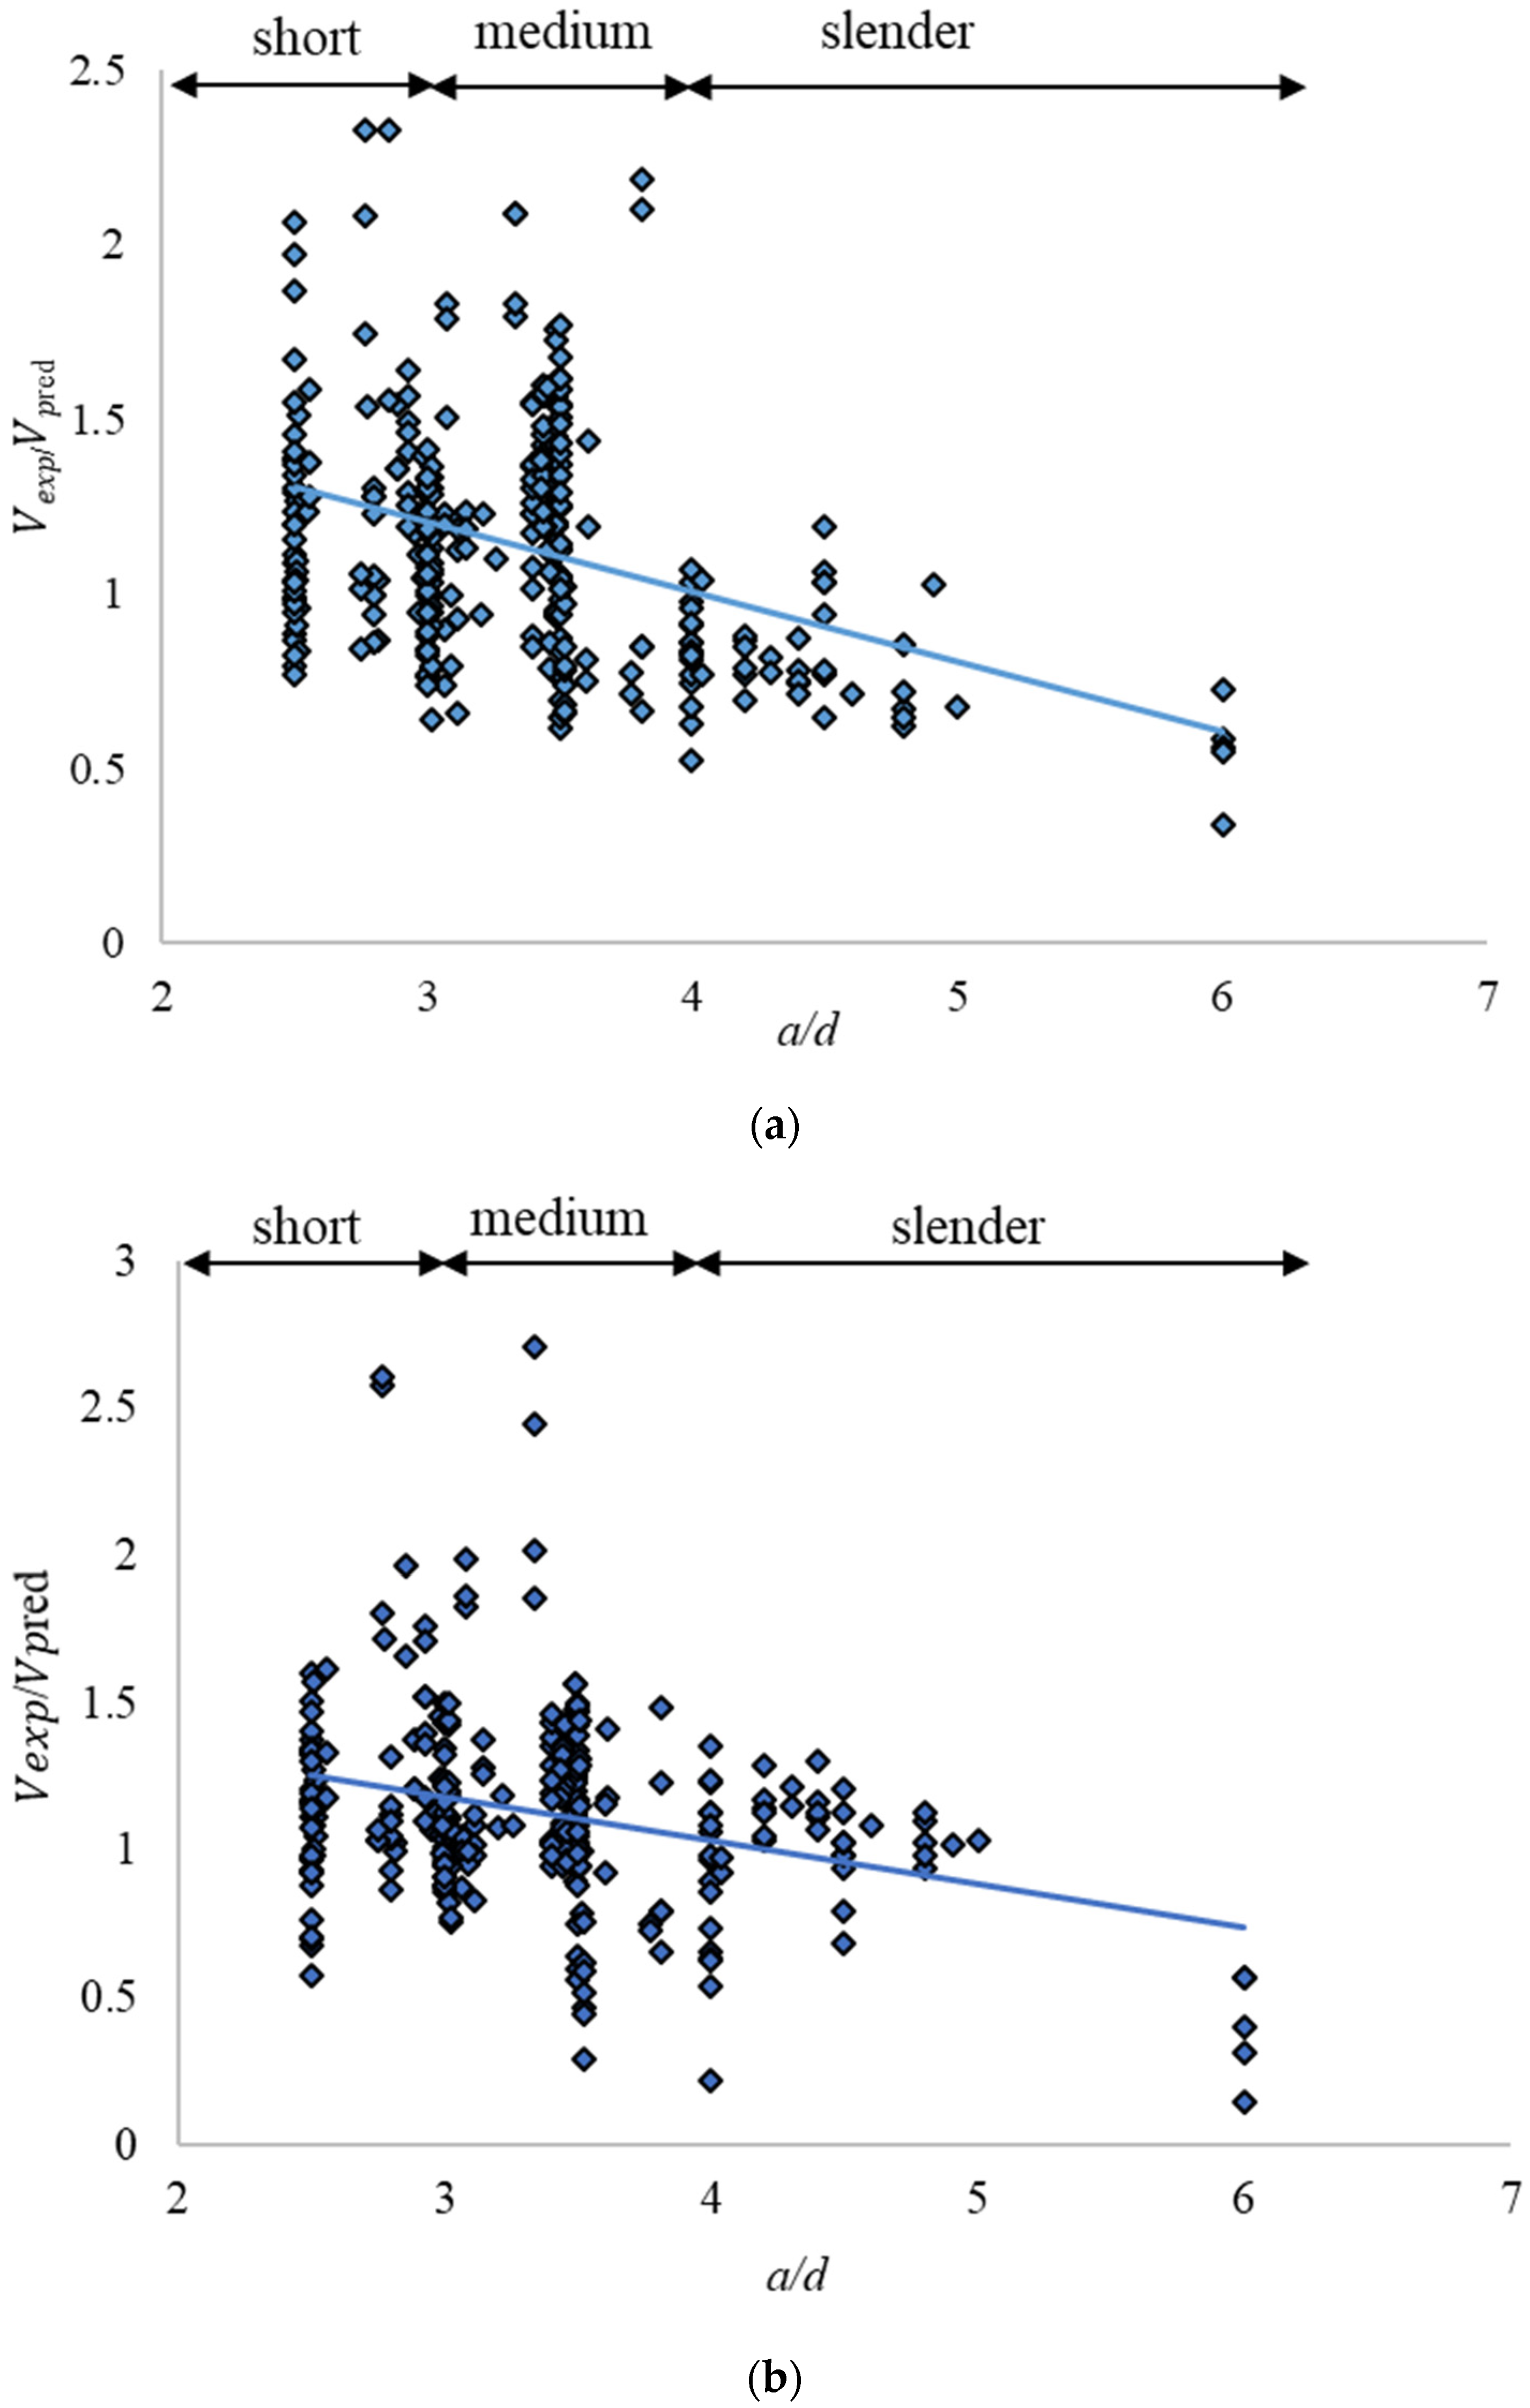
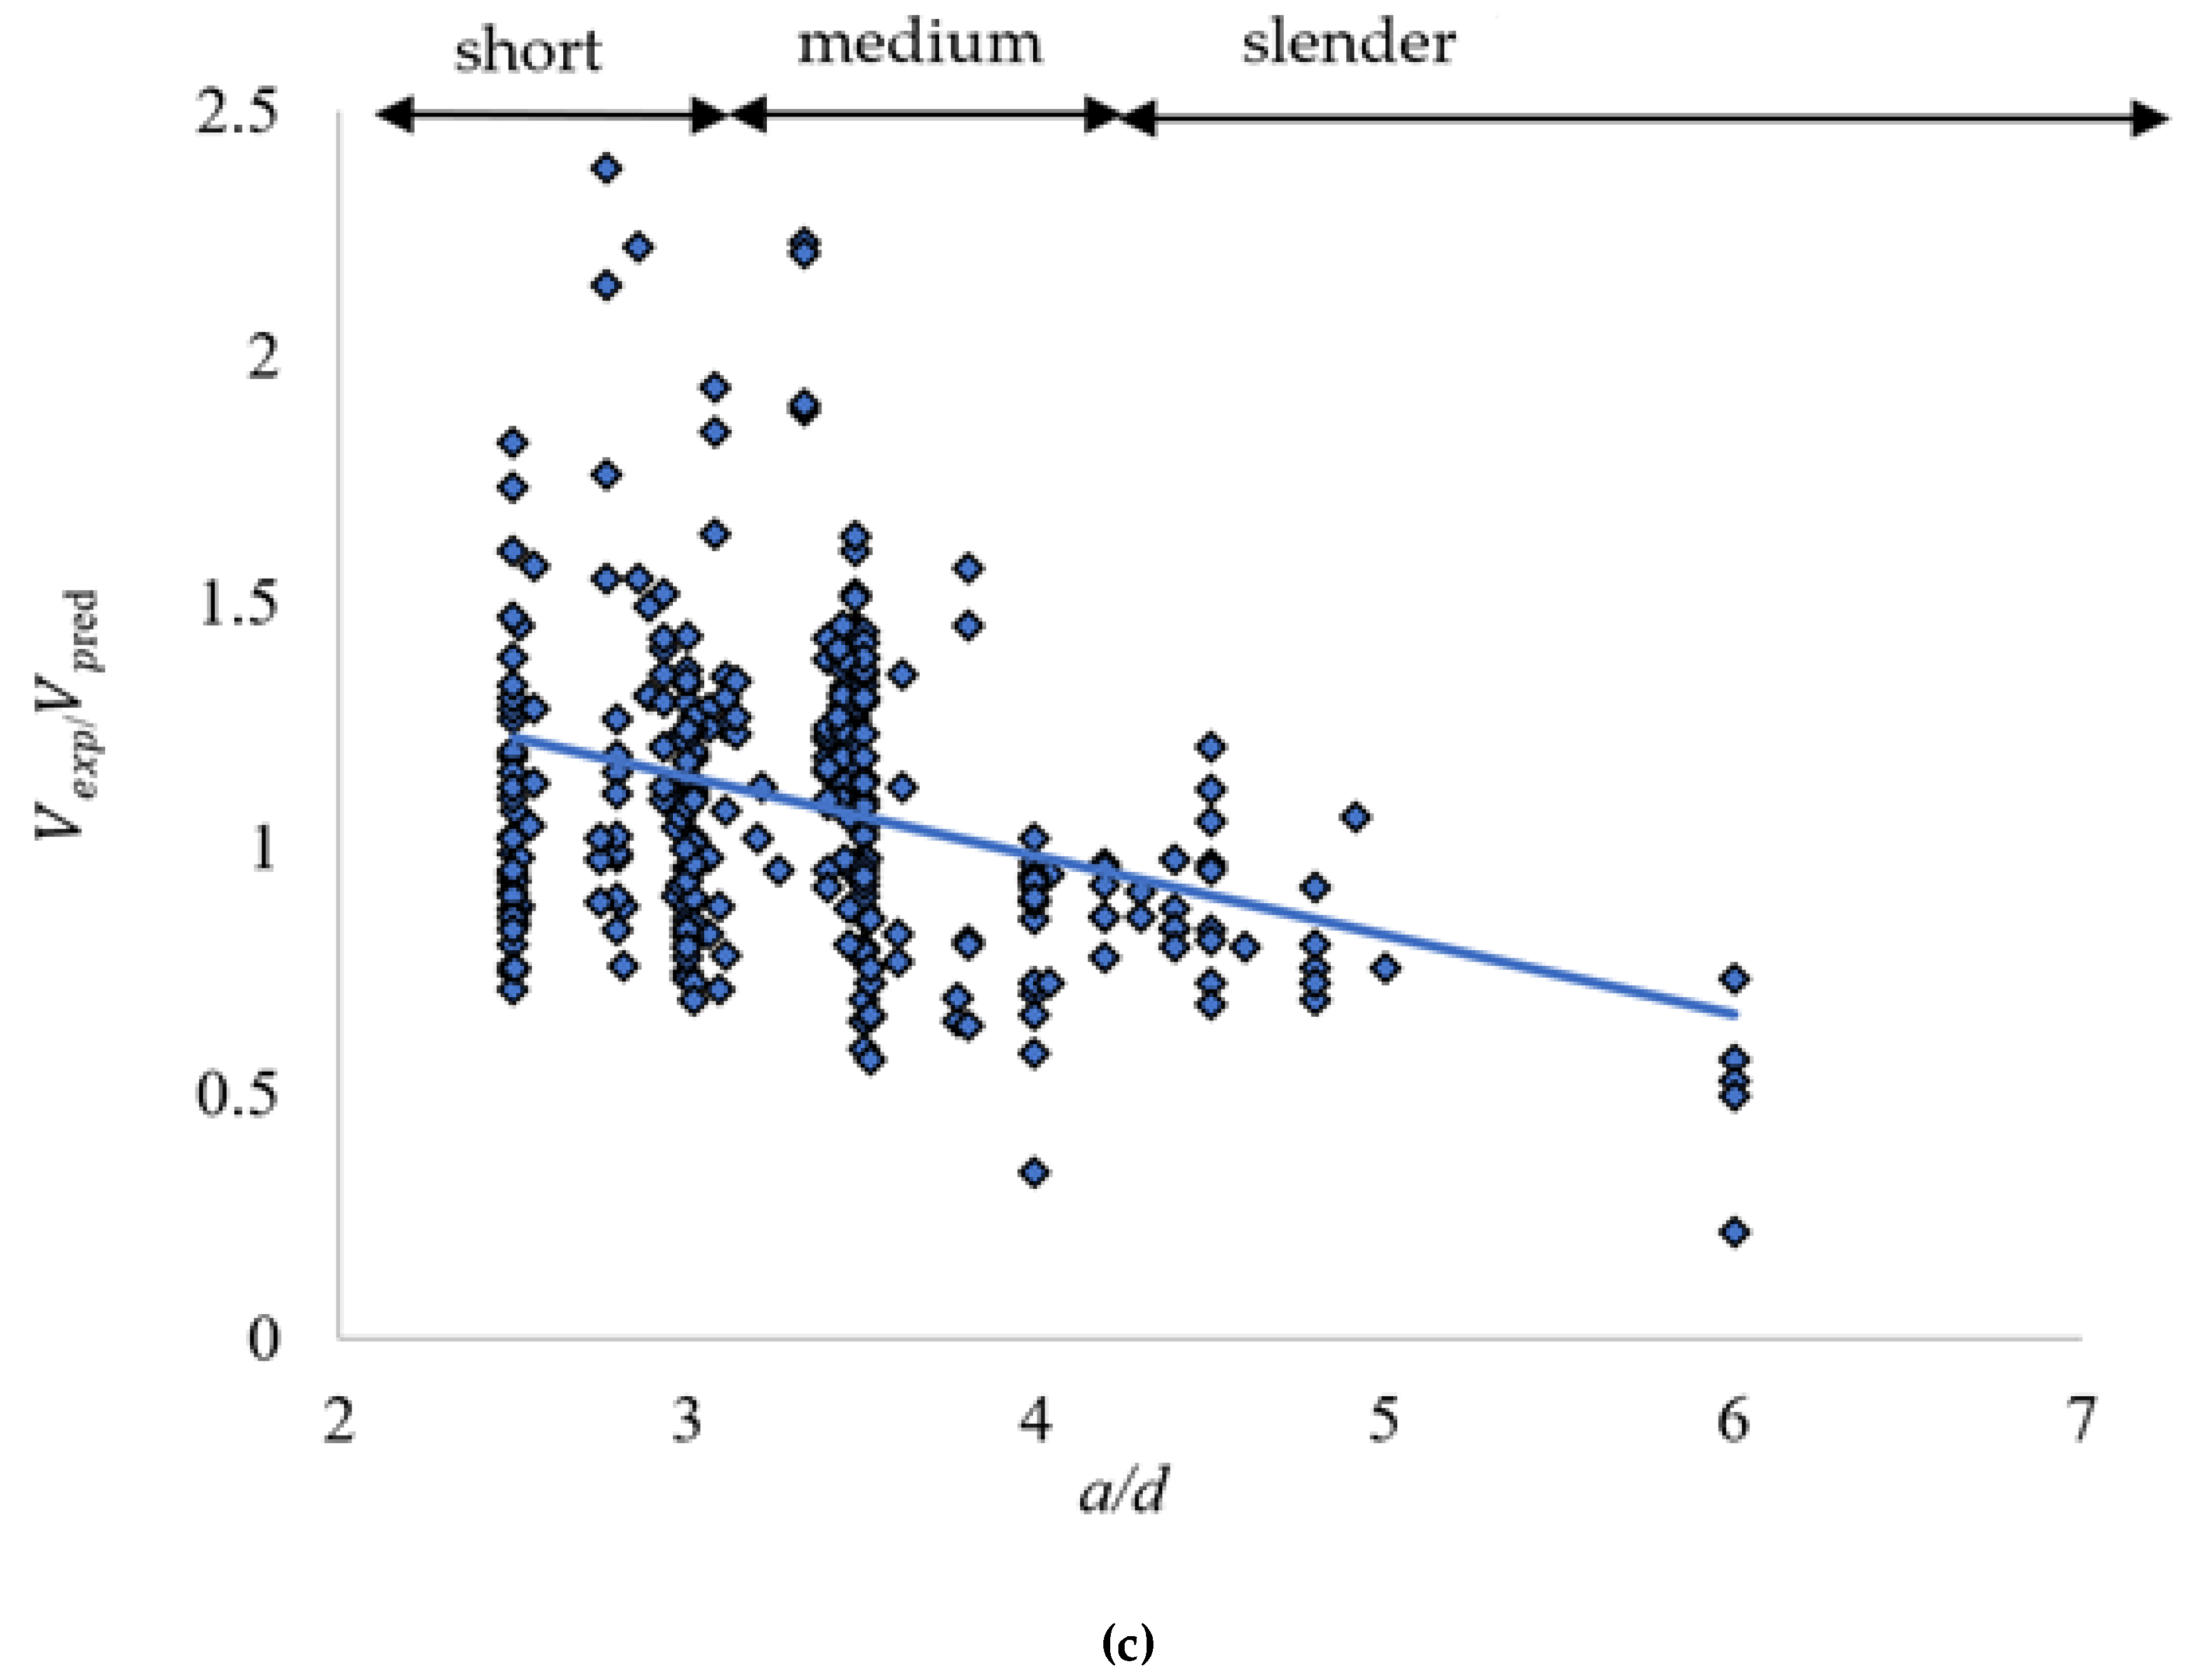
  • The Bernat et al., model showed weak to moderately weak trend with all the shear parameters investigated in this study. MC-10 and DAfStB models showed some correlation of the model uncertainty with the beam effective depth d , shear span to effective depth a / d and the reinforcement ratio ρ l , corresponding to unwanted trends in the model uncertainty with these parameters.
  • The shear span to effective depth ratio a / d was found to be the most influential parameter (highest correlation coefficient). The strong decreasing trend of safety bias as the shear span to effective depth ratio a / d increases, is a cause for concern. Further assessment of this trend was conducted by computing model uncertainty statistics for different subsets of beams with a / d ratio. The parameter range analysis indicates that the statistics of the model uncertainty (mean value, standard deviation and coefficient of variation) decreases with increasing a / d ratio.
  • The probability distribution fitting indicates that the derived model uncertainty random variables can be modelled using a lognormal distribution.
  • Global partial safety factors accounting for the model uncertainty in shear resistance models for SFRC beams were proposed. Partial safety factors ranging from 1.13–1.23, 1.17–1.22 and 1.38–1.64 were recommended for beams with short, medium and slender shear span lengths, respectively. It is important to note that improved values of the global partial safety factors can be obtained using a fully probabilistic approach.
  • The derived model uncertainty variables and related partial safety factors obtained in this study are associated with the specific database considered, which may change noticeably should the database change. However, the database presented in this study may be regarded as representative of practical design situations.
  • The use of partial factors ensures a consistent level of reliability over a range of structures. This enables engineers with no knowledge of probability and reliability theory to produce designs at a prescribed level of reliability.

Author Contributions

Conceptualization, O.B.O.; methodology, O.B.O.; software, P.S.; validation, O.B.O.; formal analysis, O.B.O.; data curation, O.B.O.; Supervision, P.S.; writing—original draft preparation, O.B.O.; writing—review and editing, P.S. Both authors have read and agreed to the published version of the manuscript.

Funding

This research received no external funding.

Conflicts of Interest

The authors declare no conflict of interest.

References

  1. Ulzurrun, G.S.; Zanuy, C. Enhancement of impact performance of reinforced concrete beams without stirrups by adding steel fibers. Constr. Build. Mater. 2017, 145, 166–182. [Google Scholar] [CrossRef]
  2. Padmarajaiah, S.K.; Ramaswamy, A. Flexural strength predictions of steel fiber reinforced high-strength concrete in fully/partially prestressed beam specimens. Cem. Concr. Compos. 2004, 26, 275–290. [Google Scholar] [CrossRef]
  3. Zarrinpour, M.R.; Chao, S.H. Shear Strength Enhancement Mechanisms of Steel Fiber-Reinforced Concrete Slender Beams. ACI Struct. J. 2017, 114, 729–742. [Google Scholar] [CrossRef]
  4. Köksal, F.; Şahin, Y.; Beycioğlu, A.; Gencel, O.; Brostow, W. Estimation of fracture energy of high-strength steel fibre-reinforced concrete using rule-based Mamdani-type fuzzy inference system. Sci. Eng. Compos. Mater. 2012, 19, 373–380. [Google Scholar] [CrossRef]
  5. Dinh, H.H.; Parra-Montesinos, G.J.; Wight, J.K. Shear behavior of steel fiber-reinforced concrete beams without stirrup reinforcement. ACI Struct. 2010, 597–606. [Google Scholar] [CrossRef]
  6. Kang, T.H.K.; Kim, W.; Kwak, Y.K.; Hong, S.G. Shear Testing of Steel Fiber-Reinforced Lightweight Concrete Beams without Web Reinforcement. Aci Struct. J. 2011, 108, 553–560. [Google Scholar]
  7. Greenough, T.; Nehdi, M. Shear behavior of fiber-reinforced self-consolidating concrete slender beams. Aci Struct. J. 2008, 105, 468. [Google Scholar]
  8. Gandomi, A.H.; Alavi, A.H.; Yun, G.J. Nonlinear modeling of shear strength of SFRC beams using linear genetic programming. Struct. Eng. Mech. 2011, 38, 1–25. [Google Scholar] [CrossRef]
  9. Ahmadi, M.; Kheyroddin, A.; Dalvand, A.; Kioumarsi, M. New empirical approach for determining nominal shear capacity of steel fiber reinforced concrete beams. Constr. Build. Mater. 2020, 234, 117293. [Google Scholar] [CrossRef]
  10. Slater, E.; Moni, M.; Alam, M.S. Predicting the shear strength of steel fiber reinforced concrete beams. Constr. Build. Mater. 2012, 26, 423–436. [Google Scholar] [CrossRef]
  11. Arslan, G. Shear strength of steel fiber reinforced concrete (SFRC) slender beams. KSCE J. Civ. Eng. 2014, 18, 587–594. [Google Scholar] [CrossRef]
  12. Minelli, F. Plain and Fiber Reinforced Concrete Beams under Shear Loading: Structural Behavior and Design Aspects; University of Brescia: Brescia, Italy, 2005. [Google Scholar]
  13. Rosenbusch, J.; Teutsch, M. Shear design with (σ-ε) method. In International RILEM Workshop on Test and Design Methods for Steelfibre Reinforced Concrete; Schnütgen, B., Vandewalle, L., Eds.; RILEM: Paris, France, 2003; pp. 105–117. [Google Scholar]
  14. Wight, J.K.; MacGregor, J.G. Reinforced Concrete: Mechanics and Design, 5th ed.; Pearson Prentice Hall: Upper Saddle River, NJ, USA, 2008; pp. 247–248. [Google Scholar]
  15. Mansur, M.A.; Ong KC, G.; Paramasivam, P. Shear strength of fibrous concrete beams without stirrups. J. Struct. Eng. 1986, 112, 2066–2079. [Google Scholar] [CrossRef]
  16. Lantsoght, E.O.L. How do steel fibers improve the shear capacity of reinforced concrete beams without stirrups? Comp. Part B Eng. 2019, 175, 107079. [Google Scholar] [CrossRef]
  17. Kani, G.N.J. Basic facts concerning shear failure. ACI J. Proc. 1966, 63, 675–692. [Google Scholar]
  18. Association Française de Génie Civil. Bétons Fibrés à Ultra-Hautes Performances: Recommandations; Association Française de Génie Civil: Paris, France, 2013; p. 359. [Google Scholar]
  19. DAfStB. DAfStB-Richtlinie Stahlfaserbeton; DIN: Berlin, Germany, 2012; p. 47. [Google Scholar]
  20. FIB. Model Code 2010; Final Draft; International Federation for Structural Concrete: Lausanne, Switzerland, 2012; p. 676. [Google Scholar]
  21. Lantsoght, E.O. Database of shear experiments on steel fiber reinforced concrete beams without stirrups. Materials 2019, 12, 917. [Google Scholar] [CrossRef] [Green Version]
  22. Foster, S.J. Design of FRC beams for shear using the VEM and the draft model code approach. Fib Bull. 2010, 57, 195–210. [Google Scholar]
  23. Matthys, S.; Soetens, T. Engineering Model for SFRC Shear Strength Based on MC2010 MCFT Approach. In High Tech Concrete: Where Technology and Engineering Meet; Springer: Cham, Switzerland, 2018; pp. 374–381. [Google Scholar]
  24. Lee, D.H.; Kim, K.S.; Han, S.J.; Zhang, D.; Kim, J. Dual potential capacity model for reinforced concrete short and deep beams subjected to shear. Struct. Concr. 2018, 19, 76–85. [Google Scholar] [CrossRef] [Green Version]
  25. Colajanni, P.; Recupero, A.; Spinella, N. Generalisation of shear truss model to the case of SFRC beams with stirrups. Comput Concr. 2012, 9, 227–244. [Google Scholar] [CrossRef]
  26. Spinella, N.; Colajanni, P.; Recupero, A. Simple plastic model for shear critical SFRC beams. J Struct. Eng. 2010, 136, 390–400. [Google Scholar] [CrossRef] [Green Version]
  27. Bernat, A.M.; Spinella, N.; Recupero, A.; Cladera, A. Mechanical model for the shear strength of steel fiber reinforced concrete (SFRC) beams without stirrups. Mater. Struct. 2020, 53, 1–20. [Google Scholar]
  28. Holický, M.; Retief, J.V.; Sýkora, M. Assessment of model uncertainties for structural resistance. Probab. Eng. Mech. 2016, 45, 188–197. [Google Scholar] [CrossRef]
  29. Olalusi, O.B.; Viljoen, C. Model uncertainties and bias in SHEAR strength predictions of slender stirrup reinforced concrete beams. Struct. Concr. 2020, 21, 316–332. [Google Scholar] [CrossRef]
  30. Olalusi, O.B.; Viljoen, C. Assessment of reliability of EN 1992-1-1 variable strut inclination method of shear design provisions for stirrup failure. Struct. Concr. 2020, 21, 303–315. [Google Scholar] [CrossRef]
  31. Hamutcuoglu, O.M. Parametric Uncertainties in Reliability Analysis of Bridge Structures; Oregon State University: Corvallis, OR, USA, 2010. [Google Scholar]
  32. Thomas, J.; Ramaswamy, A. Mechanical properties of steel fiber-reinforced concrete. J. Mater. Civ. Eng. 2007, 19, 385–392. [Google Scholar] [CrossRef]
  33. JCSS. JCSS Probabilistic Model Code; Joint Committee on Structural Safety: Zurich, Swizerland, 2001; ISBN 978-3-909386-79-6. [Google Scholar]
  34. Song, J.; Kang, W.H.; Kim, K.S.; Jung, S. Probabilistic shear strength models for reinforced concrete beams without shear reinforcement. Struct. Eng. Mech. 2010, 11, 15. [Google Scholar] [CrossRef] [Green Version]
  35. Olalusi, O.B. Reliability Assessment of Shear Design Provisions for Reinforced Concrete Beams with Stirrups. Ph.D. Thesis, Stellenbosch University, Stellenbosch, South Africa, 2018. [Google Scholar]
  36. EN 1992-2. Design of Concrete Structures- Concrete Bridges—Design and Detailing Rules; European Standard, European Committee for Standardization: Brussels, Belgium, 2005. [Google Scholar]
  37. Olalusi, O.B.; Spyridis, P. Uncertainty modelling and analysis of the concrete edge breakout resistance of single anchors in shear. Eng. Struct. 2020, 222, 111112. [Google Scholar] [CrossRef]
  38. EN 1990. Eurocode—Basis of Structural Design; European Standard, European Committee for Standardization: Brussels, Belgium, 2002. [Google Scholar]
Figure 1. (a) Plot of the correlation between the experimentally observed shear strength V e x p and mean shear resistance predictions V p r e d . (b) Plot of the correlation between the experimentally observed shear strength V e x p and mean shear resistance predictions V p r e d (resistance up to 300 kN only).
Applsci 10 06955 g001
Figure 2. (a) Plot of the design shear resistance predictions against experimental observations. (b) Plot of the design shear resistance predictions against experimental observations (resistance up to 300 kN only).
Applsci 10 06955 g002
Figure 3. Mean and coefficient of variation for model uncertainty.
Applsci 10 06955 g003
Figure 4. Variation of model uncertainty with shear span to effective depth ratio a / d . (a) Plot for MC-10 model. (b) Plot for Bernat et al., model [27]. (c) Plot for DAfStB model.
Applsci 10 06955 g004aApplsci 10 06955 g004b
Figure 5. Histogram of a / d for the full database.
Applsci 10 06955 g005
Figure 6. Model uncertainty distribution plots—theoretical PDF and frequency histogram plots. (a) PDF for MC-10 model. (b) PDF for DafStB model. (c) PDF for Bernat et al., model.
Applsci 10 06955 g006aApplsci 10 06955 g006b
Figure 7. Variation of the partial factor γ R d with β (using the statistics of the full database).
Applsci 10 06955 g007
Figure 8. Variation of the partial factor γ R d with β (using the statistics of the different subsets of shear span to effective depth ratio). (a) Short shear span length. (b) Medium shear span length. (c) Slender shear span length.
Applsci 10 06955 g008aApplsci 10 06955 g008b
Table 1. Model uncertainty statistics obtained from the literature.
Model Mean   ( μ U ) SD   ( σ U ) Sample Size #Source
Fib Model Code (MC-10) [20]1.240.36488 (Slender and non-slender beams)[21]
DAfStB [19]1.120.31488 (Slender and non-slender beams)[21]
Bernat et al. [27]1.150.25488 (Slender and non-slender beams)[27]
Bernat et al. [27]1.170.2882 (Slender and non-slender beams)[27]
Mean is obtained as the average of the ratio of experimental to predicted shear resistance obtained for each specimen. SD denotes the standard deviation.
Table 2. Statistical summary of the experimental evaluation database (326).
ParametersRangeMinMaxMeanS.D.C.o.V.
V R (kN)686.6412.89699.53134.44128.750.96
F s f (-)1.900.102.000.510.310.62
d a (mm)21.600.4022.009.945.230.53
ρ l 0.0530.0040.0570.030.010.38
f c (MPa)205.239.77215.0049.3326.940.55
a / d (-)3.502.506.003.370.660.20
b w (mm)255.0055.00310.00151.9657.770.38
d (mm)837.7585.25923.00264.15160.460.61
S.D. denotes standard deviation, C.o.V. denotes the coefficient of variation, Max denotes maximum, Min denotes minimum.
Table 3. Statistical properties of the model uncertainty variables.
ParametersMC-10DAfStBBernat et al.
Number of experiments326326326
Mean μ U 1.131.081.13
Standard deviation σ U 0.340.310.33
Coefficient of variation V U 30%29%29%
Skewness ( η U ) 0.650.840.99
Range2.032.162.56
Minimum ( M m i n ) 0.300.220.15
Maximum ( M m a x ) 2.332.382.71
Table 4. Pearson correlation matrix between model and shear parameters.
MC-10DAfStBBernat et al.
b w 0.220.070.17
d 0.340.100.15
ρ l 0.130.330.29
a / d −0.38−0.34−0.29
f c m 0.150.140.08
F s f 0.220.14−0.31
Table 5. Model uncertainty statistics for different subsets of beams.
MC-10DAfStBBernat et al.
Description of the Sample μ U σ U V U μ U σ U V U μ U σ U V U
Short shear span length ( a d = 2.5 3 ) n = 109 1.210.320.261.130.310.281.190.320.27
Medium Shear Span Length
( a d = 3 4 ) n = 180
1.180.320.271.120.290.261.150.310.27
Slender Shear Span Length
( a d = 4 8 ) n = 37
0.780.160.210.830.180.210.990.260.26
Table 6. Model uncertainty global partial factor γ R d for parameter range.
Parameter RangeMC-10Bernat et al. [27]DAfStB
Range of model uncertainty partial factor γ R d Recommended value Range of model uncertainty partial factor γ R d Recommended value Range of model uncertainty partial factor γ R d Recommended value
Short shear span length1.06–1.19≈1.131.08–1.231.161.16–1.31≈1.23
Medium shear span length1.10–1.24≈1.171.13–1.271.201.15–1.29≈1.22
Slender shear span length1.57–1.72≈1.641.30–1.451.381.47–1.62≈1.55

