Article

Study on the Driver/Steering Wheel Interaction in Emergency Situations

by
Francesco Comolli
1,
Massimiliano Gobbi
2,* and
Gianpiero Mastinu
2
1
SMARTMechanical Company s.r.l., Via Tonale 9, 24061 Milan, Italy
2
Department of Mechanical Engineering, Politecnico di Milano, Via La Masa 1, 20156 Milano, Italy
*
Author to whom correspondence should be addressed.
Appl. Sci. 2020, 10(20), 7055; https://doi.org/10.3390/app10207055
Submission received: 30 August 2020 / Revised: 4 October 2020 / Accepted: 7 October 2020 / Published: 11 October 2020
(This article belongs to the Special Issue Advances in Mechanical Systems Dynamics 2020)

Abstract

:
Advanced driver assistance systems (ADAS) are becoming increasingly prevalent. The tuning of these systems would benefit from a deep knowledge of human behaviour, especially during emergency manoeuvres; however, this does not appear to commonly be the case. We introduced an instrumented steering wheel (ISW) to measure three components of force and three components of the moment applied by each hand, separately. Using the ISW, we studied the kick plate manoeuvre. The kick plate manoeuvre is an emergency manoeuvre to recover a lateral disturbance inducing a spin. The drivers performed the manoeuvre either keeping two hands on the steering wheel or one hand only. In both cases, a few instants after the lateral disturbance induced by the kick plate occurred, a torque peak was applied at the ISW. Such a torque appeared to be unintentional. The voluntary torque on the ISW occurred after the unintentional torque. The emergency manoeuvre performed with only one hand was quicker, since, if two hands were used, an initial fighting of the two hands against each other was present. Therefore, we propose to model the neuro-muscular activity in driver models to consider the involuntary muscular phenomena, which has a relevant effect on the vehicle dynamic response.

1. Introduction

The driver acts on the steering wheel by applying forces and moments with the hands, activating the muscles with voluntary and involuntary actions. Pick and Cole [1] presented a neuro-muscular system (NMS) model that replicates the driver’s actions while driving. They highlighted the involuntary actions as a consequence of an inner control loop that allows the driver to maintain a certain position in the space of the hands or arms, despite external disturbances. Similarly, in [2], Wei et al. developed a NMS model of the driver for the human–vehicle shared control in autonomous vehicles. The knowledge of the driver’s actions on the steering wheel allows the study of the interaction between the driver’s hands and the advanced driver assistance systems (ADAS) [3] to lead improvements in their activation procedures and make them less intrusive during their action. Saito et al. [4] developed an ADAS control able to intervene only in necessary situations.
In [5], the authors highlighted the importance of the steering feeling while driving. The authors studied the influence of the steering geometry on the applied steering torque. Cai et al. [6] presented a new method to classify the driver behaviours by analysing a set of data collected during normal driving. They obtained a driving fingerprint map that characterized the driver’s behaviour. By using such a classification, it is possible to train ADAS to customize their intervention. An instrumented steering wheel could also improve the performance of haptic guidance steering systems, which are actually ADAS for driver assistance [7].
In order to intervene correctly, ADAS require a deep knowledge of human–vehicle interactions, and the research on driver models is very active. Jiang et al. [8] proposed an electric power steering (EPS) logic developed adopting human simulated intelligent control (HSIC). The authors noticed that the information on the steering effort allows an increase in the performance of the proposed EPS control logic. Okamoto and Panagiotis [9] studied the performance of some data-driven human driver models that are able to predict the torque applied by the driver on the steering wheel. In [10,11], driver models were developed that imposed the steering wheel angle using a neural network.
Similarly, in [12,13,14], the driving styles were classified to optimize the ADAS intervention. Kolekar et al. [15] developed a human-like driver model that was able to capture the steering behaviour for both routine and emergency situations. Zhu et al. [16] identified the driver behaviour characteristics of novel, normal, and skilled drivers and applied the model parameters to a driving simulation, obtaining personalized control in order to successfully follow a path. You et al. [17] identified driver parameters using Kalman filters, but concluded that the driver parameters were not time constant, but varied during the driving task. Gote et al. [18] presented a method to identify the driver characteristics using inverse dynamic optimal control. In [19], the authors studied a clustering method for driver’s steering intention classification, based on certain steering action parameters, such as steering angle and applied torque. In [20,21], the authors proposed two different methods for driver behaviour analysis, considering the available vehicle operation information.
Some authors, such as [22,23,24], analysed vehicle dynamic signals to identify the driver behaviours, while other authors preferred to use data measured at the human-machine interface, such as electrocardiography (ECG) sensors [25] or wearable sensors [26]. In [27], the authors proposed the use of physiological data of the driver to analyse his state while driving.
None of the presented works studied the forces and the moments applied by the driver’s hands, which constitute the direct interaction between the driver and the vehicle. The knowledge of such interactions drives a better comprehension of the phenomena that occur while driving.
The driver applies forces and moments on the steering wheel in all directions, and not only tangentially. The driver’s action is disturbed by the reaction forces of the steering wheel and by the inertia forces due to the vehicle’s dynamics, forcing the driver to apply forces and moments in every direction to counteract these disturbing forces [28]. In the literature, attempts have been made to study such phenomena by using instrumented steering wheels, the only vehicle component that the driver uses for lateral vehicle control.
To develop control logics for EPS systems, sensors are needed to measure the torque on the steering wheel, to correctly set the power steering intervention. Gabrielli et al. [29] presented an instrumented steering wheel, created by cutting a steering wheel into three sectors, each one connected with the steering hub by a sensing component with strain gauges, used to measure the resultant of the forces applied to each sector. The instrumented steering wheel was used to characterize the response of healthy drivers and the response of drivers with disabilities in order to customize the EPS intervention [30]. From this paper, they found that the drivers applied a non-negligible force in a direction orthogonal to the steering plane. The instrumented steering wheel used in the cited papers did not allow measuring the force and moment components applied by each hand separately.
The authors presented an instrumented steering wheel with two six-component load cells that allow the measurement of the three forces and the three moments applied by each hand separately. The instrumented steering wheel (ISW) is described in [3], and the experimental data are available in [31]. In [32,33], the authors studied the interaction between the drivers and the steering wheel in normal driving situations and in emergency situations. They identified some control patterns in the force application on the steering wheel, that are performed unconsciously by the majority of drivers, regardless of their driving experience. In [34], a ranking method for evaluating the handling of vehicles by using the forces measured by the instrumented steering wheel was proposed.
The present paper reports an in-depth analysis of the driver-steering wheel interaction, considering the case of driving with one hand only and comparing it with the situation in which the driver acts on the steering wheel with two hands. The paper is developed as follows.
In Section 2, the instrumented steering wheel is briefly described, together with the experimental procedure. In Section 3, during an emergency manoeuvre, the forces applied by a set of drivers are analysed. The drivers hold the steering wheel with both of the hands during a kick plate manoeuvre. In Section 4, the same drivers keep only one hand on the steering wheel during the manoeuvre. In Section 5, the steering power required for counter steering is analysed.

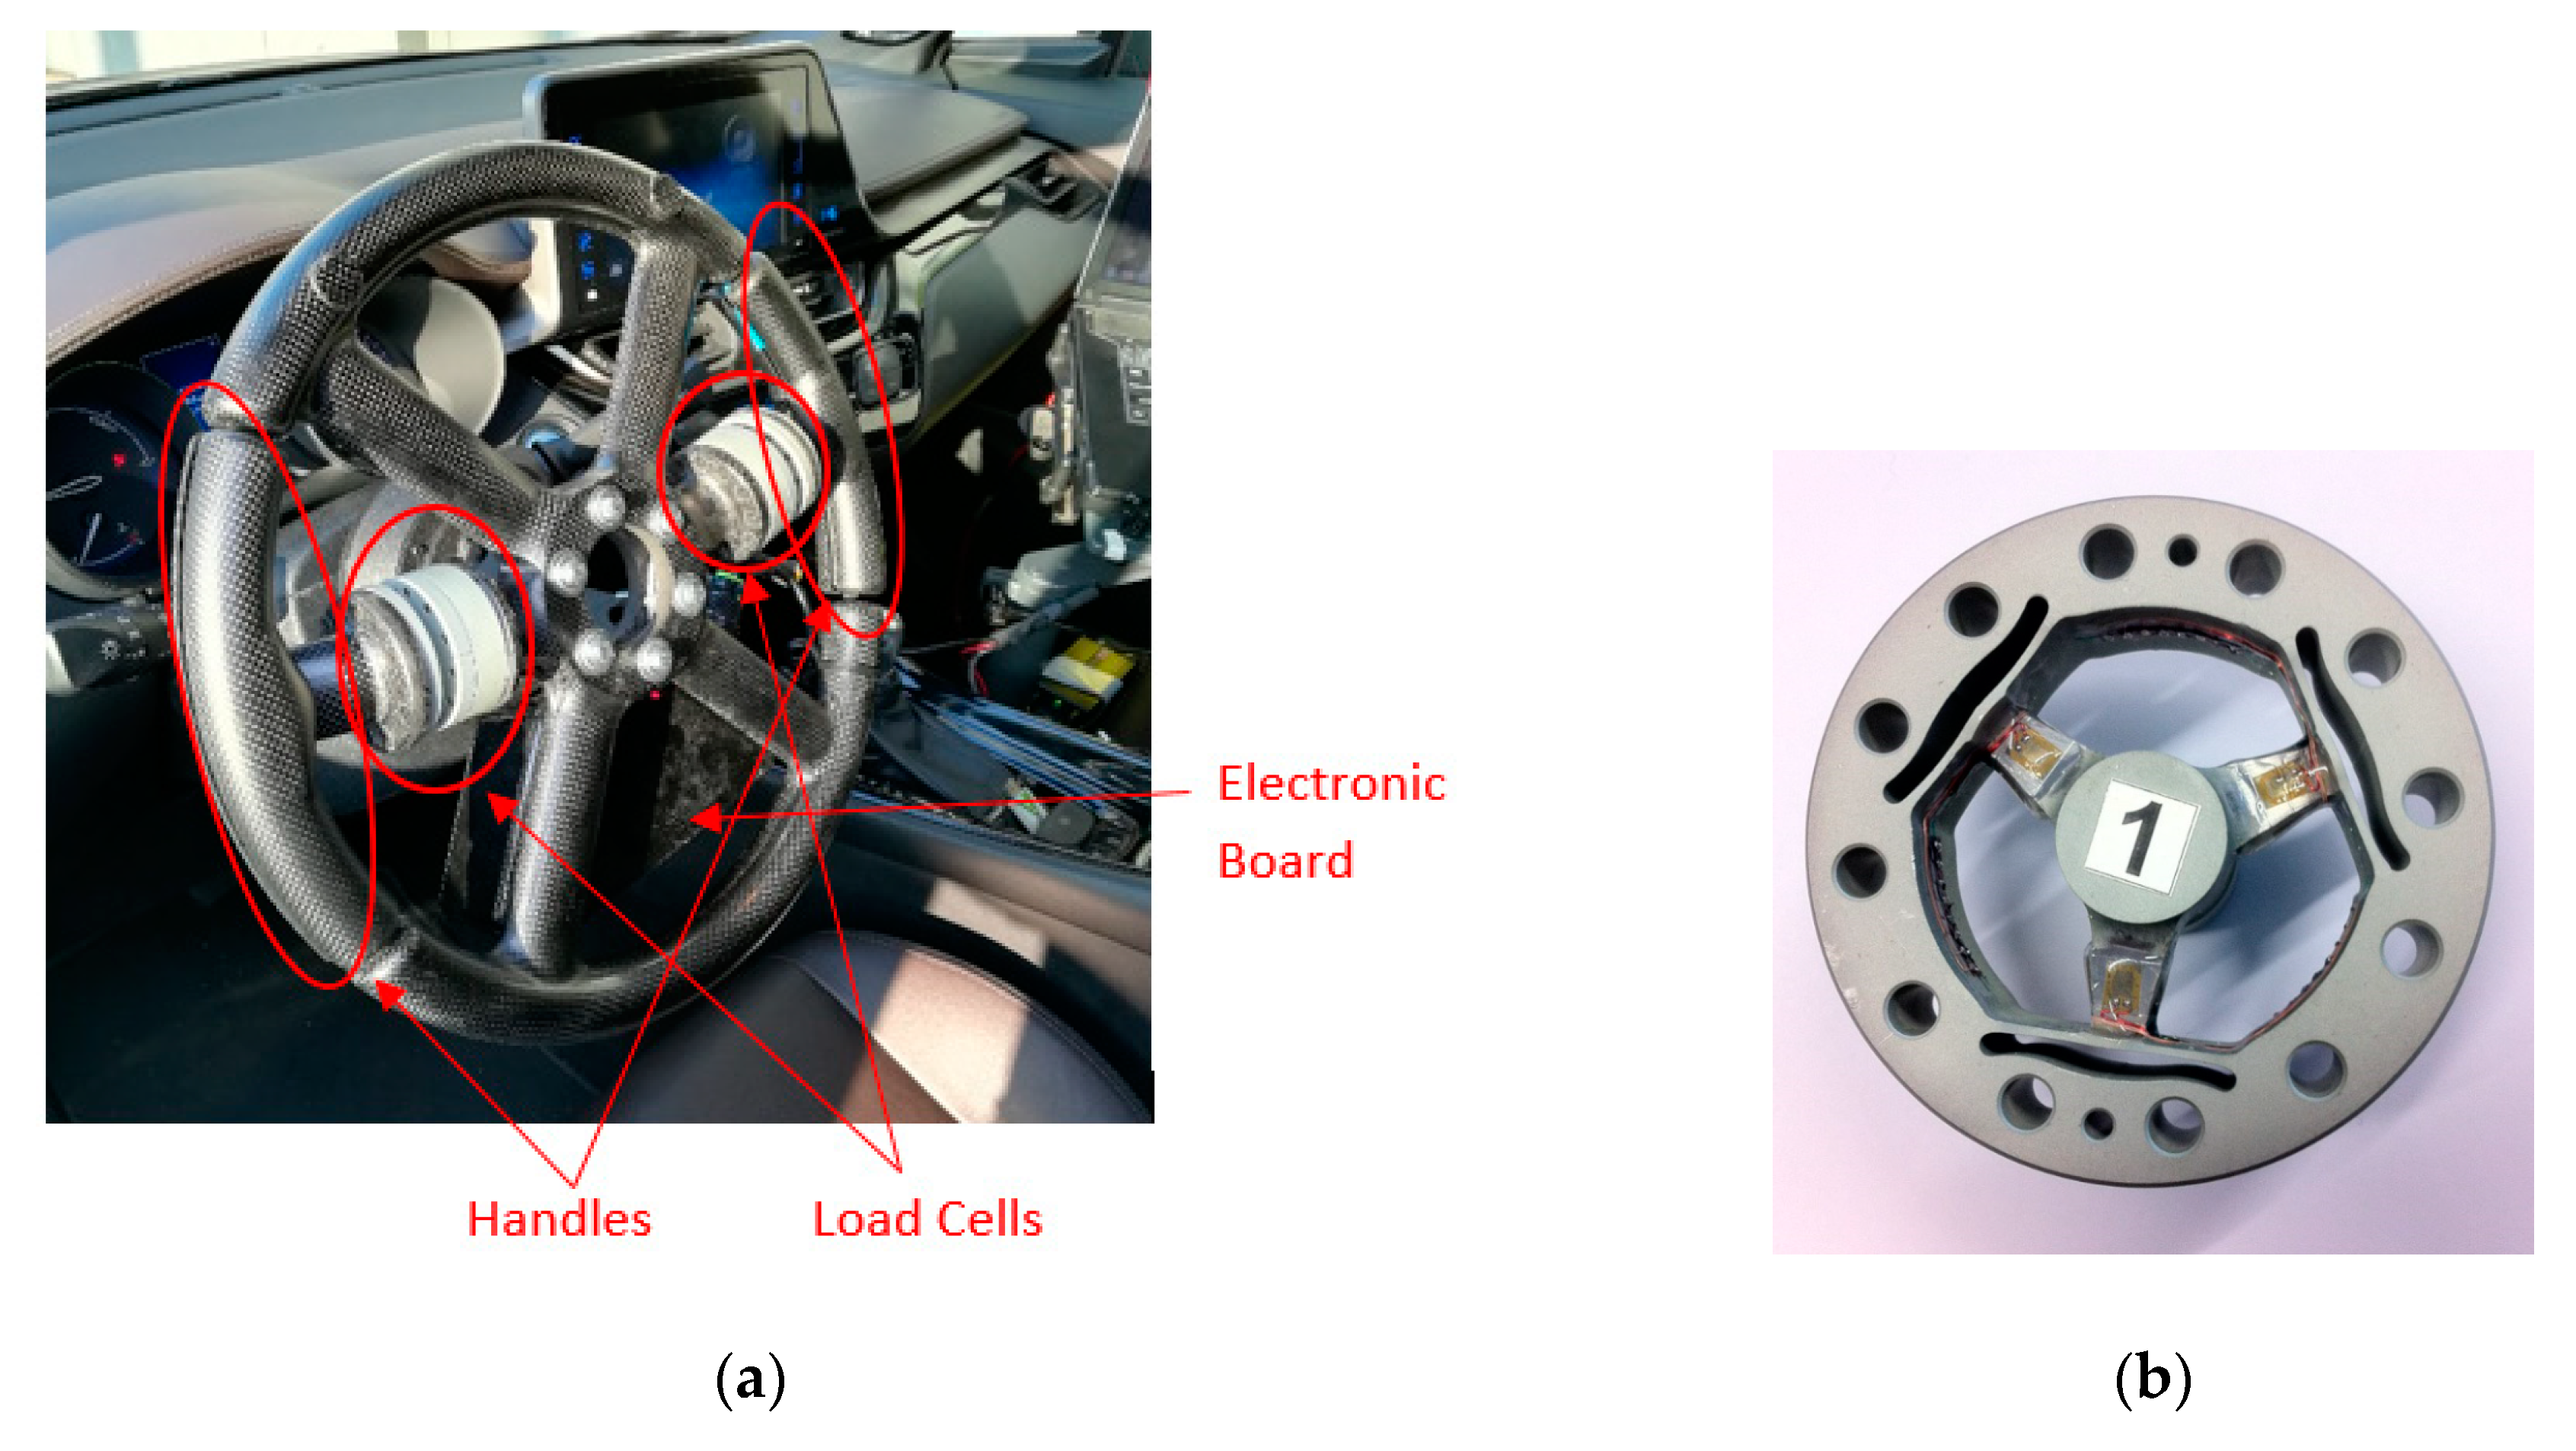
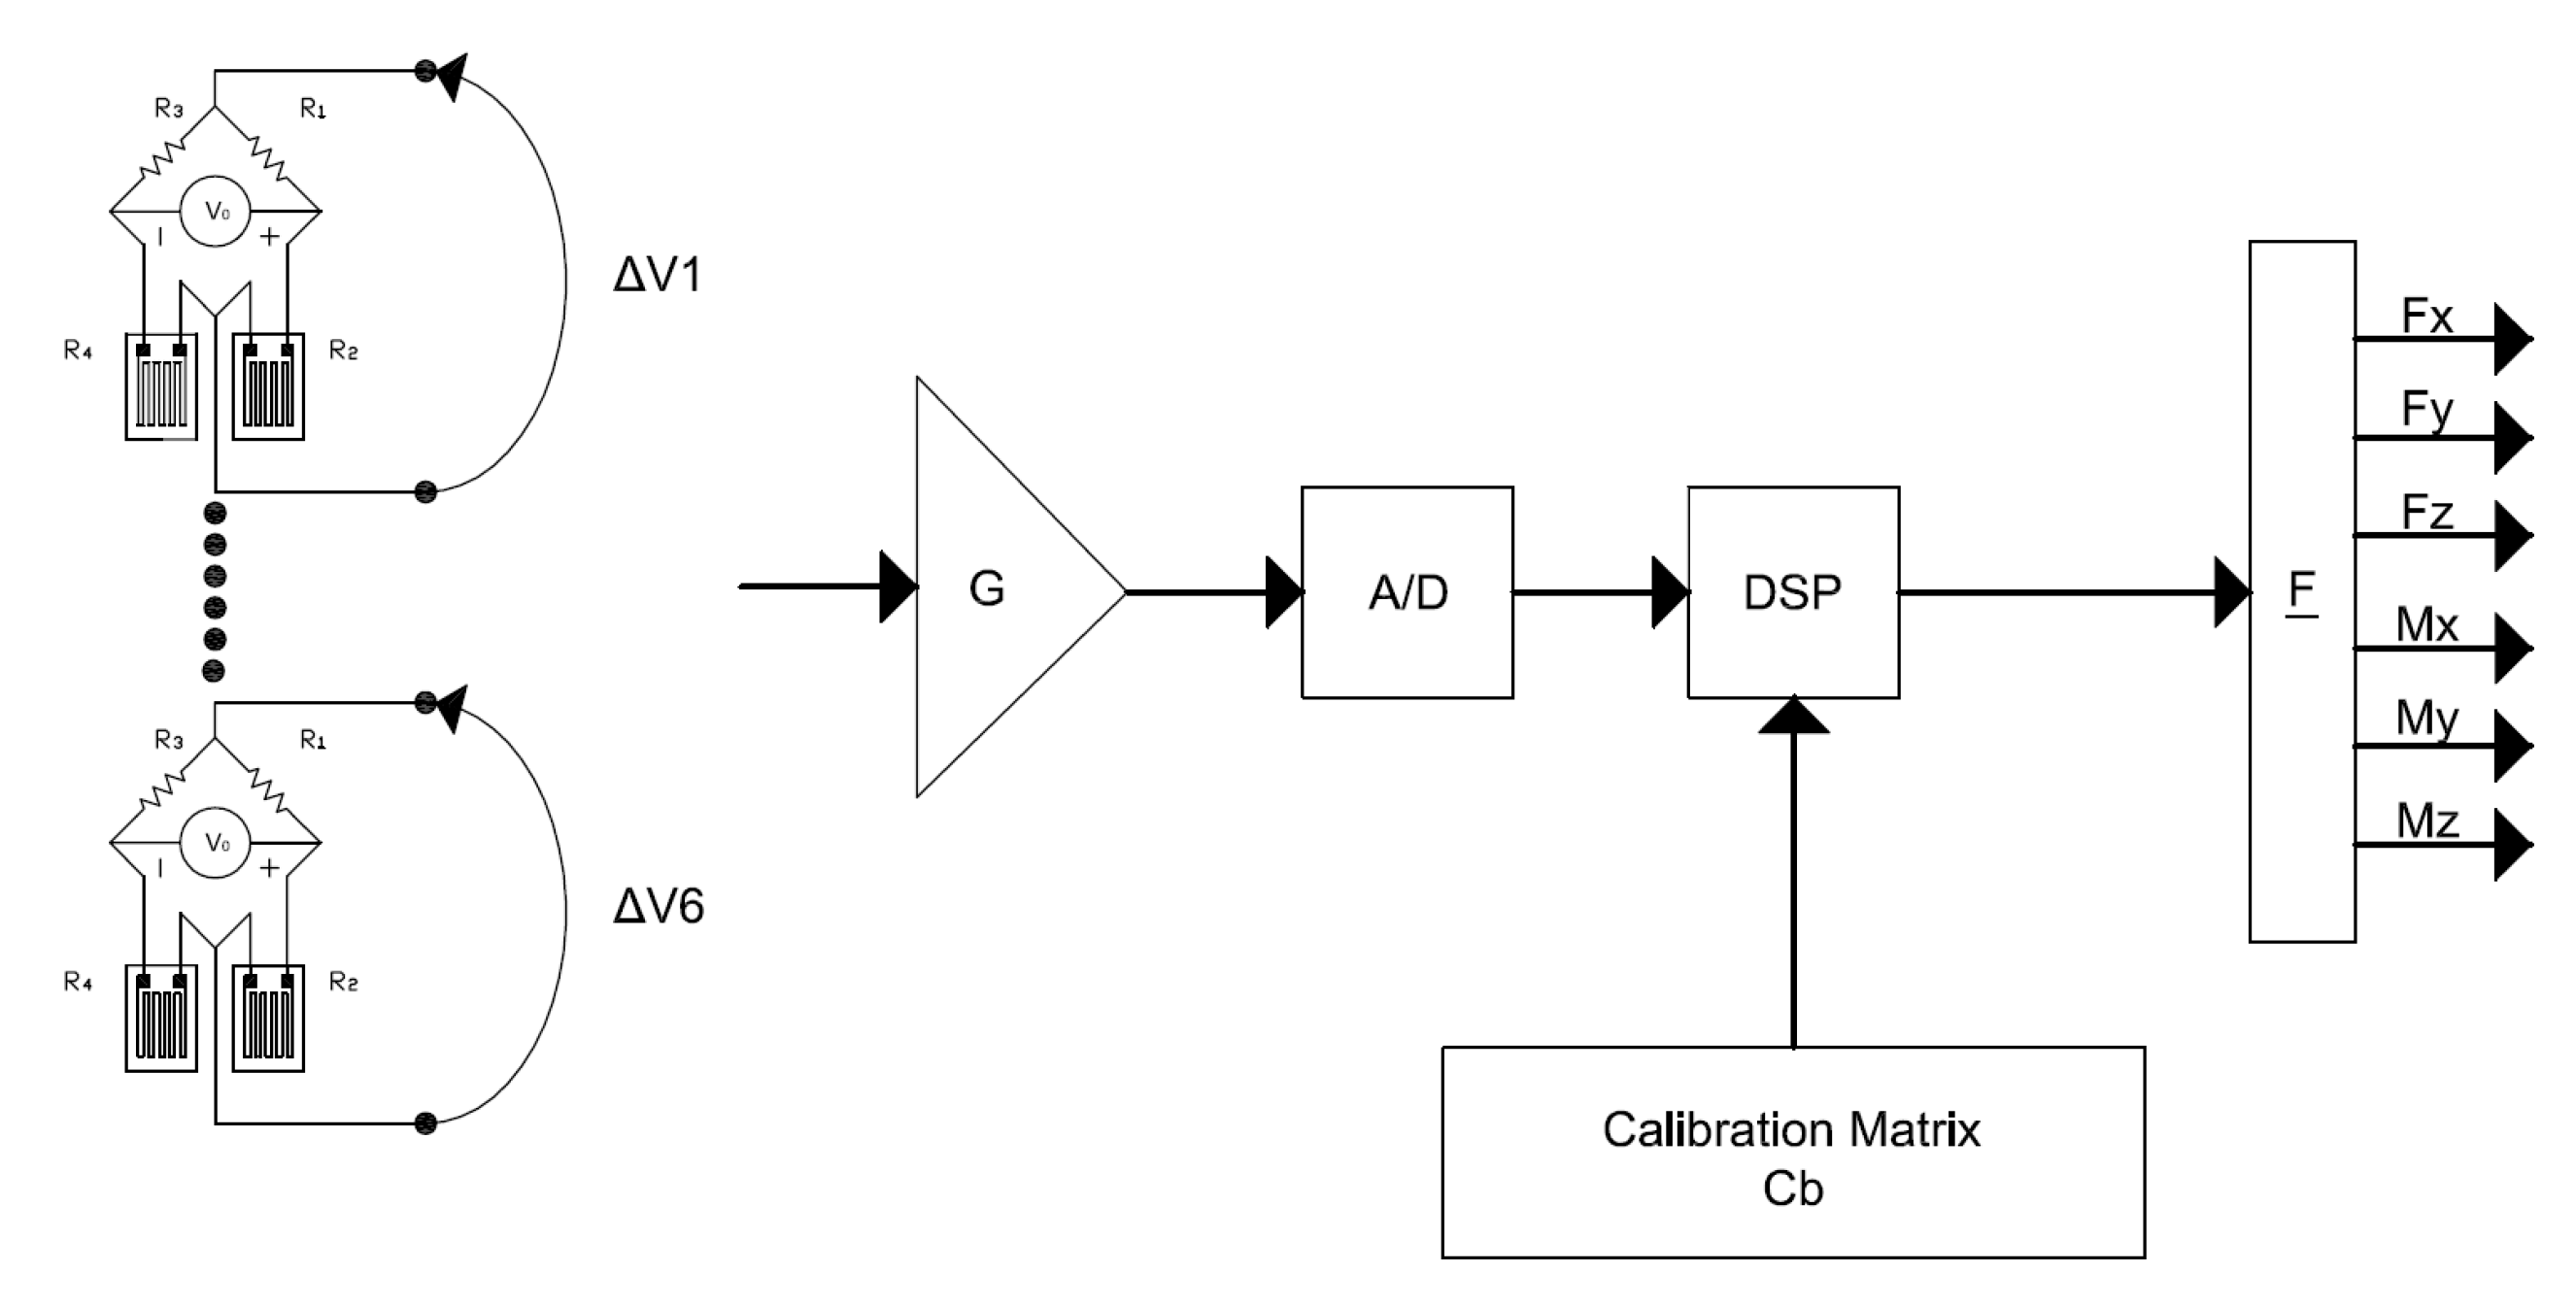
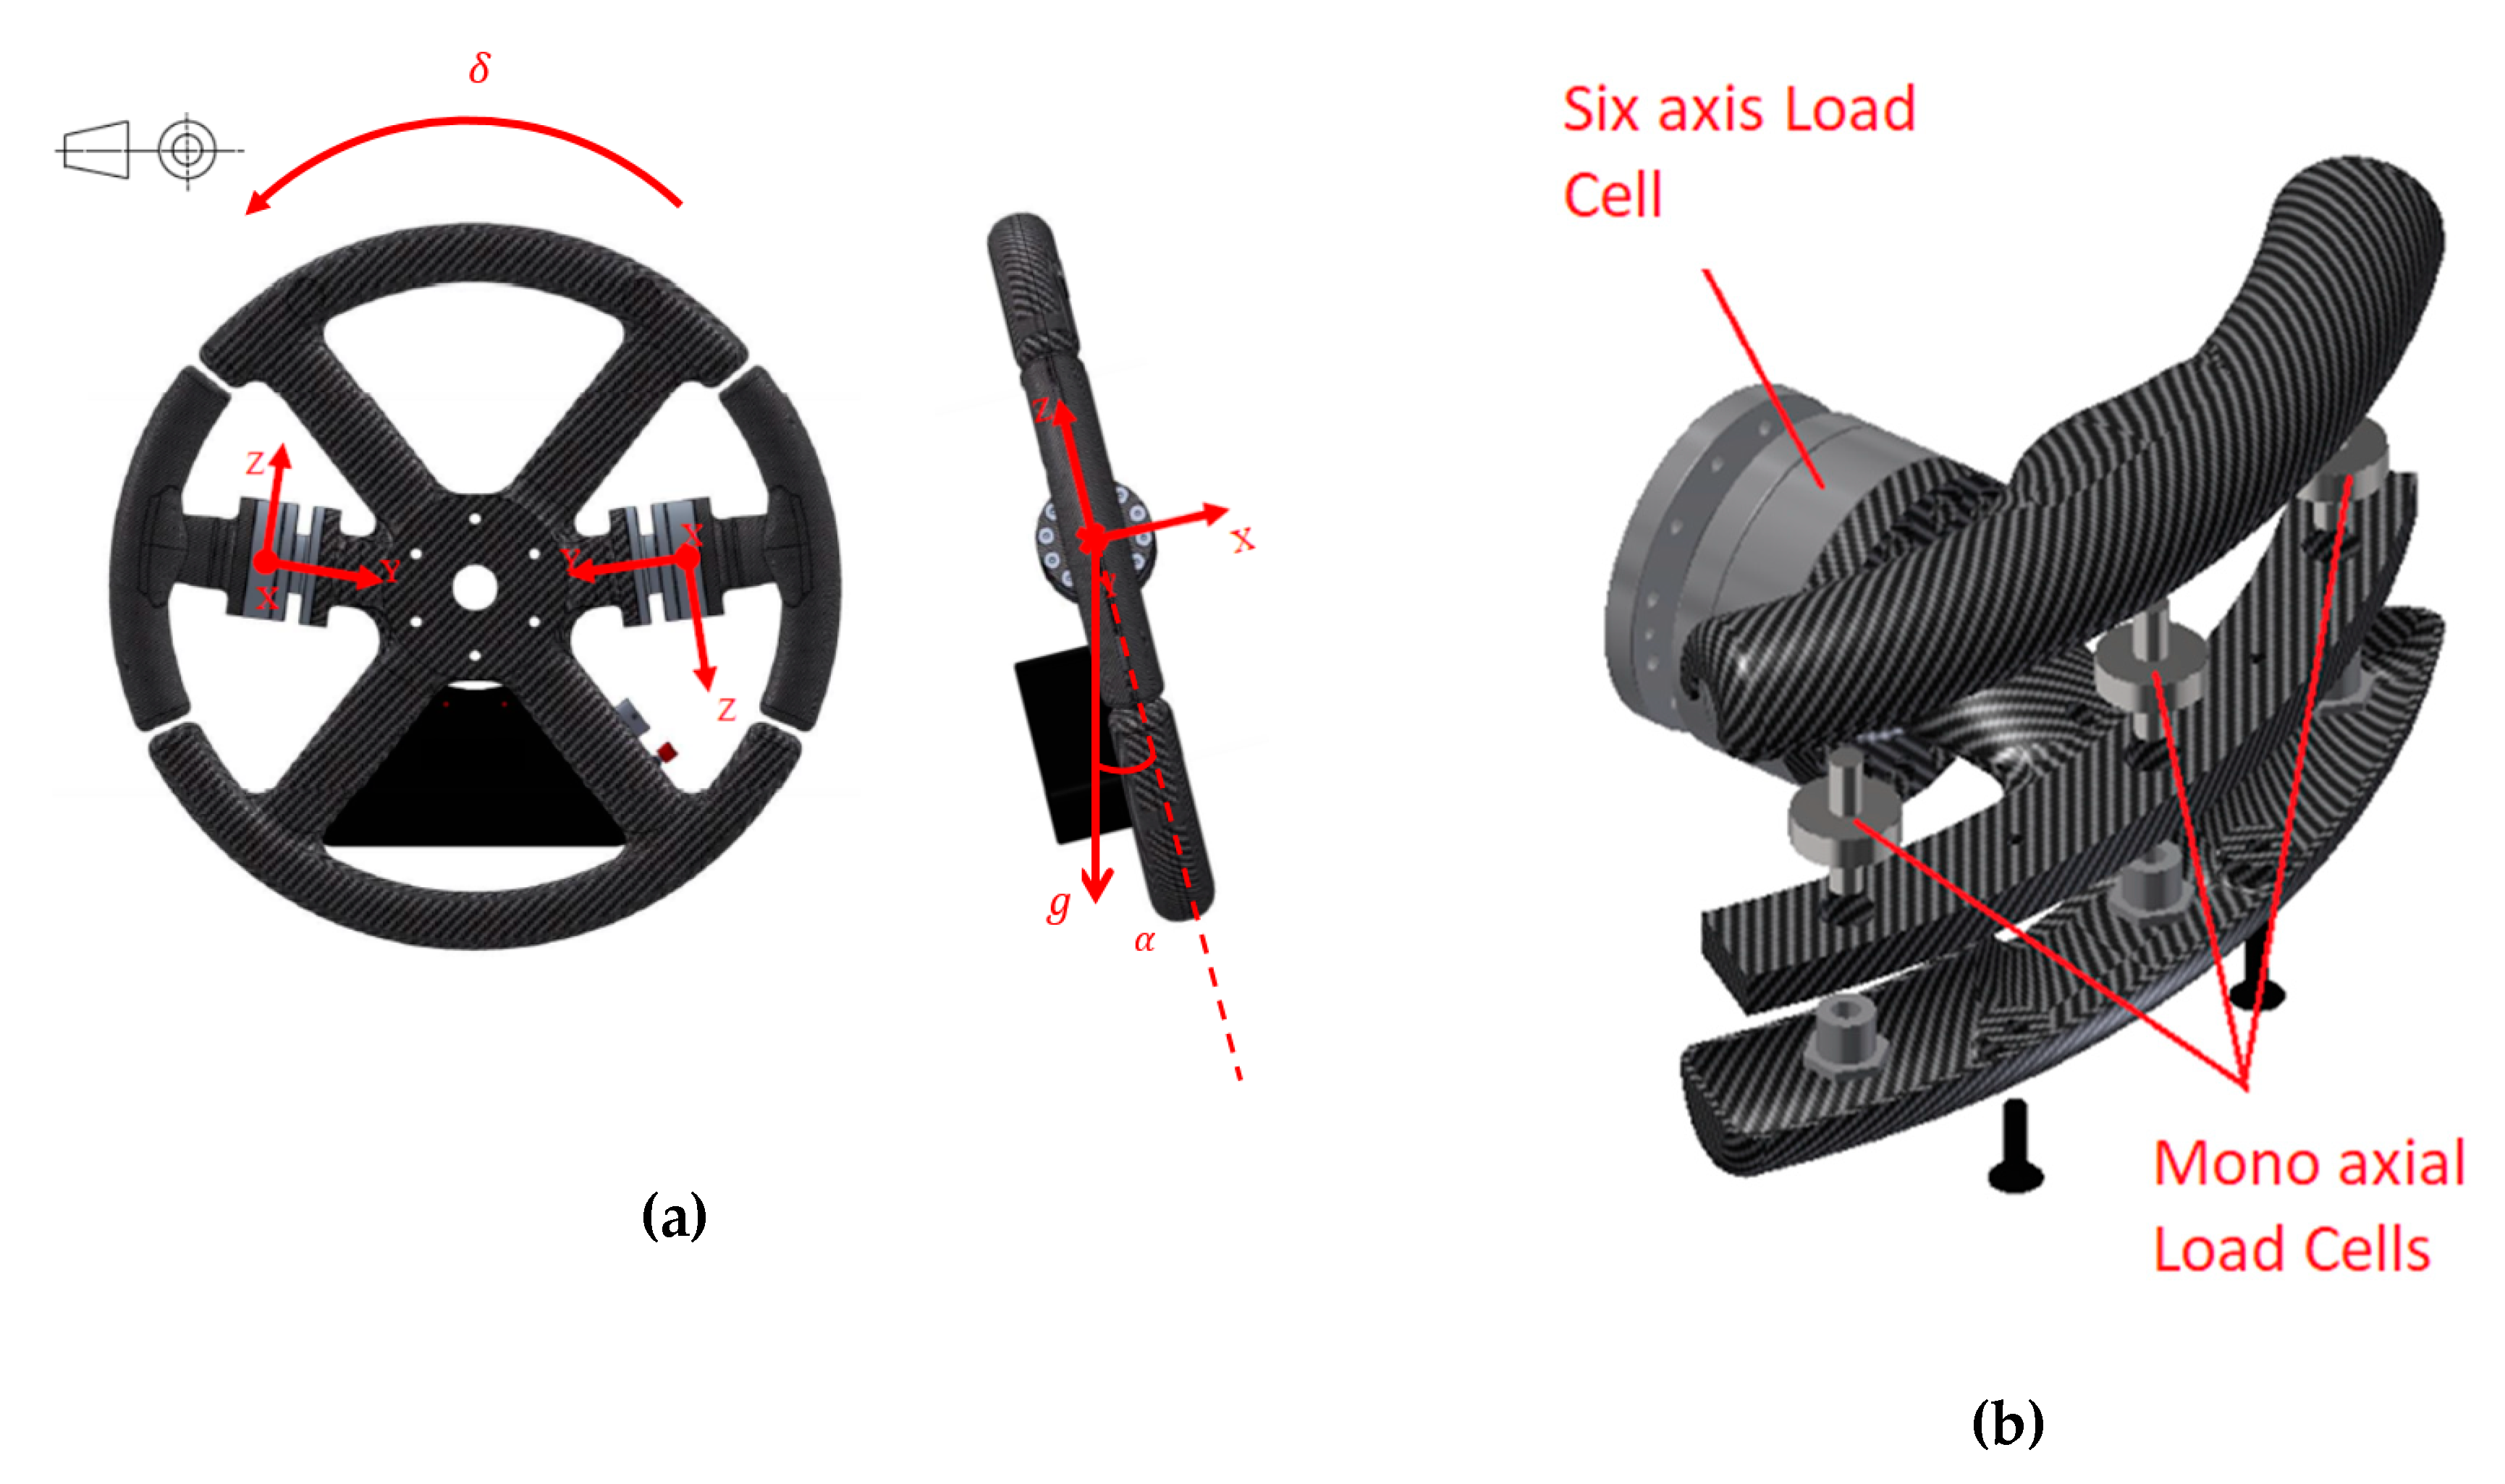
2. Experimental Setup

In this study, an instrumented steering wheel (Smartmechanical Company s.r.l., Albano S.Alessandro (BG), Italy) was adopted, which measured the six components of force and moment applied by each hand separately on the steering wheel. Figure 1 shows the body of the steering wheel made in carbon fibre composite to guarantee the mass, inertia, and stiffness levels were very similar to a standard steering wheel, in order not to modify the dynamics of the steering system.
Figure 1 highlights the two handles, which are the sensitive parts that the driver must grasp in order to measure the force that he/she applies to the steering wheel while driving. The handles are connected to the body of the steering wheel with two six-component load cells designed at the Politecnico di Milano (Smartmechanical Company s.r.l., Albano S.Alessandro (BG), Italy) [2] (see Figure 1).
The load cells are instrumented with twelve resistive strain gauges each, connected to form six Wheatstone half bridges. In such a way, the thermal effects are compensated because the thermal strains are measured by the strain gauges positioned on the opposite sides ( ε 1 and ε 2 respectively) of the spokes. The deformation read by the Wheatstone half bridge ε b r i d g e = ε 1 ε 2 , the thermal effect on the bridge measurement is null. The strain gauge signals are acquired by the electronic board integrated in the steering wheel, and the scheme is shown in Figure 2. The electronic board returns the force components applied by the single hand through the relationship
{ F m e a s _ M m e a s _ } = [ C b ] Δ V _
where F m e a s _ = { F x , F y , F z } T and M m e a s _ = { M x , M y , M z } T are the applied forces and moments vectors, [ C b ] the experimental calibration matrix [6 × 6], which links the force and moment components with the voltage outputs of the six strain gauges bridges Δ V _ = { Δ V 1 , Δ V 2 , Δ V 3 , Δ V 4 , Δ V 5 , Δ V 6 } T . Refer to Figure 3 for the load cells reference frames.
The force and moment signals, measured F m e a s _ , are then processed to compensate the static weight force that arises due to the inclination of the steering wheel F W _ , the inertial forces originated by the vehicle dynamics F q _ , and the steering wheel rotation F S W _ . This compensation makes the instrumented steering wheel usable on vehicles even during high speed transient manoeuvres.
F _ = F m e a s _ F W _ F q _ F S W _ .
The signals output from the electronic board are published on the vehicle controller area network (CAN) and saved for post-processing data analysis. The signals from the instrumented steering wheel were acquired at a frequency of 748 Hz.
Three mono-axial load cells F i were installed inside each handle to allow measurement of the grip forces F g r i p (see Figure 3).
F g r i p = min ( | F x s i x a x i s   l o a d   c e l l i = 1 3 F i | , | i = 1 3 F i | )
In addition to the instrumented steering wheel, an OxTS RT3000 (Oxford Technical Solutions Ltd., Middleton Stoney, Oxfordshire, United Kingdom) inertial platform was installed on the vehicle to measure the vehicle accelerations in three directions and the vehicle body roll, pitch, and yaw. A GPS antenna was installed on the vehicle to track the vehicle’s route in the circuit. The data from the inertial platform and GPS were acquired at 100 Hz. The vehicle speed, steering angle, and yaw rate were obtained from the vehicle’s CAN network at a frequency of 82 Hz. As both the vehicle data and the steering wheel data were published on the same CAN network, they were synchronous.
All the data were resampled at 100 Hz. To allow the data synchronization between the inertial platform and the vehicle CAN signals, a cross-correlation analysis on the yaw rate signal acquired by the two sensors was completed.
The manoeuvre analysed was a kick plate test (Figure 4), in which the vehicle passed at constant speed on a plate that slides sideways when the rear axle passes over it. In this way, a lateral disturbance is introduced in a safe environment and the driver is forced to counter-steer to bring the vehicle back to its original trajectory. Several tests were performed by a panel of eight drivers, who performed the manoeuvre six times keeping both hands on the steering wheel, and three times holding only one hand on the steering wheel. The eight drivers were males from 24 to 57 years old, each with a valid driving license and different driving experience.

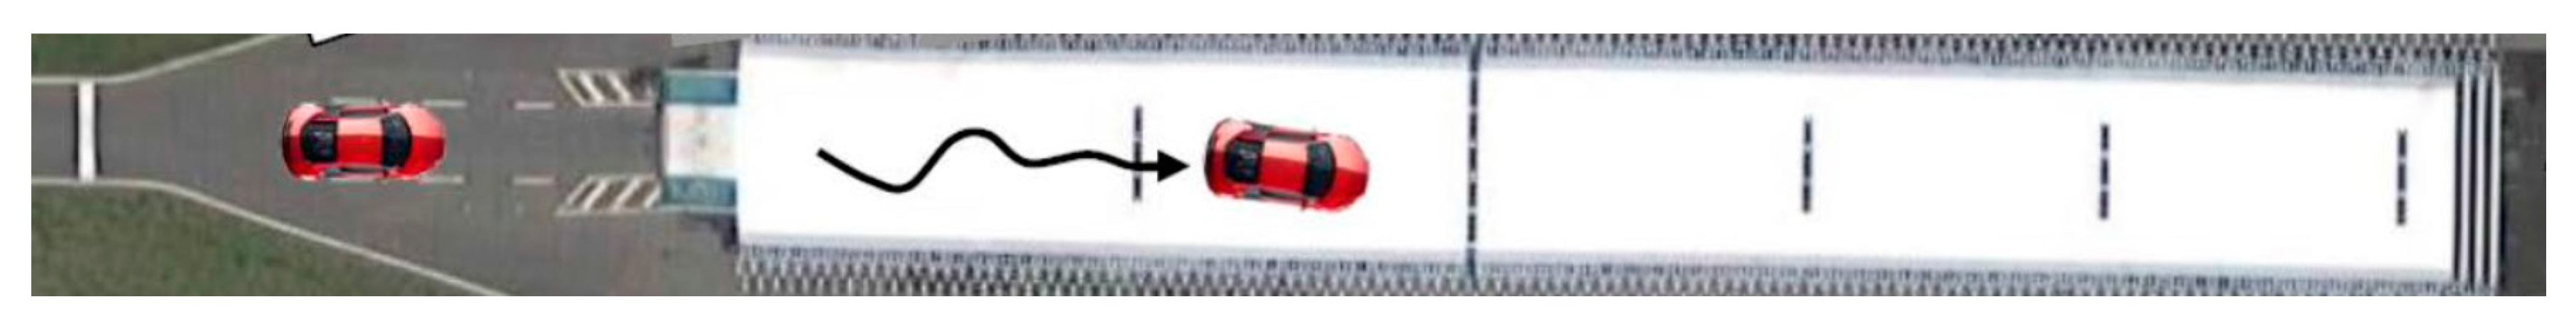
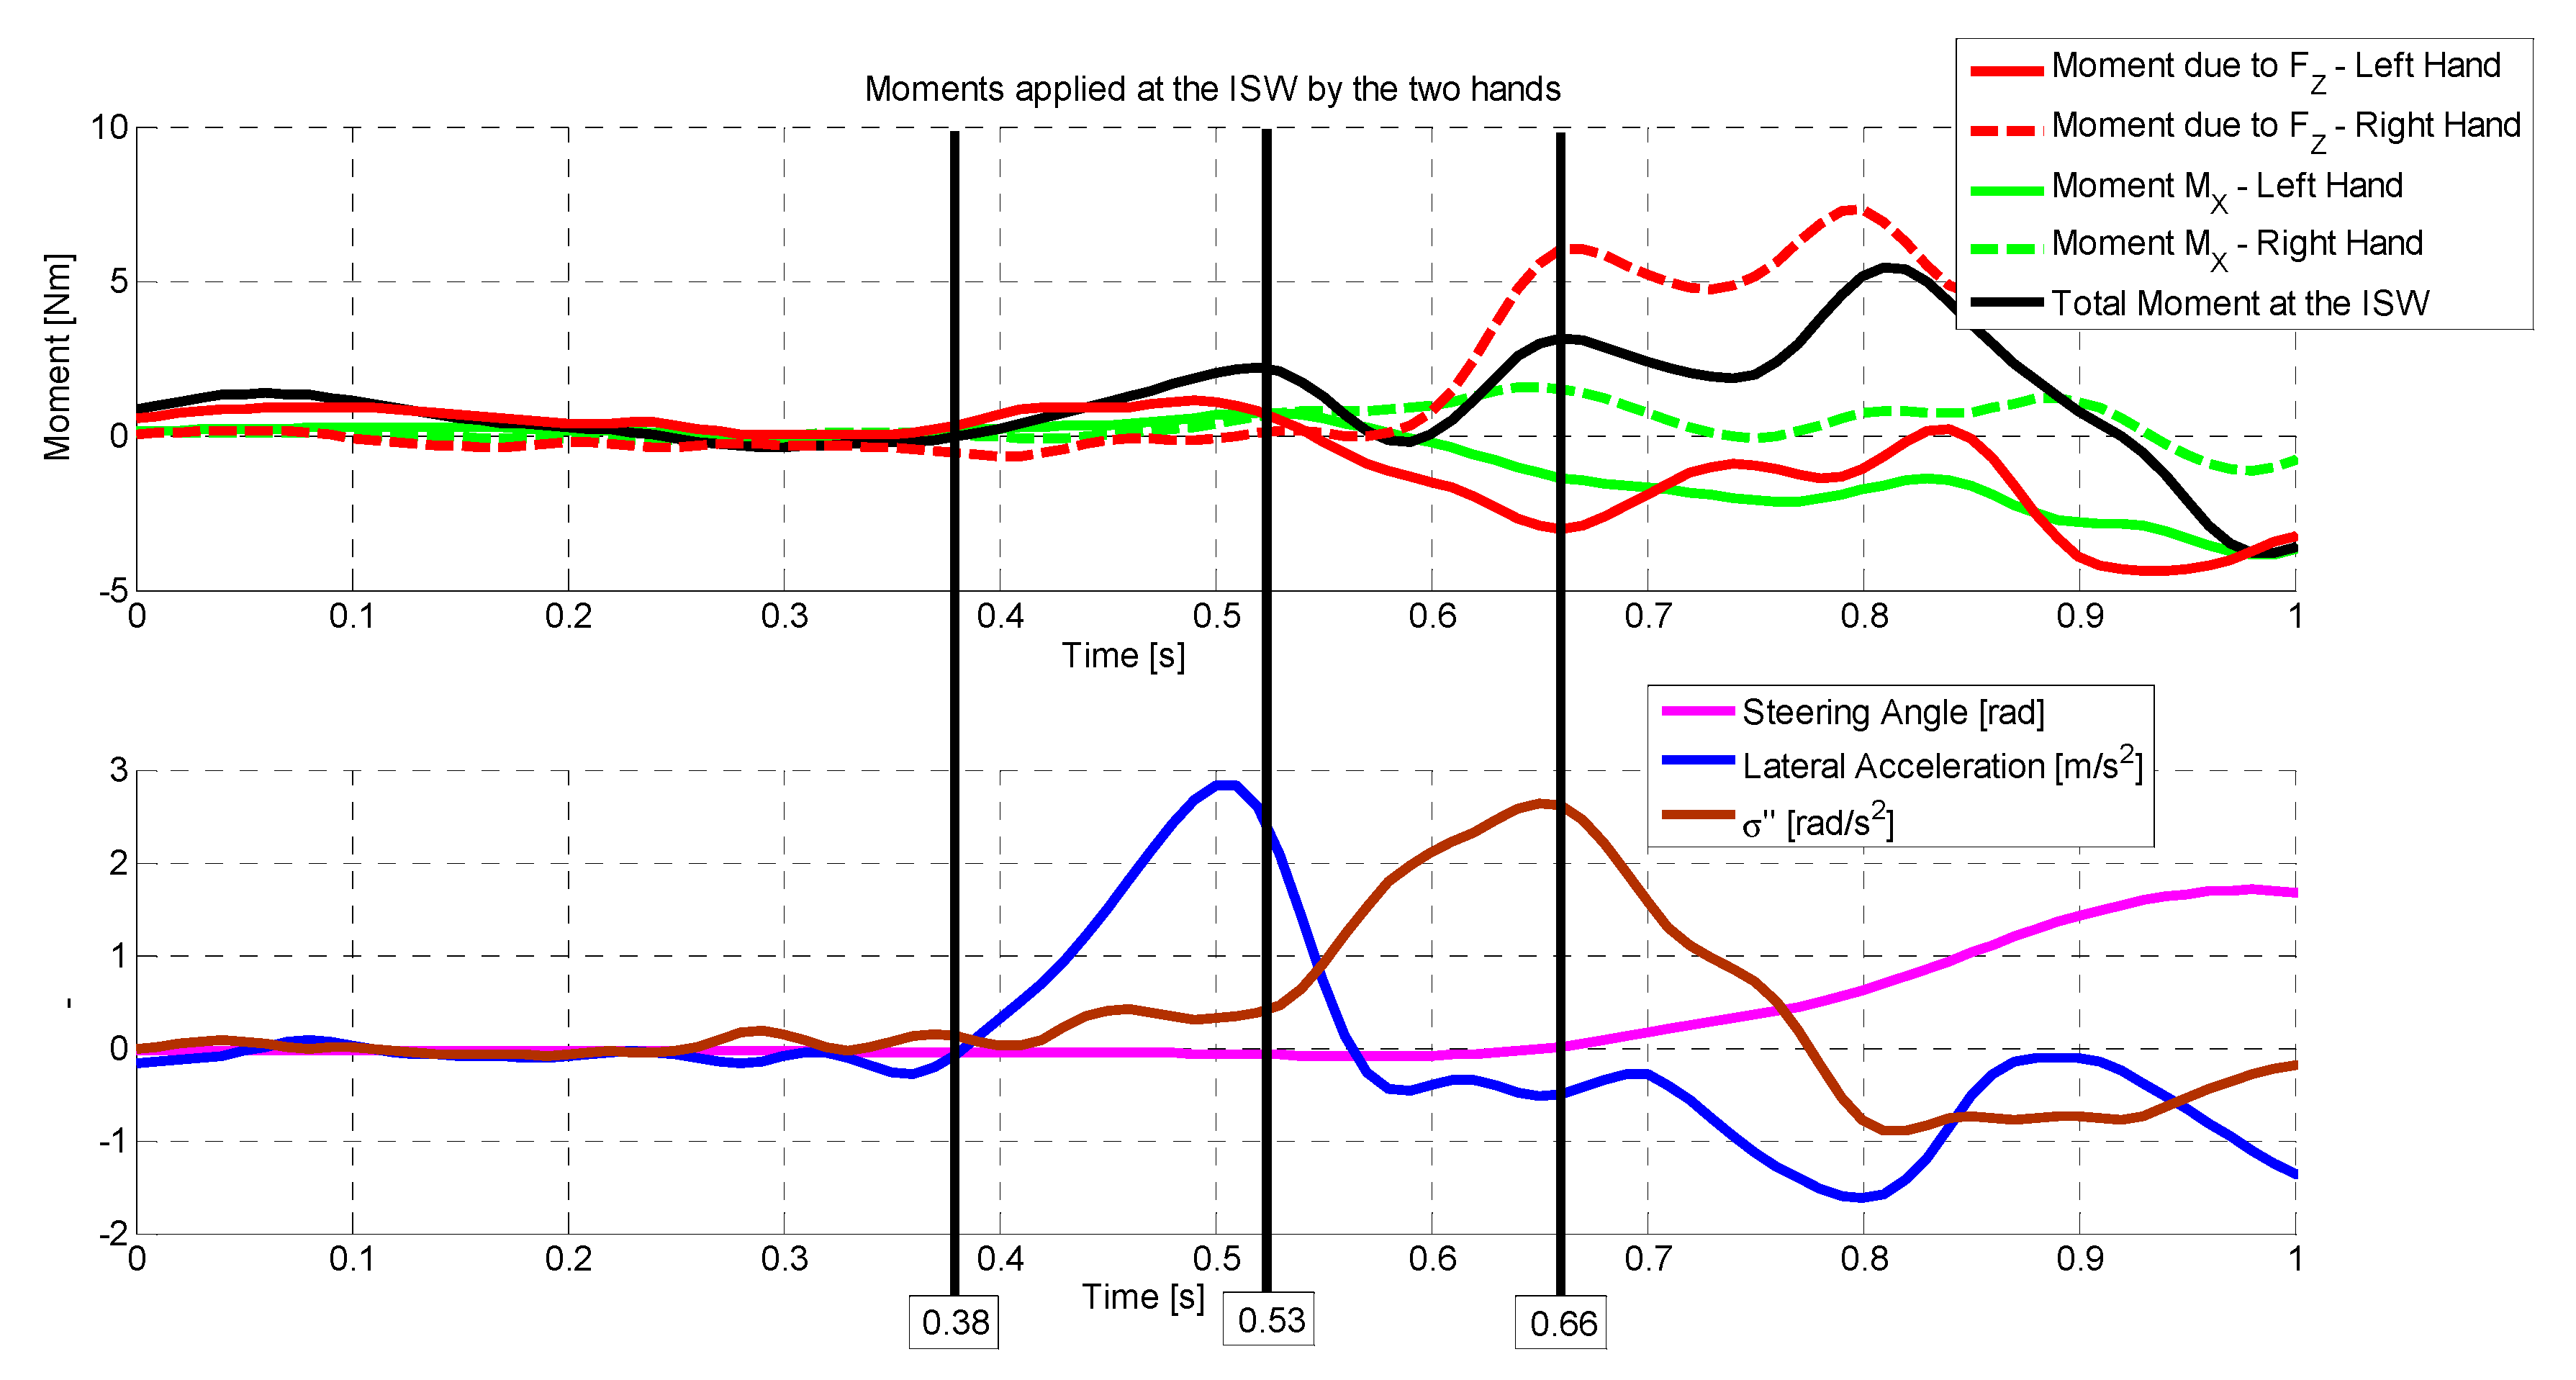
3. Kick Plate Disturbance while Driving with Two Hands

The first step was to analyse the manoeuvre performed by keeping both of the hands on the steering wheel, in correspondence with the two handles to allow the measurement of the forces and torques applied. Figure 5 shows that a few instants after the lateral disturbance, a torque was applied unconsciously or involuntarily by the driver, even before the steering wheel started to rotate.
In Figure 5, the lateral acceleration plot is reported, and the vehicle was disturbed laterally at instant t = 0.38s. A few moments later, at t = 0.53 s, there is a peak of torque on the steering wheel to counteract the sudden movement of the vehicle due to the kick plate input. This torque did not correspond to an effective rotation on the steering wheel, which instead began at t = 0.66 s, but was due to the driver’s unconscious muscular reflex. The torque that was applied unconsciously on the steering wheel, on average on all the datasets, was about 20% in the modulus with respect to the torque applied voluntarily to bring the vehicle back to the desired path. Table 1 shows the average time delay Δt between the lateral disturbance and the peak of torque unconsciously applied (Δt1), and between the peak of torque and the effective rotation of the steering wheel (Δt2) for different drivers. The time delay between the lateral disturbance and the effective rotation of the steering wheel Δt3 = Δt1 + Δt2 is also reported.

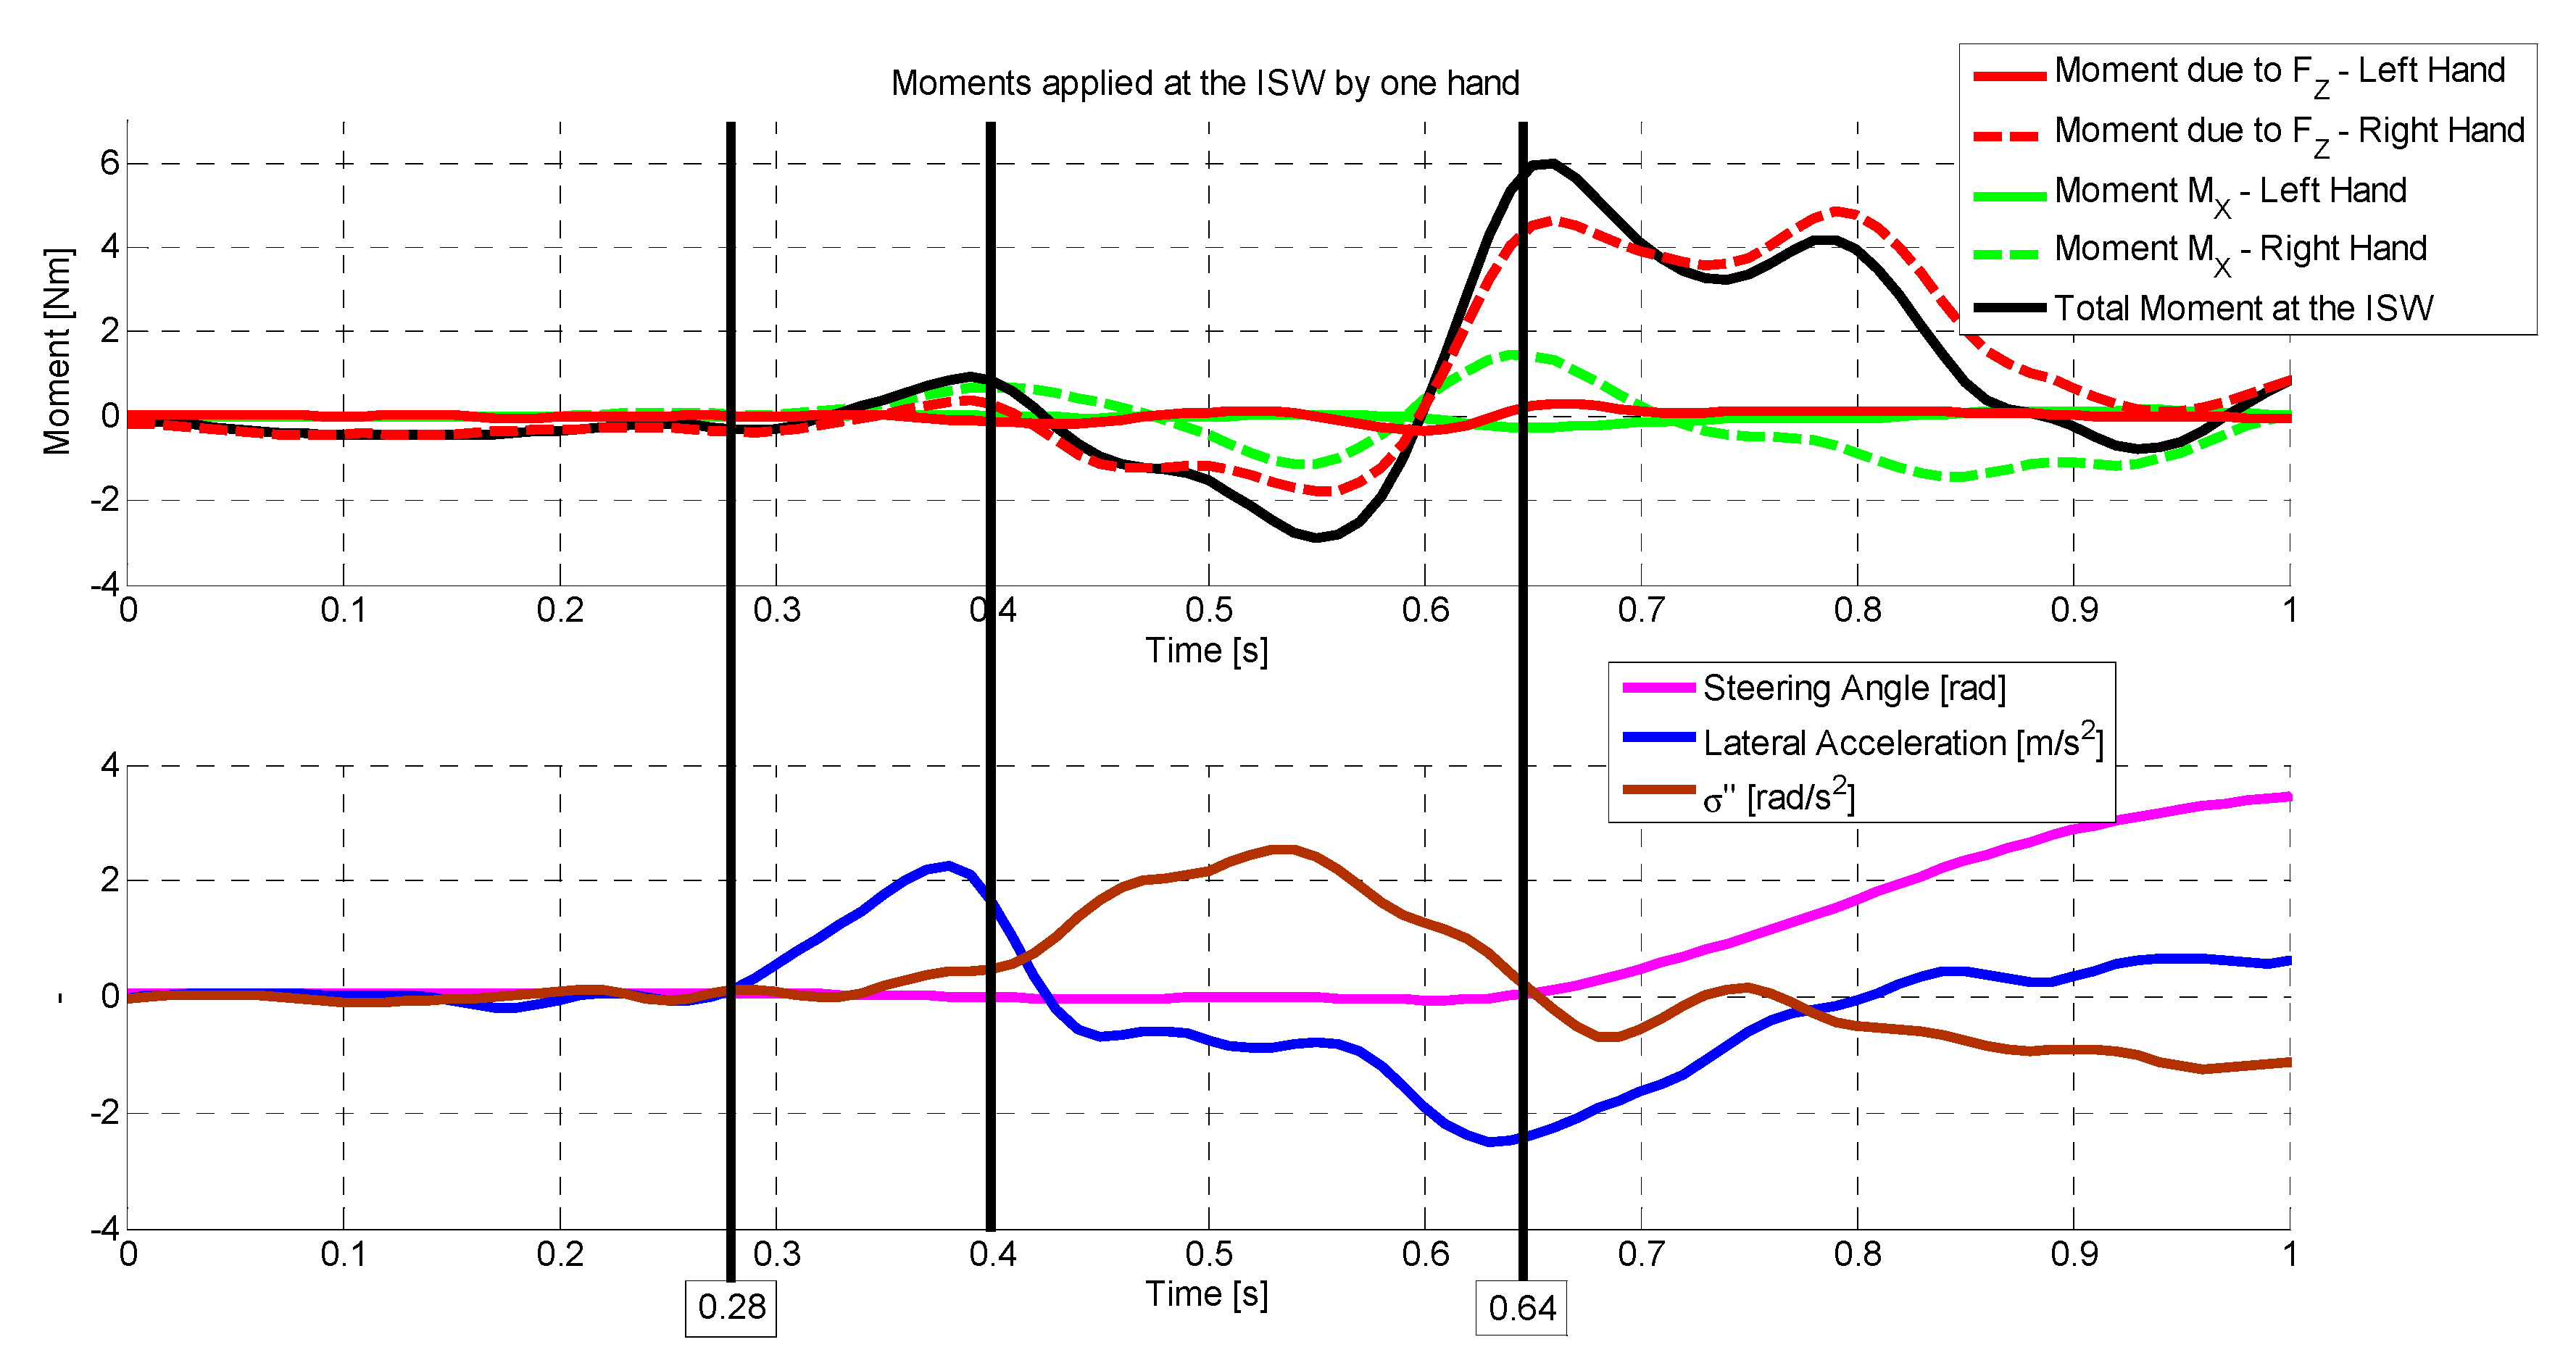
4. Kick Plate Disturbance while Driving with One Hand

The same manoeuvre considered in Section 3 was repeated while grasping the steering wheel with one hand. Figure 6 shows the forces applied to the steering wheel during this manoeuvre. The same phenomena reported in the manoeuvre performed with two hands on the steering wheel was found. At the instant t = 0.28 s, the lateral disturbance from the kick plate acted on the vehicle, and at t = 0.40 s the maximum torque peak was applied unconsciously by the driver. Again, this torque peak did not correspond to a rotation of the steering wheel, which occurred at t = 0.64 s. Even in this case, the unconsciously applied torque, on average on all the datasets, had a modulus of about 20% of the torque voluntarily applied to recover the desired trajectory.
Referring to the panel of drivers, Table 2 shows the average durations of the described phenomena, following the same procedure described in the previous paragraph. In the case of the one-hand steering wheel operation, there was a slight extension of the delay Δt1 between the application of the lateral disturbance and the peak of the torque applied unconsciously. On the contrary, there was a slight shortening of the delay Δt2 between the peak torque and the effective rotation of the steering wheel. This shorter time can be explained by analysing the opposite torques as applied by the two hands in the time interval Δt2 shown in Figure 5. The two hands were fighting against each other in the time interval Δt2. During one-handed operation, this effect on the applied forces did not exist. The reduced time interval is also reflected in Δt3 (the delay between the lateral disturbance and effective steering rotation).

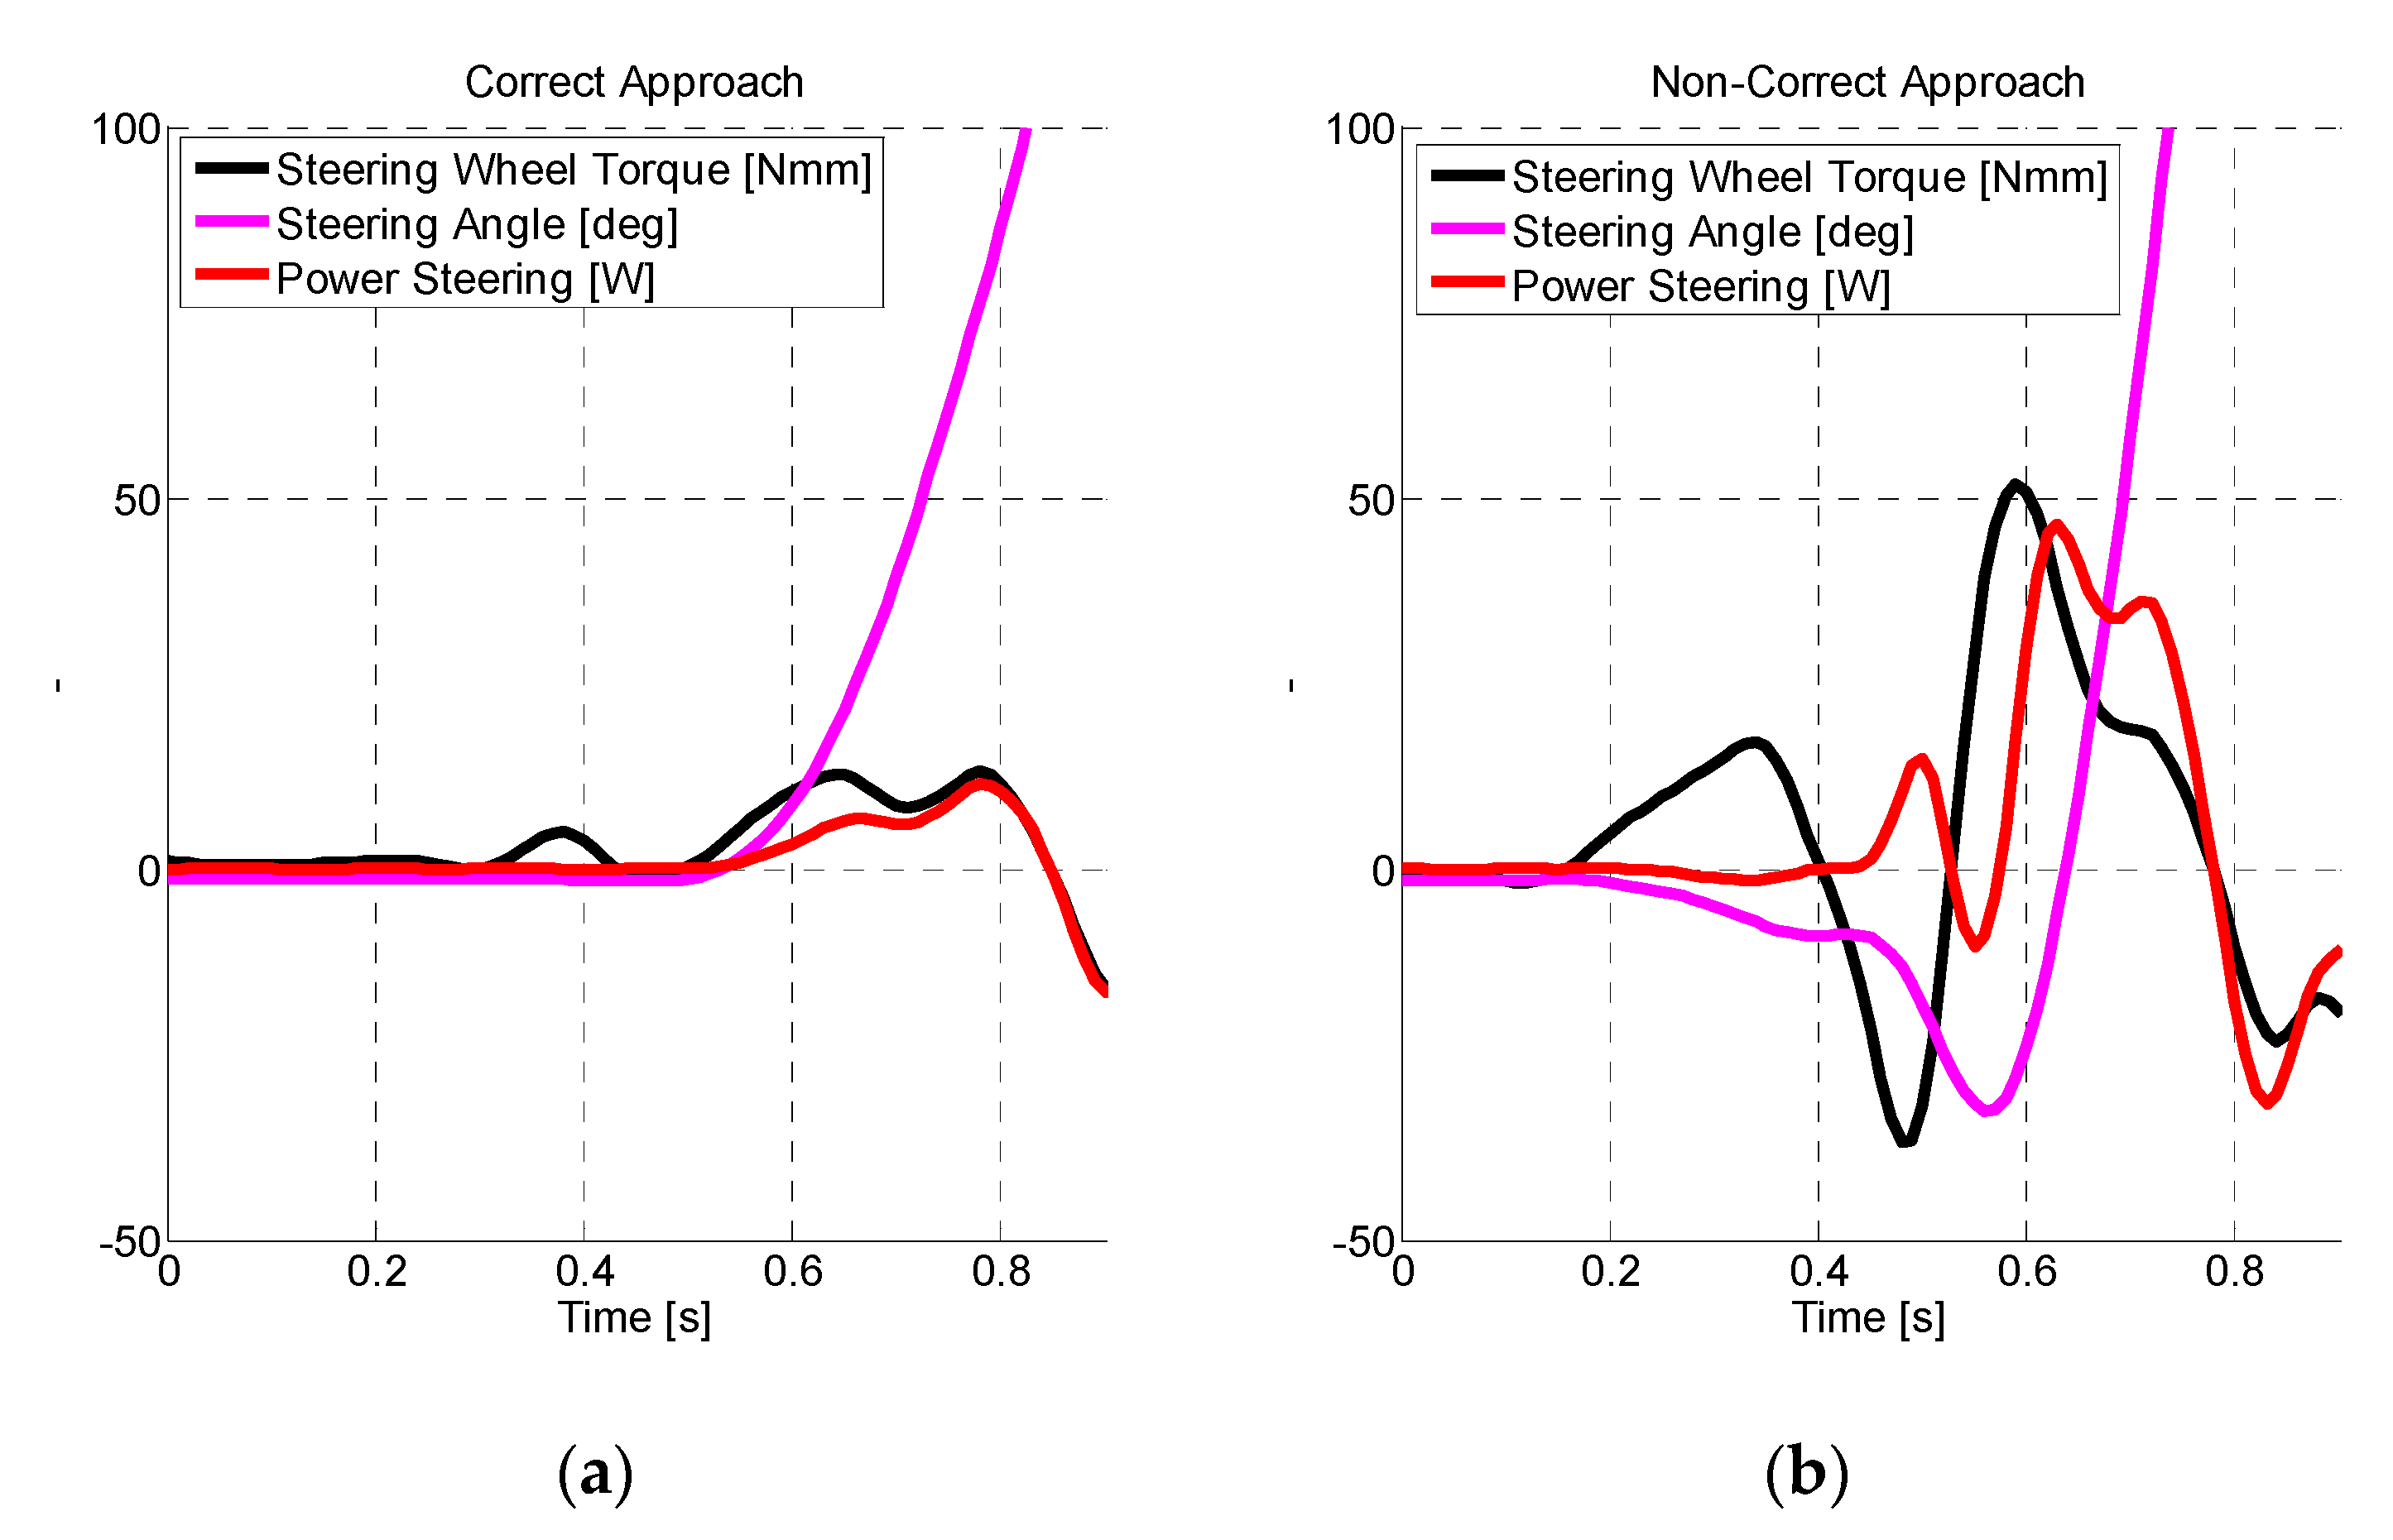
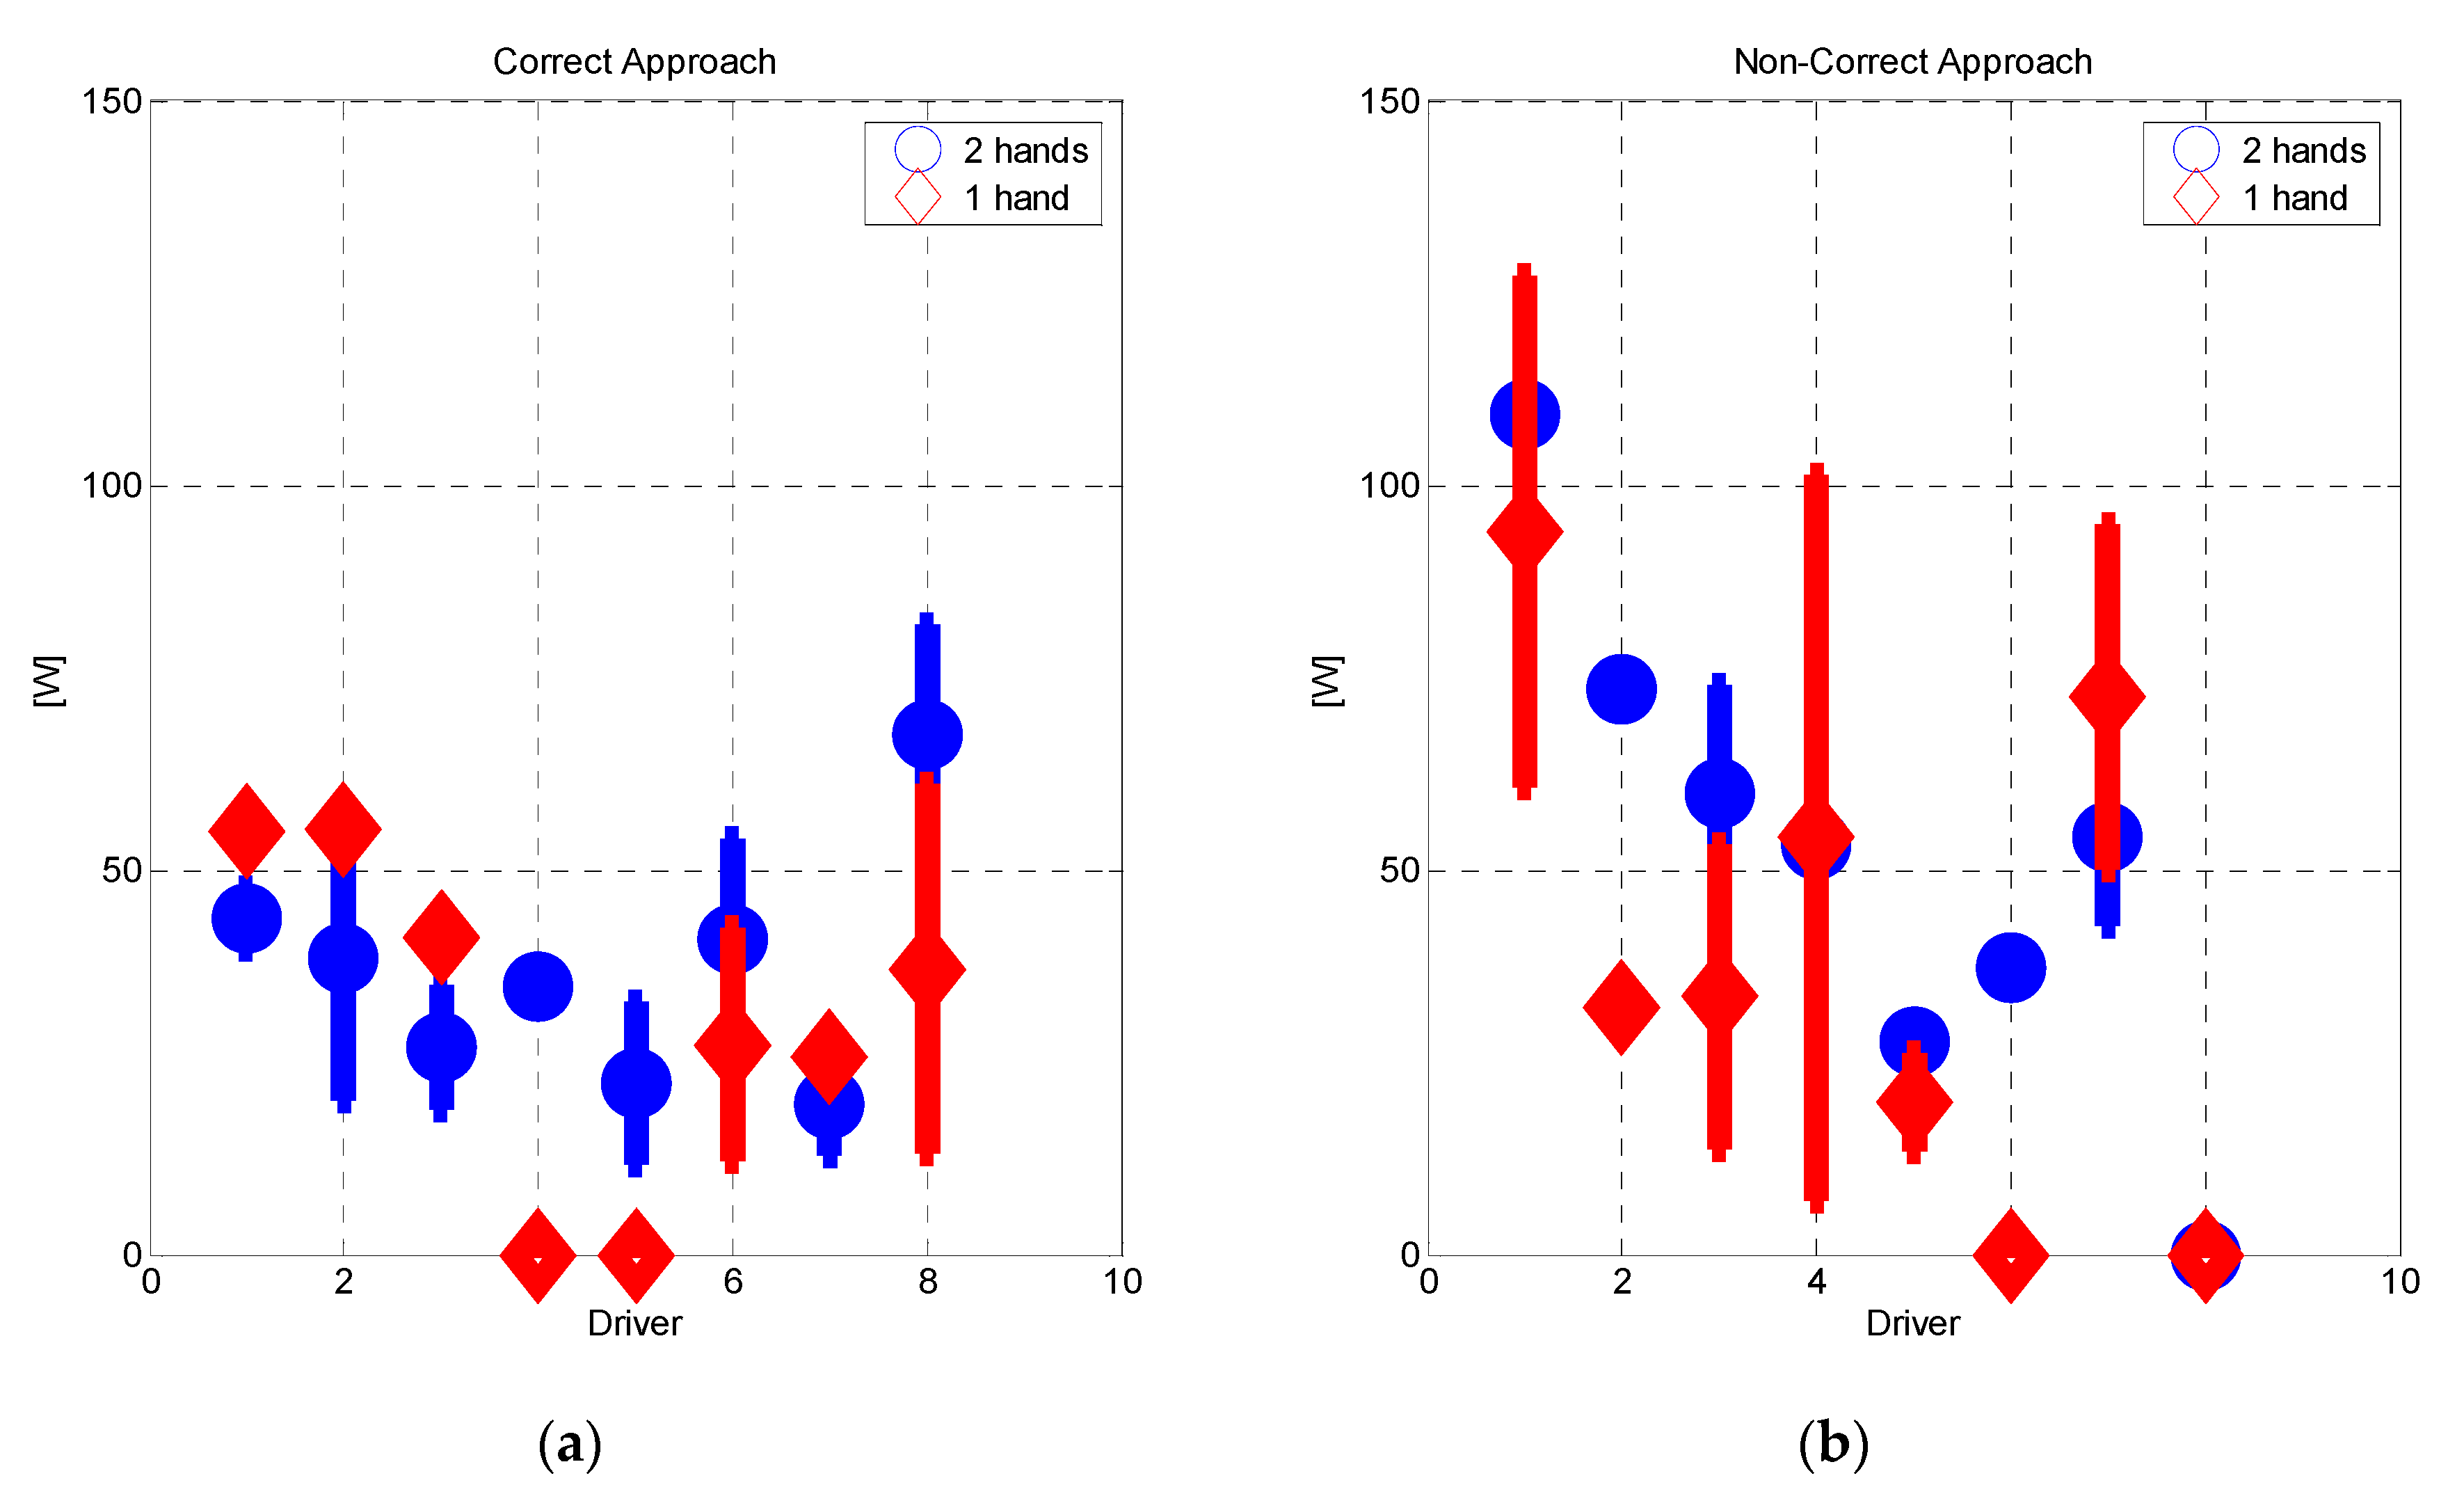
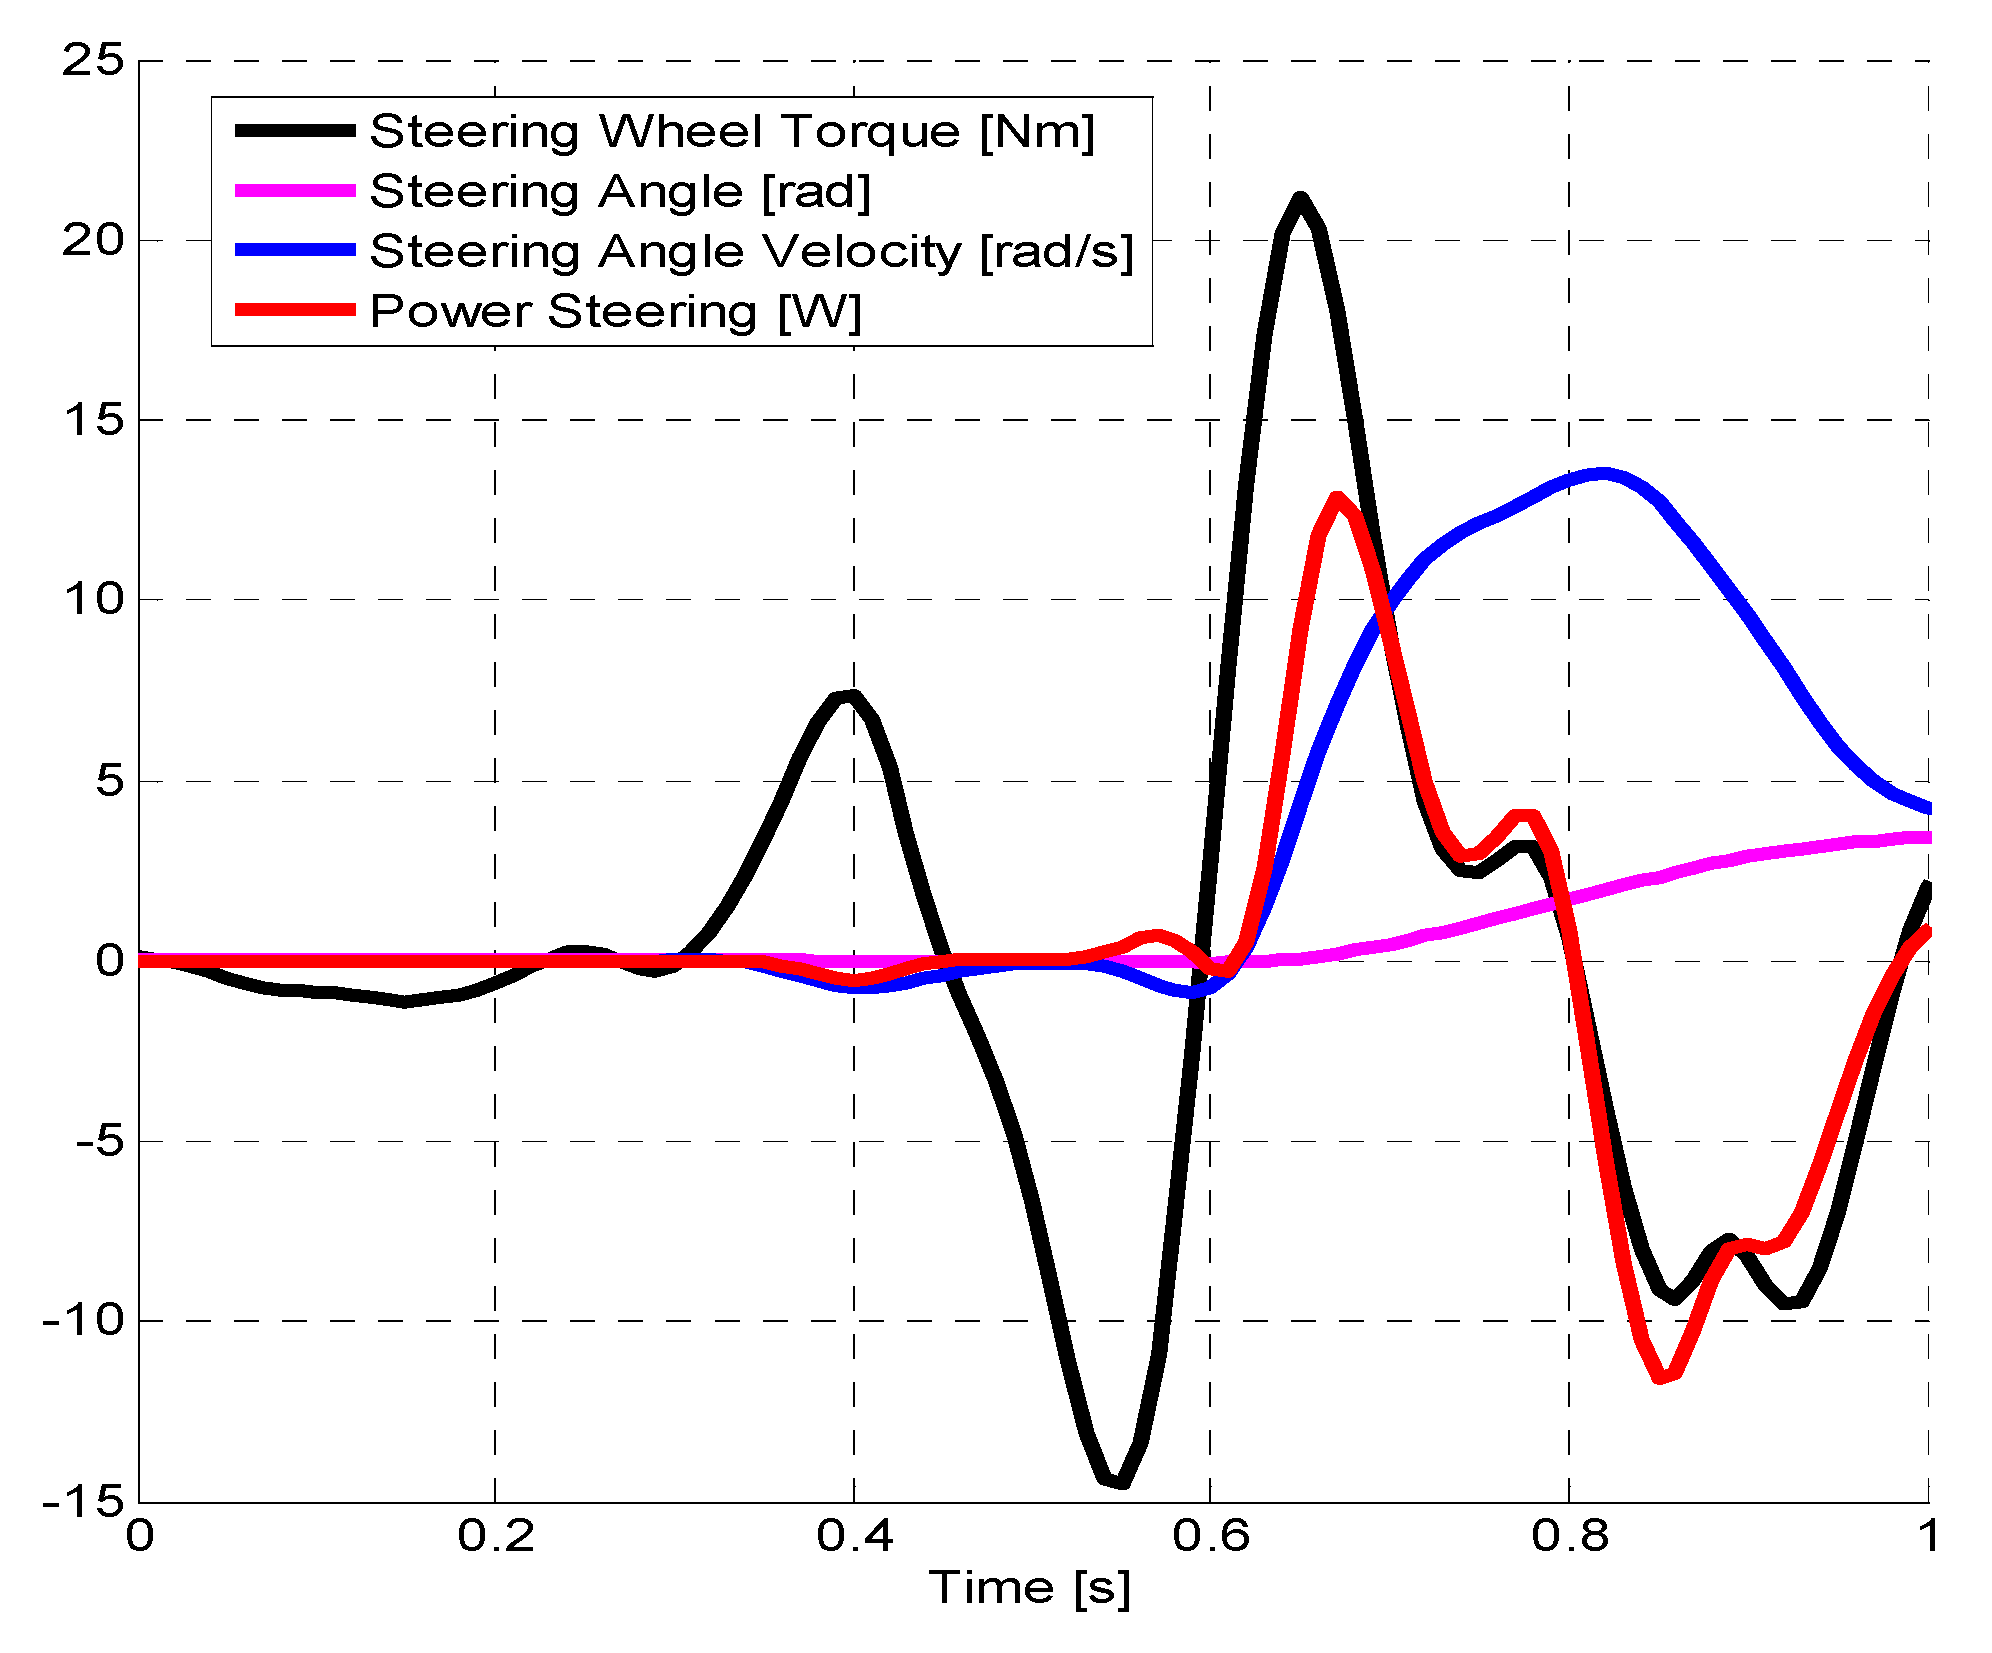
5. Steering Power Evaluation

While analysing the differences between the two types of manoeuvres (one or two hands on the steering wheel), we studied the differences in the steering power used by the drivers while counter steering. The steering power is defined as
P s w = T S W · δ ˙
where T S W is the torque applied at the steering wheel, calculated by means of the instrumented steering wheel, and δ ˙ is the speed of variation of the steering angle δ .
As the input of the kick plate is in random directions, the drivers reacted in two different possible ways. Some of them were able to immediately understand which steering wheel rotation direction was required to recover the desired trajectory. In other cases, they started the steering rotation in the wrong direction and then corrected the steering action. We named the first way as the correct approach, the second as the non-correct approach. In Figure 7, two examples of correct and incorrect actions are shown, together with the values of steering torque (multiplied by 10) and the steering wheel angle. When using the correct approach, the direction of the steering torque and the steering angle were immediately correct, while in the case of the incorrect approach, they were both in the wrong direction. As expected, when the incorrect action was applied, the required steering power, as defined in (4), was higher to correct the error. Given the large difference between the drivers and the large difference between the single manoeuvres, we decided to analyse the peak of steering power in the first instants in which the steering wheel started to rotate after the lateral excitation.
Figure 8 shows the values of the steering power peak, averaged for each driver, together with its standard deviation. In the event that the driver did not perform any manoeuvres that match the description, the average value was set to zero, as well as the standard deviation value if the driver had performed only one test. Referring to Figure 8, drivers 4 and 5 performed the one-handed manoeuvres only with the incorrect approach, while drivers 6 and 8 applied only the correct approach. At the same time, driver one performed the one-hand manoeuvres one time with the correct approach and two times with the incorrect one. In these situations, the standard deviation cannot be defined. The analysis was differentiated for the case of correct and incorrect approaches since, in this second case, the applied steering power was higher. In the correct approach (Figure 8a), the power applied in the case of driving with two hands (blue circle) was, on average, lower than the power applied in the case of driving with one hand (red diamond). In the incorrect approach (Figure 8b), the power applied with two hands was higher than the power applied with one hand. Table 3 shows the peak power values averaged on all the drivers, in the case of the correct and incorrect approach, together with the standard deviations. In the correct approach, the power applied with two hands or with one hand was similar (they differed on average less than 10%). In the incorrect approach, the power applied with two hands was higher (on average more than 20%) than the power applied with one hand.
Since the steering power is related to the steering torque T s w and to the speed of variation of the steering wheel angle δ ˙ . Table 4 shows the steering torque T s w and the angular speed of the steering wheel δ ˙ averaged for all drivers in both types of approach for manoeuvring with one or two hands on the steering wheel. In the case of the correct approach, both the torque and the steering velocity were similar if applied with one single hand, or with both hands. In the case of the incorrect approach, the torque applied with two hands was higher than the torque applied with one hand. The same was found for the steering wheel angular velocity.
Figure 9 shows the trends of the steering torque (multiplied by 10), the steering speed, and the steering power. The peak in power always follows the peak torque by a few hundredths of a second, while the angular speed of the steering wheel continues to increase, changing its slope.

6. Conclusions

An instrumented steering wheel that measured the forces applied to the steering wheel by the driver allowed us to study the human-machine interactions while driving using only one hand, or both hands.
The same phenomena occurred if only one hand was kept on the steering wheel and when both hands were used. After the occurrence of the lateral disturbance, a torque was applied unconsciously to the steering wheel in a very short time. This torque did not correspond to an actual rotation of the steering wheel, which occurred only afterwards. This torque peak was applied suddenly if both hands were used and was a slower phenomenon if only one hand was used. In both cases, the unconsciously applied torque has a modulus, on average, about 20% of the modulus of the torque applied voluntarily to recover the desired trajectory.
The time interval between the peak of the unconsciously applied torque and the beginning of the steering rotation presented relevant differences between the two considered driving situations. In the case of manoeuvres performed using two hands, the two hands acted by applying opposite torques to the steering wheel, and this fighting action slowed down the driving action. On the contrary, for the one-handed operation, since there was no opposite action of the two hands, the time interval was shortened. This time interval reduction was reflected in the total time interval necessary to modify the steering angle, which was lower in the case of the manoeuvre performed with just one hand.
The input of the kick plate had a random direction, and thus the drivers reacted in two different ways, either being able to immediately understand which steering wheel rotation direction was required to recover the desired trajectory (correct approach), or starting the steering rotation in the wrong direction and then correcting the steering action (incorrect approach). Following the correct approach, the drivers applied similar power if acting with one or two hands; however, in the case of the incorrect approach, the drivers applied lower steering power when manoeuvring with one hand.
The conclusions highlighted in this paper are based on data acquired from a relatively small number of drivers who performed manoeuvres by holding the steering wheel with only one hand or both hands. More accurate results could be obtained by increasing the number of drivers with different levels of driving experience and planning the test in such a way to avoid the bias due to learning the manoeuvre.
The results of this study highlight the importance of the inclusion of the neuro-muscular system (NMS) in driver models. The NSM considers both the voluntary activation of the muscles through alpha-neurons and the involuntary activation through gamma-neurons.

Author Contributions

All authors contributed to the design and implementation of the research, to the analysis of the results, and to the writing of the manuscript. All authors have read and agreed to the published version of the manuscript.

Funding

This research received no external funding.

Acknowledgments

SMARTMechanical Company s.r.l. is gratefully acknowledged for assembling the instrumented steering wheel prototype.

Conflicts of Interest

The authors declare no conflict of interest.

References

  1. Pick, A.J.; Cole, D.J. A mathematical model of driver steering control including neuromuscular dynamics. J. Dyn. Syst. Meas. Control. 2008, 130, 031004. [Google Scholar] [CrossRef]
  2. Wei, H.; Wu, Y.; Chen, X.; Xu, J. A Steering-Following Dynamic Model with Driver’s NMS Characteristic for Human-Vehicle Shared Control. Appl. Sci. 2020, 10, 2626. [Google Scholar] [CrossRef] [Green Version]
  3. Gobbi, M.; Comolli, F.; Hada, M.; Mastinu, G. An instrumented steering wheel for driver model development. Mechatronics. 2019, 64, 102285. [Google Scholar] [CrossRef]
  4. Saito, Y.; Itoh, M.; Inagaki, T. Driver Assistance System With a Dual Control Scheme: Effectiveness of Identifying Driver Drowsiness and Preventing Lane Departure Accidents. IEEE Trans. Human-Machine Syst. 2016, 46, 660–671. [Google Scholar] [CrossRef] [Green Version]
  5. Bonera, E.; Gadola, M.; Chindamo, D.; Morbioli, S.; Magri, P. On the Influence of Suspension Geometry on Steering Feedback. Appl. Sci. 2020, 10, 4297. [Google Scholar] [CrossRef]
  6. Cai, H.; Hu, Z.; Chen, Z.; Zhu, D. A Driving Fingerprint Map Method of Driving Characteristic Representation for Driver Identification. IEEE Access. 2018, 6, 71012–71019. [Google Scholar] [CrossRef]
  7. Wang, Z.; Zheng, R.; Kaizuka, T.; Shimono, K.; Nakano, K. The Effect of a Haptic Guidance Steering System on Fatigue-Related Driver Behavior. IEEE Trans. Human-Machine Syst. 2017, 47, 741–748. [Google Scholar] [CrossRef]
  8. Jiang, H.; Tian, H.; Hua, Y.; Tang, B. Research on Control of Intelligent Vehicle Human-Simulated Steering System Based on HSIC. Appl. Sci. 2019, 9, 905. [Google Scholar] [CrossRef] [Green Version]
  9. Okamoto, K.; Tsiotras, P. A Comparative Study of Data-Driven Human Driver Lateral Control Models. In Proceedings of the 2018 American Control Conference (ACC 2018), Milwaukee, WI, USA, 27–29 June 2018; pp. 3988–3993. [Google Scholar]
  10. Li, A.; Jiang, H.; Zhou, J.; Zhou, X. Implementation of Human-Like Driver Model Based on Recurrent Neural Networks. IEEE Access 2019, 7, 98094–98106. [Google Scholar] [CrossRef]
  11. Fang, Z.; Wang, J.; Li, P.; Xia, J. Modeling of driver’s steering behavior in large-curvature path following with back propagation neural network. In Proceedings of the 38th Chinese Control Conference (CCC2019), Guangzhou, China, 27–30 July 2019; pp. 6727–6732. [Google Scholar]
  12. Cheng, Z.J.; Jeng, L.W.; Li, K. Behavioral classification of drivers for driving efficiency related ADAS using artificial neural network. In Proceedings of the 2018 IEEE International Conference on Advanced Manufacturing (IEEE ICAM 2018), Yunlin, Taiwan, 16–18 November 2018; pp. 173–176. [Google Scholar]
  13. Del Campo, I.; Finker, R.; Martinez, M.V.; Echanobe, J.; Doctor, F. A real-time driver identification system based on artificial neural networks and cepstral analysis. In Proceedings of the 2014 International Joint Conference on Neural Networks (IJCNN 2014), Beijing, China, 6–11 July 2014; pp. 1848–1855. [Google Scholar]
  14. Martínez, M.V.; Echanobe, J.; Del Campo, I. Driver identification and impostor detection based on driving behavior signals. In Proceedings of the 19th International IEEE Conference on Intelligent Transportation Systems (IEEE ITSC 2016), Rio de Janeiro, Brazil, 1–4 November 2016; pp. 372–378. [Google Scholar]
  15. Kolekar, S.; Mugge, W.; Abbink, D.A. Modeling Intradriver Steering Variability Based on Sensorimotor Control Theories. IEEE Trans. Human-Machine Syst. 2018, 48, 291–303. [Google Scholar] [CrossRef]
  16. Zhu, B.; Liu, Z.; Zhao, J.; Chen, Y.; Deng, W. Driver Behavior Characteristics Identification Strategies Based on Bionic Intelligent Algorithms. IEEE Trans. Human-Machine Syst. 2018, 48, 572–581. [Google Scholar] [CrossRef]
  17. You, C.; Lu, J.; Tsiotras, P. Nonlinear Driver Parameter Estimation and Driver Steering Behavior Analysis for ADAS Using Field Test Data. IEEE Trans. Human-Machine Syst. 2017, 47, 686–699. [Google Scholar] [CrossRef]
  18. Gote, C.; Flad, M.; Hohmann, S. Driver characterization & driver specific trajectory planning: An inverse optimal control approach. In Proceedings of the 2014 IEEE International Conference on Systems, Man and Cybernetics (SMC2014), San Diego, California, 5–8 October 2014; pp. 3014–3021. [Google Scholar]
  19. Hua, Y.; Jiang, H.; Tian, H.; Xu, X.; Chen, L. A Comparative Study of Clustering Analysis Method for Driver’s Steering Intention Classification and Identification under Different Typical Conditions. Appl. Sci. 2017, 7, 1014. [Google Scholar] [CrossRef]
  20. Chen, S.H.; Pan, J.S.; Lu, K. Driving behavior analysis based on vehicle OBD information and adaboost algorithms. Lecture Notes in Engineering and Computer Science 2015, 1, 102–106. [Google Scholar]
  21. Pan, J.-S.; Lu, K.; Chen, S.-H.; Yan, L. Driving Behavior Analysis of Multiple Information Fusion Based on SVM. In Lecture Notes in Computer Science; Springer Science and Business Media LLC: Berlin/Heidelberg, Germany, 2014; Volume 8481, pp. 60–69. [Google Scholar]
  22. Sathyanarayana, A.; Boyraz, P.; Purohit, Z.; Lubag, R.; Hansen, J.H.L. Driver adaptive and context aware active safety systems using CAN-bus signals. In Proceedings of the 2010 IEEE Intelligent Vehicles Symposium (IV ’10), San Diego, CA, USA, 21–24 June 2010; pp. 1236–1241. [Google Scholar]
  23. Van Ly, M.; Martin, S.; Trivedi, M.M. Driver classification and driving style recognition using inertial sensors. In Proceedings of the 2013 IEEE Intelligent Vehicles Symposium (IV), QLD, Australia, 23–26 June 2013; pp. 1040–1045. [Google Scholar]
  24. Hallac, D.; Sharang, A.; Stahlmann, R.; Lamprecht, A.; Huber, M.; Roehder, M.; Sosič, R.; Leskovec, J. Driver identification using automobile sensor data from a single turn. In Proceedings of the 2016 IEEE 19th International Conference on Intelligent Transportation Systems (ITSC), Rio de Janeiro, Brazil, 1–4 November 2016; pp. 953–958. [Google Scholar]
  25. Silva, H.; Lourenço, A.; Fred, A. In-vehicle driver recognition based on hands ECG signals. In Proceedings of the 17th International Conference on Intelligent User Interfaces (IUI 2012), Lisbon, Portugal, 14–17 February 2012; pp. 25–28. [Google Scholar]
  26. Yang, C.H.; Liang, D.; Chang, C.C. A novel driver identification method using wearables. In Proceedings of the 2016 13th IEEE Annual Consumer Communications & Networking Conference (CCNC 2016), Las Vegas, NV, USA, 9–12 January 2016; pp. 1–5. [Google Scholar]
  27. Schmidt, E.; Decke, R.; Rasshofer, R. Correlation between subjective driver state measures and psychophysiological and vehicular data in simulated driving. In Proceedings of the 2016 IEEE Intelligent Vehicles Symposium (IV), Gothenburg, Sweden, 19–22 June 2016; pp. 1380–1385. [Google Scholar]
  28. Abe, M. Vehicle Handling Dynamics; Elsevier BV: Amsterdam, The Netherlands, 2015. [Google Scholar]
  29. Gabrielli, F.; Pudlo, P.; Djemai, M. Instrumented steering wheel for biomechanical measurements. Mechatronics 2012, 22, 639–650. [Google Scholar] [CrossRef]
  30. Schiro, J.; Gabrielli, F.; Pudlo, P.; Barbier, F.; Djemai, M. Normal/tangential force proportion during steering under simulation condition. Comput. Methods Biomech. Biomed. Eng. 2012, 15, 243–245. [Google Scholar] [CrossRef] [PubMed]
  31. Gobbi, M.; Comolli, F.; Ballo, F.M.; Mastinu, G. Measurement data obtained by an instrumented steering wheel for driver model development. Data Brief 2020, 30, 105485. [Google Scholar] [CrossRef] [PubMed]
  32. Comolli, F.; Ballo, F.M.; Gobbi, M.; Mastinu, G. Instrumented Steering Wheel: Accurate Experimental Characterisation of the Forces Exerted by the Driver Hands for Future Advanced Driver Assistance Systems. In Proceedings of the Volume 3: 20th International Conference on Advanced Vehicle Technologies; 15th International Conference on Design Education, Quebec City, QC, Canada, 26–29 August 2018. [Google Scholar]
  33. Mastinu, G.; Gobbi, M.; Comolli, F.; Hada, M. Instrumented Steering Wheel for Accurate ADAS Development. In Proceedings of the SAE Technical Papers; SAE International, SAE WCX, Detroit, MI, USA, 9–11 April 2019; Vol. 2019-April. [Google Scholar]
  34. Carrera Akutain, X.; Ono, K.; Comolli, F.; Gobbi, M.; Mastinu, G. Further understanding of steering feedback and driver behavior through the application of an instrumented steering wheel. In Proceedings of the 10th International Munich Chassis Symposium, Munich, Germany, 25–26 June 2019; pp. 481–502. [Google Scholar]
Figure 1. (a) Instrumented steering wheel; (b) six-component load cell.
Applsci 10 07055 g001
Figure 2. Electronic board of the instrumented steering wheel. G is the signal amplifier, A/D is the converter, and DSP is the digital signal processor.
Applsci 10 07055 g002
Figure 3. (a) Load cell reference frames. δ is the steering angle, α is the inclination angle of the steering wheel, and g is the gravity acceleration. (b) Mono-axial load cells in the handle to measure the grip force.
Applsci 10 07055 g003
Figure 4. The kick plate test.
Applsci 10 07055 g004
Figure 5. Moments on the steering wheel. The kick plate manoeuvre. The driver used two hands.
Applsci 10 07055 g005
Figure 6. Moments on the steering wheel. The kick plate manoeuvre. The driver used one hand.
Applsci 10 07055 g006
Figure 7. Different approaches in counter steering: (a) correct approach; (b) incorrect approach. The steering toque is shown multiplied by a factor 10.
Applsci 10 07055 g007
Figure 8. The power required to steer for the two different approaches: (a) the correct approach; and (b) the incorrect approach.
Applsci 10 07055 g008
Figure 9. Power torque, steering angle velocity, and power steering.
Applsci 10 07055 g009
Table 1. Drivers with two hands on the steering wheel. Average ± Standard Deviation Values (Avg ± St. Dev.).
Δt1 (s)Δt2 (s)Δt3 (s)
Avg ± St. Dev.Avg ± St. Dev.Avg ± St. Dev.
Driver 10.138 ± 0.0330.273 ± 0.0820.412 ± 0.082
Driver 20.114 ± 0.0300.160 ± 0.1020.274 ± 0.102
Driver 30.128 ± 0.0250.257 ± 0.0990.385 ± 0.099
Driver 40.158 ± 0.0150.360 ± 0.0580.518 ± 0.058
Driver 50.120 ± 0.0320.280 ± 0.1810.400 ± 0.181
Driver 60.148 ± 0.0240.268 ± 0.0960.417 ± 0.096
Driver 70.145 ± 0.0310.368 ± 0.0820.513 ± 0.082
Driver 80.120 ± 0.1410.250 ± 0.1410.370 ± 0.141
Average0.137 ± 0.0300.282 ± 0.1140.416 ± 0.128
Δt1: delay between the lateral disturbance and the peak of torque unconsciously applied, Δt2: delay between the peak of torque and the effective rotation of the steering wheel, and Δt3: delay between the lateral disturbance and the effective rotation of the steering wheel.
Table 2. Drivers with one hand on the steering wheel.
Δt1 (s)Δt2 (s)Δt3 (s)
Avg ± St. Dev.Avg ± St. Dev.Avg ± St. Dev.
Driver 10.150 ± 0.0350.270 ± 0.0260.420 ± 0.026
Driver 20.160 ± 0.0420.090 ± 0.0570.250 ± 0.057
Driver 30.187 ± 0.0900.160 ± 0.0690.347 ± 0.069
Driver 40.177 ± 0.0150.193 ± 0.1460.433 ± 0.146
Driver 50.137 ± 0.0550.093 ± 0.0450.260 ± 0.045
Driver 60.133 ± 0.0710.213 ± 0.0550.347 ± 0.055
Driver 70.173 ± 0.0890.210 ± 0.0600.383 ± 0.060
Driver 80.073 ± 0.0350.300 ± 0.0350.373 ± 0.035
Average0.148 ± 0.0510.208 ± 0.0820.356 ± 0.080
Δt1: delay between the lateral disturbance and the peak of torque unconsciously applied, Δt2: delay between the peak of torque and the effective rotation of the steering wheel, and Δt3: delay between the lateral disturbance and the effective rotation of the steering wheel.
Table 3. The power required to steer in the two manoeuvres.
P s w   ( W )
Avg ± St. Dev.
Correct approachTwo hands41.48 ± 21.76
One hand38.12 ± 17.19
Incorrect approachTwo hands65.48 ± 28.67
One hand50.01 ± 34.98
Table 4. The steering torque and steering angle velocity in the two manoeuvres.
T s w   ( Nm ) Δ T s w   ( Nm ) δ ˙   ( rad / s ) Δ δ ˙   ( rad / s )
Avg ± St. Dev.(two hands – one hand)Avg ± St. Dev.(two hands – one hand)
Correct approachTwo hands4.41 ± 1.12+13%8.96 ± 3.22−7%
One hand3.83 ± 0.679.62 ± 3.24
Incorrect approachTwo hands5.91 ± 0.94+19%10.80 ± 3.98+12%
One hand4.81 ± 1.979.53 ± 3.65

