Article

Effect of Gait Speed on Recovery Motion from Tripping on a Treadmill

1
Department of Mechanical Systems Engineering, Nagoya University, Nagoya 464-8603, Japan
2
Department of Computer Sciences, Tokyo Metropolitan University, Tokyo 191-0065, Japan
*
Author to whom correspondence should be addressed.
Appl. Sci. 2021, 11(17), 7908; https://doi.org/10.3390/app11177908
Submission received: 28 July 2021 / Revised: 18 August 2021 / Accepted: 25 August 2021 / Published: 27 August 2021
(This article belongs to the Section Applied Biosciences and Bioengineering)

Abstract

:
The analysis of the mechanism of fall avoidance motion is required to prevent fall-related injuries. To investigate the factors that affect fall avoidance motion, tripping was induced among 10 healthy male subjects during treadmill walking at gait speeds of 3.5 and 4.0 km/h. The posture of the subjects and ground reaction force of the recovery steps were recorded using a motion capture system and force plate to analyze the effect of gait speed on recovery motion. The gait parameters of the recovery steps were calculated and compared between gait speeds. Principal component analysis was performed to identify the parameters that represent the recovery motion and the magnitude of the first and second recovery steps, and the balance of recovery steps were extracted as defining characteristics. Of the 18 gait parameters, such as step time, five differed depending on gait speeds. However, the other gait parameters and all four principal components did not differ significantly with respect to gait speeds. Furthermore, the distribution of principal components and gait parameters across subjects and gait speeds suggested that the variability between trials was greater than the effect of gait speed and individual characteristics on recovery motion.

1. Introduction

Falls in the daily living environment and workplace are particularly hazardous for the elderly and laborers [1]. The analysis of the mechanism of fall avoidance motion will contribute to preventing fall-related injuries. Tripping when walking is a common cause of falls [2], and the recovery motions performed by an individual after tripping have been investigated for many years. Eng et al. identified the “elevating” and “lowering” strategies of recovering from tripping [3]. The elevating strategy is regarded as the motion where humans overcome an obstacle by lifting the tripped leg. In contrast, the lowering strategy is the motion where humans place the tripped leg behind the obstacle and move the opposite leg forward. Furthermore, a “delayed lowering” strategy is a mixture of the recovery strategies described above [4]. The selection of these strategies is largely determined by the gait phase in progress when tripping occurs [4,5].
The factor that affects the performance of recovery and verification motion was investigated. Owings et al. analyzed the difference between successful and failed recovery steps [6,7]. In the first literature, the perturbations were applied among older adults by suddenly accelerating the treadmill. In the second one, an obstacle was placed on the walk lane. According to the experiment involving tripping young adults and the elderly, a short step time and a long step length may lead to successful recovery. Akiyama et al. investigated the effect of step length on fall speed by restricting the recovery step using a rope following contact with the obstacle on the walk lane. They found that the descending speed of the body increases when the recovery step length decreases [8]. In addition, Pijnappels et al. performed the tripping experiment by placing an obstacle on the walk lane and reported the importance of the supporting leg [9]; they found that a relatively strong supporting leg push-off increases the length of the recovery step. Wan et al. estimated the tripping risk from a gait experiment performed on a walk lane and concluded that fast walking with a large step length and small cadence decreased the tripping risk [10]. Furthermore, it has been reported that the length of the first and second recovery steps varies among trials and individuals, according to overground tripping experiments using an exoskeleton [11]. Therefore, previous studies have identified several key factors for successful recovery from tripping.
In gait experiments, the subject generally walks at a self-selected [4,7,9,11] or controlled speed [8,12]. Previous research suggests that the self-selected speed does not significantly affect the recovery response based on the probability of the subject recovering from tripping at various self-selected speeds [13]. However, some studies suggest an increased fall risk at a higher comfortable speed [14,15]. Klemetti et al. examined the increase in the effect of tripping at a faster gait speed through gait simulation [16]. Based on kinematics, gait stability can be analyzed using angular momentum [17]. Fall recovery is the process of reducing the forward angular momentum converted from the walking speed by tripping [9]. Therefore, considering the fall as the kinematic phenomenon, the magnitude of walking speed should be examined.
Based on dynamic analysis, the imbalance caused by tripping is expected to increase as gait speed increases owing to the concurrent increase in kinetic energy. Treadmill experiments offer the ability to control gait speed and monitor recovery motion. Although the conditions of treadmill walking are kinematically equal to those of overground walking [18], the gait motions observed on the treadmill and overground exhibit certain differences. Stolze et al. reported that cadence increased by 6% and stride length decreased by 4% during treadmill walking under the same gait speed [19]. Riley et al. evaluated the difference between the joint angles. In the sagittal plane, the peak angles of lower limb joints were below 2° [20]. Despite the aforementioned differences, treadmill experiments can be a valuable tool for comparing recovery motions to determine the effect of gait speed on tripping recovery, because of their capacity to control the gait speed of the subject. However, many studies use simulated tripping instead of the actual tripping caused by an obstacle, which occurs overground, when performing treadmill experiments. To simulate tripping on a treadmill, certain studies have used ropes to restrict the leg swing [4,12], while some have simulated tripping by suddenly accelerating and decelerating the belt [6,21,22]. Furthermore, recently, the treadmill motion has been combined with a 3D video that simulates the visual stimuli of gait motion [23]. In any case, actual tripping on the treadmill is rarely considered.
In this study, we examined the effect of gait speed on recovery motion using a treadmill that could trip the subject using a moving bar. The differences in recovery step characteristics in response to changes in gait speed were also analyzed. Recovery motion parameters, such as joint angle, and ground reaction force (GRF) were used as the metrics for statistical comparison.

2. Methods

The experiment was conducted with the permission of the Institutional Review Board of Nagoya University (approval number 19–11) and with the informed consent of the subjects.

2.1. Subjects

The people with gait disorders or pain during walking were excluded from participating. Finally, 10 healthy male adults, who did not participate in previous treadmill experiments, were recruited from among the university students. The mean ± standard deviation of the age, height, and weight of the subjects were 22.7 ± 2.2 years, 171.5 ± 1.6 cm, and 63.7 ± 5.1 kg, respectively.

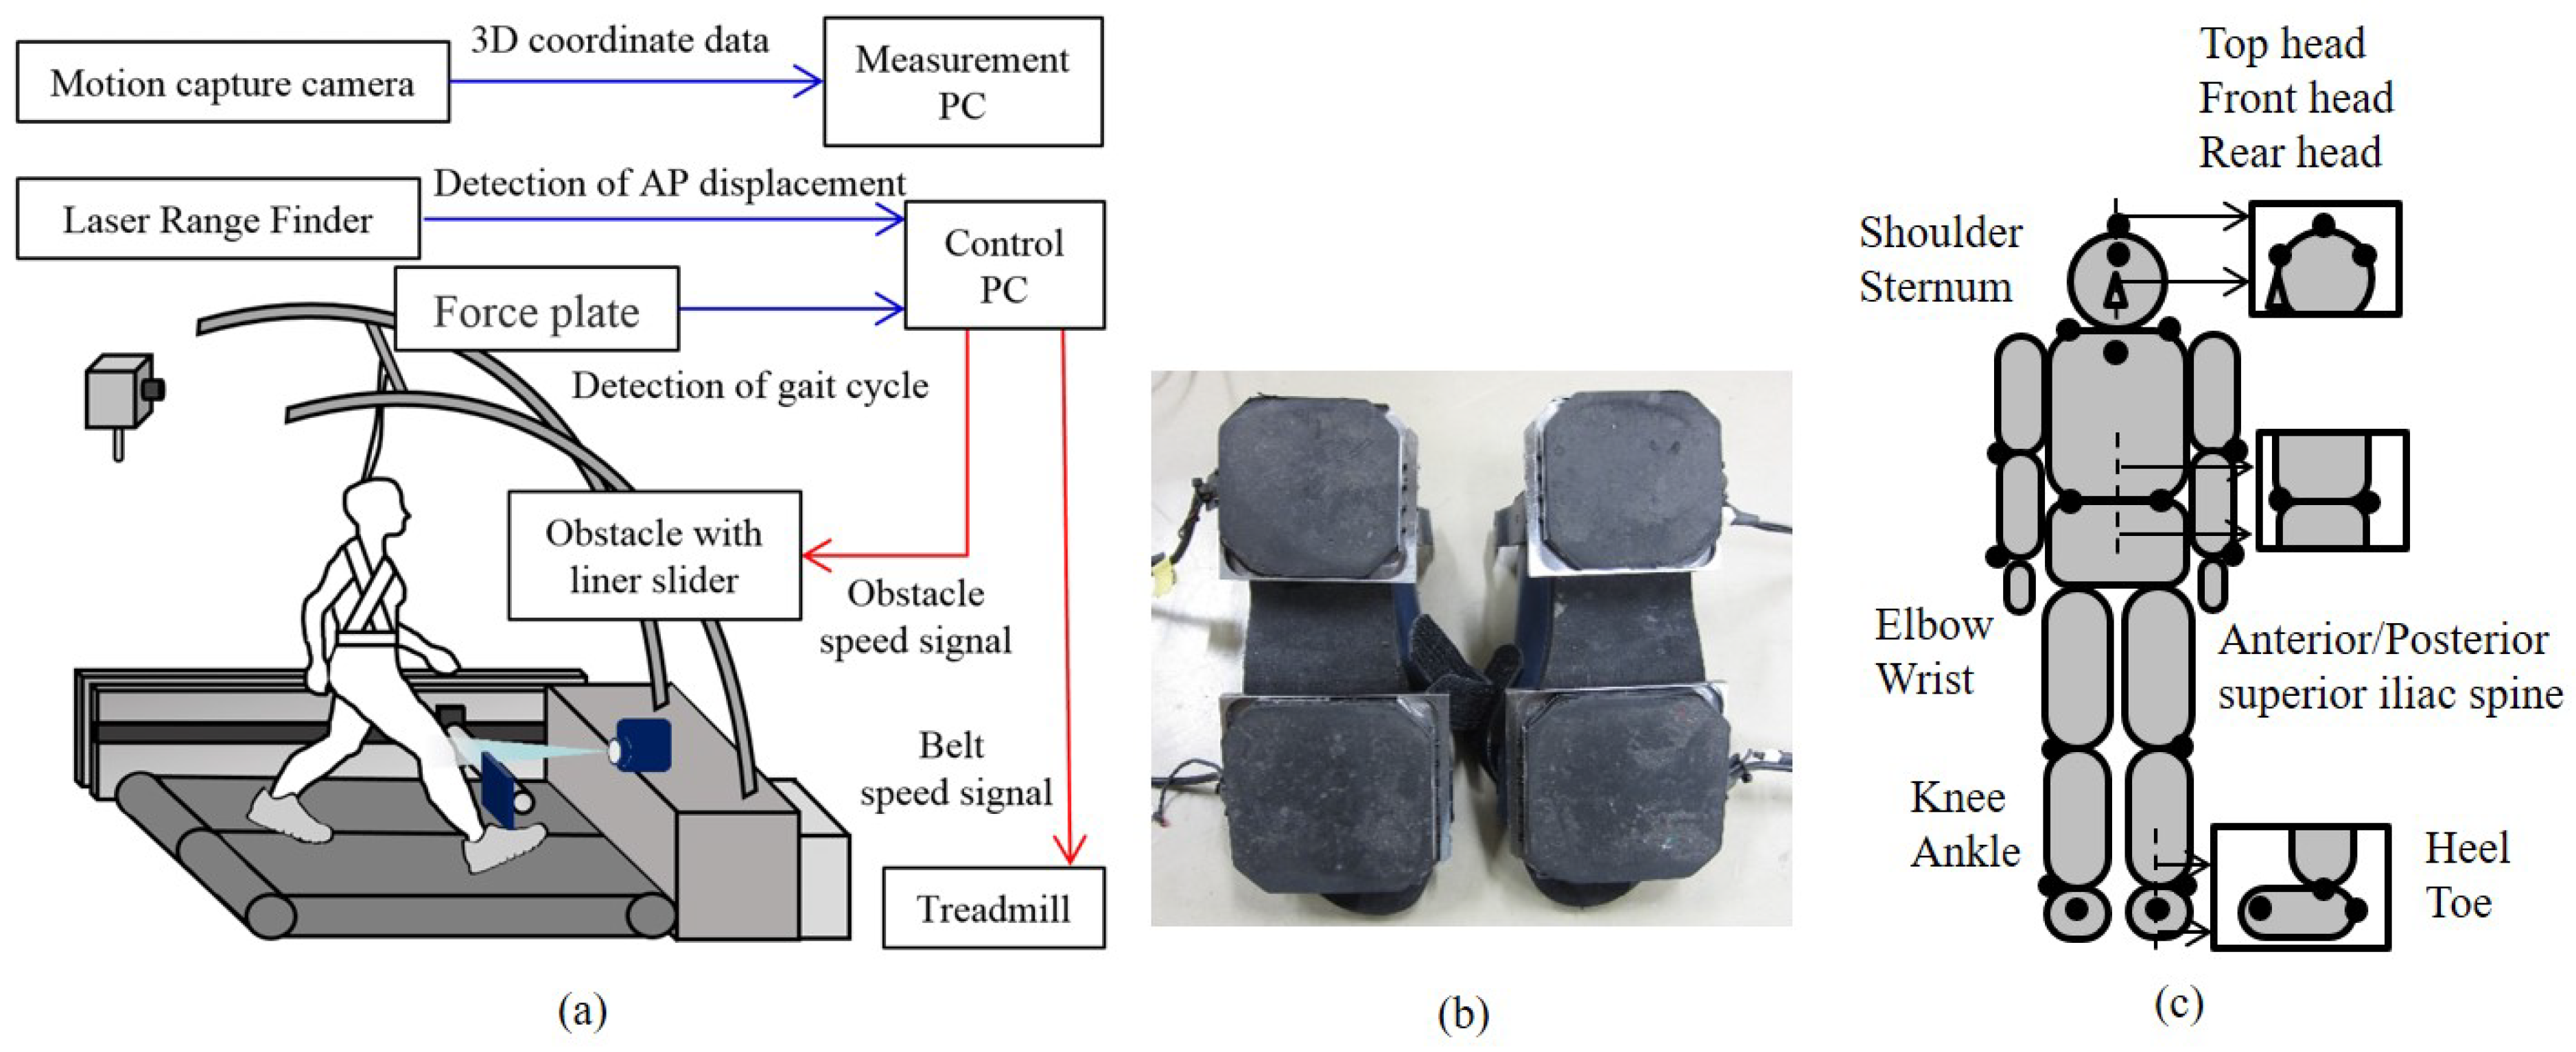
2.2. Experimental Setup

The subjects were tripped on a double-belt treadmill (OHTAKE ROOT KOGYO CO., LTD, Iwate, Japan) using a perturbation mechanism (e-Valley, Aichi, Japan).
The perturbation mechanism consisted of two aluminum tripping bars and actuated linear sliders that moved the tripping bar in a forward/backward motion. The tripping bars were fixed sideways to the linear sliders located on both the left and right sides of the mechanism and moved at the same speed as the treadmill belts. Metal plates were fixed to the tripping bars such that they were 15 cm above the belt surface and in contact with the subjects’ feet. The height of the obstacle was within the range of obstacles typically used in tripping experiments [24,25].
The configuration of the tripping and observation system is shown in Figure 1a. The gait phase and position of the subject were estimated using a laser range finder (UST- 20LX, HOKUYO AUTOMATIC CO., LTD., Osaka, Japan) located in front of the belts and four six-degrees of freedom mobile force plates (M3D-FP-U, Tec Gihan Co., Ltd., Kyoto, Japan) fixed under the subject’s heels and toes as shown in Figure 1b. The four force plates weighed approximately 150 g each. These laser range finder and force plates were used to measure the position of both legs and the timing of heel contact (HC). The gait phase was estimated by averaging the gait period of the five most recent gait cycles. The position of the subject was approximated using the center of both legs. The tripping bar was set to move at a specific time as calculated by the estimated gait phase, position of the subject, and speed of the belts to trip the subject during the intended gait phase.
To keep the subject at the center on the treadmill belt, a marker was placed in the center position in front of the treadmill. To prevent the subject from anticipating being tripped, the subject wore half-covered goggles and headphones with noise. These devices masked the view and sound of the approaching tripping bar. For the safety of the subject, a safety harness connected to the frame above the treadmill was used. The height of the harness was adjusted to protect the subject’s head, body, and arms from collision. Moreover, plastic protectors were fitted on the lower legs and feet of the subjects.
The motion of the subject was recorded using a seven-camera motion capture system (OptiTrack, Nobby Tech. Ltd., Tokyo, Japan) and 22 markers attached to the subject as shown in Figure 1c, based on a set of critical markers [26]. The cameras surrounded the treadmill. The GRF was recorded using the mobile force plate described above. The local coordinates of the force plates were determined in relation to the position of the toe, heel, and ankle markers using a calibration board. The coordinates were then converted to global coordinates in a time series.

2.3. Protocol

The experimental procedure was explained to each subject, who then provided written consent. The subjects wore well-fitting sportswear with reflective markers and shoes in which the force plates were installed. During the experiment, the subject looked at the marker placed in front of the treadmill to ensure they maintained the central position of the treadmill. The experiment was conducted at two speeds: 3.5 and 4.0 km/h, which were determined through preliminary experiments. In the preliminary experiment, the subjects were startled by tripping at high speed such as 5.0 km/h. For ethical reasons, we could not perform an experiment under such a condition. Therefore, we selected 4.0 km/h as the fast speed to ensure that subjects were not frightened by tripping.
The subjects performed two practice trials prior to recording. First, the subject walked on the treadmill for 5 min each at 3.5 and 4.0 km/h. Then, an additional 5-min practice trial was conducted with the subject wearing the half-covered goggles and headphones. Subsequently, several tripping trials were performed for practice and to test safety devices. The recorded trials began with walking at each speed without tripping to determine the subject’s normal gait parameters. Following this, the subjects’ recovery motions after tripping were recorded at 3.5 km/h and 4.0 km/h. The subject was tripped once at a random time while walking in the single tripping trial. Subjects were permitted to rest occasionally. Tripping was timed to occur in the early to middle swing phase to consistently assess the recovery strategy between trials. Tripping during this phase of gait was expected to result in the use of the elevating strategy [5]. We controlled the trip timing to focus on the effect of gait speed on tripping recovery. When tripped, the subject moved the tripped leg forward. The first and second steps after tripping were recorded and analyzed. Images of the tripping and recovery motions were reproduced and are shown in Figure 2. The subject was instructed to continue walking after being tripped. Therefore, the subject returned to their normal gait several steps after being tripped. The treadmill stopped after the recovery and a single trial was completed. Importantly, the treadmill speed and tripped leg were randomized between trials to prevent anticipation and learning. In total, 22 tripping trials were conducted for each subject.

2.4. Data Processing

Both the motion and GRF data were recorded at 120 Hz, and the motion data were smoothed using a 6 Hz Butterworth filter [23,27]. Trials in which tripping occurred during the wrong gait phase, the reaction motion was off target, or the recorded parameters included errors were not used in the analysis. The joint angle and posture of the subject were calculated by fitting a human model to the position of the markers using the least-squares method. The biomechanical analysis software, SIMM (MulsculoGraphics Inc., Evanston, IL, USA), was used for this process [26]. The timing of the HC and toe off (TO) of each foot was determined based on the GRF. The threshold force for a gait event was set to 80 N of vertical force. This threshold value was tuned to neglect the detection of foot contact during the swing phase. The effects of contact side differences were disregarded. Therefore, the recorded data of trials where the right leg was tripped was mirrored to the motion of the left leg trip.
An elevating strategy was expected based on the gait phase during which tripping occurred [3,5]. According to this expected recovery motion, three gait events and two motion phases were defined. The hit time (HT) was defined as the time when tripping occurred. Then, the first step (FS) was defined as the time when the subject stepped over the tripping bar with the tripped leg. The subsequent step performed by the recovery leg was defined as the second step (SS). The intervals between HT and FS, and between FS and SS, were determined to be the first and second recovery phases, respectively.
The stride time and step length of non-tripped strides were calculated and compared to the normal gait parameters. The parameters used to evaluate the recovery motion are shown in Table 1 and Figure 3. The outliers, which were higher or lower than the range of 1.5 times the range between the first and third interquartile range, were omitted from the analysis. Then, the mean and standard deviation of each parameter were calculated. We considered the p-value of 0.05 to be the threshold of statistical significance. To compensate for individual differences, certain parameters were normalized by the height, weight, and walking speed of each subject and trial. The margin of stability (MoS) is an index for evaluating the kinematic stability of motion which is based on the inverted pendulum model [28]. The extrapolated center of mass (XCoM) was determined by extending the center of mass (CoM) position, considering the CoM velocity. The safety margin from the fall was quantified as the distance between XCoM and the edge of the support foot, which was determined as the position of the toe marker [29].
The correlation coefficients of the reaction motion parameters were calculated to evaluate the relationship between parameters. All parameters were z -scored, following which principal component analysis (PCA) [30] was performed to determine the factors that represent the reaction motion. The differences in reaction motion parameters and PCA scores between conditions were assessed using a statistical test. After the Kolmogorov–Smirnov test, multivariate analysis of variance was performed for gait parameters. Then, a t -test [31] was used to compare each pair of gait parameters. The principal components were compared using t -tests with Bonferroni’s method.

3. Results

3.1. Overview of Recorded Trials

In total, 220 trials were recorded, with 11 trials for each speed being recorded for each subject’s leg. Of the 220 total trials, 20 trials, where the subject exhibited a lowering recovery strategy, were excluded from analysis along with 16 trials where the trip occurred in the wrong gait phase and 20 trials where irregular events such as multiple trips occurred. Furthermore, 15 trials were disregarded owing to the obstruction of a marker. Consequently, 20 trials were disregarded as they were outliers. Therefore, 129 trials where the subject exhibited an elevating recovery strategy were analyzed. An example of the recovery motion observed in this experiment is shown in Figure 4.
Tripping in the analyzed trials occurred between 65% and 80% of the gait cycle. The average stride time of subjects walking normally, which was recorded prior to the tripping trials, ranged from 1.11 to 1.42 s at 3.5 km/h and from 1.06 to 1.28 s at 4.0 km/h. The average step length ranged from 0.47 to 0.59 m at 3.5 km/h and from 0.53 to 0.63 m at 4.0 km/h.

3.2. Effect of Gait Speed on Reaction Parameters

The mean value, standard deviation, p-value, and Hedge’s g of each parameter are presented in Table 2. Certain parameters vary significantly at different gait speeds. In addition, the correlation matrix of the reaction parameters is presented in Table 3. This information was used to perform PCA to determine the parameters that effectively represent reaction patterns. In the correlation matrix and PCA, the results of the trials at both speeds are included. The factor loadings of the four major components are calculated as shown in Figure 5. The total contribution ratio of these components was 63.8%, which consisted of the 4 components contributing 25.1%, 17.6%, 11.4%, and 9.6%. The results of the t-test showed that all four principal components did not differ significantly at different gait speeds.

4. Discussion

4.1. Overview of Reaction Motion

In this experiment, tripping can be said to have occurred during the early to middle swing phase [32]. Compared to the gait parameters of normal overground walking, the stride time and step length were slightly shorter [33]; however, this trend is consistent with reported characteristics of treadmill walking [19].
The first and second principal components were characterized by relatively large and strong steps. According to the factor loadings, the first principal component is related to FS, whereas the second principal component is related to SS. Along with the increase in first and second principal components, Stlength increased for FS and SS. In addition, the first principal component was positively related to the Sttime of FS. These relationships correspond to a relative increase for each step of the recovery phase. Furthermore, Kang and Hang also increase for both recovery steps, which means that the maximum knee and hip flexion of both steps increase. This trend corresponds to a larger stepping motion.
The positive CoMVt and GRFt, which are the components of the CoM velocity and GRF in the direction of travel, weighting of the first and second principal components suggested that the body moved forward rapidly and that the subject decelerated that motion using the foot that made a step. The first principal component is also strongly related to the CoMVv of both the FS and SS, which means that the downward speed of the subject increased whereas the second principal component only related to the CoMVv of SS. The increase in downward speed suggests that the body largely moves in the vertical direction during the recovery steps. Furthermore, the second principal component is negatively related to the MoSt of both FS and SS. Understandably, the increase in CoMVt is related to the decrease in MoSt on SS, according to the formula for calculating MoS [28].
The third principal component is negatively related to the Kang and Hang. Therefore, the increase in this principal component increases the compactness of the recovery step. The fourth principal component is characterized by a large positive MoSt, which reflects the margin by which a fall is avoided. The safety margin was considered to be unrelated to the other gait parameter in this principal component. Therefore, based on PCA, the principal components that represent the magnitude of FS and SS were identified.

4.2. Reaction Motion Strategies

Recovery from perturbation continues for several steps after tripping before motion gradually returns to a normal gait [12]. In this experiment, we examined the characteristics of the first and second recovery steps after perturbation. According to the PCA results in this study, the relationship between the first and second recovery steps is weak whereas it was extracted in the overground experiment [11] as discussed in the subsection below.
According to the principal components identified in this study, the MoS was related to the CoMVt in the second principal component. The difference in the MoS of the recovery step at varying treadmill speeds was not significant in this study as shown in Table 2. Conversely, a previous study suggested that the MoS is affected by gait speed during normal walking [34]. Furthermore, the MoS was not correlated with the step length, which is a parameter used to calculate the MoS. This suggests that the relationship between MoS and gait parameters differs with respect to recovery motion and normal gait.

4.3. Effect of Gait Speed on Reaction Motion

Although certain parameters differed significantly with respect to gait speed, the differences were slight as shown in Table 2. Furthermore, the differences among the principal component scores at different gait speeds were not significant. Therefore, there was no significant change in the reaction motion performed in response to tripping between gait speeds of 3.5 km/h and 4.0 km/h.
The effect of gait speed on the recovery motion was possibly smaller than the variability in recovery motion observed in this experiment. The distribution of the first and second principal component scores are plotted in Figure 6. The color and shape of the data points correspond to gait speed and subject, respectively. From this distribution, classifying the effect of individual characteristics as well as gait speed is difficult. This means that the variability between trials was greater than the variation caused by individual characteristics or gait speed. Therefore, the effect of gait speed on recovery motion may be masked by the variability in recovery motions between trials.

4.4. Differences between Reaction Motion on a Treadmill and Overground Walking

Previous studies revealed the difference between the normal gait motion while walking on a treadmill and walking overground [19,20]. In addition, one of the main differences between normal gait and recovery motion is the rapid acceleration of body speed in the anteroposterior direction. A recovery step decelerates the speed of the body while the recovery leg stops the forward trajectory of the body. Therefore, the subject rapidly moves backward on the treadmill. However, our treadmill is capable of accommodating the subject’s backward motion, so the subject can keep walking. For extensive recovery motion or fall experiments, the length of the treadmill may limit the experiment. Nonetheless, the subject can perform the recovery motion on the treadmill comparably to walking overground. Therefore, the moving treadmill belt possibly facilitated the forward movement of the subject after tripping.

4.5. Limitations

In this study, 3.5 and 4.0 km/h were selected as the slow and fast speeds, respectively. Although these speeds were selected by considering the safety and comfort of the subject through a preliminary experiment, this range is narrow compared to the range of gait speeds applied in daily living. A person’s comfortable walking speed decreases when walking on a treadmill compared to overground walking [35]. This may be because the subject feels the gait speed faster when walking on the treadmill. Furthermore, the fear of tripping may be amplified on a treadmill. Therefore, an improved experimental system is required to minimize the subjects’ fear of falling on the treadmill at increased gait speeds.
The capacity to observe the recovery motion by an actual trip on the treadmill was suggested in this study. However, the difference in the gait and recovery motions on the treadmill and overground walk lane persist.
The weight of the force plate may have affected the reaction motion of the subjects. However, based on the comparison of the gait parameters and joint angles in our previous study, the mass of the force plate likely did not significantly affect the natural gait of the subject [36].
The attribution of subjects was limited to young healthy males in this study. Hence, the effects of age, gender, and gait disorder were excluded. The effect of gait speed and tripping on the treadmill may be different for such attributions.
Because of the experimental characteristic of applying repeated perturbations, the reaction motion of the subject may differ from the one in the daily living environment. In this experiment, we randomized the side of the tripping and the time duration before tripping to prevent the learning effect caused by anticipation. However, the experiment was not devoid of nervousness of the subjects.

5. Conclusions

This study investigated the effect of gait speed on recovery and fall avoidance motion parameters using a treadmill-based tripping experiment. The tripping bar caused the actual tripping, implying that the swing foot hit the obstacle on the treadmill. PCA was used to identify the factors that represent the characteristics of fall recovery motion.
The result suggested that the five out of eighteen gait parameters differed significantly at the tested gait speeds. However, the magnitude of difference was minimal. Additionally, the distribution of principal component scores suggests that the recovery motion of each subject varies widely at both tested gait speeds. As such, the variation of the recovery motion was larger than the effect size of gait speed or individuality in this experiment. The principal components revealed an effect of gait speed on the recovery motion and the relationship between parameters that represent the recovery motion. The difference between the characteristics of recovery motion on treadmill and overground experiments partly suggested the need to simulate physical and psychological situations of overground walking on the treadmill.

Author Contributions

Conceptualization, Y.A.; methodology, Y.A. and H.M.; software, Y.A. and H.M.; validation, Y.A., H.M. and S.O.; formal analysis, H.M.; investigation, Y.A., H.M., S.O. and Y.Y.; resources, Y.A. and Y.Y.; data curation, H.M.; writing—original draft preparation, Y.A. and H.M.; writing—review and editing, S.O. and Y.Y.; visualization, H.M.; supervision, Y.Y.; project administration, Y.Y.; funding acquisition, Y.A. and Y.Y. All authors have read and agreed to the published version of the manuscript.

Funding

This research was funded by Japan Society for the Promotion of Science (JSPS) KAKENHI Grant Number 17K01293.

Institutional Review Board Statement

The study was conducted according to the guidelines of the Declaration of Helsinki, and approved by the Institutional Review Board of Nagoya University (approval number 19–11, 9 August 2019).

Informed Consent Statement

Informed consent was obtained from all subjects involved in the study. Written informed consent has been obtained from the patient(s) to publish this paper.

Data Availability Statement

The data presented in this study are available within the article.

Conflicts of Interest

The authors declare no conflict of interest. The funders had no role in the design of the study; in the collection, analyses, or interpretation of data; in the writing of the manuscript; or in the decision to publish the results.

References

  1. Tate, D.G. Workers’ disability and return to work. Am. J. Phys. Med. Rehabil. 1992, 71, 92–96. [Google Scholar] [CrossRef] [PubMed]
  2. Lipscomb, H.J.; Glazner, J.E.; Bondy, J.; Guarini, K.; Lezotte, D. Injuries from slips and trips in construction. Appl. Ergon. 2006, 37, 267–274. [Google Scholar] [CrossRef] [PubMed]
  3. Eng, J.J.; Winter, D.A.; Patla, A.E. Strategies for Recovery from a Trip in Early and Late Swing during Human Walking. Exp. Brain Res. 1994, 102, 339–349. [Google Scholar] [CrossRef] [PubMed]
  4. Shirota, C.; Simon, A.M.; Kuiken, T.A. Trip recovery strategies following perturbations of variable duration. J. Biomech. 2014, 47, 2679–2684. [Google Scholar] [CrossRef] [PubMed] [Green Version]
  5. Roos, P.E.; McGuigan, M.P.; Trewartha, G. The role of strategy selection, limb force capacity and limb positioning in successful trip recovery. Clin. Biomech. 2010, 25, 873–878. [Google Scholar] [CrossRef] [Green Version]
  6. Owings, T.M.; Pavol, M.J.; Grabiner, M.D. Mechanisms of failed recovery following postural perturbations on a motorized treadmill mimic those associated with an actual forward trip. Clin. Biomech. 2001, 16, 813–819. [Google Scholar] [CrossRef]
  7. Pavol, M.J.; Owings, T.M.; Foley, K.T.; Grabiner, M.D. Mechanisms leading to a fall from an induced trip in healthy older adults. J. Gerontol. Ser. A Biol. Sci. Med. Sci. 2001, 56, M428–M437. [Google Scholar] [CrossRef] [Green Version]
  8. Akiyama, Y.; Mitsuoka, K.; Okamoto, S.; Yamada, Y. Experimental analysis of the fall mitigation motion caused by tripping based on the motion observation until shortly before ground contact. J. Biomech. Sci. Eng. 2019, 14, 18-00510. [Google Scholar] [CrossRef]
  9. Pijnappels, M.; Bobbert, M.F.; van Dieën, J.H. Push-off reactions in recovery after tripping discriminate young subjects, older non-fallers and older fallers. Gait Posture 2005, 21, 388–394. [Google Scholar] [CrossRef]
  10. Wang, W.F.; Lien, W.C.; Liu, C.Y.; Yang, C.Y. Study on tripping risks in fast walking through cadence-controlled gait analysis. J. Healthc. Eng. 2018, 2018, 2723178. [Google Scholar] [CrossRef]
  11. Akiyama, Y.; Fukui, Y.; Okamoto, S.; Yamada, Y. Effects of exoskeletal gait assistance on the recovery motion following tripping. PLoS ONE 2020, 15, e0229150. [Google Scholar] [CrossRef] [PubMed]
  12. Cordero, A.F.; Koopman, H.F.; Van der Helm, F. Multiple-step strategies to recover from stumbling perturbations. Gait Posture 2003, 18, 47–59. [Google Scholar] [CrossRef]
  13. Senden, R.; Savelberg, H.; Adam, J.; Grimm, B.; Heyligers, I.; Meijer, K. The influence of age, muscle strength and speed of information processing on recovery responses to external perturbations in gait. Gait Posture 2014, 39, 513–517. [Google Scholar] [CrossRef] [PubMed]
  14. Pavol, M.J.; Owings, T.M.; Foley, K.T.; Grabiner, M.D. Gait characteristics as risk factors for falling from trips induced in older adults. J. Gerontol. Ser. A Biomed. Sci. Med. Sci. 1999, 54, M583–M590. [Google Scholar] [CrossRef] [PubMed] [Green Version]
  15. Smeesters, C.; Hayes, W.C.; McMahon, T.A. The threshold trip duration for which recovery is no longer possible is associated with strength and reaction time. J. Biomech. 2001, 34, 589–595. [Google Scholar] [CrossRef]
  16. Klemetti, R.; Moilanen, P.; Avela, J.; Timonen, J. Effects of gait speed on stability of walking revealed by simulated response to tripping perturbation. Gait Posture 2014, 39, 534–539. [Google Scholar] [CrossRef]
  17. Jung, J.H.; Gutiérrez, I.; Veneman, J. The use of Centroidal momentum Analysis for defining a stability index for walking with an exoskeleton. In Proceedings of the TAR 2015: Technically Assisted Rehabilitation Conference, Berlin, Germany, 12–13 March 2015. [Google Scholar]
  18. van Ingen Schenau, G. Some fundamental aspects of the biomechanics of overground versus treadmill locomotion. Med. Sci. Sport. Exerc. 1980, 12, 257–261. [Google Scholar] [CrossRef]
  19. Stolze, H.; Kuhtz-Buschbeck, J.; Mondwurf, C.; Boczek-Funcke, A.; Jöhnk, K.; Deuschl, G.; Illert, M. Gait analysis during treadmill and overground locomotion in children and adults. Electroencephalogr. Clin. Neurophysiol. Electromyogr. Mot. Control 1997, 105, 490–497. [Google Scholar] [CrossRef]
  20. Riley, P.O.; Paolini, G.; Della Croce, U.; Paylo, K.W.; Kerrigan, D.C. A kinematic and kinetic comparison of overground and treadmill walking in healthy subjects. Gait Posture 2007, 26, 17–24. [Google Scholar] [CrossRef]
  21. Sessoms, P.H.; Wyatt, M.; Grabiner, M.; Collins, J.D.; Kingsbury, T.; Thesing, N.; Kaufman, K. Method for evoking a trip-like response using a treadmill-based perturbation during locomotion. J. Biomech. 2014, 47, 277–280. [Google Scholar] [CrossRef]
  22. Yoo, D.; Seo, K.H.; Lee, B.C. The effect of the most common gait perturbations on the compensatory limb’s ankle, knee, and hip moments during the first stepping response. Gait Posture 2019, 71, 98–104. [Google Scholar] [CrossRef] [PubMed]
  23. Fettrow, T.; Reimann, H.; Grenet, D.; Crenshaw, J.; Higginson, J.; Jeka, J. Walking cadence affects the recruitment of the medial-lateral balance mechanisms. Front. Sport. Act. Living 2019, 1, 40. [Google Scholar] [CrossRef] [Green Version]
  24. Troy, K.L.; Grabiner, M.D. The presence of an obstacle influences the stepping response during induced trips and surrogate tasks. Exp. Brain Res. 2005, 161, 343–350. [Google Scholar] [CrossRef] [PubMed]
  25. Van Dieen, J.H.; Pijnappels, M.; Bobbert, M. Age-related intrinsic limitations in preventing a trip and regaining balance after a trip. Saf. Sci. 2005, 43, 437–453. [Google Scholar] [CrossRef]
  26. Loan, P.; Delp, S.; Smith, K.; Blaikie, K. Software for Interactive Musculoskeletal Modeling User Guide 6.0; MusculoGraphics, Inc.: Evanston, IL, USA, 2011. [Google Scholar]
  27. Winter, D.A. Biomechanics and Motor Control of Human Movement; John Wiley & Sons: Hoboken, NJ, USA, 2009. [Google Scholar]
  28. Hof, A.; Gazendam, M.; Sinke, W. The condition for dynamic stability. J. Biomech. 2005, 38, 1–8. [Google Scholar] [CrossRef]
  29. Young, P.M.M.; Wilken, J.M.; Dingwell, J.B. Dynamic margins of stability during human walking in destabilizing environments. J. Biomech. 2012, 45, 1053–1059. [Google Scholar] [CrossRef] [Green Version]
  30. Wold, S.; Esbensen, K.; Geladi, P. Principal component analysis. Chemom. Intell. Lab. Syst. 1987, 2, 37–52. [Google Scholar] [CrossRef]
  31. Fay, M.P.; Proschan, M.A. Wilcoxon-Mann-Whitney or t-test? On assumptions for hypothesis tests and multiple interpretations of decision rules. Stat. Surv. 2010, 4, 1. [Google Scholar] [CrossRef]
  32. Neumann, D.A. Kinesiology of the Musculoskeletal System: Foundation for Rehabilitation; Elsevier: Mosby, MI, USA, 2010. [Google Scholar]
  33. Öberg, T.; Karsznia, A.; Öberg, K. Basic gait parameters: Reference data for normal subjects, 10–79 years of age. J. Rehabil. Res. Dev. 1993, 30, 210–223. [Google Scholar] [PubMed]
  34. Hak, L.; Houdijk, H.; Beek, P.J.; van Dieën, J.H. Steps to take to enhance gait stability: The effect of stride frequency, stride length, and walking speed on local dynamic stability and margins of stability. PLoS ONE 2013, 8, e82842. [Google Scholar] [CrossRef] [PubMed] [Green Version]
  35. Kong, P.W.; Koh, T.M.; Tan, W.C.; Wang, Y.S. Unmatched perception of speed when running overground and on a treadmill. Gait Posture 2012, 36, 46–48. [Google Scholar] [CrossRef] [PubMed]
  36. Akiyama, Y.; Toda, H.; Ogura, T.; Okamoto, S.; Yamada, Y. Classification and analysis of the natural corner curving motion of humans based on gait motion. Gait Posture 2018, 60, 15–21. [Google Scholar] [CrossRef] [PubMed]
Figure 1. Experimental devices: (a) Schematic of tripping treadmill configuration. (b) Force plate attached under the sole. (c) Locations of 22 motion capture markers.
Applsci 11 07908 g001
Figure 2. Tripping on the treadmill. The subject wore light-colored clothes and the left bar was not covered by black tape for better visibility: (a) Before tripping (b). Tripped timing (left foot). (c) First recovery step. (d) Second recovery step.
Applsci 11 07908 g002
Figure 3. Definition of parameters: (a) Joint angles. (b) Kinematic parameters.
Applsci 11 07908 g003
Figure 4. Stick picture of recovery steps. The horizontal position was adjusted considering the velocity of treadmill belt.
Applsci 11 07908 g004
Figure 5. Factor loading. Factor loading vectors of tripping recovery steps at both gait speeds weighted by the contribution of each principal component.
Applsci 11 07908 g005
Figure 6. Distribution of the principal component analysis scores of each subject. Markers of the same shape denote a single subject. Colors stand for the slow (blue-filled) and fast (red hollow) speeds.
Applsci 11 07908 g006
Table 1. Definitions of the recovery motion parameters.
ParameterDefinition
S t l e n g t h Distance covered by each step (heel–heel) normalized by the subject’s height
S t t i m e Time duration of each step
K a n g Maximum knee flexion angle during each phase
H a n g Maximum hip flexion angle during each phase
C o M V t
C o M V v
Center of Mass (CoM) speed at the FS and SS
in the traveling (Vt) and vertical (Vv) directions
M o S t Margin of stability (MoS) at FS and SS in the traveling direction normalized by the subject’s height
G R F t Maximum deceleration force in the traveling direction exerted on the stepping foot after the FS and SS normalized to the subject’s weight
G R F v Maximum GRF of the stance leg in the vertical direction during each recovery phase normalized to the subject’s weight
Table 2. Recovery motion parameters between different gait speeds, mean (SD).
ParameterUnitp-Value (* p < 0.05)Hedgis-gSlow (3.5 km/h) n = 60Fast (4.0 km/h) n = 69
F S S t l e n g t h 0.220.220.44 (±0.08)0.42 (±0.08)
F S S t t i m e s* 0.020.420.55 (±0.06)0.53 (±0.05)
F S K a n g deg0.450.1399.7 (±9.2)100.9 (±8.1)
F S H a n g deg0.560.1038.3 (±6.6)39.0 (±7.5)
F S C o M V t m/s0.300.181.26 (±0.10)1.28 (±0.11)
F S C o M V v m/s0.150.25−0.29 (± 0.16)−0.34 (±0.20)
F S M o S t * 0.010.49−0.06 (±0.07)−0.09 (±0.07)
F S G R F t 0.520.110.25 (±0.11)0.25 (±0.09)
F S G R F v * 0.000.511.11 (±0.13)1.19 (±0.17)
S S S t l e n g t h 0.960.010.41 (±0.04)0.41 (±0.05)
S S S t t i m e s* 0.010.480.54 (±0.05)0.52 (±0.05)
S S K a n g deg0.160.2569.7 (±4.3)71.1 (±6.6)
S S H a n g deg0.760.0528.8 (±5.4)29.1 (±6.1)
S S C o M V t m/s0.150.261.24 (±0.08)1.26 (±0.09)
S S C o M V v m/s* 0.010.46−0.14 (±0.05)−0.18 (±0.08)
S S M o S t 0.100.29−0.02 (±0.07)−0.04 (±0.07)
S S G R F v 0.080.320.23 (±0.06)0.25 (±0.07)
S S G R F d 0.100.291.37 (±0.35)1.47 (±0.32)
FS = first recovery step, SS = second recovery step.
Table 3. Correlations between recovery motion parameters.
FS SttimeFS KangFS HangFS CoMVtFS CoMVvFS MoStFS GRFtFS GRFvSS StlengthSS SttimeSS KangSS HangSS CoMVtSS CoMVvSS MoStSS GRFtSS GRFv
FS Stlength0.340.230.250.87−0.670.110.710.000.080.040.23−0.10−0.16−0.190.380.000.55
FS Sttime 0.500.030.36−0.23−0.010.310.020.00−0.070.17−0.07−0.05−0.180.07−0.010.24
FS Kang 0.370.20−0.160.010.270.10−0.19−0.310.160.17−0.15−0.100.120.090.31
FS Hang 0.19−0.02−0.170.210.090.07−0.100.350.710.08−0.20−0.040.250.13
FS CoMVt −0.66−0.050.620.040.22−0.060.36−0.150.02−0.340.280.060.45
FS CoMVv 0.10−0.61−0.190.070.21−0.260.230.130.40−0.160.12−0.71
FS MoSt −0.09−0.14−0.280.15−0.19−0.24−0.400.210.85−0.07−0.14
FS GRFt 0.190.000.020.330.01−0.03−0.110.070.050.70
FS GRFv −0.15−0.070.210.13−0.08−0.26−0.170.220.34
SS Stlength 0.330.220.090.83−0.31−0.060.51−0.07
SS Sttime −0.01−0.160.120.19−0.11−0.04−0.23
SS Kang 0.420.23−0.41−0.050.250.30
SS Hang 0.17−0.03−0.160.23−0.02
SS CoMVt −0.39−0.260.52−0.06
SS CoMVv 0.01−0.56−0.32
SS MoSt 0.100.09
SS GRFv 0.19
Publisher’s Note: MDPI stays neutral with regard to jurisdictional claims in published maps and institutional affiliations.

