3.1. Onset of SDC
As SPR imaging is a powerful technique for the detection of thin films, we designed our experiment to understand whether a thin film can be detected at the onset of dropwise condensation.
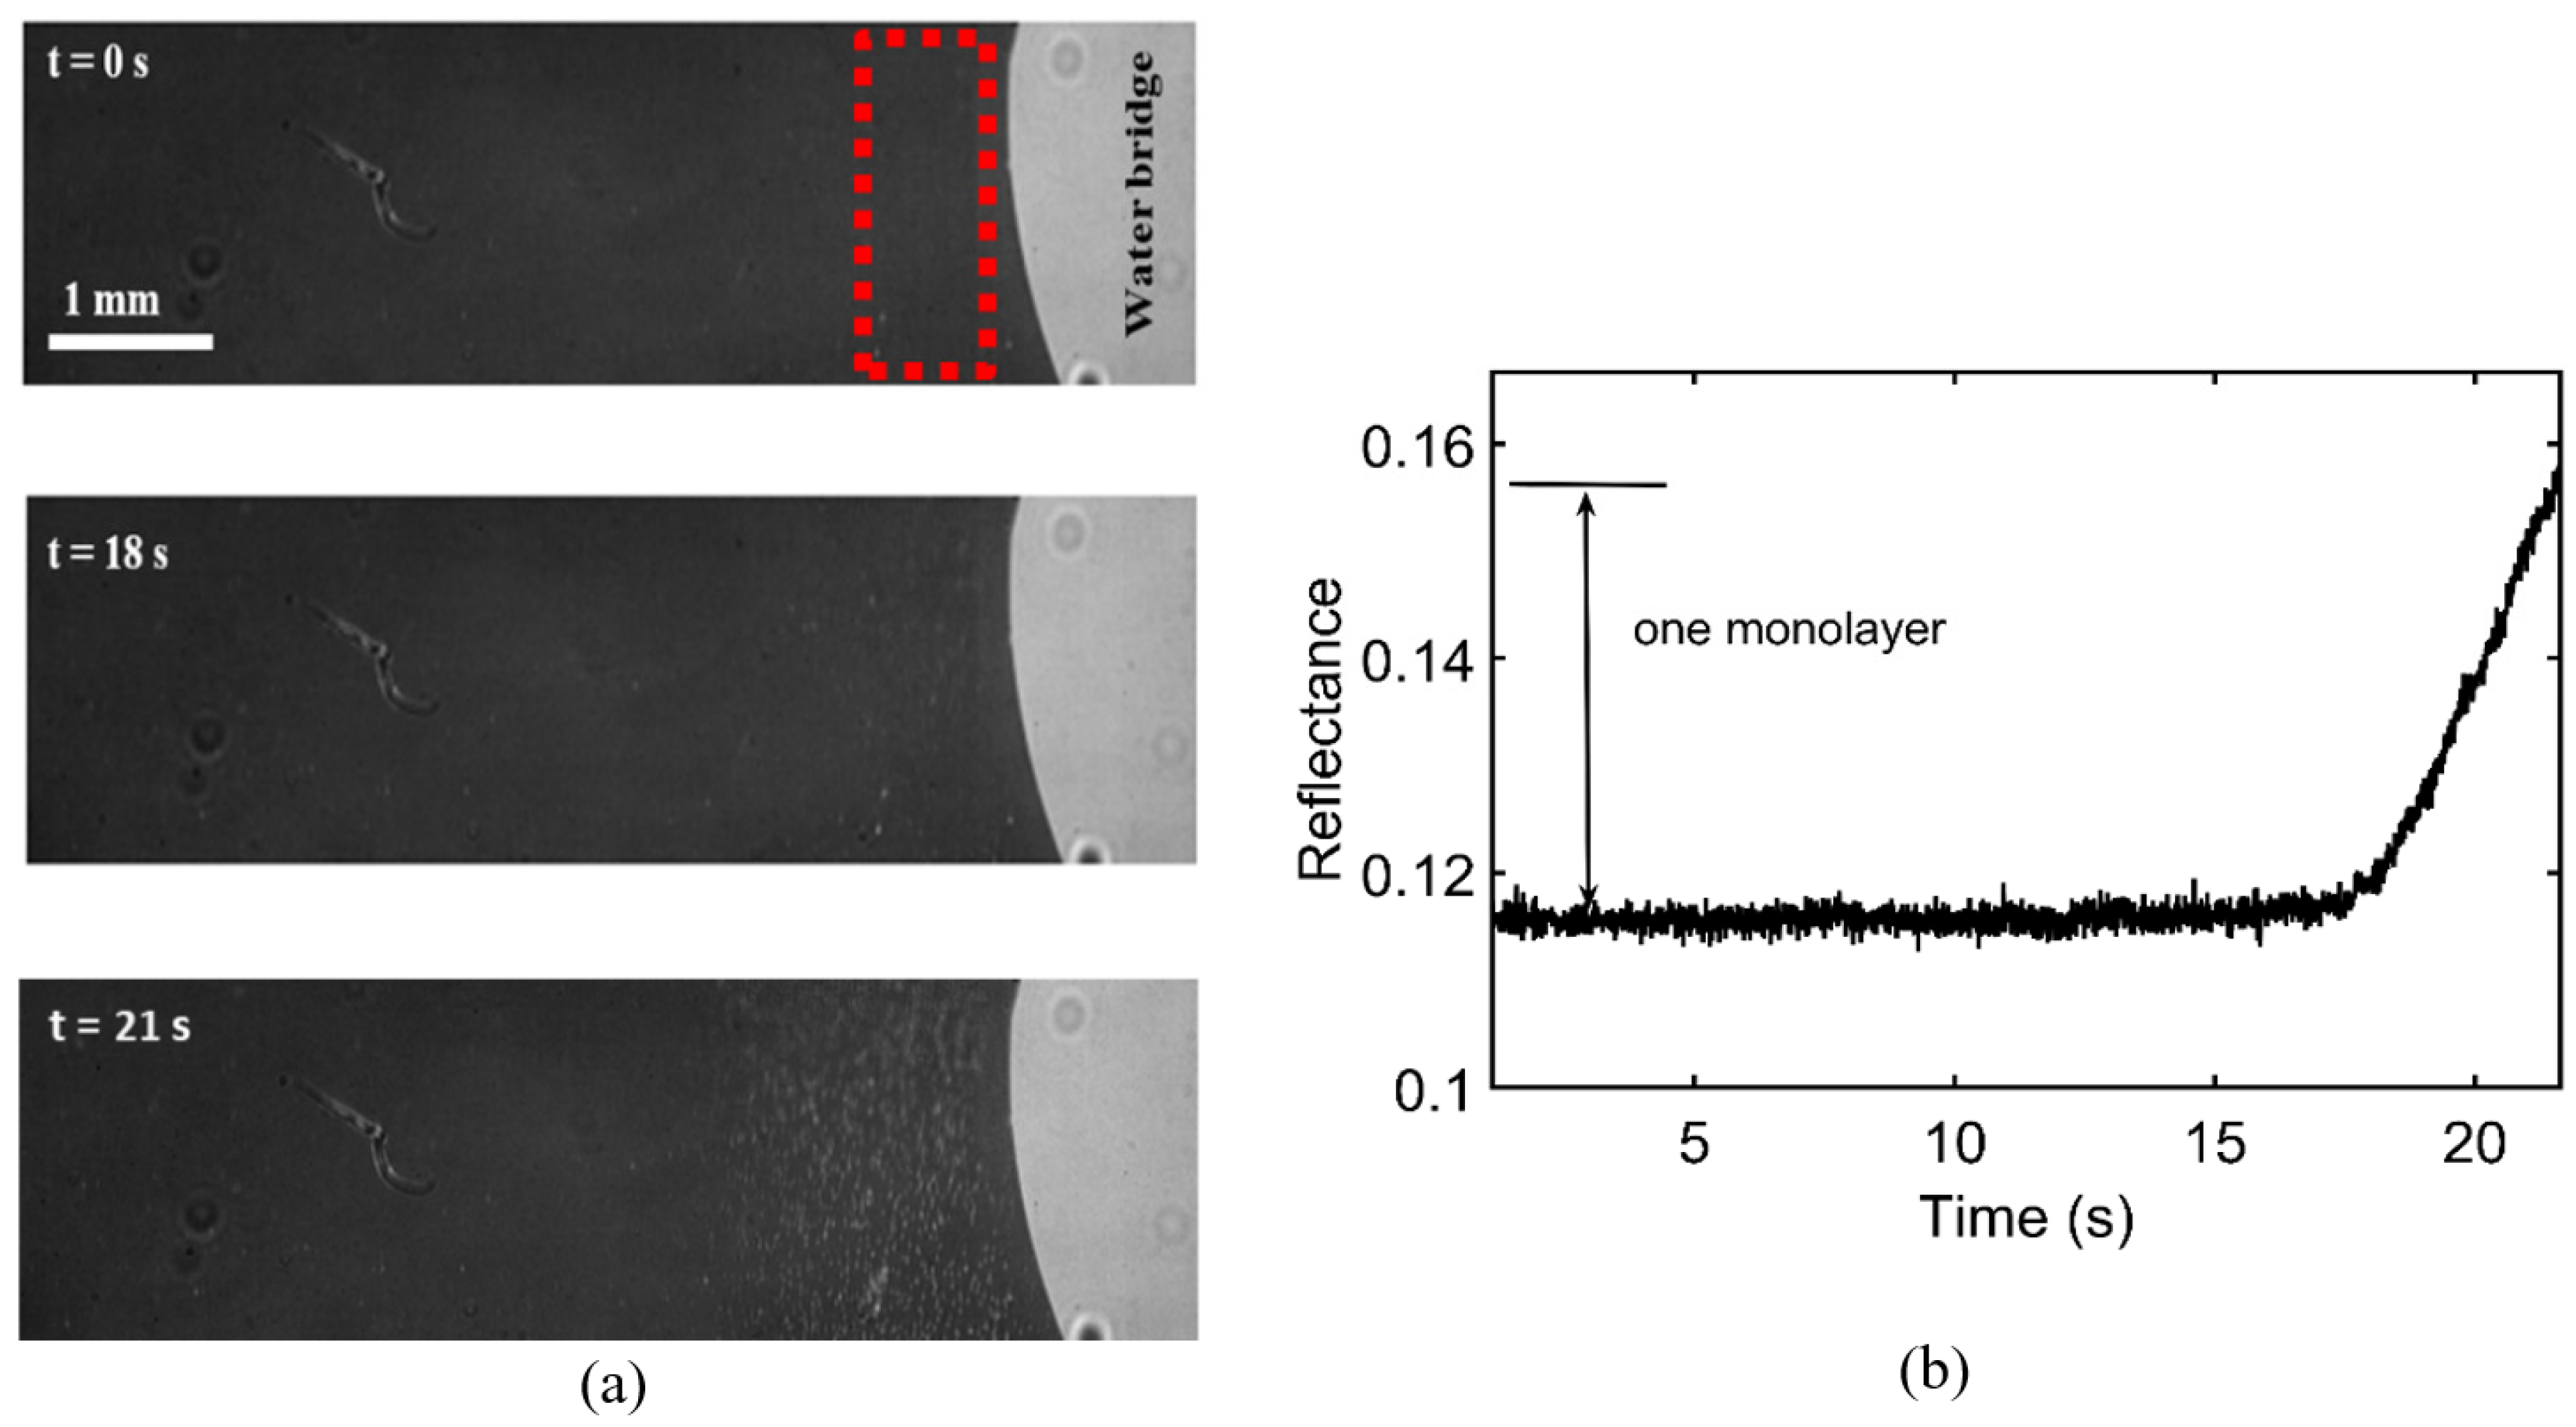
Figure 3a shows the SPRi (at 680 nm) results of SDC at the onset of condensation. Online Resource 1 shows the corresponding video of SDC at 680 nm. The light gray and dark gray represent water and gold surfaces, respectively. As
Figure 3a shows at t = 18 s, the first condensates emerge in the vicinity of the water bridge. The reflectance variation is measured by tracking the averaged reflectance of pixels in the red dotted box over time; the measurement area is chosen in the vicinity of the water bridge, as the initial droplets emerge on the part of the surface closer to the water bridge. As mentioned, the formation of a water film with the thickness of a molecule layer corresponds to a 4% change in the measured reflectance. However, this result indicates that the reflectance variations before the emergence of the first droplets are infinitesimal (see
Figure 3b). This means no film, even one as small as a molecule-thick layer, forms on the surface prior to the emergence of droplets at the onset of SDC, i.e., the initial droplets form by heterogeneous nucleation on the surface. In our other work [
14], we showed that the area between droplets is covered with a monolayer film during SDC. Our results confirm the finding of Umur and Griffith [
6] in support of nucleation theory as the mechanism of dropwise condensation.
In a different set of experiments, the water bridge on the surface was slightly relocated on the surface by moving the ITO coated glass that is on the top of the water bridge (see
Figure 1a). After ~16 s, SDC was started by heating the water bridge using ITO-coated glass.
Figure 4 shows selected time-lapse images of this experiment recorded using SPRi at 550 nm. The relocation of a water bridge on the surface left behind an area with a lower reflectance, compared to the rest of the surface. The white-dashed line shows the boundary of the area that was previously covered by the water bridge. The area on the right side of the dashed line can be identified with its darker gray color from the rest of the surface. Locations 1 and 2 are sample areas that are chosen from these two distinct parts of the surface for image processing purposes. Our analysis shows that the reflectance of location 2 is 1% higher than the reflectance of location 1, i.e., for ambient conditions, the gold surface is found to be covered with a molecule-thick layer of adsorbed water. The presence of adsorbed water film on the metal surface has been reported in the literature [
18,
19].
Figure 4f shows the temporal changes of reflectance at locations 1 and 2. It can be observed the reflectance at location 1 increases when the relative humidity increases (from 35% to 60%) on the surface due to dropwise condensation. The increase in the reflectance of location 1 indicates that water molecules are adsorbing on the surface. It is worth noting that the adsorbed molecules on the surface mostly consist of water molecules and not volatile organic compounds (VOCs). In our previous work [
15], we showed that the rate of adsorption of VOCs on the gold surface is much slower than the rate of adsorption of the molecularly adsorbed water layer on the surface.
3.2. Visualization of USDC
Song et al. [
12] did not use any drainage mechanism on their condensing surface. Similarly, we have not considered any drainage mechanism on the gold surface in our study. Therefore, it is intuitive to expect the dropwise condensation to degrade over time in our experiments. We break down the USDC into three stages: (i) onset of condensation, (ii) growth of the multilayer film up to 8 nm, and (iii) thin-film growth more than 8 nm. These stages are separated by the presence and/or size of the thin film between droplets. Note that these stages are defined for the sake of our analysis’ convenience because 8 nm is the maximum thickness that is measurable in our SPR imaging.
Figure 5 illustrates the recorded images at the first stage, onset of condensation from the USDC experiments. The corresponding video of the onset of USDC is available as Online Resource 2. When steam is introduced to the surface, the vapor molecules in the ambient air strike the surface and form a film-like layer on the surface (see
Figure 5a,b). This layer propagates from the inlet of steam, i.e., in the example case of
Figure 5 from the right side to the left side of the image. Then, the reflectance of this film-like layer increases (up to the reflectance of a droplet, which is 0.5941 and 0.8710 for SPRi at 550 nm and 680 nm, respectively, see
Figure 5c). Eventually, distinct droplets emerge on the surface (see
Figure 5d). It can be seen in the example case of
Figure 5a that some droplets also emerge randomly on the surface. The visualization results may make it look like a thin film forms on the surface and that eventually this film ruptures. However, due to low lateral resolution (the lateral resolution is 4 µm and 10 µm for SPRi at 550 nm and 680 nm wavelengths, respectively) of the experiments, the visualization can be misleading. In other words, as the size of each pixel is bigger than the size of initial droplets that form on the surface, the colonies of sub-micron size droplets at the onset of condensation can also create an image similar to a thin film. Therefore, the current visualizations cannot provide sufficient evidence regarding the mechanism of droplet formation at the onset of USDC. In a future study, we will equip the SPRi with a high-aperture objective lens to study the onset of dropwise condensation of steam in more detail.
After Stage I, droplets grow and coalesce to become larger droplets. As no drainage mechanism was designed on the condensing surface, it is intuitive to expect that the long-term dropwise condensation of steam is not sustainable on the gold surface. At stage II of USDC, the results show the reflectance of the area between droplets increases. This increase in the reflectance indicates the formation of a multilayer water molecule film between droplets.
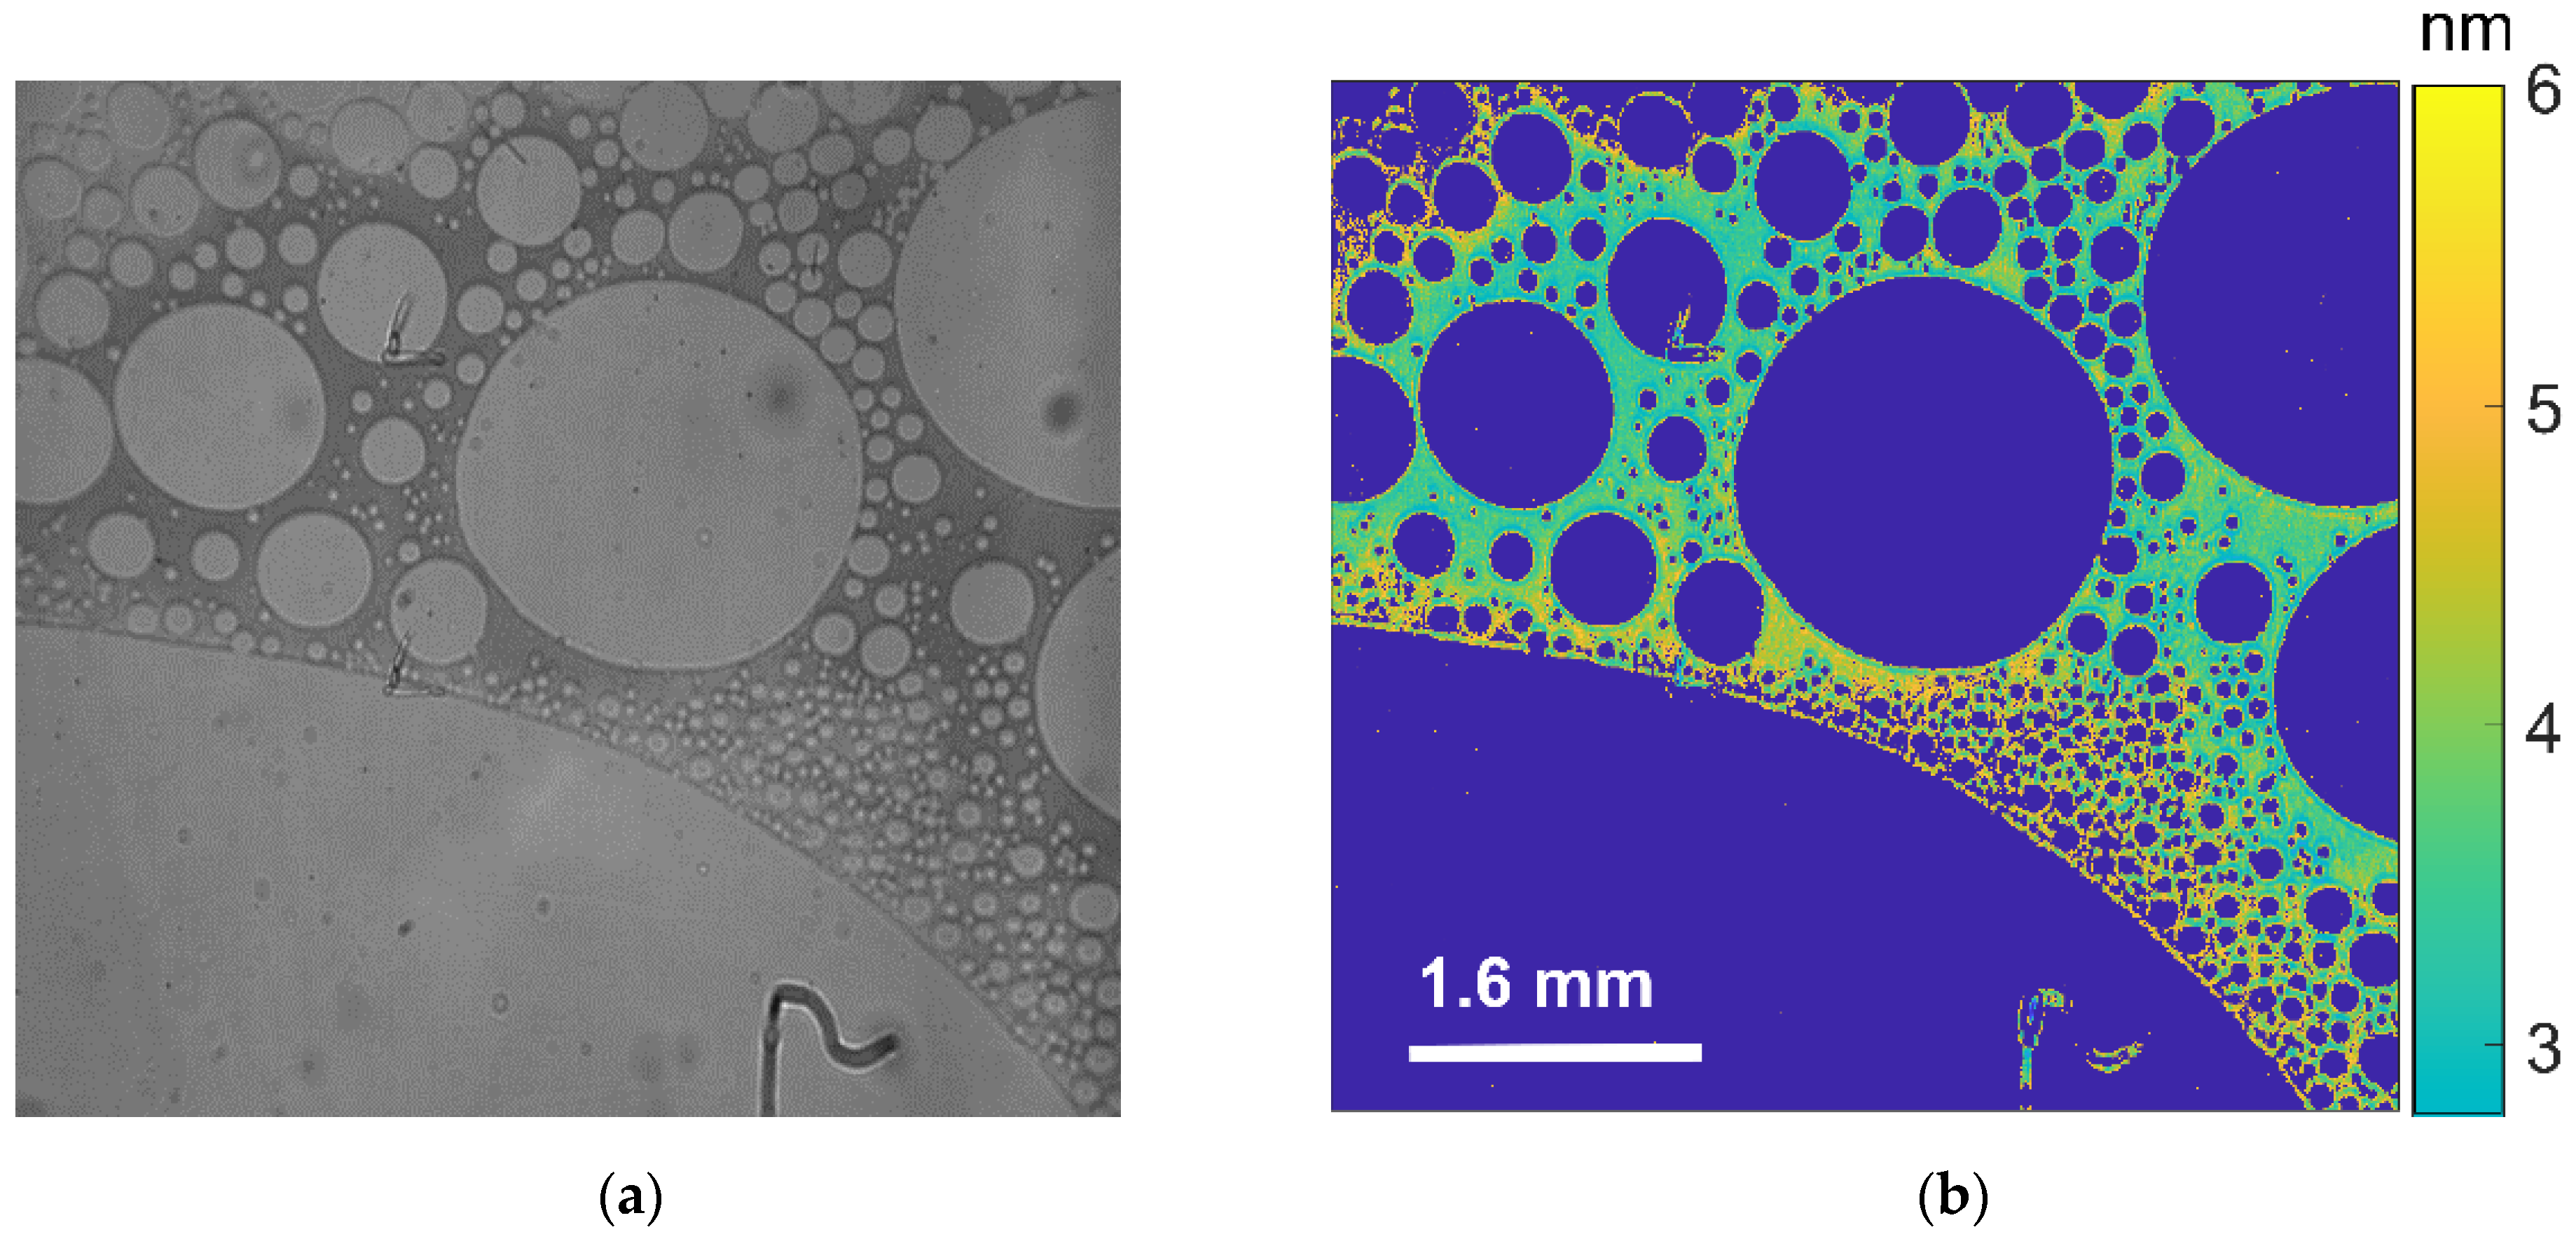
Figure 6a,b show a raw image and the corresponding processed image from Stage II of USDC, respectively. The dark blue in
Figure 6b represents that water droplets and thickness of thin-films between droplets varies between 3–6 nm. As the USDC continues, the thickness of thin films between droplets increases. As our study of the mechanism of dropwise condensation of steam is at its early stages, we have not conducted any quantitative analysis on the effect of thin films between droplets on the heat transfer rates. In our future work, we will include the measurement of heat transfer on the surface for USDC.
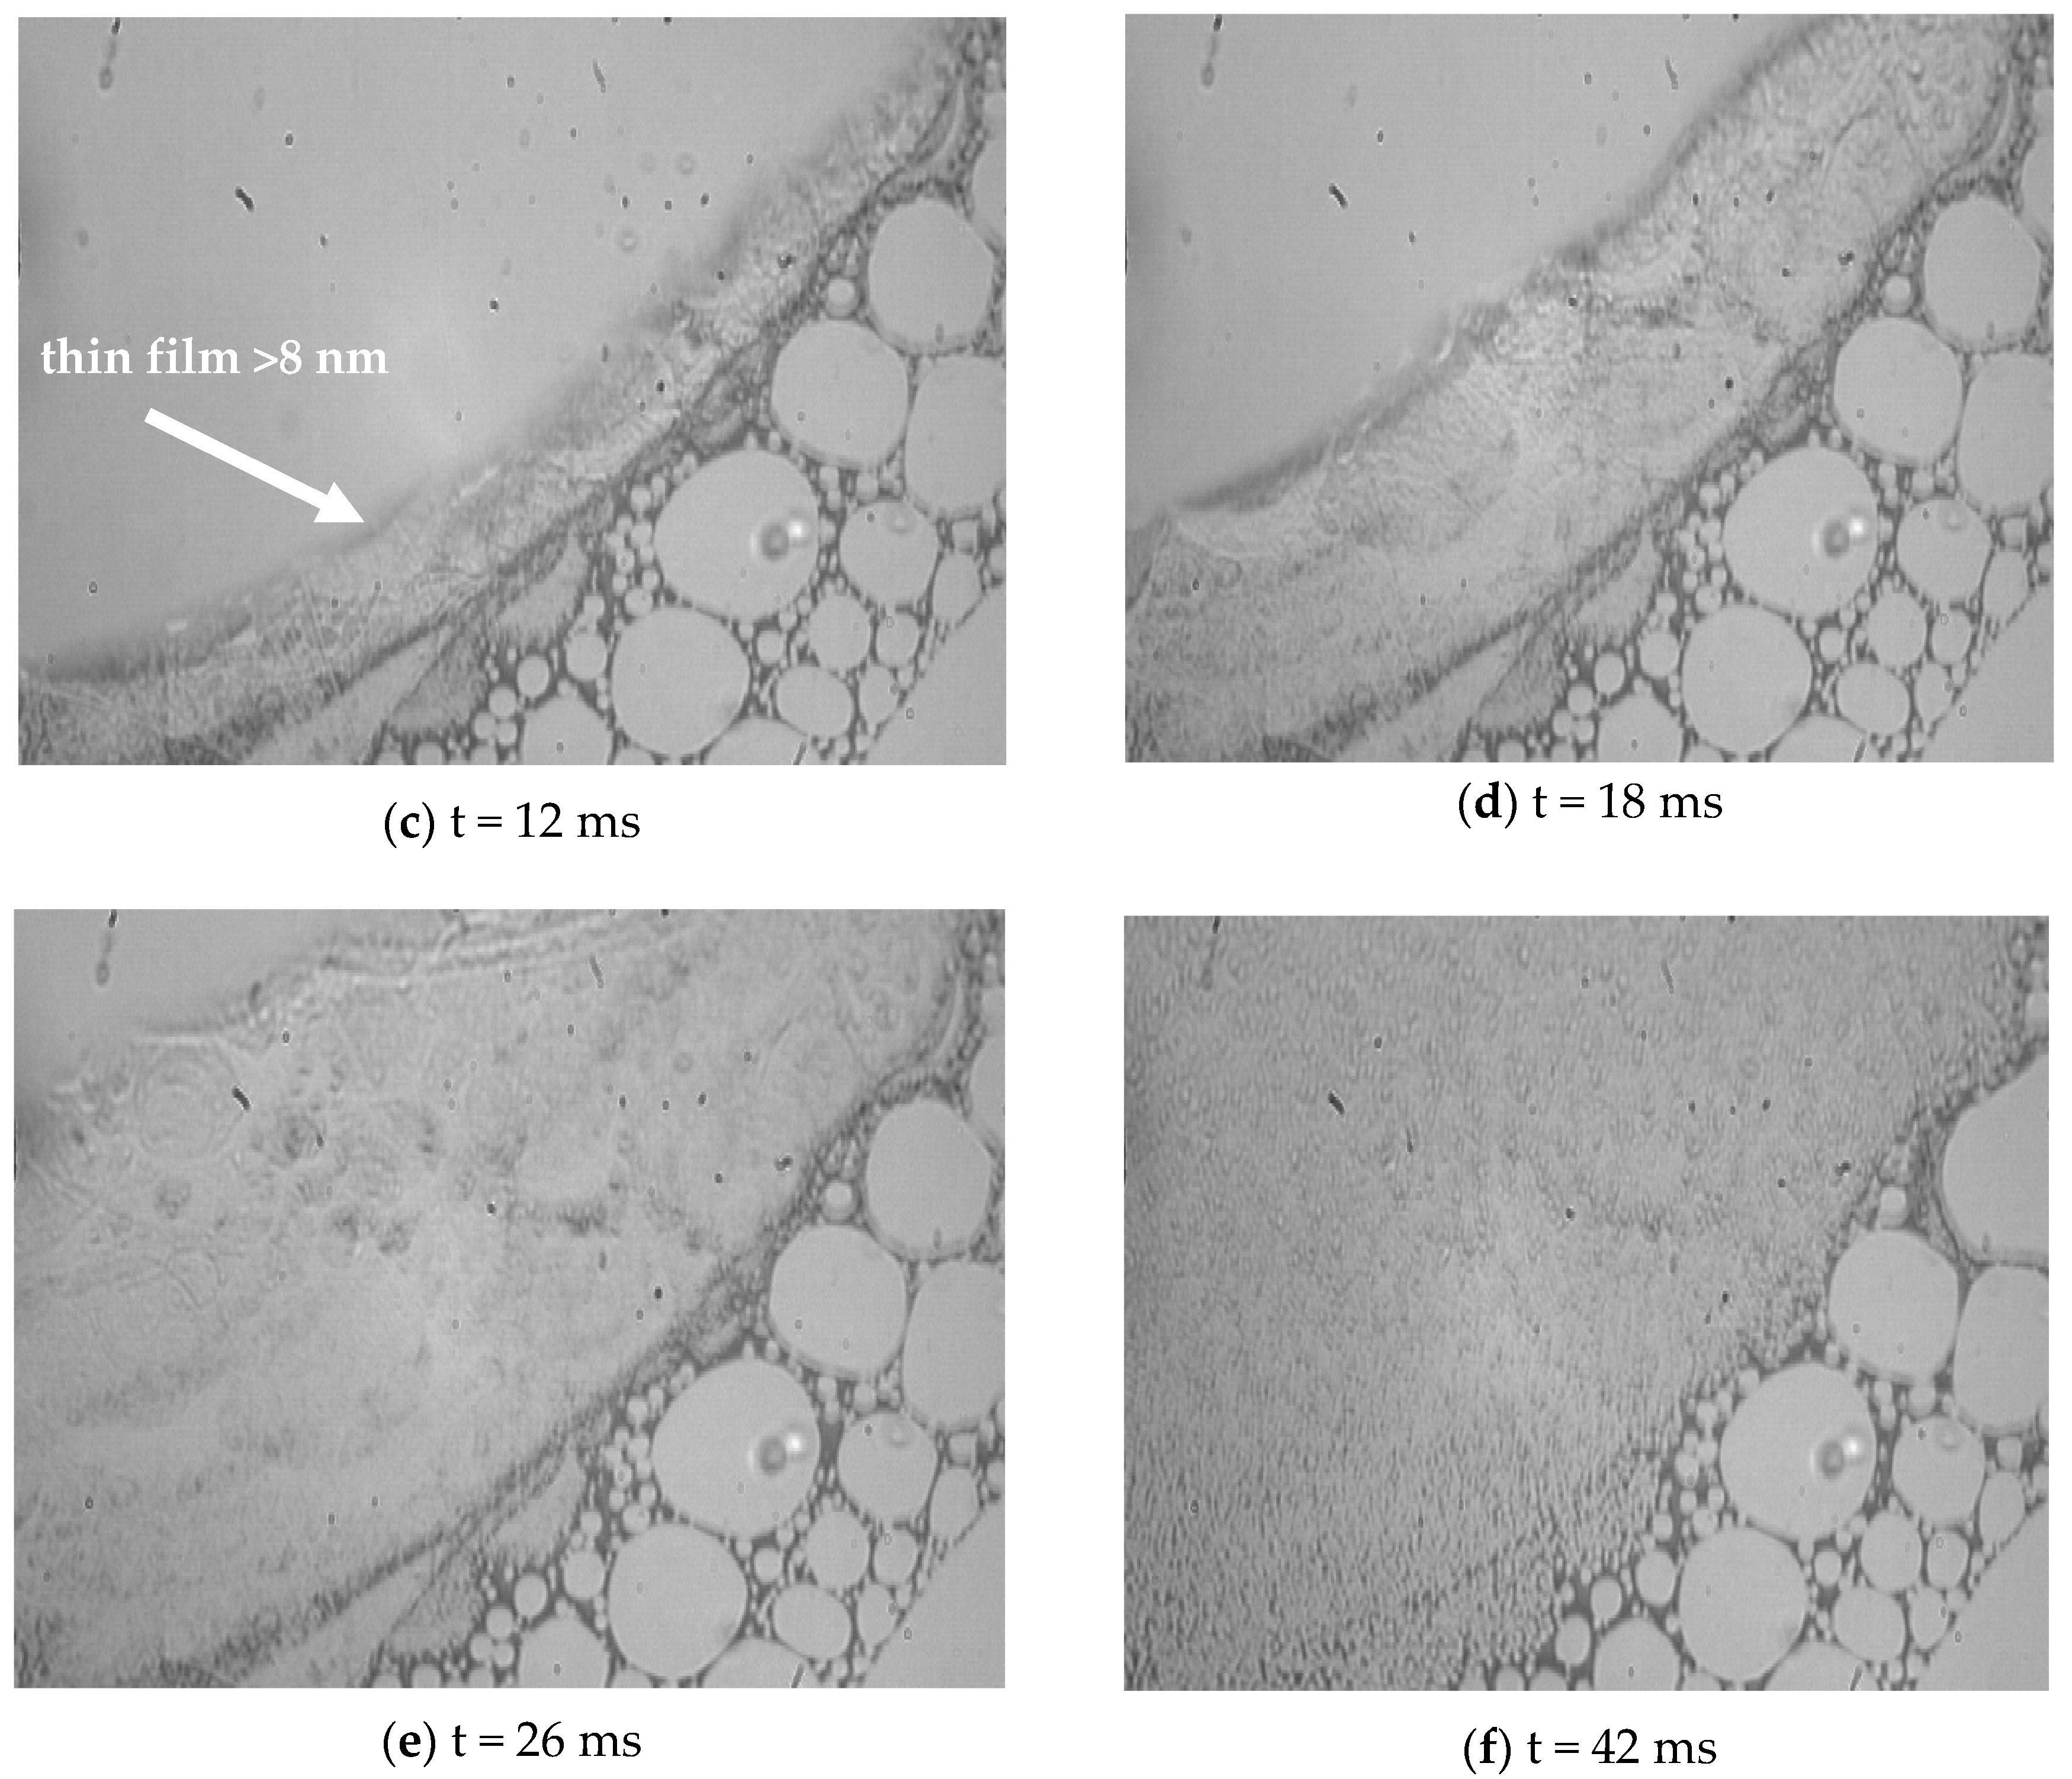
Stage III of USDC is the growth of the thin film between droplets beyond the detection range (>8 nm) of the current SPRi system.
Figure 7a depicts the correlation between the reflectance and the thickness of water film for SPRi with intensity modulation (IM, experimental angle of 43.15 degrees) at a 680 nm wavelength. As this figure shows, the reflectance associated with just air (no film on the surface) is 0 and the reflectance associated with a liquid droplet on the surface is 0.87. The reflectance values of 0 and 0.87 are practically the minimum and maximum reflectance that we can measure using our current SPRi system. In terms of thin film measurements, the water film with a thickness of 8 nm produces a signal that is equivalent to the reflectance of a water droplet, i.e., reflectance of 0.87. Therefore, the range in which we can measure a thin film is 0 to 8 nm. If the thickness of the thin film goes beyond 8 nm, it shows itself in our image with a reflectance higher than a water droplet, i.e., the color of a thin-film larger than 8 nm is slightly brighter than the water droplets in the recorded images. As noted, it is not possible to accurately measure film larger than 8 nm with the current SPRi setup. In this case, we can only comment as to whether a film with a thickness larger than 8 nm exists on the surface. The thickness of this film could be anywhere from 8 to 250 nm.
Figure 7b,c show the raw and corresponding processed images from Stage III of USDC, respectively. In the raw image, the area between the droplets has a brighter color, as compared to the color of the droplets. In the processed image, droplets are represented in dark blue, areas with a thickness larger than 8 nm are identified in yellow color, and areas with a thickness less than 8 nm are shown in a bright blue color. Online Resource 3 is the video from Stage III of USDC.
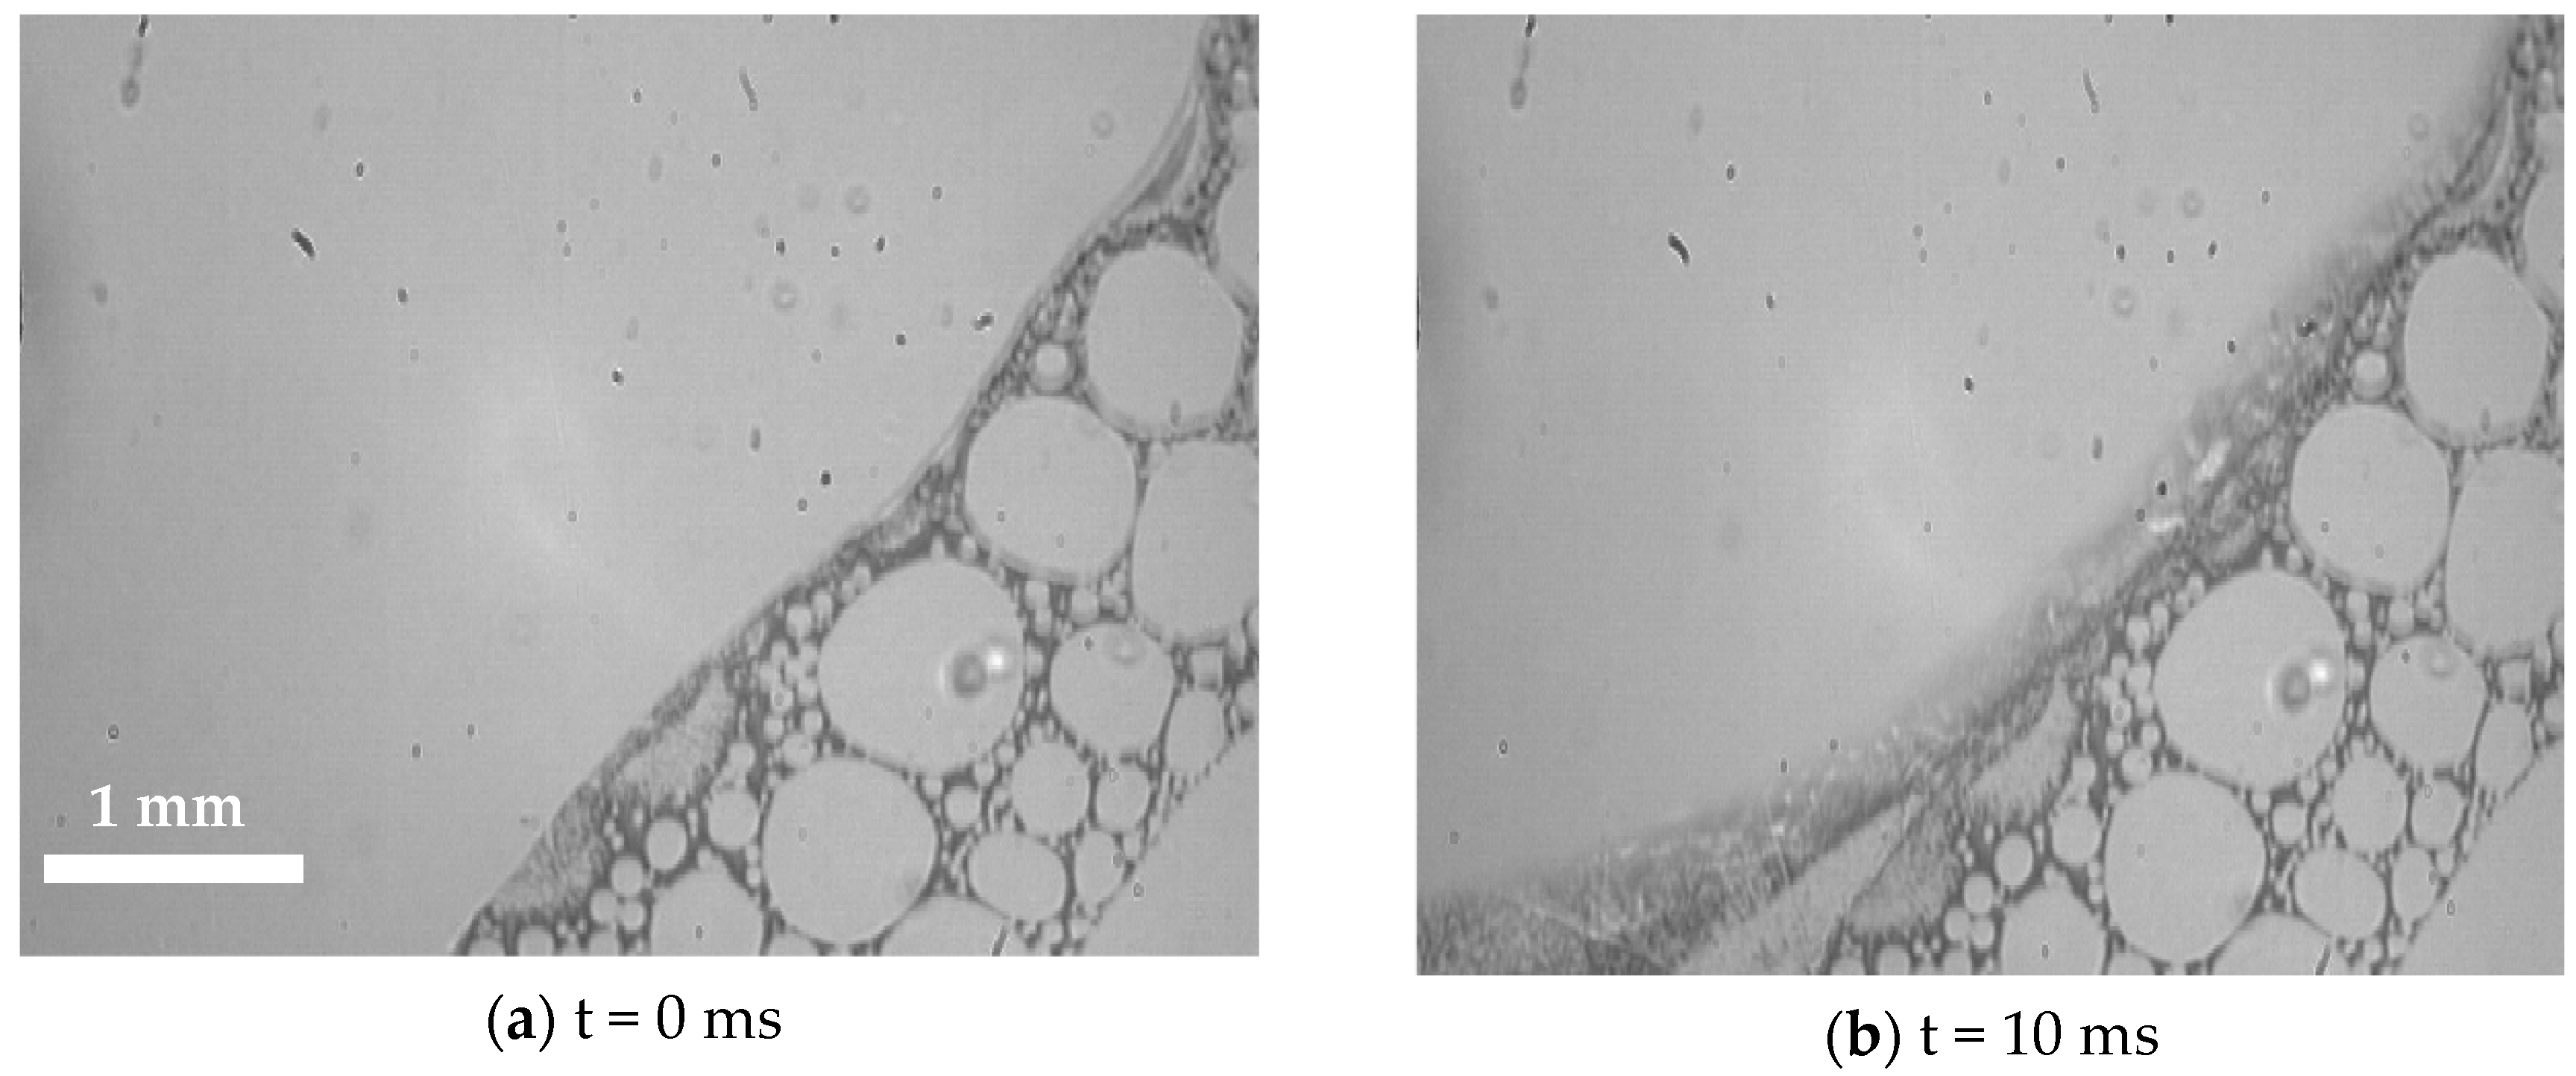
Figure 8 shows time-lapse images of coalescence during Stage III of USDC. It can be observed that after the coalescence, the swept area on the surface is not dry. In the example case shown in
Figure 8, the thickness of the swept area just after the coalescence increases beyond 8 nm, i.e., the reflectance of this area is higher than 0.87, the reflectance of a droplet (and 8 nm thick film). Then, reflectance drops to a value lower than the reflectance of a droplet, i.e., the thickness of film becomes smaller than 8 nm. This fluctuation in film thickness may be an indicator of the thin film instability or lateral transition of water molecules in the thin film.
Figure 8d shows the new droplets emerging on the surface after 42 ms from the start of coalescence. Online Resource 4 provides the video of the droplet coalescence illustrated in
Figure 8. Our USDC results confirm the findings of Song et al. [
12] regarding the presence of a thin-film larger than a monolayer between droplets.


